 Youyou Wang
 Yue Zhang1,2†
 Yuwei Yuan
 Tiegui Nan
 Luqi Huang
 Jian Yang
95% of researchers rate our articles as excellent or good
Learn more about the work of our research integrity team to safeguard the quality of each article we publish.
Find out more
ORIGINAL RESEARCH article
Front. Nutr. , 17 October 2022
Sec. Nutrition and Food Science Technology
Volume 9 - 2022 | https://doi.org/10.3389/fnut.2022.980095
This article is part of the Research Topic Innovative Food Analysis View all 5 articles
The geographical origin and the important nutrient contents greatly affect the quality of red raspberry (RRB, Rubus idaeus L.), a popular fruit with various health benefits. In this study, a chemometrics-assisted hyperspectral imaging (HSI) method was developed for predicting the nutrient contents, including pectin polysaccharides (PPS), reducing sugars (RS), total flavonoids (TF) and total phenolics (TP), and identifying the geographical origin of RRB fruits. The results showed that these nutrient contents in RRB fruits had significant differences between regions (P < 0.05) and could be well predicted based on the HSI full or effective wavelengths selected through competitive adaptive reweighted sampling (CARS) and variable iterative space shrinkage approach (VISSA). The best prediction results of PPS, RS, TF, and TP contents were achieved with the highest residual predictive deviation (RPD) values of 3.66, 3.95, 2.85, and 4.85, respectively. The RRB fruits from multi-regions in China were effectively distinguished by using the first derivative-partial least squares discriminant analysis (DER-PLSDA) model, with an accuracy of above 97%. Meanwhile, the fruits from three protected geographical indication (PGI) regions were successfully classified by using the orthogonal partial least squares discrimination analysis (OPLSDA) model, with an accuracy of above 98%. The study results indicate that HSI assisted with chemometrics is a promising method for predicting the important nutrient contents and identifying the geographical origin of red raspberry fruits.
Red raspberry (RRB, Rubus idaeus L.), a woody plant of the genus Rubus in the family Rosaceae, has recently become a popular fruit in the market. Because of their sweet taste and unique flavor, RRB fruits are often processed into canned food, jam, jelly, juice, fruit wine, etc. (1). The pleasant flavor and taste in fruits are mainly affected by the contents of reducing sugars (RS), including fructose, sucrose, glucose, etc. (2, 3). RRB fruits are rich in healthy nutrients, including pectin polysaccharides (PPS) (4), total flavonoids (TF) (5), and total phenolics (TP) (2). Also, RRB fruits have many health-promoting benefits, such as antioxidant, anti-inflammatory (6), and anti-cancer effects (2, 7).
Accurate and efficient evaluation of the nutrient contents (RS, PPS, TF, and TP) is of great significance for symbolizing the edible and nutraceutical quality of fruits. However, all these indicators are usually evaluated with some destructive, time-consuming, and costly chemical methods, including high-performance liquid chromatography (HPLC) and mass spectrometry (MS) (5, 8).
In recent years, RRB fruits are popular in some East Asian countries, such as China, Japan, and South Korea (7, 9). In China, Dexing County of Jiangxi Province (JXDX), Chun’an County (ZJCA), and Lishui City (ZJLS) of Zhejiang Province have long planting histories. Attributed to abundant rainfall and sufficient illumination, these areas become famous for the high quality of RRB fruits. Dexing raspberry, Chun’an raspberry, and Lishui raspberry have won the protected geographical indications (PGI), and the protected areas reached 10,000 hm2 in 2019, yielding about 7,500 tons of dry products for output (10, 11). In legislation, the PGI can identify products from protected regions and ensure a high-quality reputation in the market.
However, many illegal cases such as geographical origin and brand counterfeiting for higher profits occur frequently in the RRB market. Unfortunately, the conventional and destructive methods for RRB fruit origin identification, including DNA bar code and element and chemical fingerprints, suffer from a long pretreatment cycle and high cost (8, 12).
Considering the above problems, it is urgent to develop non-destructive, inexpensive, and time-saving methods for predicting the nutrient contents and geographical origin of RRB fruits, thus ensuring fruit quality. As a non-destructive and rapid detection method, hyperspectral imaging (HSI) technology can provide the spectral reflectance of any pixel at hundreds of wavebands. It can assess many samples at one time without any pre-treatment and has been widely used in fruit quality evaluation (13–15).
By combining HSI with chemometrics, researchers have efficiently predicted the RS content in fruits of blueberries (15) and pomelo (16), as well as the PPS content in mulberry fruit and orange peels (17, 18). Meanwhile, the total flavonoids (TF) and total phenolics (TP) contents in black goji berries and grape fruits were successfully estimated, indicating the great potential in nutrient content prediction based on full/selected HSI wavelengths (15, 19). Moreover, in geographical origin traceability using HSI full/selected wavelengths combined with chemometric models, narrow-leaved oleaster (Elaeagnus angustifolia) fruits (13), Chinese wolfberries (20), and banana (Musa spp.) fruits (21) were identified with high prediction accuracies. However, to the best of our knowledge, there have been no reports of its application to RRB fruits.
This study aimed to investigate the feasibility of detecting the nutrient content and identifying the geographical origin of RRB fruits using HSI combined with chemometrics. The specific objectives were: (a) To determine the nutrient content differences in RS, PPS, TF, and TP of RRB fruits from multiple production regions; (b) To evaluate the performance of predicting nutrient contents based on full/selected HSI wavelengths, and (c) To reveal the authenticity of origins, especially PGI status, of RRB fruits by using HSI technology combined with chemometrics.
RRB fruits were collected from nine provinces in August 2020, covering all ten main production regions in China (Supplementary Table 1). In this study, 30 healthy mature fruits (about 50 g) with uniform size and color were treated as one subsample (30 fruits) for HSI data collection. In each production region, 10 sampling plots were set and 5 replicates of subsamples were collected from each plot. So that each production region has 50 (10 plots × 5 replicates) subsamples to obtain locally representative parallel HSI data. All the harvested subsamples were immediately stored in ice chilled chest coolers at 4°C and transported as fresh food to the laboratory by aircraft at 4°C. The samples were analyzed for completion of HSI spectra collection within 48 h to minimize the impact from the different periods for transporting (22). After HSI analysis, fruits in each of the 500 subsamples (50 subsamples × 10 regions) from 10 main production regions were immediately homogenized into fruit pulp by a homogenizer (PB206A, Midea, Guangzhou, China). The obtained fruit pulp from each subsample was further treated for nutrient contents measurement through conventional chemical methods with a spectrometer, so as to build a reference database for evaluation of the HSI prediction effect (23).
A visible and short-wave/long-wave near-infrared hyperspectral imaging spectrometer (VIS-NIR-HSI, HySpex VNIR-1800/HySpex SWIR 384, Norsk Elektro Optikk, Oslo, Norway) was employed to obtain spectral information for prediction analysis. The HSI is comprised of two tungsten halogen lamps (150 W/12 V, H-LAM Norsk Elektro Optikk, Oslo, Norway), and VNIR (350–990 nm, H-V16, Norsk Elektro Optikk, Oslo, Norway) and SWIR (900–2,550 nm, H-S16, Norsk Elektro Optikk, Oslo, Norway) lenses with a spectral resolution of about 5 nm. The distance between the lenses and samples was 25 cm, and the moving speed of the platform was 2.5 mm/s. To avoid obvious noise fluctuations at the start and the end of the wavelengths, only the collected effective spectral information, including 396 bands from 410 to 950 nm and from 950 to 2,500 nm, was merged manually with the two lenses. Furthermore, to eliminate the adverse influence of external factors such as uneven light distribution and camera dark current, the HSI data was corrected before further analysis with the following correction formula:
where R is the corrected spectral data, Rraw is the original spectral data, Rw is the white reference data obtained from the white board with a reflectivity of 99%, and Rd is the dark reference data obtained by turning off the light and blocking the camera lenses. The spectral information of each fruit was treated as one region of interest (ROI) and extracted using the ENVI 5.3 software (Harris Geospatial Solutions Inc., CO, USA). Then, all the pixel reflectance data were calculated to obtain the average of one subsample.
According to the requirements of the extraction kit (YX-W-ZDT, Hepeng Biological, Shanghai, China) and the phenol-sulfuric acid method, the PPS solution extracted from the fruit pulp was measured using the Multiskan SkyHigh-1510 microplate spectrophotometer (Thermo Fisher, MA, US) at 490 nm (4). Meanwhile, standard samples of glucose (99% in purity, YX-W-ZDT, Hepeng Biological, Shanghai, China) at concentrations of 1, 0.5, 0.25, 0.125, and 0.0625 mg/ml were prepared to construct a standard curve with the square of curve correlation coefficient (R2) value equal to 0.9992 (y = 0.0212x-0.0103). Then, the PPS content was calculated according to the standard curve.
RS can reduce 3,5-dinitrosalicylic acid (DNS) reagent in alkaline solutions, and the red-brown precipitate product can be assessed at 540 nm with a microplate spectrophotometer. According to the instruction of the detection kit (BC2710, Solarbio, Beijing, China), the RS extracted from the RRB fruit pulp was reacted with DNS, and glucose solutions (99% in purity, YX-W-ZDT, Hepeng Biological, Shanghai, China) at concentrations of 1, 0.8, 0.5, 0.2, and 0.1 mg/ml were used as standard samples to construct a standard curve with R2 value equal to 0.9997 (y = 0.0211x-0.0088). Then, the content of RS was calculated based on the standard curve.
In alkaline nitrite solution, flavonoids and aluminum ions will form a red complex with an obvious absorption at 470 nm (4). According to the instruction of the extraction kit (BC1330, Solarbio, Beijing, China), reference solutions of rutin (98% in purity, BC1330, Solarbio, Beijing, China) at concentrations of 1.5, 1.25, 0.625, 0.3125, 0.15625, 0.078, 0.039, and 0.02 mg/ml were prepared to construct a standard curve with R2 value equal to 0.9993 (y = 0.021x-0.0099). Then, the content of TF extracted from the RRB fruit pulp was calculated according to the standard curve.
Under alkaline conditions, phenols can reduce tungstomolybdic acid to produce blue compounds with a characteristic absorption peak at 760 nm (6). According to the instruction of the extraction kit (BC1340, Solarbio, Beijing, China), standard samples of gallic acid (98% in purity, BC1340, Solarbio, Beijing, China) at concentrations of 0.15625, 0.078125, 0.039, 0.02, 0.01, 0.005, and 0.0025 mg/ml were prepared to construct a standard curve with R2 value equal to 0.9996 (y = 0.0183x-0.0024). Then, the content of TP extracted from fruit pulp was calculated based on the standard curve.
The data of nutrient contents obtained with chemical methods were applied to significant difference analysis between regions (P < 0.05). One-way analysis of variance (ANOVA) using Duncan’s multiple comparison method was implemented on the SPSS software (22.0 version, IBM Inc., Chicago, IL, USA). All significant difference analysis results were expressed as mean ± standard deviation of three replicates.
Four pretreatment methods, including the first derivative (DER), the second derivative (SEC), multiplicative signal correction (MSC), and Savitzky-Golay filtering (SG) with a window size of 9, were adopted to eliminate random interferences and improve the HSI spectral features and performance. Three prediction models used in this study are briefly described below, including back-propagation neural network (BPNN), partial least square regression (PLSR), and support vector machine (SVM).
The BPNN, as a widely used method in regression, always has three or more neurons, including an input layer, hidden intermediate layers, and an output layer (Supplementary Figure 1). During the analysis, the activation function value of the neuron is delivered through these layers in the mentioned order. Based on the difference between actual and prediction values, the weight values are corrected layer by layer from the output layer to the input layer. In our BPNN model, the node number of the hidden layers was set at 10, and the momentum factor, initial weight, and the learning step were adjusted to 0.3, 0.95, and 0.1, respectively. The maximum training iteration was adjusted to 100, and the minimum error was adjusted to 0.001 (23).
The PLSR model is a classical linear regression algorithm. It can consider both matrices x (spectral data) and y (chemical index) and find the maximal correlation between the new variables of X and Y (24, 25). In our analysis, the leave-one-out cross-validation method was adopted to obtain the optimal number of important latent variables ranging from 6 to 10 in different nutrient prediction groups using PLSR.
The SVM model is suitable for analyzing both linear and non-linear data, and it has the advantages of less training time, lower computation complexity, and better generalization ability. In this research, the SVM model was constructed based on the radial basis function, and the optimal combination of two important parameters, i.e., the penalty factor (C, ranging from 2–8 to 28) and the kernel parameter (γ, ranging from 100 to 2,500), were determined through a grid-search method. Also, the influence of sampling randomness on model performance was greatly avoided by leave-one-out cross-validation so as to improve the efficiency and accuracy of parameter optimization (26).
The prediction effect of pretreatment methods combined with regression models was evaluated based on residual predictive deviation (RPD) and curve correlation coefficient R2 values. Usually, the R2 value from 0.61 to 0.80 and the RPD from 2.0 to 2.5 indicate that the model can be used for prediction; the R2 value from 0.81 to 0.90 and the RPD value from 2.5 to 3.0 indicate high model performance; the R2 value higher than 0.90 and the RPD value higher than 3.0 indicate excellent model performance (4).
Two wavelength selection methods were adopted in this study, including competitive adaptive reweighted sampling (CARS) and variable iterative space shrinkage approach (VISSA). The CARS method can evaluate the importance of each variable. A two-step method was adopted to select the key variables, including (a) forced variable selection based on an exponential decline function, and (b) competitive variable selection based on adaptive reweighted sampling. Meanwhile, three parameters, including the maximal principle to extract, the group number for cross-validation, and the pretreatment method, were set to 10, 10, and “autoscaling,” respectively.
The VISSA method has two important rules during optimization: (a) the variable space shrinks in each step, and (b) the core of the VISSA model is that a new variable space is superior to the previous one. The performance of variable space in each optimization step could be evaluated, and the weighted binary matrix sampling method was used in this model to generate sub-models to span the variable subspace (27). In VISSA model selection, four parameters, including the maximum number of latent variables, the group number for cross-validation, the number of binary matrix sampling, and the pretreatment method, were set to 15, 10, 500, and “autoscaling,” respectively.
In this study, two discrimination models (PLSDA and SVM) in combination with four pre-treatment methods (DER, MSC, SEC, and SG) were adopted for geographical origin tracing. The PLSDA model projected the prediction variables and observation variables into a new space to find a linear regression for multi-origin classification. In the PLSDA model, the latent variables ranging from 6 to 10 were determined by leave-one-out cross-validation. The SVM model, which aims to obtain the best hyperplane by selecting the hyperplane passing through the maximum possible gap between points of different categories, was used with a non-linear radial basis function to reduce the training complexity. In SVM model, the penalty factor (C) and kernel parameter (γ) are two important parameters for improving the accuracy of the radial basis function, and they were selected through a grid search algorithm (the same above in section “Model prediction of nutrients content based on hyperspectral imaging wavelengths”). The performance of the models in geographical origin identification was evaluated in terms of sensitivity, specificity, and accuracy. These three indices were calculated as follows:
where TP, TN, FN, and FP represent the numbers of true positives, true negatives, false negatives, and false positives, respectively (28).
The samples from three PGI regions (ZJLS, ZJCA, and JXDX) were pairwise compared with those from common regions by using the OPLS-DA model based on the full HSI wavelengths, and 200 permutation tests were conducted to avoid any over-fitting problem. Discrimination accuracy, R2X, R2Y, and Q2 were recorded to represent the classification efficiency, the explanatory power for the variation in X variables and Y variables, and the predictive capability of the model, respectively.
In both nutrient content and origin prediction, all the RRB samples were grouped into a prediction set and a training set at the ratio of 3:7 using the SPXY algorithm (i.e., sample set partitioning based on joint x-y distances) (29). Also, all the above models were implemented by using MATLAB software (R2020a, The MathWorks, Inc., MA, USA). The specific analysis workflow of the study is shown in Figure 1.
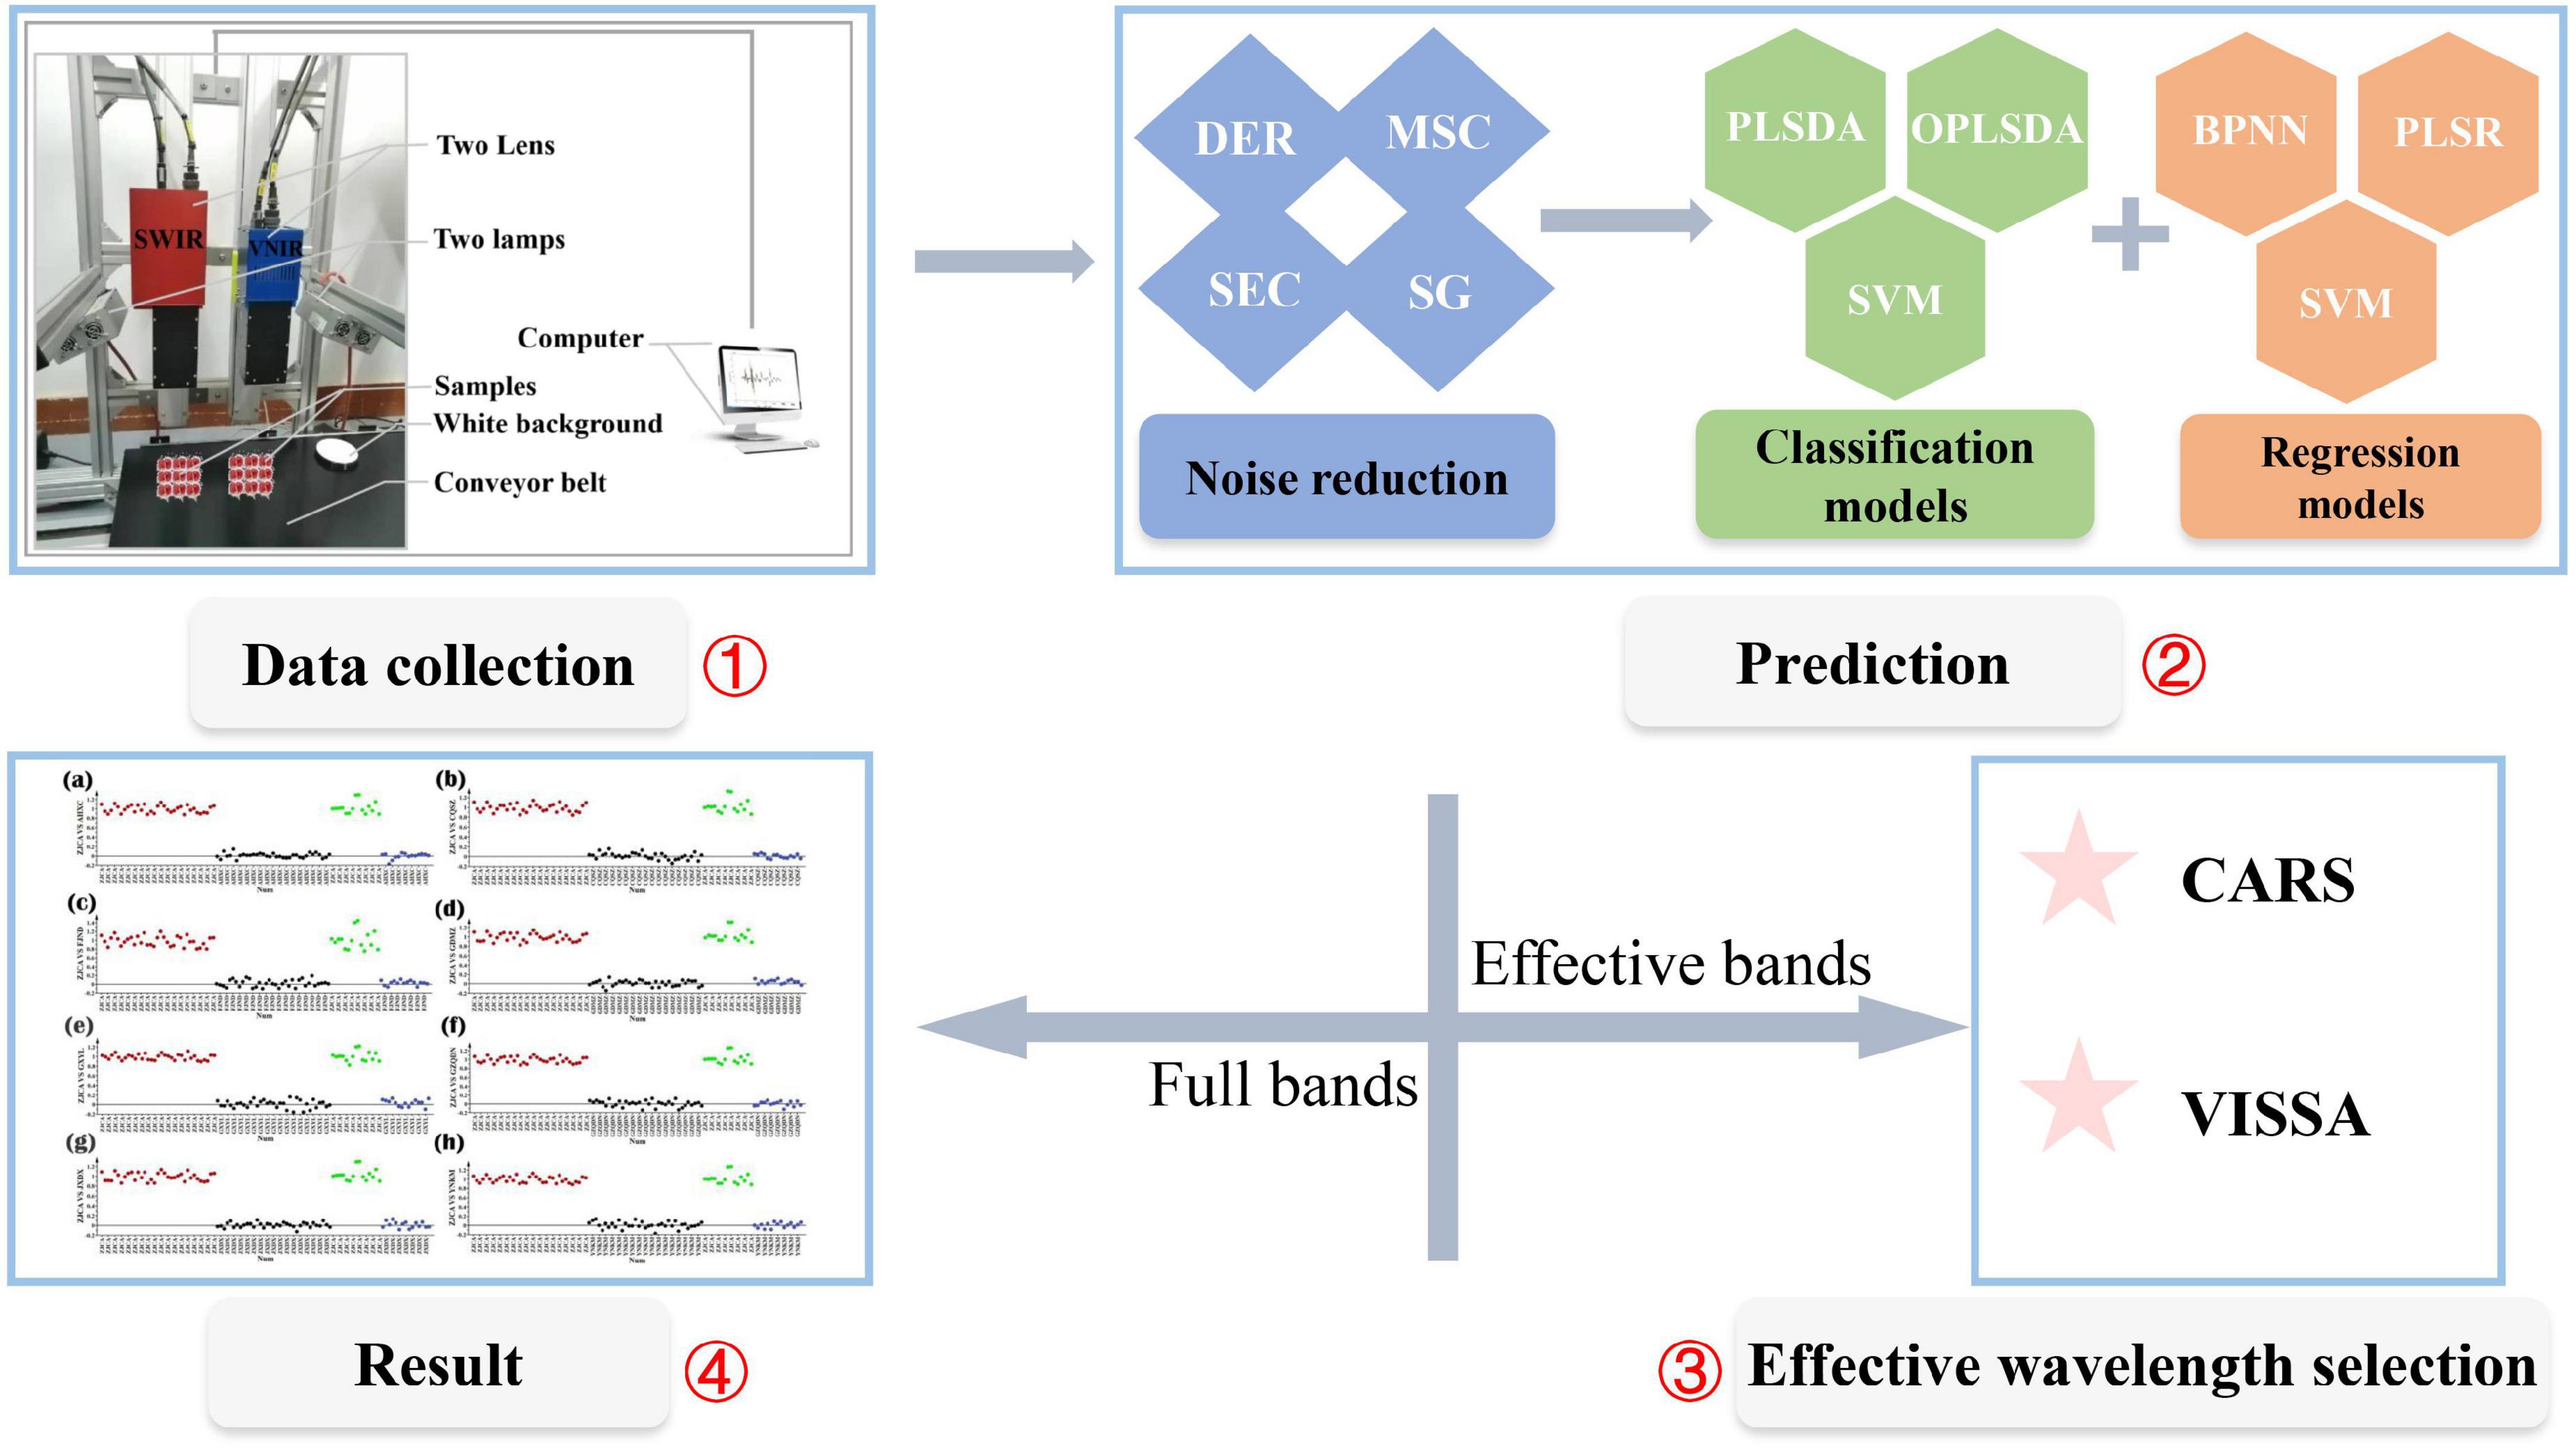
Figure 1. The specific process of the analysis. The workflow includes four parts, i.e., data collection, indicators prediction, effective wavelengths selection, and results analysis. Four pretreatment methods were considered, including the first derivative (DER), multiplicative signal correction (MSC), the second derivative (SEC), and Savitzky-Golay filtering (SG). Three regression models, including back-propagation neural network (BPNN), partial least square regression (PLSR), and support vector machines (SVM), were used for contents prediction. Three classification models, including orthogonal partial least squares discrimination analysis (OPLSDA), partial least squares discriminant analysis (PLSDA), and support vector machines (SVM), were used for origins prediction. Two wavelength selection methods were considered, including competitive adaptive reweighted sampling (CARS) and variable iterative space shrinkage approach (VISSA).
The measured PPS, RS, TF, and TP contents of RRB fruits are listed in Supplementary Table 1. The PPS content ranged from 63 mg/g (GZQDN) to 227 mg/g (AHXC). The RS content ranged from 119 mg/g in the JXDX region to 339 mg/g in the ZJLS region. As for the TF content, the maximum and minimum values were 34.0 mg/g (AHXC) and 3.0 mg/g (GXYL), respectively. Besides, the maximum (14.2 mg/g) and the minimum values (10.0 mg/g) of the TP content were found in the JXDX region and the ZJLS region, respectively. The results showed that the mean contents of the four nutritional indicators had a significant difference (P < 0.05) among the most different production regions (Supplementary Table 1). Overall, PPS and RS contents account for 10–20 and 20–30 in RRB fruits, respectively, and both represent the total sugar content in the fruits. The TF and TP contents account for 1–3 and 1–2% of the total weight, respectively.
In this part, three regression models (BPNN, PLSR, and SVM) were combined with pretreatment measures including DER, MSC, SEC, and SG, respectively, to predict the nutrient contents. The results showed that some combinations of pretreatment and regression models performed well on the prediction sets (Supplementary Tables 2–5). In PPS prediction, the PLSR model obtained desirable results, with RPD values of 2.5–3.0. Meanwhile, the DER-SVM group showed a good ability for PPS prediction, with an RPD value of 2.55 (Supplementary Table 2). As for RS prediction, the DER-PLSR, MSC-PLSR, SEC-PLSR, and SG-PLSR groups exhibited an excellent ability, with R2 values above 0.90 and RPD values above 3.0 (Supplementary Table 3). In TF content prediction, only the DER-PLSR and MSC-PLSR groups performed well, with RPD values of 2.51 and 2.55, respectively (Supplementary Table 4). As for TP prediction, the groups of DER-PLSR, MSC-PLSR, SEC-PLSR, and SG-PLSR showed an excellent ability, with R2 values above 0.90 and RPD values higher than 3.0. The DER-SVM group also had an excellent ability for TP content prediction, with an R2 value above 0.90 and an RPD value of 3.11 (Supplementary Table 5).
In this part, according to the prediction results based on full HSI wavelengths, some models with good or excellent prediction effects were further adopted to select important variables. Specifically, the models were ORI-PLSR, DER-PLSR, MSC-PLSR, SEC-PLSR, SG-PLSR, and DER-SVM (RPD > 2.5) for PPS prediction (Supplementary Table 2), DER-PLSR, MSC-PLSR, SEC-PLSR, and SG-PLSR (RPD > 3) for RS prediction (Supplementary Table 3), DER-PLSR and MSC-PLSR (RPD > 2.5) for TF prediction (Supplementary Table 4), and DER-PLSR, MSC-PLSR, SEC-PLSR, SG-PLSR, and DER-SVM (RPD > 3) for TP prediction (Supplementary Table 5). Meanwhile, two strategies of CARS and VISSA with different characteristics were used for wavelength selection.
The nutrient content prediction using selected wavelengths via the CARS method (Table 1) obtained higher RPD values (in bold, 13 out of 17 groups) than those from the full wavelength groups. Specifically, the RPD values were improved from the level (from 2.5 to 3.0) indicating a good ability to the best level (>3.0) indicating an excellent ability in PPS content prediction (Table 1). As for using the VISSA method in wavelength selection, the good results showed that the RPD values increased in about 10 out of 17 groups (RPD values in bold, Table 2).

Table 1 Nutrient content prediction based on the effective wavelengths selected by the CARS method.
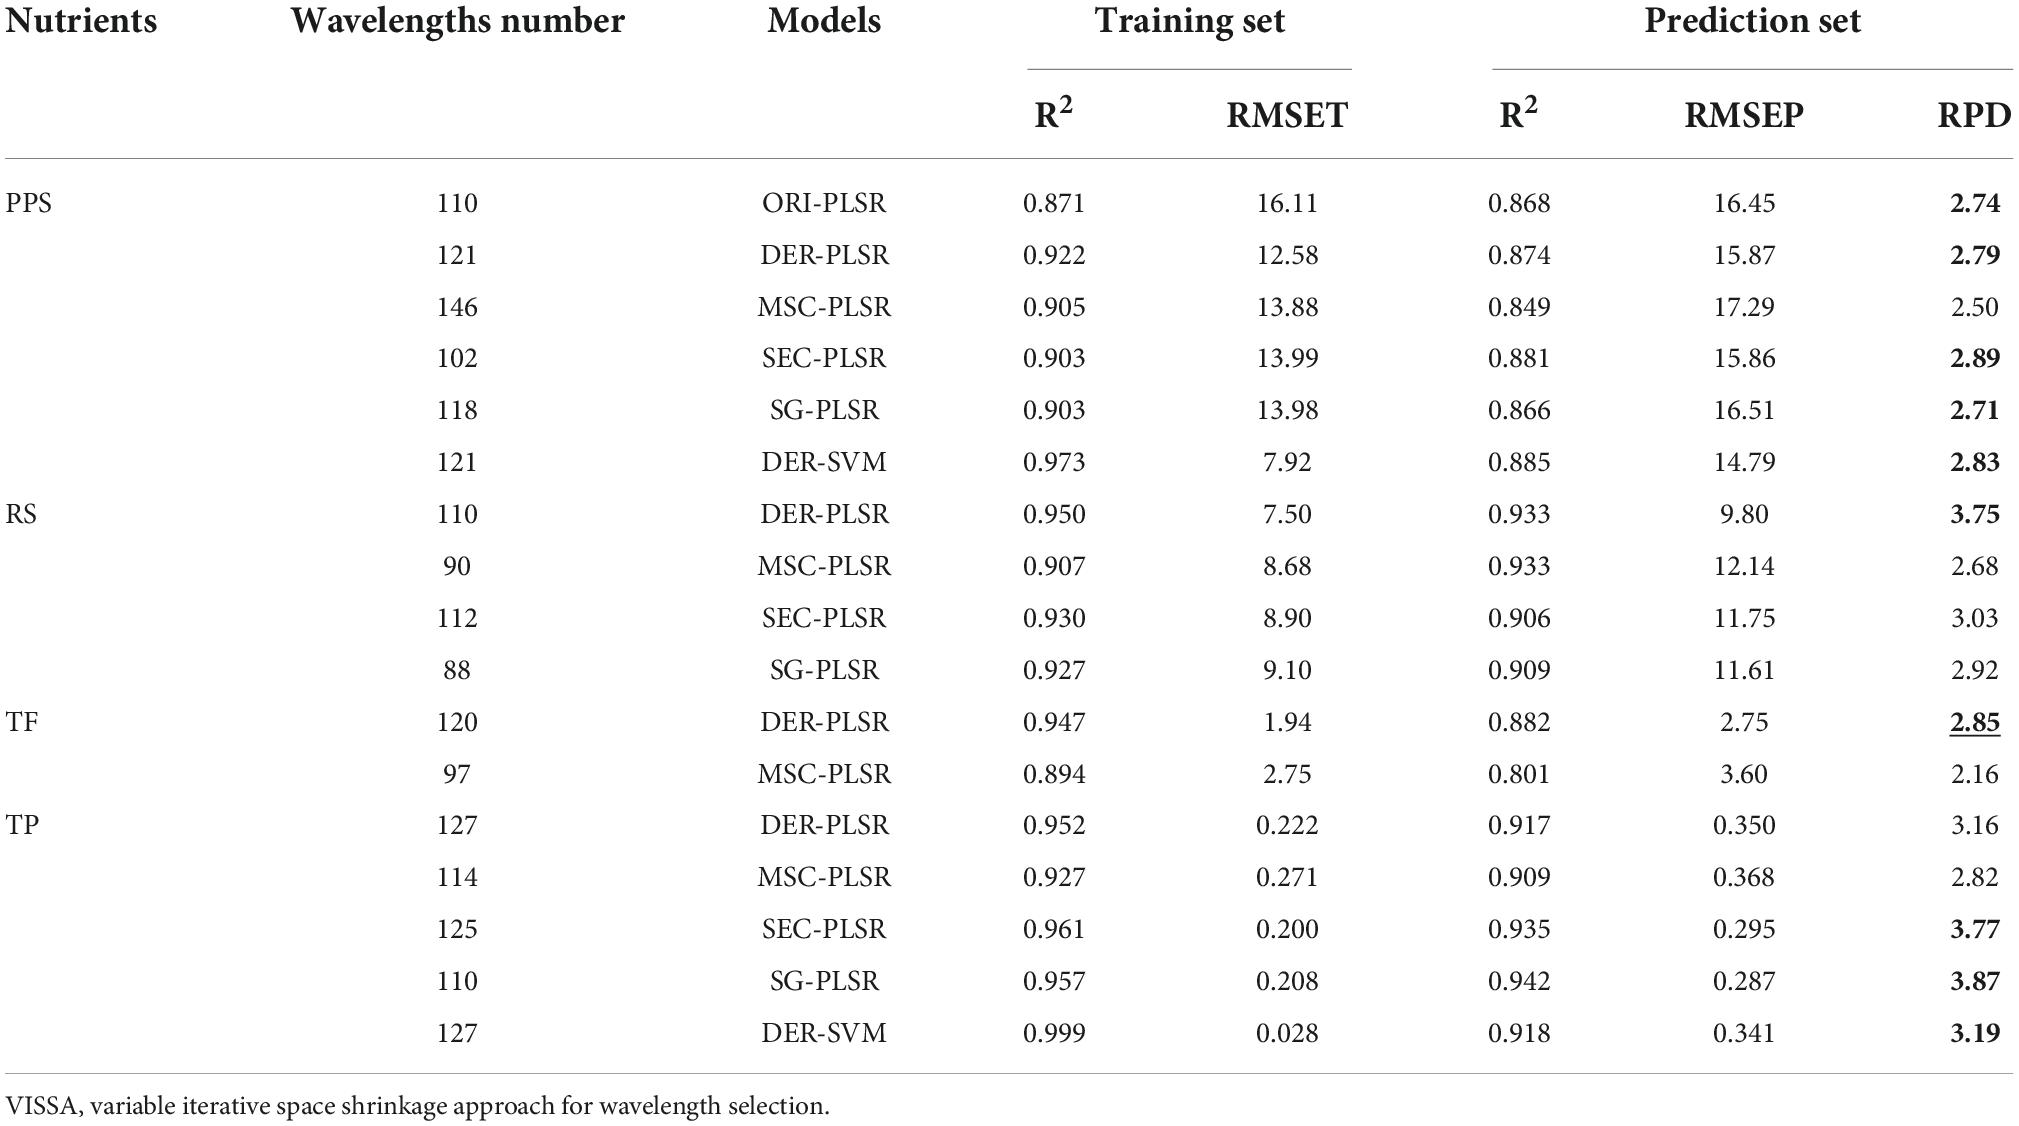
Table 2. Nutrient content prediction based on the effective wavelengths selected by the VISSA method.
Generally, compared with full wavelength groups, CARS-ORI-PLSR and CARS-MSC-PLSR were the most successful methods for PPS and RS content prediction, with the highest RPD values of 3.66 and 3.95 respectively, indicating an excellent ability in prediction (RPD values with underline, Table 1). The CARS-MSC-PLSR was the most efficient method for TP content prediction, with the highest RPD value of 4.85, indicating an excellent ability in prediction (RPD values with underline, Table 1). As for TF content prediction, the most suitable model VISSA-DER-PLSR obtained the highest RPD value of 2.85, indicating a good ability in prediction (RPD values with underline, Table 2).
The PLSDA and SVM models combined with pre-treatment methods were used in the geographical origin discrimination of RRB fruits (Table 3). Overall, the PLSDA model combined with pre-treatment methods had a better classification effect than the SVM group, and the total discrimination accuracy was higher than 89% on both the training and prediction sets (Table 3). In the PLSDA group with pre-treatment, all discrimination accuracy was improved when compared with that of the ORI group without pretreatment (Table 3). In this study, the DER-PLSDA model exhibited the highest total discrimination accuracy of 99.7 and 97.3% in the training and prediction groups, respectively (Table 3 and Figure 2). As shown on the training set (Figure 2A) and prediction set (Figure 2B), the sensitivity, specificity, and discrimination accuracy of the two PGI regions of ZJCA and JXDX were all 100%, while those of the ZJLS region were 100, 96.7, and 96.7 on the training set (Figure 2A) and 94.7, 90.0, and 90.0% on the prediction set, respectively (Figure 2B).
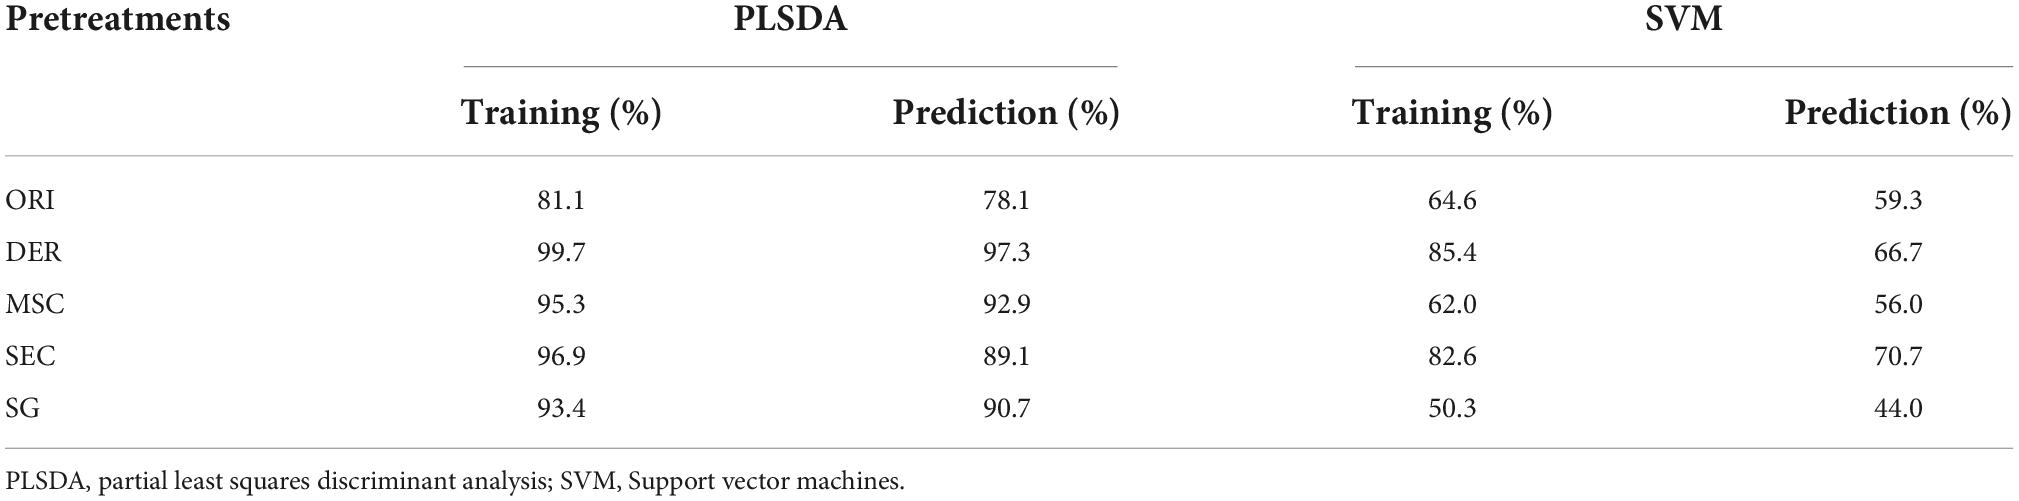
Table 3. Multi-origin discrimination of fruits using PLSDA and SVM models.
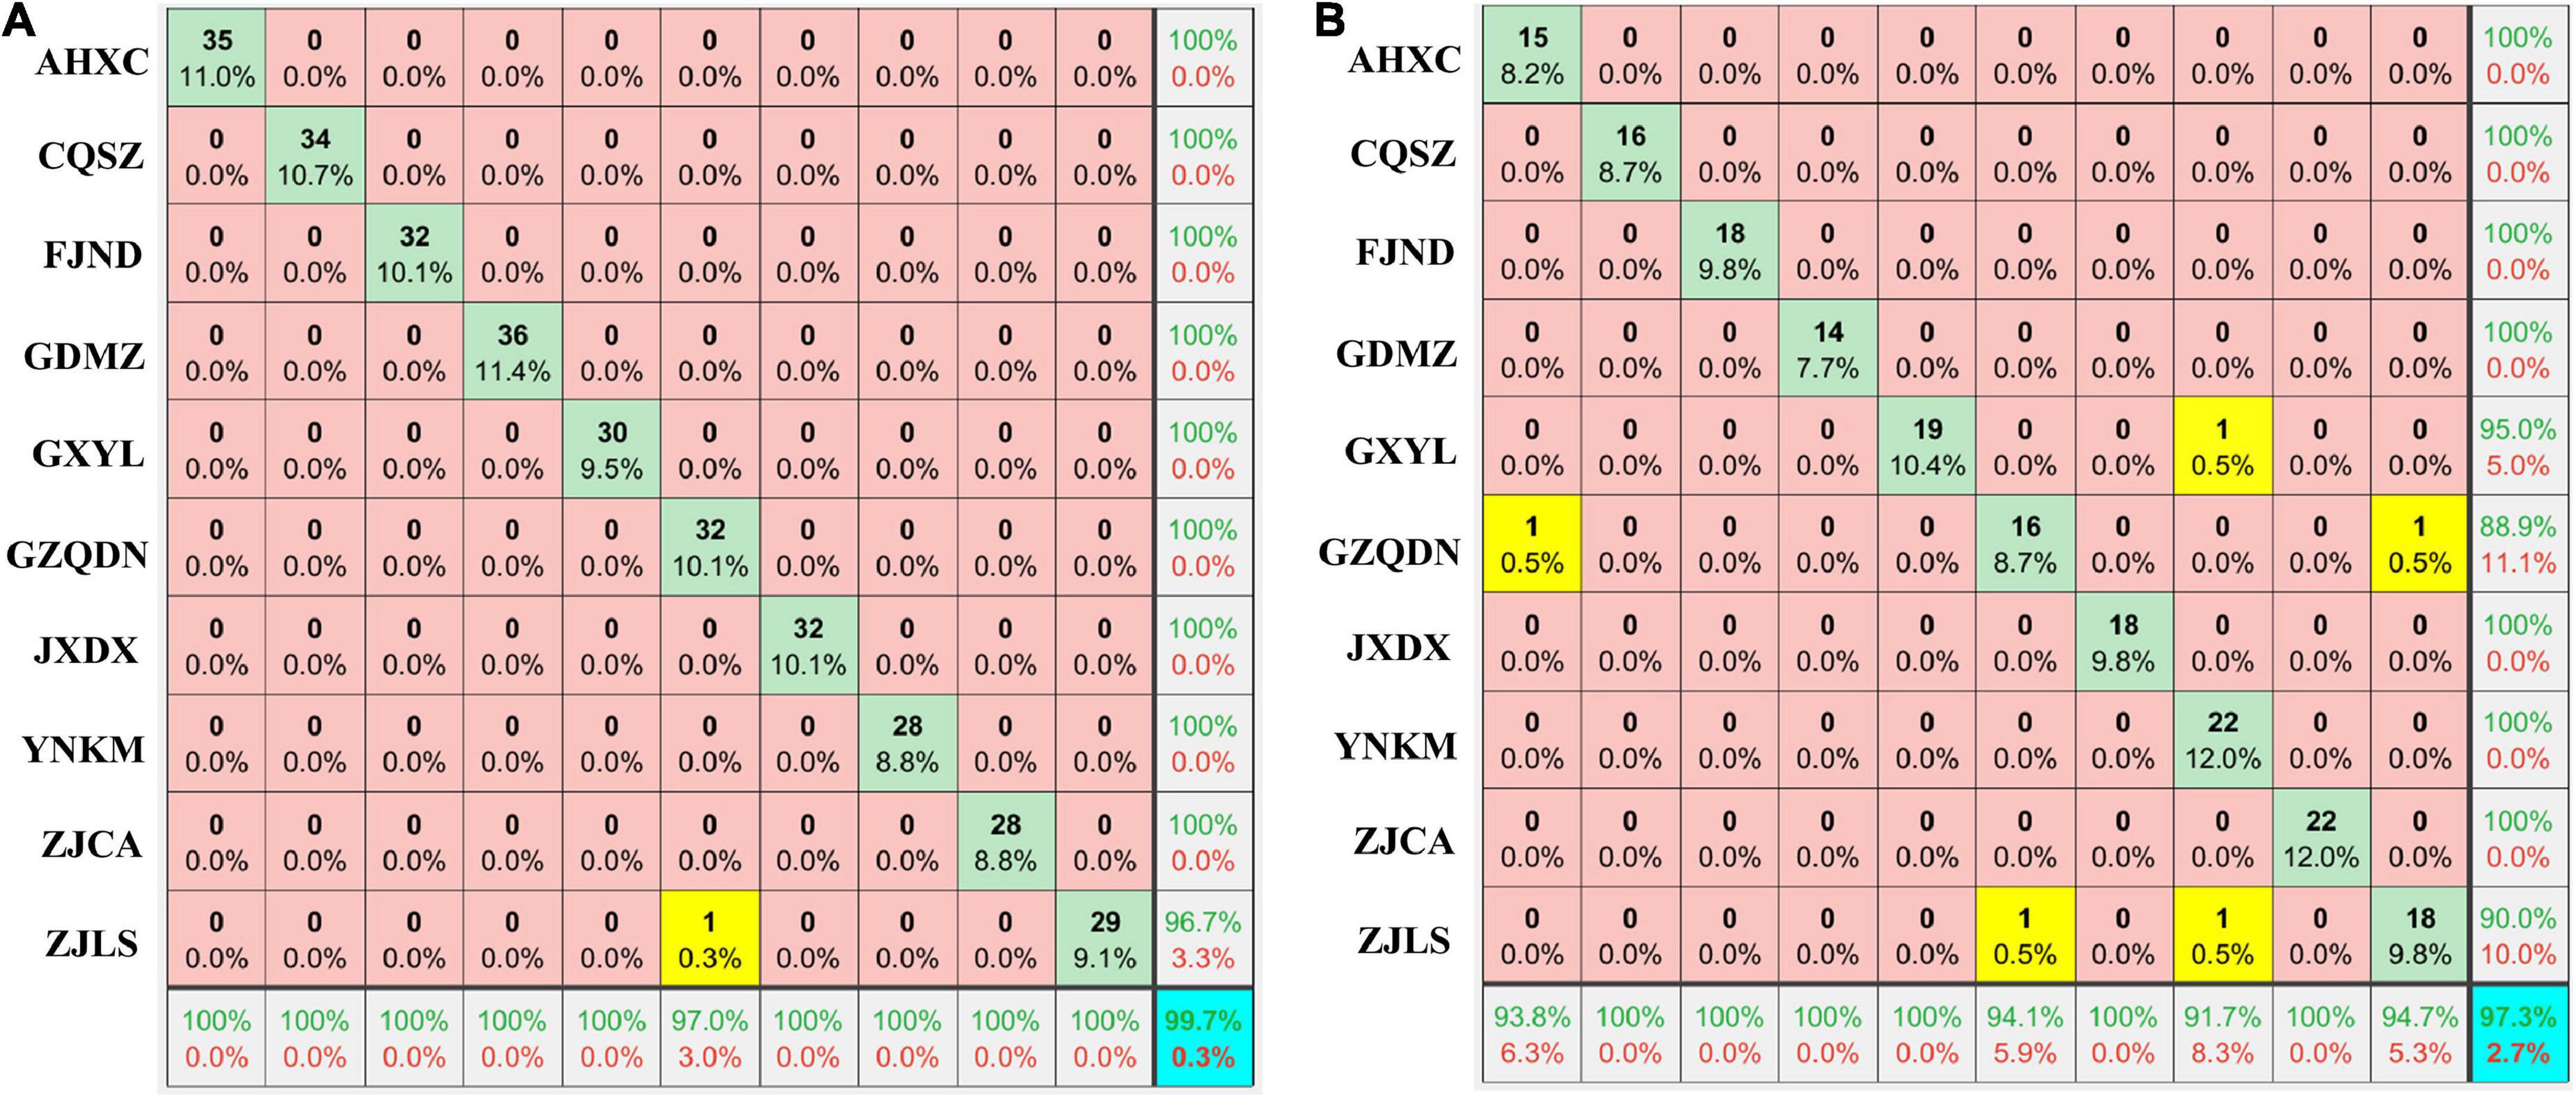
Figure 2. Geographical origins discrimination for RRB fruits using the DER-PLSDA model based on full wavelengths. Training set (A), Prediction set (B). The number in blue color represents the total discrimination accuracy on the training and prediction sets, and the yellow color represents the groups with discrimination errors. The results of sensitivity and specificity are shown in the bottom row and the right column, respectively.
Then, the RRB fruits from PGI status regions (ZJLS, ZJCA, and JXDX) were classified using the OPLSDA model based on the full HSI wavelengths, and the prediction accuracy is shown in Table 4 and Supplementary Figures 2–4. The parameter of Q2 indicates the predictive ability, where 0.9 > Q2 > 0.5 represents a good ability for prediction, and Q2 ≥ 0.9 indicate an excellent predictive ability (30). In the groups of ZJLS vs. the others, the discrimination accuracy was 100%, and the Q2 values were all higher than 0.9, except for the groups of ZJLS vs. ZJCA with Q2 equal to 0.887 (Table 4 and Supplementary Figure 2). In the discrimination of ZJCA samples, the accuracy was 100%, and the Q2 values were all higher than 0.9 (Table 4 and Supplementary Figure 3). However, several misjudgment cases occurred in discrimination of JXDX samples (Table 4 and Supplementary Figure 4). In the groups of JXDX vs. AHXC, JXDX vs. CQSZ, JXDX vs. GXYL, JXDX vs. GZQDN, and JXDX vs. YNKM, discrimination errors were observed, the accuracy ranged from 98 to 99%, and the Q2 values ranged from 0.80 to 0.90. In the groups of JXDX vs. FJND and JXDX vs. GDMZ, the discrimination accuracy was both 100%, and the Q2 values were 0.960 and 0.841, respectively (Table 4 and Supplementary Figure 4).
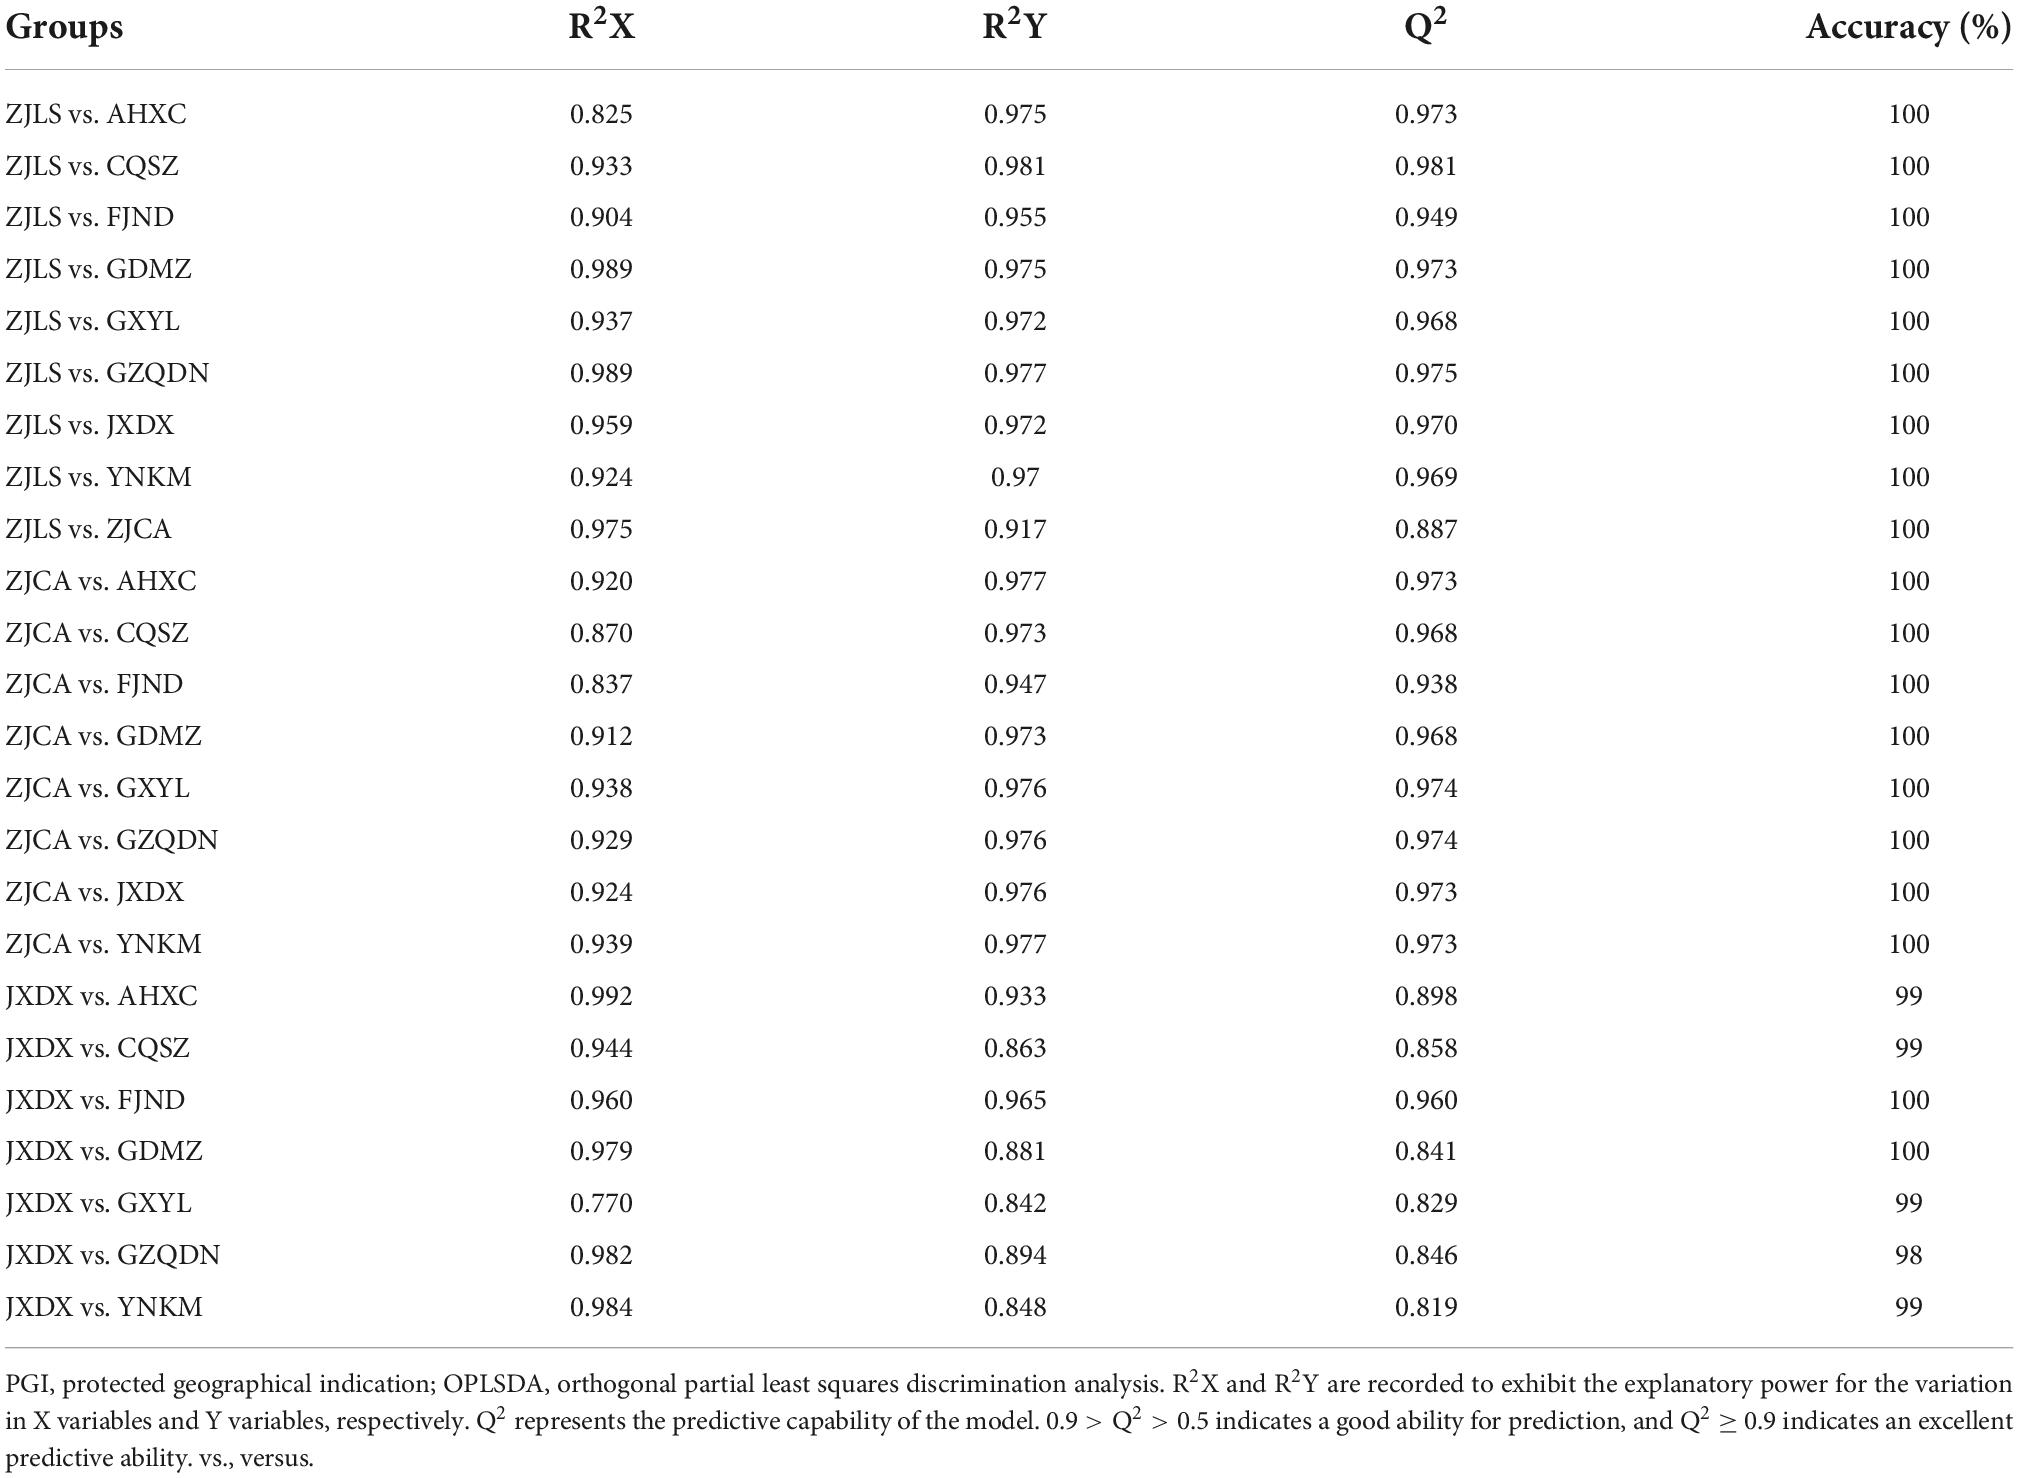
Table 4. Pairwise discrimination of fruits from PGI regions using the OPLSDA model.
Fruit nutrients such as PPS, RS, TF, and TP are important indicators in quality evaluation. Similar studies have been reported on the nutrient content prediction of fruits using a fast and non-destructive method, providing evidence of good prediction effects when HSI was combined with chemometric methods. For example, NIR-HSI combined with the PLSR model was successfully applied to the prediction of RS content in pomelo fruits (16) as well as the PPS content in mulberry fruits (18) and orange peels (17), and low RMSE values and high R2 values were obtained. Meanwhile, in a former report, the TP and TF contents from black goji berries were effectively determined using HSI full wavelengths combined with PLSR and SVM models (15).
Selecting some key wavelengths instead of using the full wavelengths can reduce model complexity and improve prediction accuracy and robustness. Similar to our results, many relevant reports demonstrated that the nutrient content prediction results in fruits based on the selected HSI wavelengths are similar to or better than those from the full-band group. For example, in the prediction of the TF and TP contents in black goji berries based on the effective wavelengths selected via CARS and successive projections algorithm (SPA) methods, the R2 and RPD values were the same as those from the full-band group (15). In the prediction of total anthocyanin content in mulberry fruits (31) and sugar content in pomelo fruits (32), better prediction results were obtained in effective wavelength groups.
In this study, the correlation between selected bands and predicted nutrients was analyzed. The effective absorption at 1,000–1,100 nm and 1,150–1,300 nm (Figure 3A) may be related to the second harmonic of O-H and the first harmonic of C-H combination in the polysaccharides, respectively (33). As for RS analysis (Figure 3B), the wavelengths at 1,385 nm corresponded to the C-H second overtone and combination as well as the wavelengths at 605 and 540 nm corresponded to the fourth and fifth overtone regions of –O-H from RS, respectively (34, 35). Meanwhile, the effective wavelengths of TF were almost consistent with former published studies, where 1,100 to 1,140,nm and 1,650 to 1,690 nm corresponded to the first overtone region and second overtone region of –CH3 from flavonoids, respectively (Figure 3C) (34). Also, the 1,430 to 1,450 nm corresponded to the second overtone region of –CH from polyphenols (36), and wavelengths intervals of 425–520 and 725–995 nm corresponded to the most abundant phenolic compounds of ferulic acid in RRB (Figure 3D) (37).
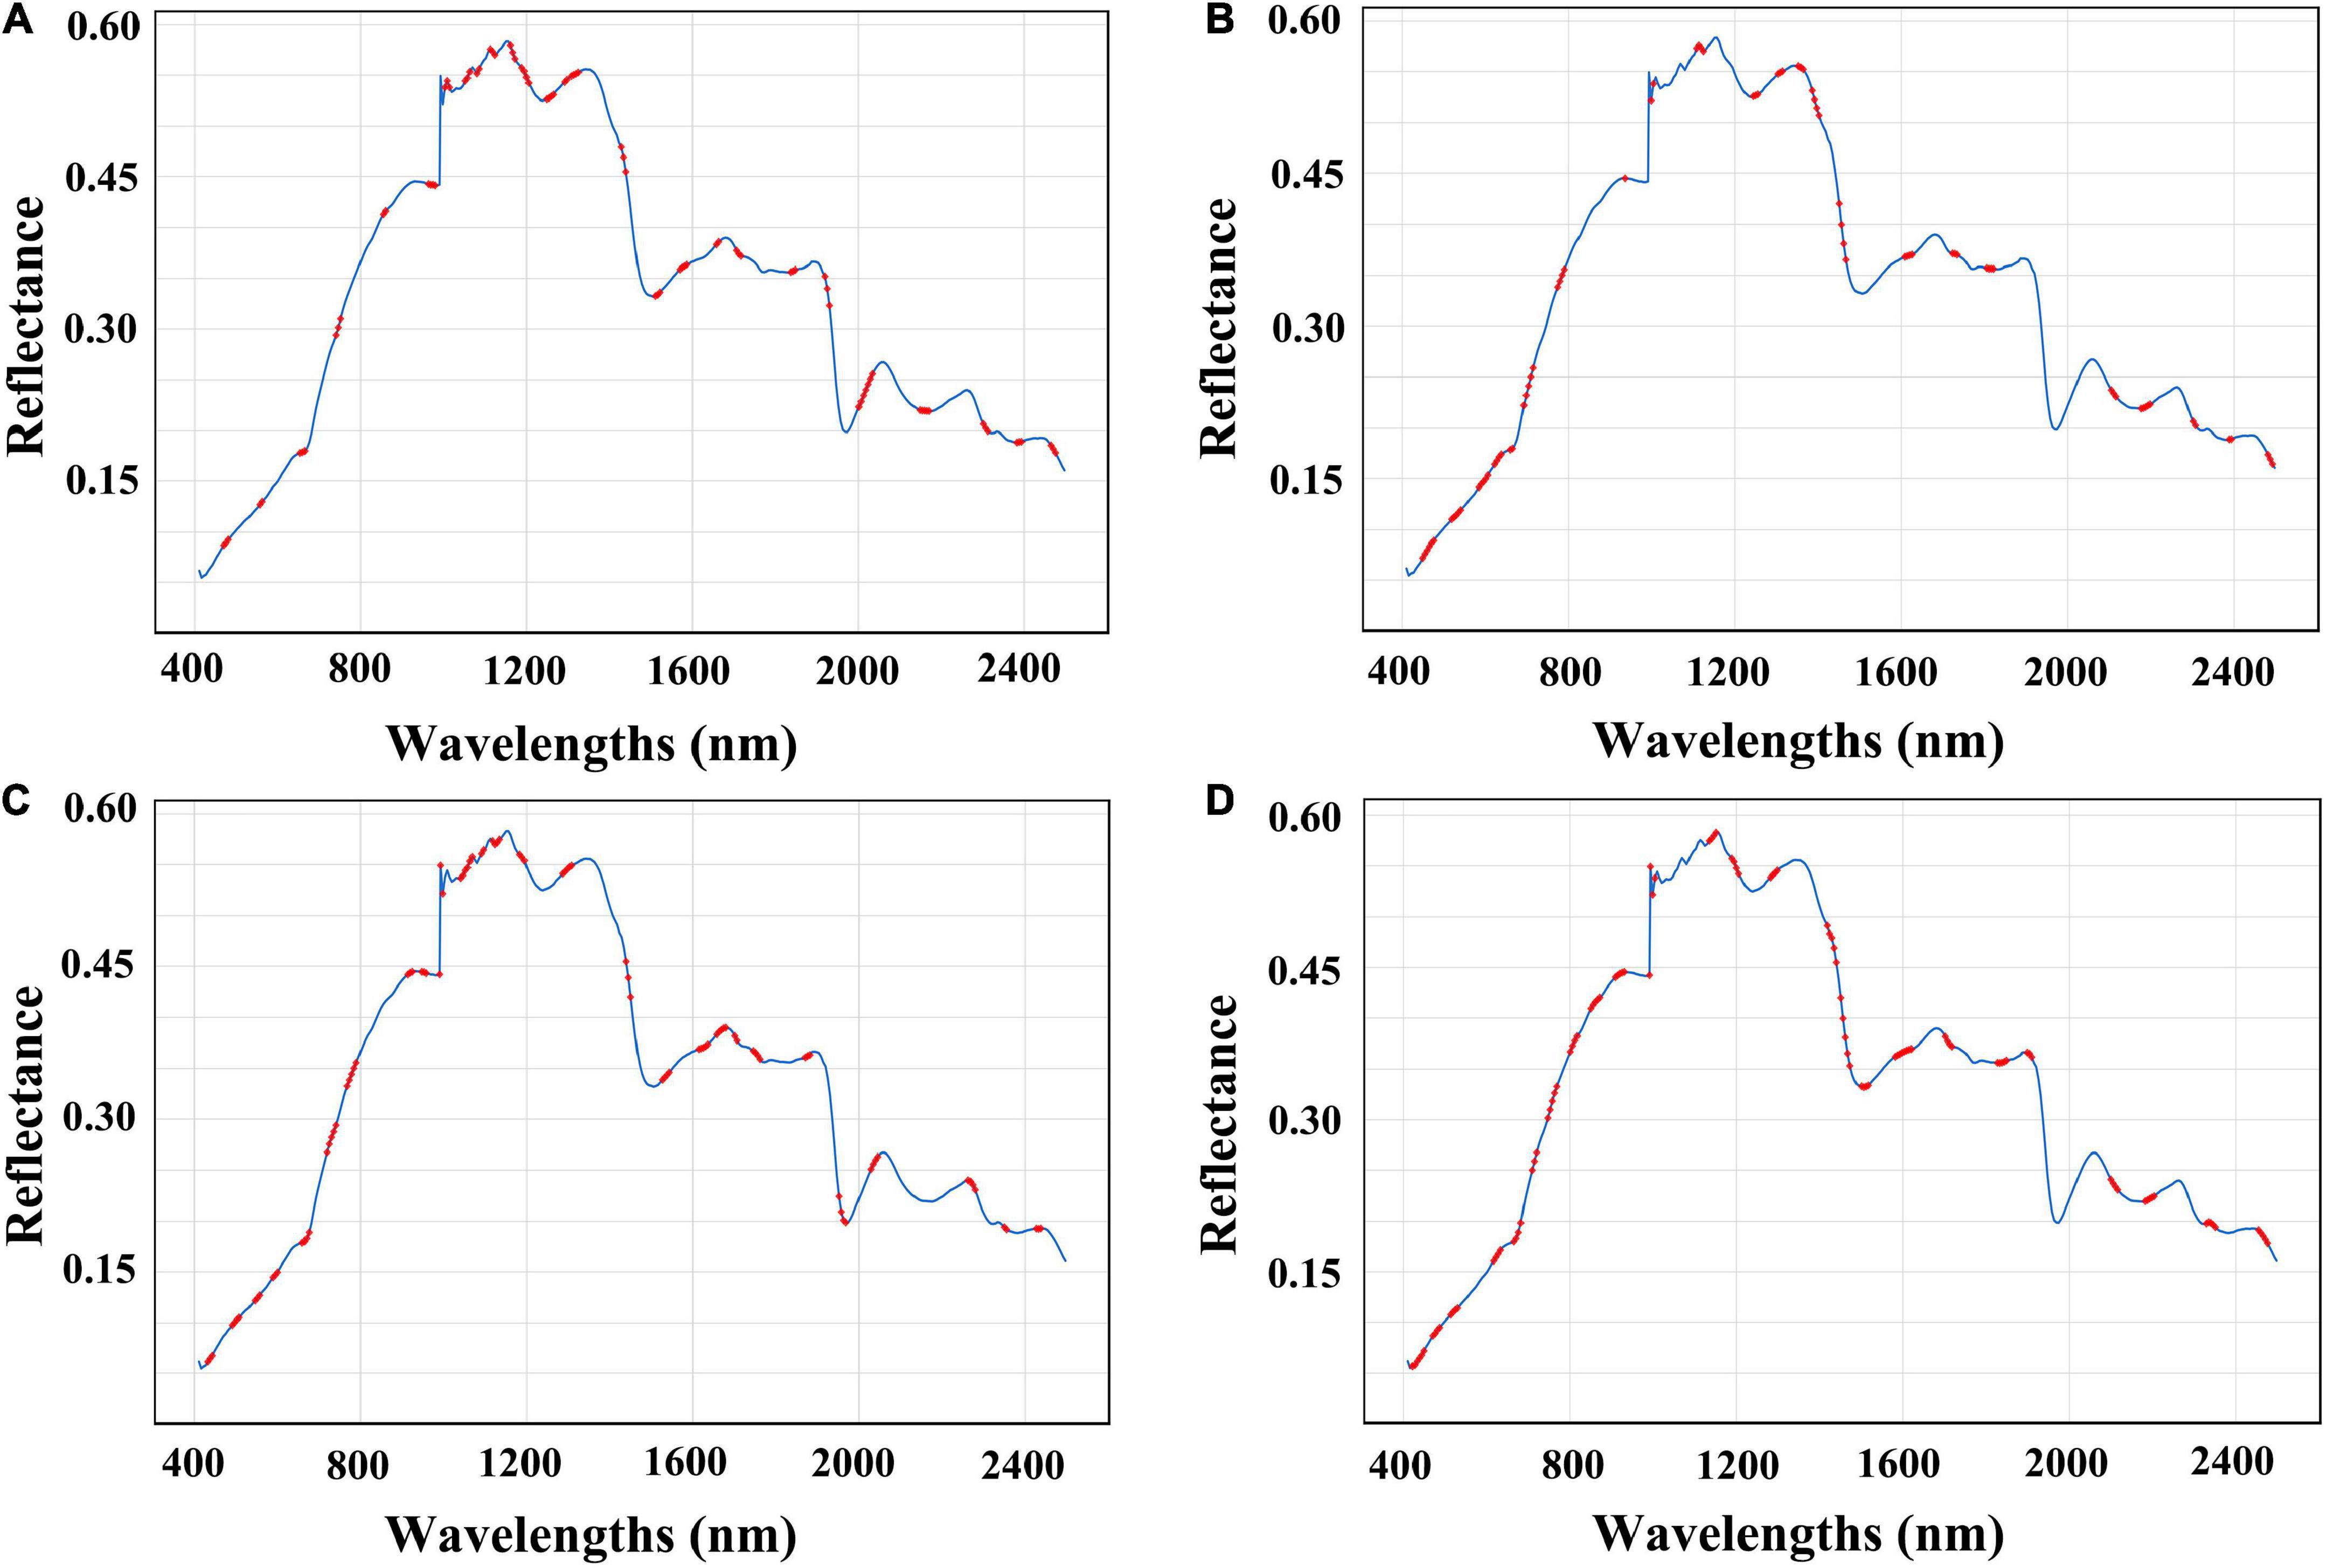
Figure 3. Selected wavelengths for best prediction in nutrient contents of RRB fruits. The selected wavelengths are shown in red dots. (A) Selected wavelengths in PPS prediction (CARS-ORI-PLSR); (B) selected wavelengths in RS prediction (CARS-MSC-PLSR); (C) selected wavelengths in TF prediction (VISSA-DER-PLSR); (D) selected wavelengths in TP prediction (CARS-MSC-PLSR).
Additionally, the prediction of different nutrients may have a unique model tendency. One example is that potato starch content was predicted based on the selected HSI bands, and the same results showed that the selection methods of CARS, iterative variable subset optimization (IVSO), and VISSA have different prediction effects. The preferred CARS-SVM model achieved the best performance with the highest R2 and RPD values (27). In this study, the necessary work was conducted to compare and choose the most appropriate model for the prediction of different types of nutrients from RRB fruits.
In this study, the combination of HSI technology with the PLSDA model achieved a better result in the origin prediction of RRB fruits. Similar results were obtained in narrow-leaved oleaster (Elaeagnus angustifolia) fruit traceability by using HSI technology, and the PLSDA model achieved a higher discrimination accuracy (>99%) than that of the SVM group (13). Besides, a similar study on origin classification of Rhizoma Atractylodis Macrocephalae obtained the highest classification accuracy of 97.3% by using the PLSDA model (38). In the PGI origin discrimination of this study based on the HSI full wavelength, the OPLSDA model was suitable for pairwise comparison of origin traceability. Meanwhile, the good results in region discrimination by using the OPLSDA model from previous reports were listed, including Thai Hom Mali rice traceability (39) as well as the origin prediction of Huangjing from the PGI regions of Qingyang City, China (40).
During data collection using HSI technology, the random noises caused by equipment status and material characteristics such as uneven sizes and colors could be effectively eliminated by using pretreatment methods (30, 41). Also, the spectral derivatization noises can be well eliminated by DER, SEC, and SG methods (42). MSC is commonly used to remove the undesirable scatter effect caused by uneven sample sizes and morphologies (43). In fact, it is difficult to know which kind of noise plays a dominant role in this analysis. Therefore, there are no definite criteria, and trying-out is required in the specific application to select the best method for error elimination. In addition, the representativeness and uniformity of samples are very important for model prediction. For origin discrimination errors, one possible reason may be that inconsistent maturity, freshness, and surface cleanliness of RRB samples from JXDX regions led to the low sample representativeness and therefore the misjudgment in geographical origin classification.
The nutrient content (PPS, RS, TF, and TP) indicated that the quality of RRB fruits had a significant difference (P < 0.05) related to the planting regions and could be predicted by using full HSI wavelengths assisted with chemometrics. These nutrient contents could be well predicted with the HSI effective wavelengths selected via CARS and VISSA methods, and the prediction effects were even better than those from full wavelength groups, indicating the potential application in fruit quality control. The combination of HSI technology with chemometrics was a promising method for RRB fruit traceability from multiple regions, and the samples from three PGI regions were efficiently classified through pairwise comparison with the OPLSDA model. All these findings show the promising application of HSI technology in the future as a rapid and nondestructive method to achieve quantification of nutrient contents and determination of origins for RRB fruits. Future studies will collect RRB samples from more diverse regions and consider more influential factors, including varieties, fruit maturity and freshness, as well as the regional cultivation practices, to find out their contribution to and influence on the origin traceability and quality prediction.
The raw data supporting the conclusions of this article will be made available by the authors, without undue reservation.
YW: investigation, resources and writing – original draft. YeZ: writing – original draft and formal analysis. YY and JN: writing – review and editing. YyZ: methodology. TN: data curation and formal analysis. LH and JY: conceptualization, supervision, and funding acquisition. All authors have read and agreed to the published version of the manuscript.
This work was supported by the Scientific and Technological Innovation Project of China Academy of Chinese Medical Sciences (CI2021A04005), the Shandong Provincial Key Research and Development Program (Major Technological Innovation Project) (2021CXGC010508), the National Natural Science Foundation of China (32122068), and the Key Project at Central Government Level: The Ability Establishment of Sustainable use for Valuable Chinese Medicine Resources (2060302).
We want to thank MJ Editor (www.mjeditor.com) for providing help with professional editing.
The authors declare that the research was conducted in the absence of any commercial or financial relationships that could be construed as a potential conflict of interest.
All claims expressed in this article are solely those of the authors and do not necessarily represent those of their affiliated organizations, or those of the publisher, the editors and the reviewers. Any product that may be evaluated in this article, or claim that may be made by its manufacturer, is not guaranteed or endorsed by the publisher.
The Supplementary Material for this article can be found online at: https://www.frontiersin.org/articles/10.3389/fnut.2022.980095/full#supplementary-material
AHXC, Xuancheng County Anhui Province; BPNN, Back-propagation neural network; CARS, Competitive adaptive reweighted sampling; CQSZ, Shizhu County Chongqing City; DER, First derivative; FJND, Ningde City Fujian Province; GDMZ, Meizhou City Guangdong Province; GXYL, Yulin City Guangxi Province; GZQDN, Qiandongnan Miao and Dong Autonomous Prefecture Guizhou Province; HSI, Hyperspectral imaging; JXDX, Dexing County Jiangxi Province; MSC, Multiplicative signal correction; OPLSDA, Orthogonal partial least squares discrimination analysis; ORI, Original spectrum; PGI, Protected geographical indication; PLSDA, Partial least squares discriminant analysis; PLSR, Partial least square regression; PPS, Pectin polysaccharides; R2, Square of the curve correlation coefficient; RMSET, Root mean square error of training set; RMSEP, Root mean square error of prediction set; RPD, Residual predictive deviation; RRB, Red raspberry; RS, Reducing sugars; SEC, Second derivative; SG, Savitzky-Golay filtering; SVM, Support vector machines; TF, Total flavonoids; TP, Total phenolics; VISSA, Variable iterative space shrinkage approach; YNKM, Kunming City Yunnan Province; ZJCA, Chun’an County Zhejiang Province; ZJLS, Lishui City Zhejiang Province.
1. González EM, de Ancos B, Cano MP. Partial characterization of polyphenol oxidase activity in raspberry fruits. J Agric Food Chem. (1999) 47:4068–72. doi: 10.1021/jf981325q
2. Gales O, Rodemann T, Jones J, Swarts N. Application of near infra-red spectroscopy as an instantaneous and simultaneous prediction tool for anthocyanins and sugar in whole fresh raspberry. J Sci Food Agric. (2020) 101:2449–54. doi: 10.1002/jsfa.10869
3. Zhong Y, Bao Y, Chen Y, Zhai D, Liu J, Liu H. Nutritive quality prediction of peaches during storage. Food Sci Nutr. (2021) 9:3483–90. doi: 10.1002/fsn3.2287
4. He J, Chen L, Chu B, Zhang C. Determination of total polysaccharides and total flavonoids in Chrysanthemum morifolium using near-infrared hyperspectral imaging and multivariate analysis. Molecules. (2018) 23:2395. doi: 10.3390/molecules23092395
5. Krivokapić S, Vlaović M, Damjanović Vratnica B, Perović A, Perović S. Biowaste as a potential source of bioactive compounds-A case study of raspberry fruit pomace. Foods. (2021) 10:706. doi: 10.3390/foods10040706
6. Martinsen BK, Aaby K, Skrede G. Effect of temperature on stability of anthocyanins, ascorbic acid and color in strawberry and raspberry jams. Food Chem. (2020) 316:126297. doi: 10.1016/j.foodchem.2020.126297
7. Zhang W, Lao F, Bi S, Pan X, Pang X, Hu X, et al. Insights into the major aroma-active compounds in clear red raspberry juice (Rubus idaeus L. cv. heritage) by molecular sensory science approaches. Food Chem. (2021) 336:127721. doi: 10.1016/j.foodchem.2020.127721
8. Aprea E, Biasioli F, Carlin S, Endrizzi I, Gasperi F. Investigation of volatile compounds in two raspberry cultivars by two headspace techniques: solid-phase microextraction/gas chromatography-mass spectrometry (SPME/GC-MS) and proton-transfer reaction-mass spectrometry (PTR-MS). J Agric Food Chem. (2009) 57:4011–8. doi: 10.1021/jf803998c
9. Donno D, Beccaro GL, Carlen C, Ançay A, Cerutti AK, Mellano MG, et al. Analytical fingerprint and chemometrics as phytochemical composition control tools in food supplement analysis: characterization of raspberry bud preparations of different cultivars. J Sci Food Agric. (2016) 96:3157–68. doi: 10.1002/jsfa.7494
10. National Agricultural Product Geographical Indication. Raspberry Introduction. (2021). Available online at: http://www.anluyun.com/ (accessed September 26, 2021).
11. National Geographical Indication System. Raspberry Introduction. (2021). Available online at: http://www.cpgi.org.cn (accessed September 26, 2021).
12. Fang J, Lyu QD, Chen ZD, Pan JJ, Cheng KJ. Identification of commercially available Rubi fructus based on DNA barcoding technology. Chin J Mod Appl Pharm. (2020) 37:437–42. doi: 10.13748/j.cnki.issn1007-7693.2020.04.010
13. Gao P, Xu W, Yan T, Zhang C, Lv X, He Y. Application of near-infrared hyperspectral imaging with machine learning methods to identify geographical origins of dry narrow-leaved oleaster (Elaeagnus angustifolia) fruits. Foods. (2019) 8:620. doi: 10.3390/foods8120620
14. Nicola BM, Beullens K, Bobelyn E, Peirs A, Saeys W, Theron KI, et al. Nondestructive measurement of fruit and vegetable quality by means of NIR spectroscopy: a review. Postharvest Biol Technol. (2017) 46:99–118. doi: 10.1016/j.postharvbio.2007.06.024
15. Zhang C, Wu W, Zhou L, Cheng H, Ye X, He Y. Developing deep learning based regression approaches for determination of chemical compositions in dry black goji berries (Lycium ruthenicum Murr.) using near-infrared hyperspectral imaging. Food Chem. (2020) 319:126536. doi: 10.1016/j.foodchem.2020.126536
16. Chen H, Qiao H, Feng Q, Xu L, Lin Q, Cai K. Rapid detection of pomelo fruit quality using near-infrared hyperspectral imaging combined with chemometric methods. Front Bioeng Biotechnol. (2021) 8:616943. doi: 10.3389/fbioe.2020.616943
17. Badaró AT, Garcia-Martin JF, López-Barrera MDC, Barbin DF, Alvarez-Mateos P. Determination of pectin content in orange peels by near infrared hyperspectral imaging. Food Chem. (2020) 323:126861. doi: 10.1016/j.foodchem.2020.126861
18. Yang L, Gao H, Meng L, Fu X, Du X, Wu D, et al. Nondestructive measurement of pectin polysaccharides using hyperspectral imaging in mulberry fruit. Food Chem. (2021) 334:127614. doi: 10.1016/j.foodchem.2020.127614
19. Diago MP, Fernández-Novales J, Fernandes AM, Melo-Pinto P, Tardaguila J. Use of visible and short-wave near-infrared hyperspectral imaging to fingerprint anthocyanins in intact grape berries. J Agric Food Chem. (2016) 64:7658–66. doi: 10.1021/acs.jafc.6b01999
20. Yin W, Zhang C, Zhu H, Zhao Y, He Y. Application of near-infrared hyperspectral imaging to discriminate different geographical origins of Chinese wolfberries. PLoS One. (2017) 12:e0180534. doi: 10.1371/journal.pone.0180534
21. Wang Z, Erasmus SW, Liu X, van Ruth SM. Study on the relations between hyperspectral images of bananas (Musa spp.) from different countries, their compositional traits and growing conditions. Sensors. (2020) 20:5793. doi: 10.3390/s20205793
22. Gales O, Rodemann T, Jones J, Swarts N. Application of near infra-red spectroscopy as an instantaneous and simultaneous prediction tool for anthocyanins and sugar in whole fresh raspberry. J Sci Food Agric. (2021) 101:2449–54. doi: 10.1002/jsfa.10869
23. Huang H, Hu X, Tian J, Jiang X, Huang D. Rapid detection of the reducing sugar and amino acid nitrogen contents of daqu based on hyperspectral imaging. J Food Compos Anal. (2021) 101:103970. doi: 10.1016/j.jfca.2021.103970
24. Baek I, Lee H, Cho BK, Mo C, Kim MS. Shortwave infrared hyperspectral imaging system coupled with multivariable method for TVB-N measurement in pork. Food Control. (2021) 124:107854. doi: 10.1016/j.foodcont.2020.107854
25. Zhang WD, Cao AL, Shi PY, Cai LY. Rapid evaluation of freshness of largemouth bass under different thawing methods using hyperspectral imaging. Food Control. (2021) 125:108023. doi: 10.1016/j.foodcont.2021.108023
26. Borin A, Ferrão MF, Mello C, Maretto DA, Poppi RJ. Least-squares support vector machines and near infrared spectroscopy for quantification of common adulterants in powdered milk. Anal Chim Acta. (2006) 579:25–32. doi: 10.1016/j.aca.2006.07.008
27. Wang F, Wang C, Song S, Xie S, Kang F. Study on starch content detection and visualization of potato based on hyperspectral imaging. Food Sci Nutr. (2021) 9:4420–30. doi: 10.1002/fsn3.2415
28. Lan W, Wang S, Wu Y, Chen H, Yang J, Wei L, et al. A novel fluorescence sensing strategy based on nanoparticles combined with spectral splicing and chemometrics for the recognition of Citrus reticulata ‘Chachi’ and its storage year. J Sci Food Agric. (2020) 100:4199–207. doi: 10.1002/jsfa.10459
29. Galvão RK, Araujo MC, José GE, Pontes MJ, Silva EC, Saldanha TC. A method for calibration and validation subset partitioning. Talanta. (2005) 67:736–40. doi: 10.1016/j.talanta.2005.03.025
30. Saha D, Manickavasagan A. Machine learning techniques for analysis of hyperspectral images to determine quality of food products: a review. Curr Res Food Sci. (2021) 4:28–44. doi: 10.1016/j.crfs.2021.01.002
31. Huang L, Zhou Y, Meng L, Wu D, He Y. Comparison of different CCD detectors and chemometrics for predicting total anthocyanin content and antioxidant activity of mulberry fruit using visible and near infrared hyperspectral imaging technique. Food Chem. (2017) 224:1–10. doi: 10.1016/j.foodchem.2016.12.037
32. Chen X, Liu K, Cai J, Zhu D, Chen H. Identification of heavy metal-contaminated Tegillarca granosa using infrared spectroscopy. Anal Methods. (2015) 7:2172–81. doi: 10.1039/C4AY02396J
33. Liu Y, Long Y, Liu H, Lan Y, Long T, Kuang R, et al. Polysaccharide prediction in Ganoderma lucidum fruiting body by hyperspectral imaging. Food Chem X. (2021) 13:100199. doi: 10.1016/j.fochx.2021.100199
34. Ma H, Wang J, Chen Y, Cheng J, Lai Z. Rapid authentication of starch adulterations in ultrafine granular powder of Shanyao by near-infrared spectroscopy coupled with chemometric methods. Food Chem. (2017) 215:108–15. doi: 10.1016/j.foodchem.2016.07.156
35. Shao Y, Shi Y, Qin Y, Xuan G, Li J, Li Q, et al. A new quantitative index for the assessment of tomato quality using Vis-NIR hyperspectral imaging. Food Chem. (2022) 386:132864. doi: 10.1016/j.foodchem.2022.132864
36. Ouyang Q, Wang L, Park B, Kang R, Chen Q. Simultaneous quantification of chemical constituents in matcha with visible-near infrared hyperspectral imaging technology. Food Chem. (2021) 350:129141. doi: 10.1016/j.foodchem.2021.129141
37. Fatchurrahman D, Nosrati M, Amodio M, Chaudhry M, de Chiara M, Mastrandrea L, et al. Comparison performance of visible-NIR and near-infrared hyperspectral imaging for prediction of nutritional quality of goji berry (Lycium barbarum L.). Foods. (2021) 10:1676. doi: 10.3390/foods10071676
38. Ru C, Li Z, Tang R. A hyperspectral imaging approach for classifying geographical origins of rhizoma atractylodis macrocephalae using the fusion of spectrum-image in VNIR and SWIR ranges (VNIR-SWIR-FuSI). Sensors. (2019) 19:2045. doi: 10.3390/s19092045
39. Srinuttrakul W, Mihailova A, Islam MD, Liebisch B, Maxwell F, Kelly SD, et al. Geographical differentiation of Hom Mali rice cultivated in different regions of Thailand using FTIR-ATR and NIR spectroscopy. Foods. (2021) 10:1951. doi: 10.3390/foods10081951
40. Fu HY, Wei LN, Chen HY, Yang XL, Kang LP, Hao QX, et al. Combining stable C, N, O, H, Sr isotope and multi-element with chemometrics for identifying the geographical origins and farming patterns of Huangjing herb. J Food Compos Anal. (2021) 102:103972. doi: 10.1016/j.jfca.2021.103972
41. Wang R, Wei X, Wang H, Zhao L, Zeng C, Wang B, et al. Development of attenuated total reflectance mid-infrared (ATR-MIR) and near-infrared (NIR) spectroscopy for the determination of resistant starch content in wheat grains. J Anal Methods Chem. (2021) 2021:5599388. doi: 10.1155/2021/5599388
42. Ambrose A, Kandpal LM, Kim MS, Lee WH, Cho BK. High speed measurement of corn seed viability using hyperspectral imaging. Infrared Phys Technol. (2016) 75:173–9. doi: 10.1016/j.infrared.2015.12.008
Keywords: red raspberry, hyperspectral imaging, chemometrics, nutrients content, geographic origin, prediction
Citation: Wang Y, Zhang Y, Yuan Y, Zhao Y, Nie J, Nan T, Huang L and Yang J (2022) Nutrient content prediction and geographical origin identification of red raspberry fruits by combining hyperspectral imaging with chemometrics. Front. Nutr. 9:980095. doi: 10.3389/fnut.2022.980095
Received: 28 June 2022; Accepted: 30 September 2022;
Published: 17 October 2022.
Edited by:
Pu Hongbin, South China Agricultural University, ChinaReviewed by:
Guantao Xuan, Shandong Agricultural University, ChinaCopyright © 2022 Wang, Zhang, Yuan, Zhao, Nie, Nan, Huang and Yang. This is an open-access article distributed under the terms of the Creative Commons Attribution License (CC BY). The use, distribution or reproduction in other forums is permitted, provided the original author(s) and the copyright owner(s) are credited and that the original publication in this journal is cited, in accordance with accepted academic practice. No use, distribution or reproduction is permitted which does not comply with these terms.
*Correspondence: Jian Yang, eWFuZ2NoZW0yMDEyQDE2My5jb20=; Luqi Huang, aHVhbmdsdXFpMDFAMTI2LmNvbQ==
†These authors have contributed equally to this work and share first authorship
Disclaimer: All claims expressed in this article are solely those of the authors and do not necessarily represent those of their affiliated organizations, or those of the publisher, the editors and the reviewers. Any product that may be evaluated in this article or claim that may be made by its manufacturer is not guaranteed or endorsed by the publisher.
Research integrity at Frontiers
Learn more about the work of our research integrity team to safeguard the quality of each article we publish.