 Vandana Chaudhary1
 Priyanka Kajla2*
 Aastha Dewan2
 R. Pandiselvam3*
 Claudia Terezia Socol4*
 Cristina Maria Maerescu4
- 1College of Dairy Science and Technology, Lala Lajpat Rai University of Veterinary and Animal Sciences, Hisar, India
- 2Department of Food Technology, Guru Jambheshwar University of Science and Technology, Hisar, India
- 3Division of Physiology, Biochemistry and Post-Harvest Technology, ICAR–Central Plantation Crops Research Institute, Kasaragod, India
- 4Department of Genetics, University of Oradea, Oradea, Romania
Milk and milk products, meat, fish and poultry as well as other animal derived foods occupy a pronounced position in human nutrition. Unfortunately, fraud in the food industry is common, resulting in negative economic consequences for customers as well as significant threats to human health and the external environment. As a result, it is critical to develop analytical tools that can quickly detect fraud and validate the authenticity of such products. Authentication of a food product is the process of ensuring that the product matches the assertions on the label and complies with rules. Conventionally, various comprehensive and targeted approaches like molecular, chemical, protein based, and chromatographic techniques are being utilized for identifying the species, origin, peculiar ingredients and the kind of processing method used to produce the particular product. Despite being very accurate and unimpeachable, these techniques ruin the structure of food, are labor intensive, complicated, and can be employed on laboratory scale. Hence the need of hour is to identify alternative, modern instrumentation techniques which can help in overcoming the majority of the limitations offered by traditional methods. Spectroscopy is a quick, low cost, rapid, non-destructive, and emerging approach for verifying authenticity of animal origin foods. In this review authors will envisage the latest spectroscopic techniques being used for detection of fraud or adulteration in meat, fish, poultry, egg, and dairy products. Latest literature pertaining to emerging techniques including their advantages and limitations in comparison to different other commonly used analytical tools will be comprehensively reviewed. Challenges and future prospects of evolving advanced spectroscopic techniques will also be descanted.
Introduction
Food adulteration, which means the incorporation of inferior quality ingredients/components or the elimination of important dietary constituents, is certainly a traditional practice of producing food. When it comes to choosing food commodities, consumers require accurate and unbiased information. Consumer preferences are typically influenced by lifestyle, and socio-economic factors like vegetarians prefer eating fresh organic produce, while some non -vegetarians abstain from eating pork and certain portions of muscle foods, and obviously, the health concerns as the person suffering from different types of food intolerances and allergies will refrain from concerning food products. Consumer knowledge has grown to the point that commercially oriented adulteration is now recognized as a severe public health threat (1). Adulteration in food commodities can emanate by substituting an ingredient/constituent with cheap and inferior quality ingredients incorporating illicit substances, arbitrarily prolonging shelf stability, stating misleading processes, spreading misinformation about ingredients, and falsifying records about manufacturing origin (2). Food authenticity refers to the process of assessing food for quality, safety, and acquiescence with label information, customer protection legislation, and technical specifications (1). The growing availability of various food products, as well as incidents of adulteration resulting in significant pecuniary losses and negative impact on human well-being, has sparked widespread apprehension about food falsification’s huge detrimental impact on the worldwide chain of food supply. Market globalization has expanded food variety due to exchange among domestic and international markets from different regions around the globe to an extent where ascribability in the food production chain, as well as transportation, has been compromised. Consequently, food authentication is becoming a perilous apprehension in the arena of the food sector, as end-product value is affected by the actions of growers, business operators, manufacturers, customers, and all others engaged directly or indirectly involved in processing, storage, distribution and finally consumption. Food processors and business operators have to abide by labeling guidelines, which oblige them to disclose the main ingredients within every commodity. Customer’s value readily construed quality indicators like certified quality labels, territorial indications, or guarantee assurance seals, as well as necessary standard information like best before dates. Authentication techniques for food are designed to distinguish between fake and original commodities, eliminate prejudicial competition in the marketplace, and keep away consumers from fraud. To meet customer and food safety requirements, researchers are looking at creating and designing of effective techniques for detection of food adulteration and frauds. The efforts about the prevention of food are mostly centered on tracking the complete food supply chain right from raw material selection to processing, storage, and distribution. However, numerous traditional food risk, as well as fraud assessment methodologies, be unsuccessful in sleuthing or envisaging food authentication. Recently, varied spectroscopic techniques have emerged as a promising approach to resolving the issue of food authentication and fraud recognition. Near-infrared (NIR), mid-infrared (MIR), Fourier transform infrared (FTIR), nuclear magnetic resonance (NMR) or Raman spectroscopy, or hyperspectral imaging, are some of the spectroscopic techniques employed for food authentication so far (3) (Table 1).
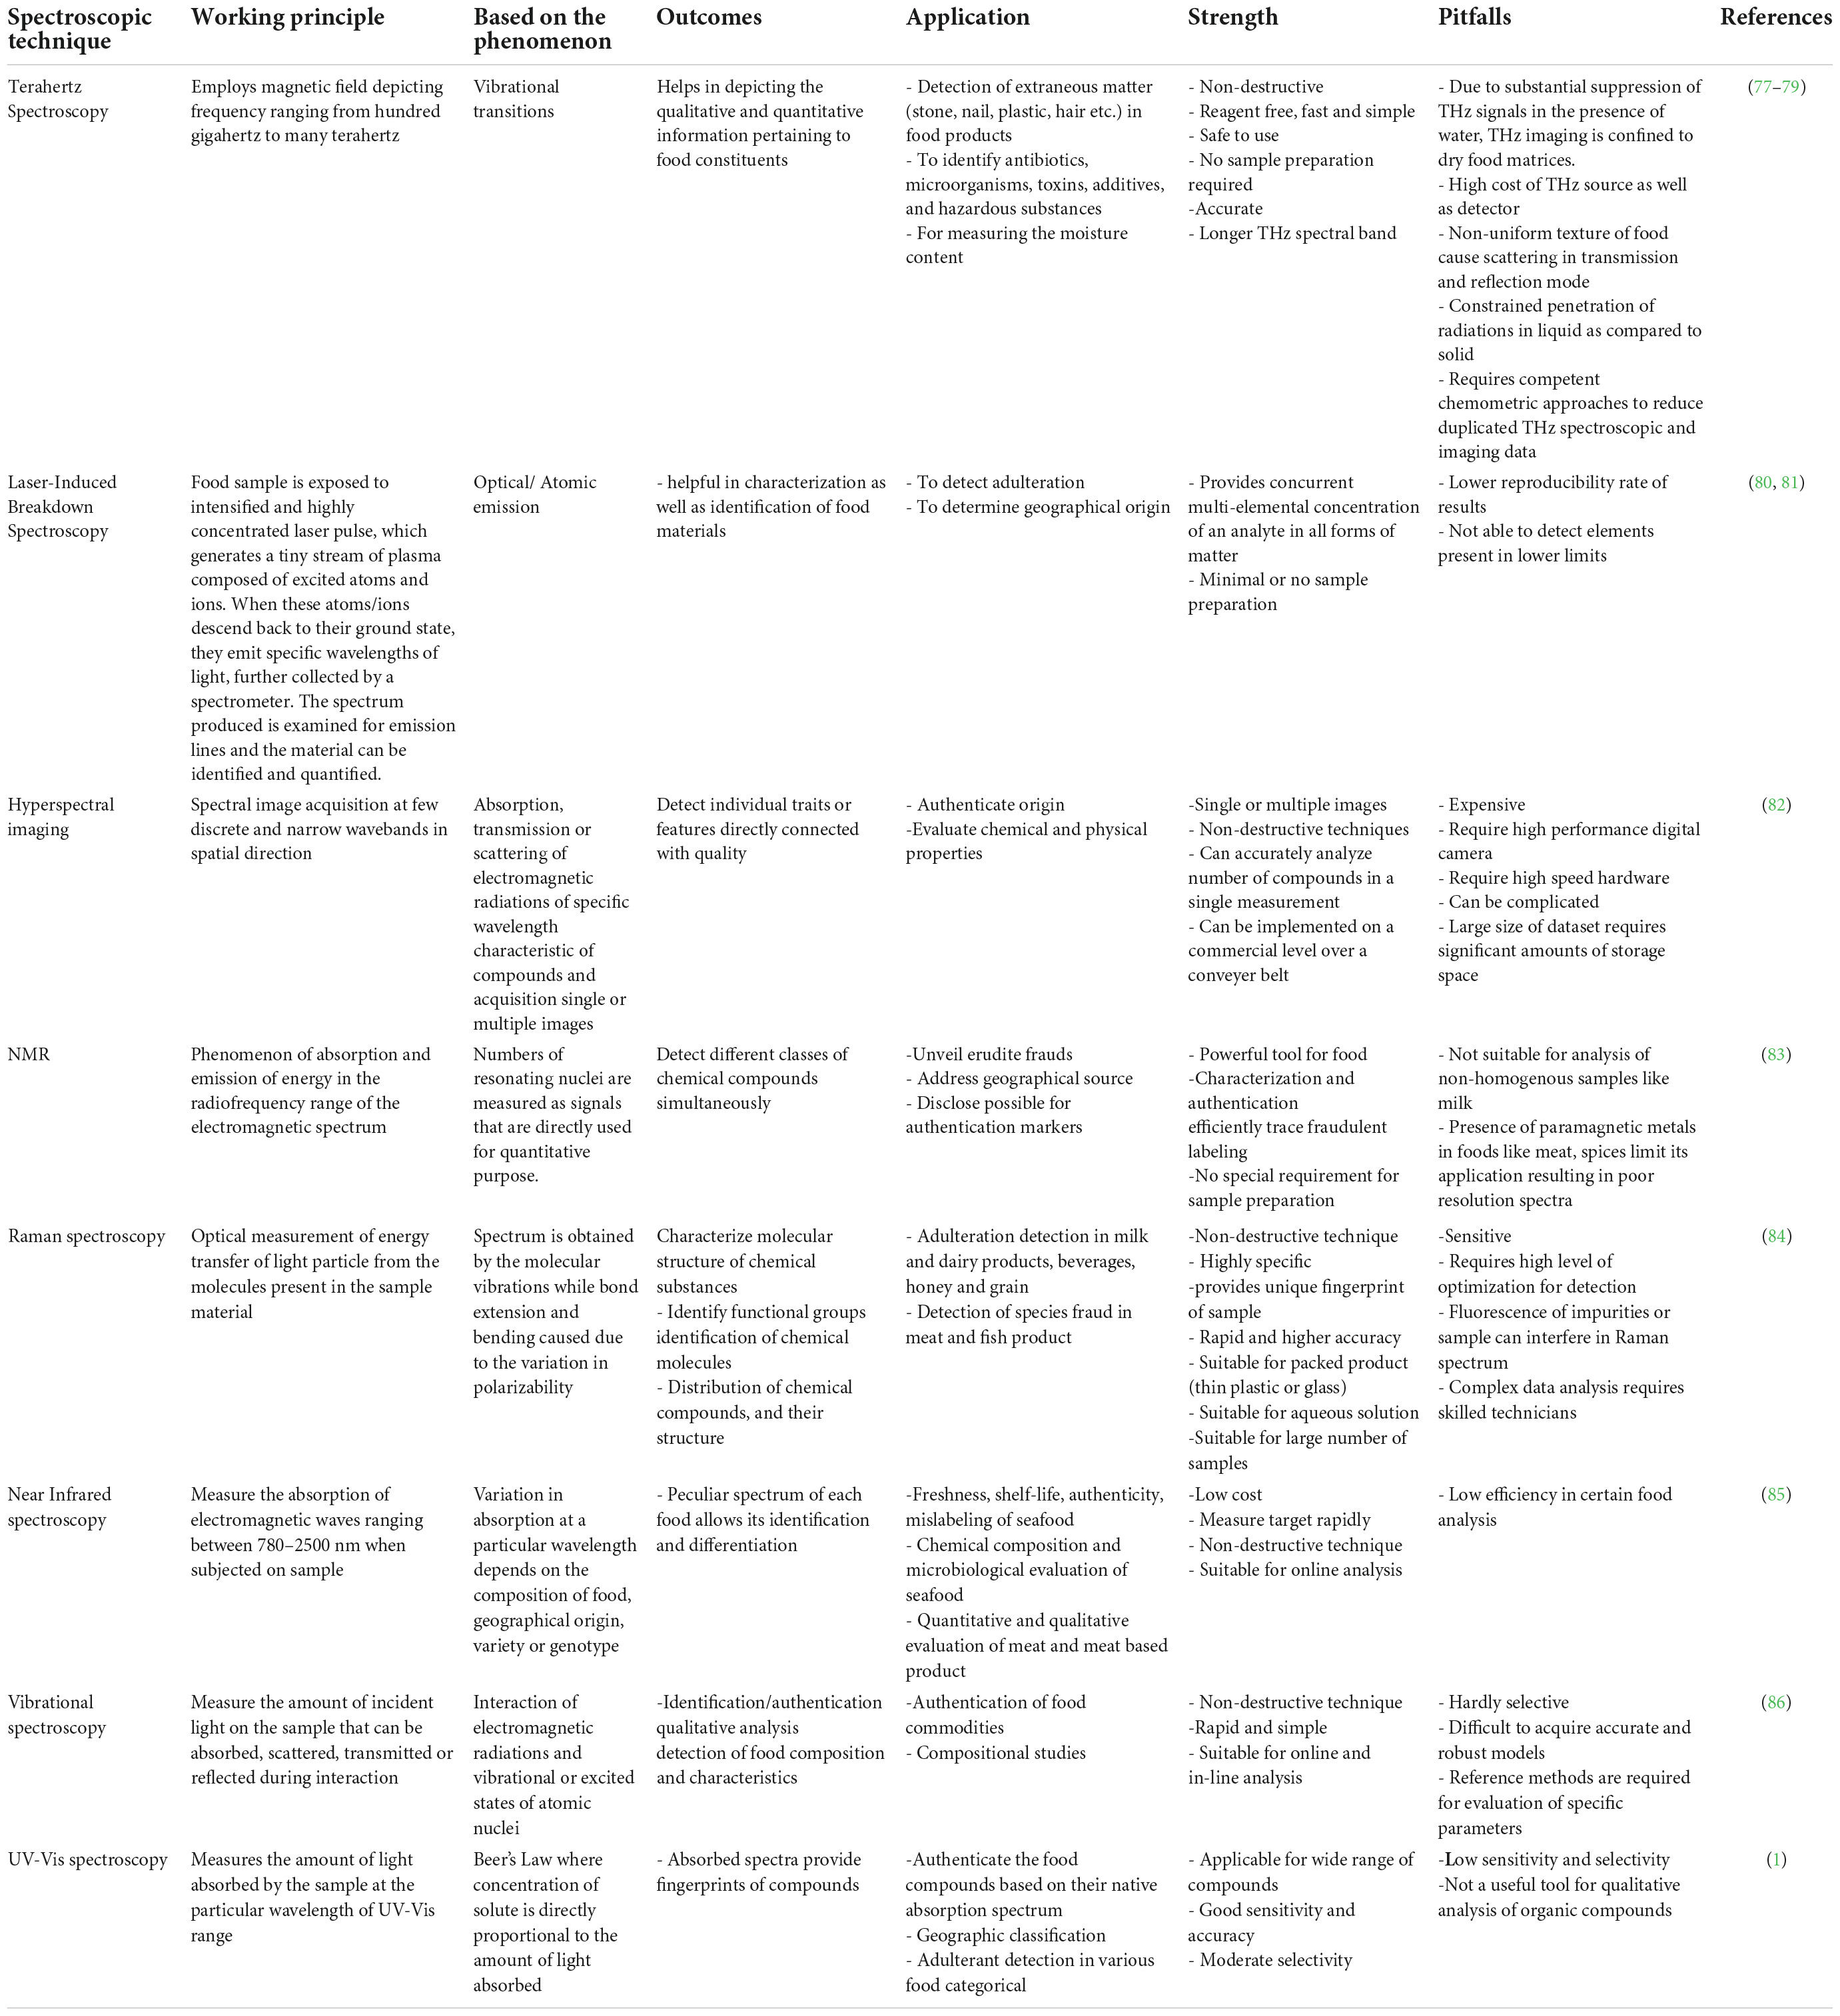
Table 1. Various spectroscopic techniques applied for animal origin food authentication and adulteration with their strength and pitfalls.
Large volume of experimentation data is obtained from food experiments either in quantitative or in qualitative form. Maneuvering of such large quantity of data utilization of multivariate statistical tools has been increasingly embraced by food technologists. Chemometrics, is typically used when the dataset is substantial and complex in regard to number of samples, types as well as responses. The outcomes are applied for food authentication in regard to geographical origin, food fraud or to track adulteration in different food products. Additionally, chemometrics is helpful in bridging the gaps in transdisciplinary data required for sound scientific conclusions. A significant amount of information is generated by spectroscopic methods, which can be effectively utilized by applying multivariate mathematical and statistical (chemometric) methods (4). This review investigates the feasibility and potency of different non-destructive methods for animal based food commodities authentication that have the possibilities to contribute the dairy, meat, seafood and poultry processing industry with reliable and accurate real-time monitoring in short span. As a result, the purpose of this compiled literature is to provide an insight into current non-destructive spectroscopic technologies for animal based processed product authentication.
Latest spectroscopic techniques used for authentication of animal origin foods
Terahertz spectroscopy
Terahertz (THz) spectroscopy is gaining traction as a valuable method for food authentication in the field of food technology and processing. It assesses the properties of matter under an electromagnetic field. Terahertz refers to the region of electromagnetic radiation spanning in between microwave and infrared (IR) region (far IR). It is represented by a frequency lying between 0.1–10 THz, which corresponds to wavelengths from 3000 to 30 μm (5). THz may be accredited by different terminologies such as T-waves, terahertz gap, terahertz light, terahertz waves, T-lux., or T-light. THz wave explorations and utilization are still in their inception stage when compared to the comparatively well-developed and widely used conventional spectroscopic and imaging techniques. There are three types of THz spectroscopy, namely THz time-domain spectroscopy (THz-TDS), time-resolved THz spectroscopy (TRTS) and THz emission spectroscopy (TES) (6). A typical THz system comprises of a source, sample and a detector (Figure 1A). With the evolvements of THz sources and detectors in recent decades, this approach has shown significant promise as a novel and powerful non-destructive technique for real-time monitoring and quality control of food processes (7). The THz wave have the luxury of being able to be transmitted through substances opaque to visible light and having a photon energy of 1–100 meV, which is within the critical energy range for various materials and biomolecules. Numerous chemical compounds and microbial components have distinct spectrum patterns at THz frequencies, which can be utilized to identify and quantify these threats. A lot of physical phenomena for instance vibrational and rotational energy levels, phonon of biological macromolecules like DNA and protein are in the scope of THz waves frequency range which can reveal molecular interactions in food compounds generated by the formation of hydrogen bonds, van der waal’s force as well as because of hydration (8, 9). In the food sector, THz spectroscopy is used to identify antibiotics, microorganisms, toxins, additives, and hazardous substances.
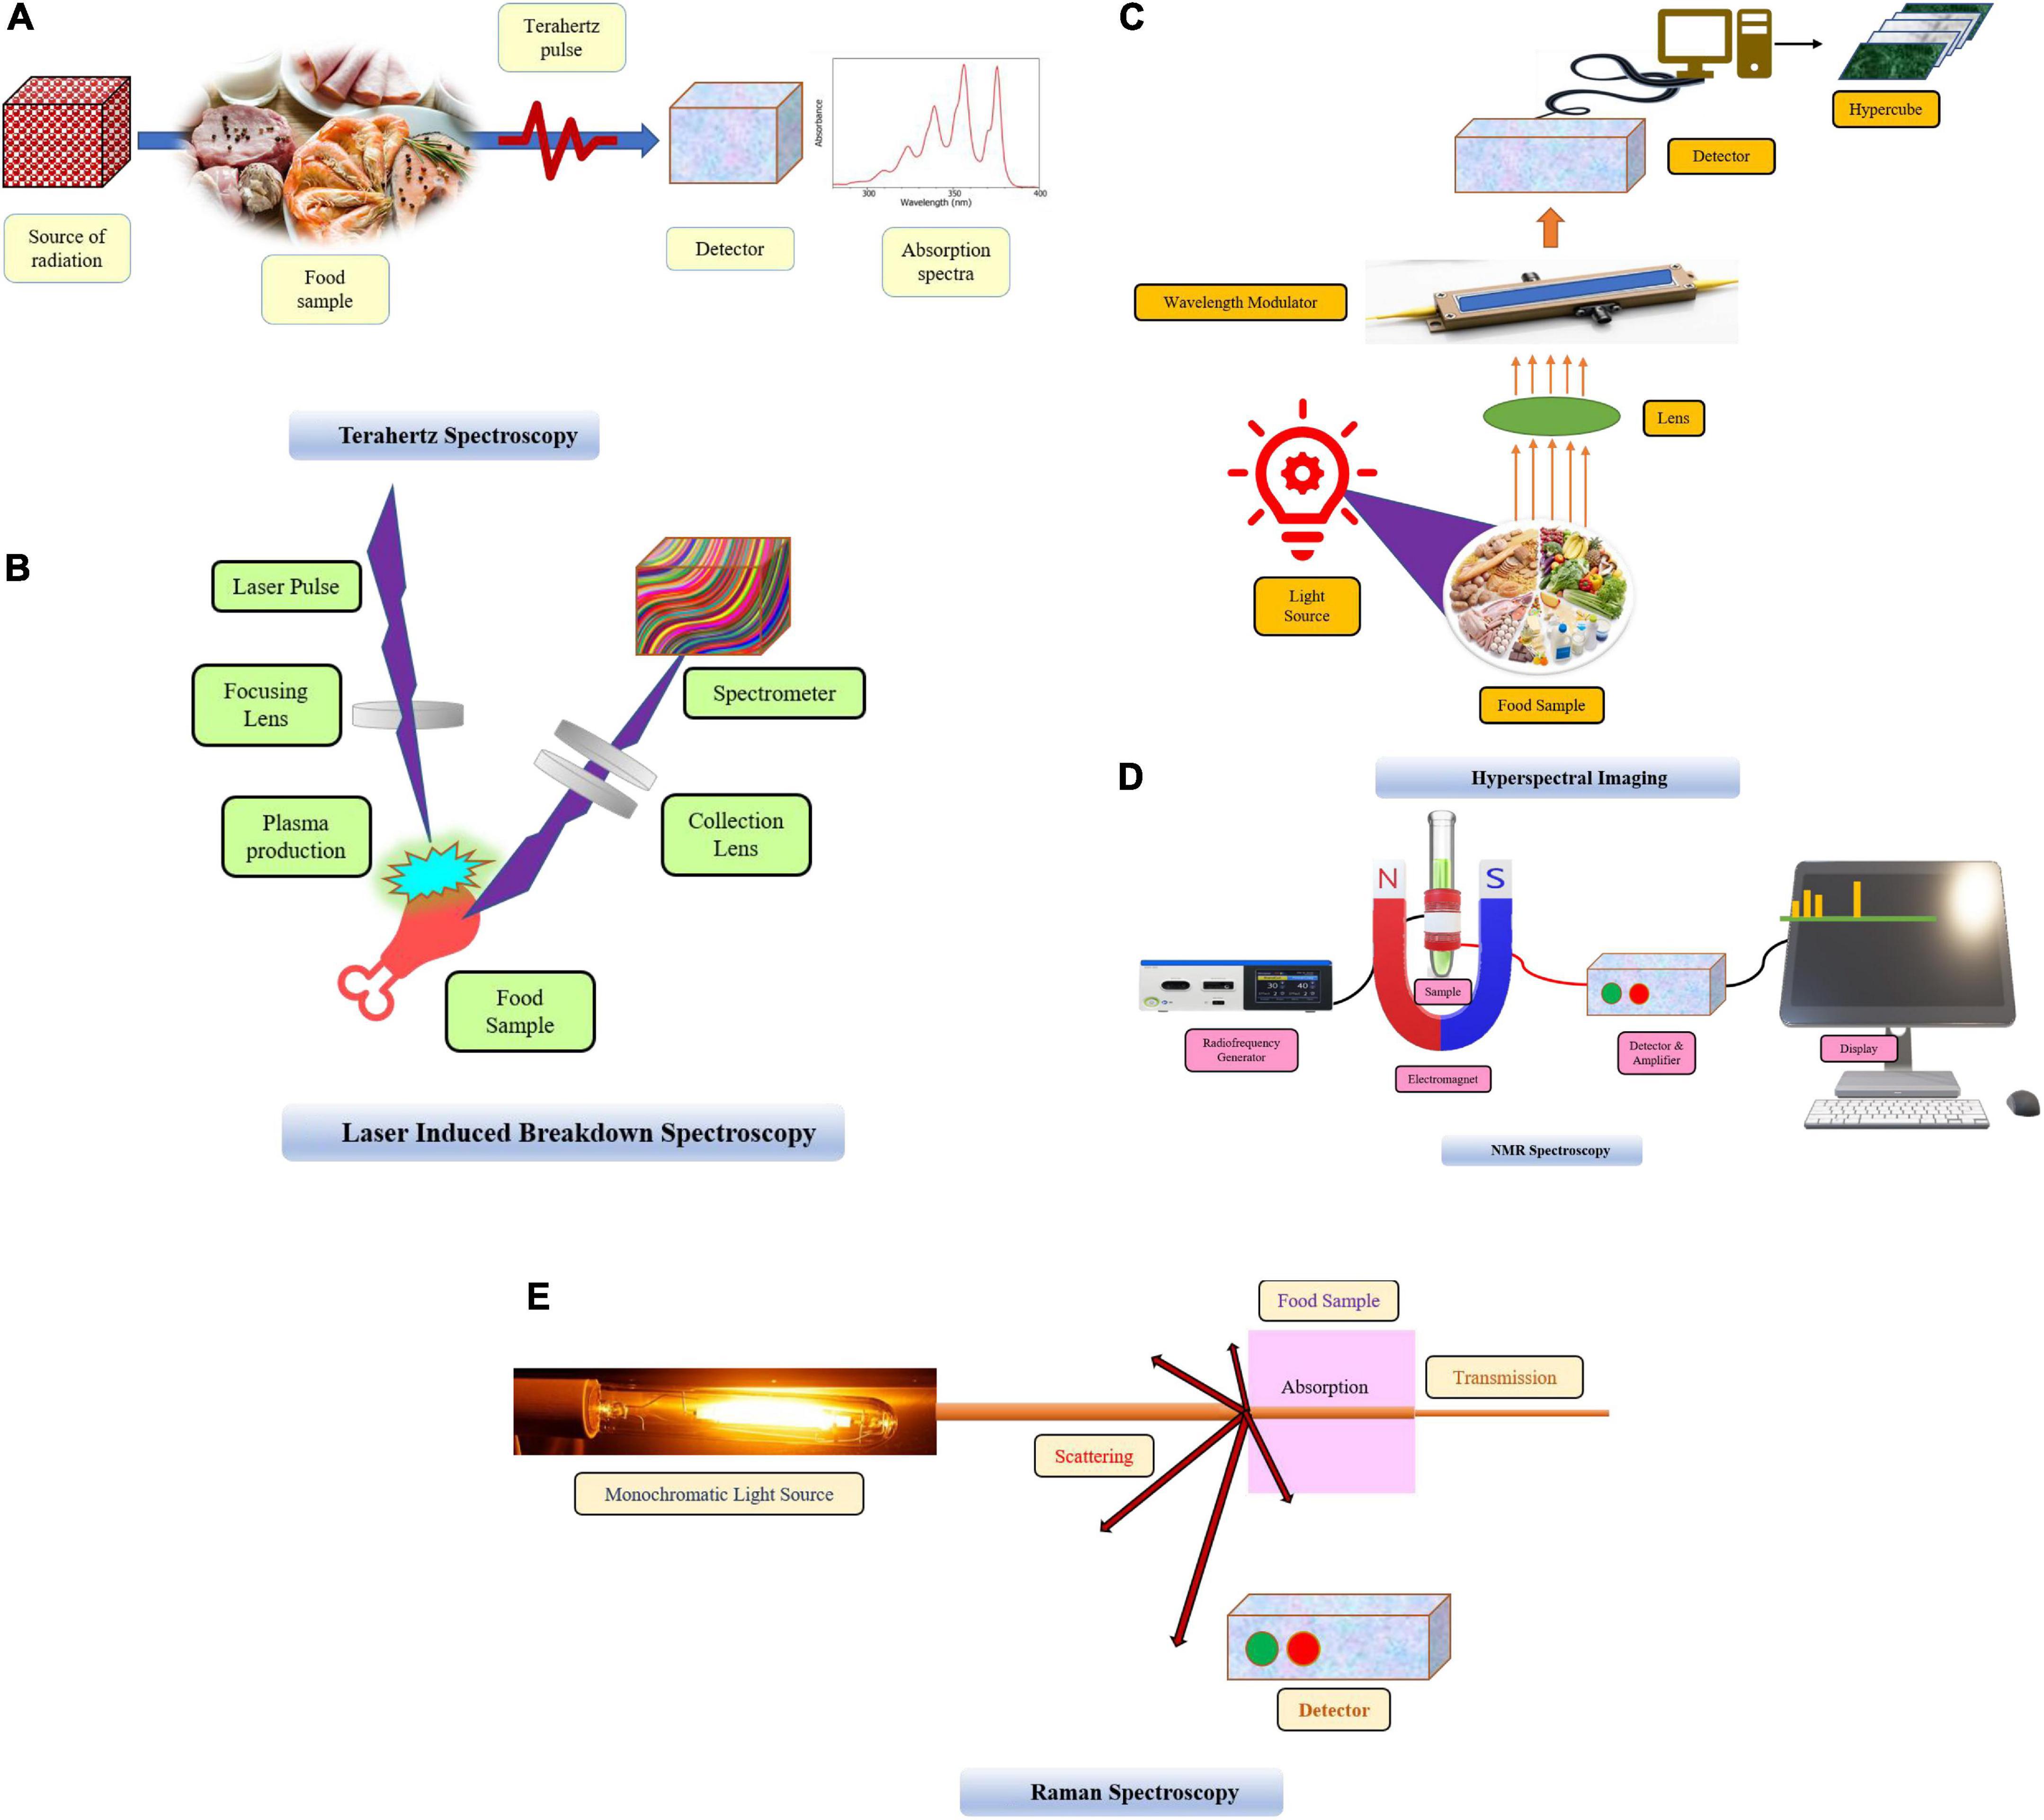
Figure 1. (A) Terahertz spectroscopy. (B) Laser induced breakdown spectroscopy. (C) Hyperspectral imaging. (D) NMR spectroscopy. (E) Raman spectroscopy.
In comparison to established, traditional identification methods, THz spectroscopy technique may effectively discriminate between distinct contaminated dairy products on the basis of their fatty acid profile sparing the need for sample pretreatment (10). Freshness is considered a very important parameter to adjudge the quality of pork in meat industry, by using K-value index. THz spectroscopy in attenuated total reflectance mode was practiced to predict the K-value of eighty samples of pork with a frequency resolution of 7.6 GHz, without causing any harm to its native structure. Prediction models were developed using multivariate statistical techniques including PCR’s linear regression methods and BP-non-linear ANN’s method. The results demonstrated that THz spectroscopy, in conjugation with a prediction model, can efficiently determine pork freshness. Also, it was found that the THz spectra of fresh pork lies in between 0.2∼2 THz (11). THz technology has been used successfully in the non-destructive diagnosis of toxic substances, food pathogens as well as hazardous components in food. A number of studies demonstrated that using THz in conjunction with chemometric techniques, hazardous and toxic compounds in food samples can be quickly identified and measured in even less than 5 s. The limit of detection of the approach still requires enhancement despite the most recent advancements in the quantification of toxic substances utilizing THz spectroscopy. Sometimes it may also mistakenly identify toxic samples in neutral samples even if they are absent in the samples. By utilizing time-dependent THz pulse spectrum analysis, this drawback could be eliminated (12). This technology has ingrained avid utilization, as a potent instrument with excellent detection and quantification capabilities.
Laser induced breakdown spectroscopy
Laser induced breakdown spectroscopy (LIBS) was introduced and recommended as food analytical technique as soon as the laser was discovered in 1960. Basic principle of LIBS is based on the interaction of an intense and strong beam of laser with the food sample, causing dielectric breakdown with the generation of hot plasma. Plasma constitutes atoms, molecules, electrons, and ions with energy higher than their ground state. When these molecular species return back to their ground state, they emit specific radiations, which is further detected by a spectrometer providing identification and quantitative statistics of the elements contained in the sample (13) (Figure 1B). LIBS is commonly used to analyze a spectrum spanning the wavelength range of 190 to 850 nm.
Initially LIBS was utilized for industrial (14), space (15), cultural heritage (16), and environmental (17, 18) applications. But very recently, integration of LIBS for food authentication has drawn a lot of attention of scientific fraternity. It may be employed for the detection of adulterants and heavy metals in food products and also to ascertain the geographical origin of food (19, 20). For quick and element characterization of milk a LIBS technique was devised. To achieve precise and reliable recognition of diverse adulterated milk powders, traditional machine learning methods and convolutional neural networks (CNN) were exploited. Among the four machine learning programs (support vector machines, linear discriminant analysis, random forest (LDA), and k-nearest neighbor), combination of LIBS with CNN emerged as uncomplicated, reliable, and authentic approach for the identification of adulterants (21). In another experiment, LIBS was used to identify meat species on the basis of their element compositional differences. In the experiment, meat from different species including poultry, beef and pork were intermingled and processed into pallets and were exposed to LIBS treatment. The laser used to ablate the samples at primary wavelength of 1064 nm. Q switched mode with pulse width and rate of repetition of 4 Hz, a gate delay of 300 ns, and an integration time of 1.05 ms. Energy involved per pulse was 38 mJ. The spectra obtained were analyzed using statistical and mathematical methods. It was deduced that R2 (coefficient of determination) value and limit of detection (LOD) for chicken and pork adulterated beef were 0.999, 2.0, and 0.994, 4.4%, respectively (22). Similarly, LIBS was employed to identify milk fraud in thirteen samples both of caprine and bovine and fourteen samples ovine milk samples based on their elemental makeup. Laser operation was done in Q switched mode with rate of repetition, gate delay and an integration time of 8Hz, 650 ns and 1.05 ms, respectively. The spectra obtained from LIBS was assessed using Principal Component Analysis (PCA)to classify pure and contaminated milk samples, and partial least square regression (PLSR) was used to calculate the ratio of adulteration. The samples of milk were transformed into gel to avoid splashing and low intensity of emission. It was demonstrated from the results that R2 and LOD value for ovine and caprine milk adulterated with bovine milk were 0.996, 1.29, and 0.995, 1.9%, respectively (23). This method’s relevance for authentication purposes would grow if it had higher sensitivity for minor and trace minerals with extremely low concentrations in a complex organic matrix. Thus, it can be inferred from the foregoing discussion that LIBS can provide chemical analysis in situ without sample preparation, in a quasi non-destructive way, which can be employed in a variety of foods for authentication.
Hyperspectral imaging
Hyperspectral imaging technique is fusion of spectroscopic approach with imaging which has emerged as a non-invasive identification/detection technique for food quality authentication that express prodigious spatial and spectral data for many samples simultaneously (24). Using this imaging technique the compositional and morphological characters description of a sample can be analyzed by capturing images from different spatial directions (25) (Figure 1C). Hyperspectral imaging (HSI) has certain advantages in comparison to traditional spectroscopic technologies in that complete spatial information can be drawn by this while other spectroscopic techniques including NIR provide the spectral information about an entire sample in a single spectrum, but it does not provide spatial information. HIS merge spatial and spectral details in providing the visual representation of elements inside a sample to be assessed (26, 27). This technique was first used in the 1980s using a combination of digital imaging and spectroscopy by Goetz, Vane (28). Now, this technique is widely employed in the agriculture, food, and pharmaceutical sector.
Hyperspectral images are made up of hypercubes, which are 3-D data cubes made up of many consecutive spectral bands for each spatial point of a sample (29, 30). An alike spectrum exists for each pixel displayed in an image. Each spectrum can function similarly to a biochemical fingerprint or signature allowing the recognition of chemical components of a given sample to be identified and characterized (31, 32). HIS, as opposite to NIR spectroscopy, can analyze the dispersal of multiple chemical components in a sample. This makes it possible to analyze mixed samples and identify the chemical components that make up the sample (27).
Near-infrared–hyperspectral imaging system consists of camera for image capturing, spectra analyzer, detector, illuminator and translator, all connected to a computer system (33). Whiskbroom (Diffusion of substances) imaging known as point scanner, push-broom (movement) imaging termed as linear scanner, and stare down imaging also called as wavelength scanner are three imaging modes or methods for producing a hyperspectral image of a sample from different angles (30).
The whiskbroom configuration enables hypercube retrieval by scanning every point of a sample while rotating either the sample or the detectors in the different spatial directions. This method achieves images with excellent spatial resolution, making it ideal for microstructural scanning (34). Based on the field and amplification a single image acquisition can be accomplished within 20 s using the push-broom arrangement (35). Using a 2-D detector spatial and spectral data can be collected and recorded line-by-line, making it ideal for at-line or online conveyor belt applications (36). The spectrophotometer and the sample remain at rest in the stare down position and image of the whole purview is recorded. Using one wavelength range at a time, the HSI technique collects a series of images. Using a big pile of photographs known as a hypercube, recorded images are combined to create final 3 D image (30).
Electromagnetic radiation is generally reflected, scattered, absorbed, or emitted by all biological materials. For each wavelength, different materials have prototype interaction with light. HSI is built on this framework. The discrepancies in their chemical makeup and fundamental structure are responsible for this phenomenon (37). A spectrum signature/fingerprint is a distinctive pattern representative to particular material which is created upon interaction with the light. The typical spectral signature obtained is thereby utilized to distinguish across sample kinds and classes by identifying, characterizing, and differentiating them (37). Interferences in spectroscopic data are frequently generated by scattering due to the surface heterogeneities (Williams). Therefore, before obtaining the most relevant analytical information, spectral pre-processing is usually preferred to remove particular non-chemical deviations or biasness from the obtained spectra. The data is then submitted to advanced chemometric algorithms as a process of extracting the most useful information from the data matrix and highlighting any potential discrepancies between the samples (29).
Hence, this technique has enabled the comprehensive categorization, characterization, and detection of adulterants and the best authentication approach applicable to a wide range of food products, including milk, yogurt and eggs, when used in collaboration with appropriate chemometric models. Adulteration with horsemeat in comminuted beef samples can be identified using a combination of visible near-infrared and hyperspectral imaging systems, according to Kamruzzaman, Makino (38). Using PLSR model, four wavelengths were chosen for the study: −515, 595, 650, and 880 nm. With an R2 value of 0.98, the level of horsemeat adulteration was accurately predicted. The researchers found that the HSI technology, in combination with VIS-NIR spectroscopies, can be utilized to identify adulteration in minced beef in a swift and non-destructive manner. Similarly, Zheng, Li (39) used VIS-NIR and hyperspectral imaging to detect duck meat adulteration minced lamb meat samples. The PLSR model was used to choose fourteen wavelengths, resulting in a successful model performance with an R2 value of 0.99. Adulteration of comminuted beef with pork can be detected using hyperspectral imaging, along with researchers reported that this technique also successfully discriminated between pure beef and pork samples from the adulterated ones (40). HIS can also be used to detect counterfeiting in honey samples and to verify the authenticity of pure honey obtained from bees, according to another study (41).
Nuclear magnetic resonance spectroscopy
For quality management and the tracking of counterfeit labeling, nuclear magnetic resonance spectroscopy has proven to be an effective approach for authenticating foods throughout the food chain, i.e., from raw ingredients to finished products. NMR spectroscopy is quantitative in which the area of an NMR signal is directly proportional to the number of nuclei produced under specified conditions, and numerous nuclei can be employed for analysis of samples for identification and classification (42, 43) (Figure 1D). Initially, NMR applications in food were confined only to low-resolution moisture analysis; however, as technology advanced, high-resolution investigations of solid as well as liquid samples can be easily performed for structural and compositional characterization, categorization, and authentication (44) and this also aids in interactions of food components at molecular levels (45, 46). NMR analysis has excellent applicability in analyzing heterogeneous food systems, which is attributed to its non-destructive nature, high precision, and better reproducibility, as well as no special preparation of samples, is required. Jakes, Gerdova (47) research provides efficient applicability of NMR spectroscopy to identify and detect beef from horse meat. Analysis of lipid components by using low field NMR in beef and horse samples revealed enough differences to allow classification models to be developed. By reviewing the research investigations, it can be concluded that NMR has emerged as a potential tool for authentication of animal based foods.
Raman spectroscopy
Raman spectroscopy is a non-destructive spectroscopic technique that uses light scattering to produce shifted energy frequencies. Raman signals are produced by the inelastic scattering of light from samples to be analyzed, with the consequent frequency shift revealing the stretching vibrations involved (48) (Figure 1E). The resulting spectra can be used to generate a fingerprint of a typical molecule which can be used to compare molecules in different samples and to perform structural and qualitative characterizations (49). Effortless, convenient and rapid approaches for authenticity and adulteration detection for different food categories have been developed using NIR, Raman, and, most notably, MIR spectroscopy (Table 1).
Zhao, Downey (50) conducted studies for adulteration detection in comminuted meat products with beef offals using dispersive Raman spectroscopy alone with multivariable data analysis. PLS-DA was used to evaluate the spectral data for assessing authentication of beef burger samples made according to market formulae by examining the adulteration levels in offal-adulterated and original beef burgers. With excellent accuracy, PLS-DA models correctly recognized legitimate and contaminated samples. PLS regression models also enabled the quantification of total offal and amount of extra fat in the samples. Li, Shan (51) employed Raman spectroscopy in combination with chemometrics and attempted to identify adulterants like added sweeteners viz., high fructose corn and maltose syrup in natural honey. Raman spectroscopy in combination with PLS–LDA efficiently detected the samples adulterated with high fructose corn syrup vs. authentic honey with an accuracy of 91.1% while 97.8% accuracy was detected for adulteration of honey with maltose syrup against pure honey samples. However the classification honey adulterants whether high fructose corn syrup or maltose syrup using chemometric tool PLS-LDA gave total accuracy of 84.4%.
As water seems to have a minor influence on the Raman spectrum, it can directly measure aqueous solutions, and the sample preparation is also very simple, which makes the Raman spectrum as an advanced approach for checking adulteration and authentication of milk. The use of Raman spectroscopy and chemometrics to differentiate milk powder samples resulted in chemical fingerprints for distinct types of milk powder (50, 52). A portable Raman spectrometer was used to perform online melamine measurements in milk powder. The milk powder samples were fortified with 3, 5, and 10% melamine against blank for real sample detection using Raman spectrum ranging from 450–1050 cm–1. Melamine had a detection limit of 0.13 percent using PLS modeling at Raman peak positions at 673 and 982 cm–1 (53). When Raman signal processing is improved, melamine detection can be done even if it is present in trace amounts. The presence of fluorescent molecules in the sample might affect the generated spectra which interferes the correct representation of the results. The handling of instruments is quiet sensitive as well as the interpretation of the data obtained requires the proper knowledge for the same, otherwise it might lead to the wrong interpretation of the results.
Near-infrared- and mid-infrared spectroscopy
Vibrational spectroscopy analyzes and measures molecular and rotational vibrations caused owing to absorption of infrared light by solid, liquid, or gaseous samples (54). Vibrational spectroscopic techniques for food authentication include techniques- Near-Infrared (NIR) and Mid-Infrared Spectroscopy (MIR). Near-infrared (780–2500 nm), mid-infrared (2500–25,000 nm), and far-infrared (25,000–200,000 nm) are the three sub-regions of the IR region of the electromagnetic spectrum (1). In the MIR domain, the absorption spectra of molecules with functional groups with O–H, C–H, C = O, and N–H correspond to fundamental stretching, bends, and rotational movements (1, 55).
Infrared instruments are typically made up of the different components: a source of light, a great system for the selection of wavelength, a detector, and a signal amplifier/magnifier, which are attached to a computer system for analysis of the generated spectra (56). Even though both methods are extensively utilized, they each have their own merits and disadvantages, which help them, improve for specific applications. These approaches have the advantage of being non-destructive and generally, no sample preparation is required (56). Another benefit of NIR over MIR spectroscopy is the capability to detect reflectance. When it comes to sampling, some NIR devices allow the rotation of a sample while scanning it. As a result, NIR spectroscopy is a suitable choice for measuring heterogeneous food materials (57). MIR spectroscopy, on the other hand, has been demonstrated to perform best with small amounts and homogeneous samples, making trace material detection more challenging.
The primary vibrational bands corresponding to the functional/chemical groups present sample are measured using MIR spectroscopy (Abbas et al. (55); Esteki et al.) (1). The spectra produced by these primary bands are suitable for detecting the composition of samples and identification based on specific MIR fingerprints. On the other hand, NIR spectroscopy generates very complicated spectra. The NIR area is distinguished by broad, wide, and overlapped spectral bands. These attributes make identifying distinct chemical species difficult among different samples (Workman) (58). Another drawback of this approach seems to be that the quantitative data obtained can be influenced by a myriad of compositional or structural variables (59). Multivariate data analysis approaches have been designed to minimize extracted data from spectra generated by NIR. Chemometrics is therefore important to analyze the spectrum data and interpret it correctly. Preprocessing techniques aids in removing the unwanted variations or technical conformations from raw data which can further be improved by using chemometric tools.
Pure chopped beef was differentiated from those contaminated with organ meats (kidney and liver) using MIR spectroscopy in combination with chemometrics where the SIMCA model differentiated pure and adulterated beef with 92% accuracy (Al-Jowder et al.) (60). The findings also revealed that prediction models based on the combination partial least squares (PLS)/CVA approach can efficiently identify between beef and offal categories. At a concentration of around 10% (w/w), the authors were able to identify and characterize these adulterants, although the level of adulteration was still fairly significant. Finally, PLS regression models were used to calculate the number of offals.
Visible-near-infrared (Vis-NIR) spectroscopy was used by Rady and Adedeji to identify plant and animal proteins as adulterants in minced beef and pork. Adulterant classification, prediction, and wavelength selection were explored using a variety of chemometric approaches. The samples were separated into three levels of classification. In the first classification level, the samples of beef pork, chicken, texturized vegetable protein, and gluten were classified as pure or adulterated. The statistical models used for classification successfully distinguished between the pure (100%) and adulterated samples (96%). Further in the types of adulterants were detected during second level of classification. Individual adulterant detection was less successful, with categorization rates ranging from 69 to 100 percent (61). In the third level of classification, quantitative classification of adulterants was done by applying different regression models. The PLS regression models precisely quantified the adulterants detected in meat samples. Therefore, Rady and Adedeji resolved by this investigation that Vis-NIR spectroscopy has potential to examine authentic minced meat products quickly and reliably. For the identification and quantification of pig adulteration in beef meatballs, Kuswandi et al. (62) used chemometrics for analyzing NIR spectral data obtained for examining adulterated pork. For quantitative analysis, the PLS regression model was employed, while LDA model was used for qualitative estimation. The LDA models precisely identified pork adulterated beef meatball samples based on first-derivative spectra. The PLS and LDA models also produced findings that were quite similar to the immuno-chromatographic approach employed as a control. The procedure proved to be a quick and effective way to verify the halal status and detect pork in beef meatballs.
Fourier transform spectroscopy
The Fourier transform spectroscopic technique is categorized under vibrational spectroscopy that employs interferometers to modulate the Fourier transform algorithm in the form of an electromagnetic signal to transform sample data into an optical spectrum obtained on a computer system (63). In the interferometer, light beams are scattered and then reassembled. Due to the simultaneous measuring of wavelengths, this approach is quick and has a better signal-to-noise ratio. Fourier Transform can be also used in optical, infrared, nuclear magnetic resonance, Raman, electron spin resonance spectroscopies as well as mass spectrometry (63). However, this method is generally applied to infrared spectroscopy.
This spectroscopic technique is successfully utilized for detecting and characterization of different types of adulterants in meat and processed meat products (64, 65). Meza-Márquez, Gallardo-Velázquez (64) interrogated the presence adulterants used in processed beef adulteration with different adulterants- horsemeat, trimmings of beef, and texturized plant protein by using mid-Fourier transform infrared (MID–FTIR) spectroscopy and chemometrics. Principal component analysis (PCA) and PLS regression models were used to detect and quantify the adulterants within the minced meat. And absorbance spectra had an excellent correlation with the concentration of constituents and the percentage of adulteration was measured. 100% accuracy of classification strived through developed models (64).
Schmutzler, Beganovic (66) developed and compared three different setups based upon FT-NIR in combination with chemometric models to detect the adulteration of veal sausage with pork meat. The results revealed that the application of FTIR along with chemometric models successfully distinguished between pure and adulterated samples (66). Alamprese, Amigo (65) measured the FT-NIR spectra of 198 samples of raw, frozen-thawed, and cooked beef and turkey meat with an aim to identify and quantify turkey meat adulteration in fresh and processed beef samples. The PLS regression models worked efficiently and accurately distinguished between modest and higher levels of adulteration. Alamprese and Casiraghi (67) studied the potential of employing FT-IR spectroscopy as a quick and easy way to authenticate Atlantic mullet (165 samples) and flounder (134 samples) when replaced with red mullet (132 samples) and plaice (124 samples). They also examine the efficacy of spectroscopic techniques to distinguish between fresh and frozen-thawed Atlantic mullet filets. With high sensitivity (>70%) and specificity (100%), LDA enables Atlantic mullet to easily classified from expensive red mullet.
UV–Vis and fluorescence spectroscopy
UV–Vis spectroscopy is among the most extensively used food analytical approach involving measurements pertaining amount of light absorbed by the samples. The ease of handling, the potential to determine an extensive array of compounds, non-destructive nature, high precision, better reproducibility, and modest discernment are the key benefits of this spectroscopy. Beer’s law, which provides the basis of this approach, states that the amount of an analyte dissolved in a solvent is directly proportional to the amount of light absorbed.
Fluorescence is a process of emission of light by fluorophores or fluorescent compounds after UV or VIS light has been absorbed. Fluorophores are compounds that have more than one conjugated bond bearing aromatic rings and linear structures. The sample illumination geometry and optical density have a big impact on the apparent fluorescence intensity and spectrum pattern. The right-angle observation of centrally illuminated cuvette is the most frequent geometry employed in fluorescence spectroscopy. However, right-angle measurements are difficult to make when viscous samples are to be analyzed. Another issue with this technique is that when handling biological items such as meat or seafood, the optical characteristics may reduce the intensity of fluorescence with increment in path and reabsorption (68, 69). To address these issues, front-face fluorescence spectroscopy can be adopted, which results in very little fluorescence spectral distortion during both emission and absorption. The excitation light is focused on the front surface of the sample, and the fluorescence emission is collected from the same area at an angle that minimizes reflected and scattered light. This method works well with concentrated, opaque, or solid samples (70, 71).
The ability of fluorescence spectroscopy to distinguish between fresh and frozen-thawed samples of sea bass (Dicentrarchus labrax) was assessed (72). Four different fluorophores used were NADH (340 nm), tryptophan (290 nm), riboflavin (380 nm), and vitamin A (410 nm). The findings revealed that the approach could distinguish not only between fresh and frozen-thawed sea bass samples but the variations in the quality of different samples of frozen fish before storing. Factorial discriminant analysis (FDA) applied to the spectra recorded after excitation sets at 340 and 380 nm, 72 samples out of total 78 were correctly classified. Thus, it can be concluded that fluorescence spectroscopy along with chemometric tools could be a reliable method to discriminate fresh and thawed samples.
Different chemical and rheological factors were used to successfully discriminate distinct beef muscles using fluorescence spectroscopy (73). Seven bovine muscles were distinguished using fluorescence spectroscopy in the range of 305–700 nm to generate emission spectra, achieved by adapting the excitation wavelength at 290, 322, and 382 nm. Fluorescent spectra were used to categorize different muscles based on different parameters viz., fat, protein, collagen, and dry matter content.
Fluorescence spectroscopy has a similar potential for the sorting and depiction of beef muscles (66 samples)-Semitendinosus (n = 24), Rectus abdominis (n = 24), and Infraspinatus (n = 18), using fluorescence spectroscopy followed by data treatment using PLS-DA and PLS regression models. Emission spectra were recorded in the range of 305–400, 340–540, and 410–700 nm by fixing the excitation wavelength at 290, 322, and 382 nm, respectively. Excellent classification (100%) was obtained for three muscles. Discriminant analysis applied on emission spectra in the range of 410–700 and 340–540 nm gave 96 and 90% of good classification respectively for the three muscles. The findings of the investigation concluded fluorescence spectroscopy combined with chemometrics has a lot of potential for identifying distinct beef muscles (74). Akin observations were subsequently achieved by (75), indicating the capability of this spectroscopy to perform muscle sample discrimination. There are few studies that have used this spectroscopic technique to differentiate fresh and frozen-thawed meat. Ruoff, Luginbühl (76) also used front-face fluorescence spectroscopy to authenticate unifloral and multi floral honey varieties that had earlier been categorized using traditional approaches like chemical, pollen, and sensory analyses. PCA and LDA were used to analyze spectral data. Front-face fluorescence spectroscopy was found to be successful in authenticating the origin of honey as well as distinguishing ethnic origins within the similar unifloral honey variety.
Applications for authentication and spuriousness of animal foods
Meat and poultry
Meat authenticity knowledge and understanding have grown in recent years, and numerous analytical methods have been presented and validated in the struggle against meat fraud. Although these technologies have demonstrated the ability to reliably detect minimal concentrations of adulterants, these methods are disparaging, tedious, expensive, and labor-intensive. As a result, these are unsuitable for quick and fast detection, especially in the meat industry’s incredibly quick manufacturing and processing environment. However, as the food business strives toward non-destructive, non-invasive, easy, and online approaches, contemporary analytical technologies may improve this process. Adulterating foods has a huge commercial advantage because of the surge in manufacturing and processing of food to serve the increasing population. Adulterating foods also cause deception and may jeopardize food safety. Food fraud is frequently found in high-value products like beef. Meat and meat products are an important part of human nutrition (87). Meat is high in biologically important owing to the presence of an adequate amount of proteins, fats, B-complex vitamins, and minerals including zinc and iron. All these nutrients mentioned are required for normal physiological processes and the growth of humans (88, 89).
Since meat is generally sold as fresh and processed at the domestic level, it was rarely associated with adulteration (90, 91). Meat consumption preferences have shifted recently more toward processed and ready-to-cook/eat convenient foods like comminuted meat, meatballs, sausages, and meatloaves (90, 92). When these items are prepared, the morphological properties of the flesh are lost which makes it quite grim to distinguish between different muscle types, sources, and species. This provides the means to the processors or manufacturers to falsely alter or substitute premium-quality meat with low and cheap quality muscle types or species (64, 65). Customers suffer the consequences of these types of fraudulent activities by losing money, the ingestion of meat that is forbidden in some religions, unintentional exposure to common allergens, and compromise food safety (93).
As a result of these fraudulent actions, meat products must be closely monitored, controlled, and inspected during manufacturing, storage, and distribution (94). As a result, numerous analytical approaches have been presented and subsequently assessed in the struggle against meat fraud (95, 96). To identify meat species, many analytical approaches are used, most of which are based on protein or DNA based assays and polymerase chain reaction (PCR and real-time PCR) (97, 98). Protein-based techniques, such as electrophoretic and immunological techniques viz., enzyme-linked immunosorbent assay (ELISA), can be inadequate in distinguishing closely related meat species (29). Methods such as electrophoresis and chromatography (29, 99, 100) have also showed potential in this regard. While processing in a meat production plant, these methods are often used to examine, investigate, and quality analysis of meat and poultry products based on eminence and reliability factors (94). These authentication techniques, while trustworthy, specific, and sensitive, have several limitations, including the fact that these are time-consuming, tedious, costly, as well as complex laboratory requirements, sensitive and careful handling of sophisticated procedures making them subject to subjectivity. As a result, traditional approaches are ineffective for rapid analysis and quick identification, especially in the modern meat industry’s fast track of manufacturing and processing of products.
Quick, non-destructive, non-invasive, precise, efficient, and more reproducible analytical methodologies for authenticity and fraud identification in meat and poultry products have been developed due to the general shortcomings of traditional methodologies (37, 101). Fourier transform infrared spectroscopy (64, 65, 102) color and X-ray imaging (103, 104), near-infrared spectroscopy (61, 105), hyperspectral imaging (39, 106), and Raman spectroscopy (102) have now been explored for use in the authentication and/or identification of adulterants in processed meat products.
Egg quality and freshness are now frequently assessed using spectroscopic techniques. Because these procedures are non-destructive and provide precision, accuracy, speed, and rapid as well as reproducible results. Spectroscopic techniques promote the integration of online egg shell grading applications, with apparent benefits for both manufacturers and consumers. Applications of spectroscopy technologies such as VIS-NIR, NIR, Raman, microwaves, hyperspectral imaging, and pulsed IR thermography for non-destructive evaluation of shell egg quality and freshness, to encourage research in this sector and provide some directions for fulfilling business needs (107).
Utilization and employing of non-destructive technologies is critical for the meat processing industry to undertake safety and authenticity assessments of different types of meat types and products without altering the characteristics of the original product. Surface examination of samples without employing any invasive or disruptive techniques that might affect the quality characteristics of food is termed a non-destructive analysis. The primary benefit of non-destructive spectroscopic approach application is that it may measure the physical and chemical characteristics of foods without affecting the sample taken for analysis. Hence, the samples can be employed for authenticity check in the entire processing and distribution chain using non-destructive procedures, resulting in no product losses. The meat industry lacks fast and easy, non-destructive, and non-invasive procedures for the authentication of processed meat products that can be used in situ, this manuscript attempted to compile the most recent spectroscopic techniques that have the feasibility to meet meat product authentication needs. Table 2 depicts a comprehensive review of different research studies about applications of various spectroscopic techniques used for checking adulteration and authentication of various meat, meat-based and poultry-based food products.
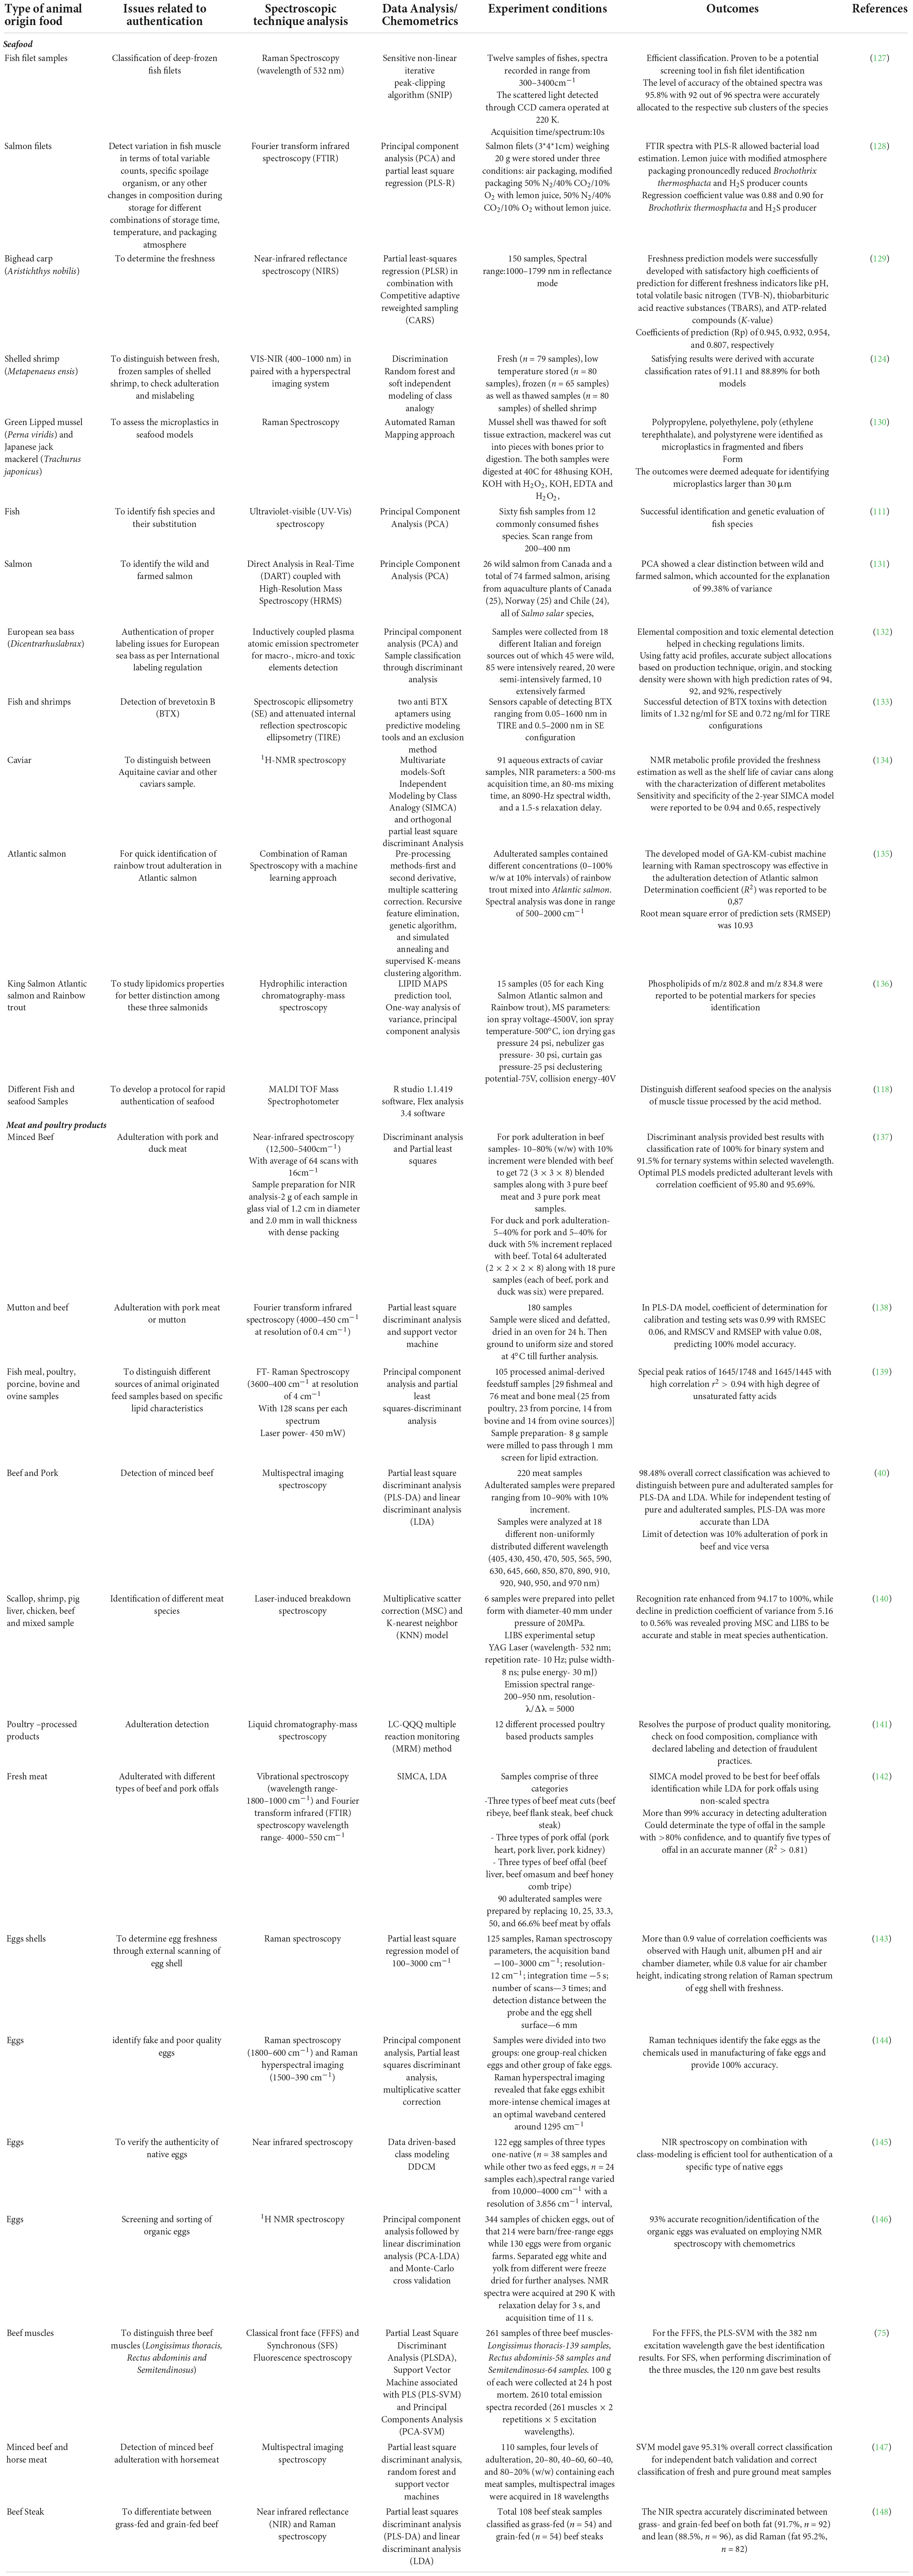
Table 2. Spectroscopic techniques for authentication/adulteration of meat, poultry and seafood.
Seafood
Seafood fraud is quite a difficult task to combat due to the ongoing evolution of fraudulent tactics and its consequences for both consumers as well as worldwide trade (108, 109). As a result, it is indeed critical to keep an eye on the entire food chain to spot and avoid fraud, such as species swaps, which is the most prevalent deception in the seafood sector (110). With the industrial advancements in the food sector, quick, simple, and reliable solutions for food authenticity checks are always sought in the entire food supply chain. The quest for excellent quality and safety both during fish farming and processing implies stringent process control, monitoring, and quality assurance standards. Fish and fish products are easily and regularly prone to fraud tactics due to massive international production, imports, and consumption. Species swapping, terrestrial origin misrepresentation, manufacturing process or aquaculture falsification, and replacing fresh with frozen/thawed product exchange are all instances of fish and seafood product authenticity challenges. As a result, meeting this demand necessitates the use of appropriate analytical instruments both before and after food processing and production. Quick, efficient, simple, user friendly, limited or nil sample preparation, and a very small amount or no wastage sample are all desirable aspects of such technologies and these features are peculiar characteristics of different spectroscopic technologies including mid-infrared, near-infrared and visible spectroscopy (111).
Ghidini, Varrà (105) described qualitative spectroscopy in combination with chemometrics in seafood products. Surimi from marine fish was used to detect and recognize using near-infrared diffuse reflectance spectroscopy (112). Sixty-four samples of six different species of fishes, including Atlantic salmon (Salmo salar), European anchovy (Engraulis encrasicolus),bluefish (Pomatomus saltatrix),horse mackerel (Trachurus trachurus), red mullet (Mullus surmuletus), flying gurnard (Trigla lucerna), were analyzed using Raman spectroscopy combined with chemometrics to distinguish between fresh and frozen/thawed samples of fish (113). Various research studies investigated and reported that sophisticated spectroscopic techniques effectively resolved authenticity problems relating to fish and seafood counterfeiting. Using matrix-assisted laser desorption/ionization time-of-flight mass spectrometry (MALDI-TOF MS) and high-performance liquid chromatography-mass spectrometry (HPLC-MS/MS), a recent study examined the variations in exudates of fish muscle when subjected to different varying freeze and thaw cycles and along with different frozen storage periods. The results indicated that the developed method can be a promising strategy to evaluate the change in fish muscle or other animal muscle-based foods (114). In recent years, mass spectrometric, metabolomic, and chemometric techniques have been used to investigate different fish for taxonomic classification, authentication, and quality assessment (115–117). The pre-treatment of the fish muscle samples before subjecting to spectroscopic analysis was reported to increase in effectiveness and efficacy of analysis and hence better reproducible results (118).
The key morphological traits of seafood that allow the buyer to recognize one variety from another are usually obliterated during processing, which is a significant challenge to authenticity in seafood processing. In the seafood sector, species replacement is a very widespread kind of economic adulteration (119, 120). In crabmeat samples, Gayo and colleagues used visible (VIS) and near-infrared (NIR) spectroscopy to identify and quantify species authentication as well as monitor adulteration (31). In another study, the issue of the mixing of Atlantic blue (Callinectes sapidus) crabmeat with blue swimmer (Portunus armatus) crab was explored and studied using spectroscopic techniques. The scientists discovered that the predominant features in the crabmeat spectra were dominated by water absorption bands, with a decline in sample absorbance as the percentage of adulteration increased (31, 121). For samples containing blue swimmer crabmeat, VIS/NIR spectroscopy was able to identify species authenticity and economic adulteration to less than 6%. Furthermore, these authors reported using multiple data pre-treatments in combination with NIR spectra, including moving average, a combination of first and second derivatives, and multiplicative scatter correction, before creating PLS regression models (31, 122). Gayo and his colleagues discovered that chemometric methods paired with the visible and near-infrared spectroscopic techniques were effective in detecting and assessing species’ originality and sullying in crabmeat. In this study, a surimi-based crab meat mimic was used to taint crab meat samples from the Atlantic blue (Callinectes sapidus) and blue swimmer (Portunus armatus). The scientists discovered that both PLS and principal component (PCR) regression techniques gave the best way of detecting counterfeiting in crab meat samples falsified with surimi after pre-processing the spectra using the first derivative. However, samples with less than 20% adulteration cannot be estimated accurately by this approach (31, 121, 122). NIR spectroscopy paired with PCA was used by Brodersen and Bremner (123) to distinguish between shrimp (Pandalus borealis) and a commercial freezer trawler. Before being steam-cooked and skinned, the shrimp were cooled, preserved in freshwater, and brine solution of varied concentrations (123). The researchers demonstrated that using chemometrics and NIR spectra recorded from differently pretreated whole shrimp and minced fresh samples, could detect and distinguish between frozen and thawed material samples, whole or minced shrimp, along with salt level, flesh pH, cooking time as well as temperature (123).
Qu, Cheng (124) used VIS-NIR spectroscopy in conjunction with a hyperspectral imaging technique to distinguish between fresh (n = 79 samples), low temperature stored (n = 80 samples), frozen (n = 65 samples) as well as thawed samples (n = 80 samples) of shelled shrimp (Metapenaeus ensis). By condensing the 381 wavelengths to 08 ideal ones, the calculation burden was significantly minimalized that is 75.56–63.33% by Random forest (RF) and 95.56–86.67% by soft independent modeling of class analogy (SIMCA). The findings of this research showed that combining chemometrics and spectroscopy was effective in detecting illegally replaced and mislabeled commodities (124). The authors validated the use of VIS-NIR spectroscopy along with chemometric tools – RF method and SIMCA in classifying fresh shrimp from cold storage or frozen shrimps with the classification rate of ninety-one percent and eighty-eight percent, respectively (124). Wu and companions also used hyperspectral imaging in conjunction with chemometric methods to analyze the impeccability and reproducibility of detection of gelatin adulteration in prawns (125).
The feasibility of NIR spectroscopy as a method of authentication of wild European sea bass (Dicentrarchus labrax) was studied by Ottavian, Facco (126). The effectiveness of three distinct chemometric approaches was investigated for NIR spectral analysis and their capability to distinguish wild and farmed samples of sea bass was assessed by the author. The data collection included 66 validation samples (32 declared wild and 34 declared farmed) with declared production techniques and 38 calibration samples with determined attribution of production method. The three chemometric strategies- partial least-squares discriminant analysis (PLS-DA) and the wavelet-based WPTER (wavelet packet transform for efficient pattern recognition) method and principal component analysis, revealed that near-infrared spectroscopy may also be used to reliably distinguish between wild and farmed sea bass, with classification performance comparable to chemical characteristics and morphometric attributes. Furthermore, in comparison to traditional and conventional methods for classification and identification, NIR-based categorization methods were reported to be comparatively easier, quick, cheaper, and environmentally safe along with this method does not have any chemical requirements too (126). Table 2 depicts a brief review of different recent research studies about exploitation of various spectroscopic techniques employed for assessing adulteration and authentication of sea foods.
Milk and milk products
Worldwide, milk is contemplated as the most significant and nutrient-dense food, consumed in its natural form or in the form of dairy products. Owing to growing demand of milk and milk products as well as an increase in its consumption pattern these products are more liable for food fraudulent practices (149). A large number of frauds pertaining to partial replacement of milk fat or protein, swapping of high value milk from one species with a lower valued milk from other species (150), addition of adulterants (151), presence of undeclared ingredients in the products, false information regarding the geographical origin (152) etc., have been reported in literature. Furthermore, the mixing of milk obtained from non-declared species could pose health hazards due to allergies, as well as ethical connotations on account of religious beliefs or individual preferences prohibiting the consumption of milk from certain specific species (153). Recognition and confirmation of species is of paramount significance in expensive tradition milk commodities like cheese marked with logos of European Union (EU)- PGI (protected geographical indication), PDO (protected designation of origin) and TSG (Traditional specialty guaranteed). Because of higher economical and nutritive excellence, aroma, textural attributes, these products are more susceptible to adulteration practices (154). Use of FTIR spectroscopy was advocated for detection and quantification of the proportion of adulteration of cow milk with different ratios of milk of goat and sheep (155).
Moreover, with the advent of technology and increasing awareness among the consumer, ethical economic and health challenges, there arises an urgency for simple, stringent, precise, rapid, innovative, green and non- destructive quality control techniques for identifying the geographical origin, detection of adulterants and fraud in milk and milk products (156). Authentication of milk based commodities entails using analytical techniques to verify whether the products confirms to the specified labeling and complies with applicable laws and regulations (157). As discussed in the previous sections, various comprehensive and focused approaches, including as molecular, chemical, protein-based, and chromatographic techniques, have traditionally been used to identify the species, origin, unusual ingredients, and type of processing procedure used to manufacture the particular product. Despite being extremely specific and impeachable, these techniques destroy the structure of food, are labor expensive, difficult, and can only be used on a laboratory scale. As a result, the need of the hour is to uncover alternative instrumentation techniques that can help overcome the majority of the restrictions that traditional methods have to offer. Spectroscopy is a developing method for certifying the authenticity of food products that is quick, low-cost, and non-destructive. Table 3 depicts a comprehensive review of various research studies and their findings in relation to spectroscopic techniques utilized for authentication of milk and milk products.

Table 3. Spectroscopic techniques for authentication/adulteration of milk and milk products.
Future recommendations and conclusion
This paper has reviewed the latest literature about different spectroscopic techniques used to resolve issues related to authenticity and adulteration of animal-based products. There has been an upsurge in the array of applications combining advanced spectroscopic techniques with modern multivariate data analytics, according to the published literature in the field. The research investigations revealed that these spectroscopic techniques are convenient to use, non-destructive, have no special requirements for sample preparation, and provide rapid, precise, and reproducible results. However, data obtained from the spectroscopic is then subjected to multivariate analysis, i.e., different statistical and chemometric tools for better classification of adulterated samples as well as the authenticity of original food products. To resolve this limitation, several methodologies referred to as chemometrics or data analytics are critical for the future successful development and implementation of new prediction models. Despite being repeatable and seldom impacted by variations in sensitivity over time, vibrational spectroscopy, NMR, and fluorescence spectroscopy. In fact, there are no particular prerequisites for sample preparation, which assure long-term stability and online or in-line application throughout the production process. This is especially the case for “homogeneous” liquid samples, whereas substantial sample preparation or repeated point measurements may be recommended for solid heterogeneous commodities like meat, fish, and dairy. According to the characteristics of the food product, choosing the right acquisition mode is also essential for obtaining accurate spectroscopic outcomes. This includes selecting the appropriate technique viz., NIR, IR, NMR, or fluorescence spectroscopy, sample presentation viz., transmission, absorbance, reflectance, excitation or emission, etc., type of sample holder viz., cuvette, probe, attenuated reflectance holder and working system. The spatial variability of components in heterogeneous goods can be differentiated using site-to-site spectroscopic fingerprint specificity, which makes HSI technologies a legitimate substitute for point spectral scanning. With regard to animal-based products in particular, HSI technologies using NIR radiation have been extensively utilized for food quality assessment and authentication. However, the majority of the documented works are laboratory-scale expediency, and there are few studies demonstrating the model’s reliability at the level of processing plants. High investment costs and challenging amortization for technology purchases are barriers to the widespread use of these spectroscopic technologies in the commercial context of the animal food business, particularly in small and medium farms where basic technologies are frequently unavailable. Another limitation is the need for calibration procedures, management, and interpretation of the data which also depends on the skill and knowledge of specialized personnel. The sample preparation for various techniques like HIS, and NIR serves as a rate-limiting step while analyzing a larger sample population for the characterization, as well as generation of enormous data for each individual measure and the comparatively lengthy processing durations for this data.
However, there are still several obstacles to overcome in terms of widespread adoption and deployment of these technologies in both academic and commercial facilities. This necessarily requires the creation of the next generation of scientists capable of working in both academia and industry contexts, and skilled in dealing with all aspects of food authentication using quasi techniques. When it comes to food verification, spectroscopic techniques have evident advantages over-focused approaches; nonetheless, their widespread implementation outside of laboratories remains a challenge. To address these difficulties, researchers will link new spectroscopic technologies with the demands of food fraud risk management systems, paving the way for their use in food assurance. For the entire spectroscopic domain, and particularly for those that are more focused on food verification and authentication, it is required to fabricate simplified, compact, and portable instruments. Therefore, it is apparent that spectroscopic techniques offer significant advantages over focused approaches when dealing with a food authentication issue; nonetheless, their widespread implementation outside of laboratories still poses difficulties. By overcoming these obstacles, developing spectroscopic techniques will be matched with the requirements of food fraud risk management systems, opening the door for their application to the assurance of food integrity.
Author contributions
VC and PK contributed to concept and writing original draft. AD, CM, and CS contributed to writing original draft. RP contributed to resources and writing – original draft, review and editing. All authors contributed to the article and approved the submitted version.
Conflict of interest
The authors declare that the research was conducted in the absence of any commercial or financial relationships that could be construed as a potential conflict of interest.
The reviewer DC is currently organizing a Research Topic with one of the authors, RP.
Publisher’s note
All claims expressed in this article are solely those of the authors and do not necessarily represent those of their affiliated organizations, or those of the publisher, the editors and the reviewers. Any product that may be evaluated in this article, or claim that may be made by its manufacturer, is not guaranteed or endorsed by the publisher.
References
1. Esteki M, Shahsavari Z, Simal-Gandara J. Use of spectroscopic methods in combination with linear discriminant analysis for authentication of food products. Food Control. (2018) 91:100–12. doi: 10.1016/j.foodcont.2018.03.031
2. Scarano D, Rao R. DNA markers for food products authentication. Diversity. (2014) 6:579–96. doi: 10.3390/d6030579
3. Hassoun A, Måge I, Schmidt WF, Temiz HT, Li L, Kim H-Y, et al. Fraud in animal origin food products: Advances in emerging spectroscopic detection methods over the past five years. Foods. (2020) 9:1069. doi: 10.3390/foods9081069
4. Biancolillo A, Marini F. Chemometric methods for spectroscopy-based pharmaceutical analysis. Front Chem. (2018) 6:576.
5. Zouaghi W, Thomson MD, Rabia K, Hahn R, Blank V, Roskos HG. Broadband terahertz spectroscopy: Principles, fundamental research and potential for industrial applications. Eur J Phys. (2013) 34:S179–99. doi: 10.1088/0143-0807/34/6/S179
6. Kiwa T, Tonouchi M, Yamashita M, Kawase K. Laser terahertz-emission microscope for inspecting electrical faults in integrated circuits. Opt Lett. (2003) 28:2058–60. doi: 10.1364/OL.28.002058
7. Corsi C, Sizov F. THz and security applications: Detectors, sources and associated electronics for THz applications. Berlin: Springer (2014). doi: 10.1007/978-94-017-8828-1
8. Ajito K, Nakamura M, Tajima T, Ueno Y. Terahertz spectroscopy methods and instrumentation. 3rd ed. In: Lindon JC, Tranter GE, Koppenaal DW editors. Encyclopedia of spectroscopy and spectrometry. Oxford: Academic Press (2017). p. 432–8. doi: 10.1016/B978-0-12-409547-2.12092-X
9. Chen Z, Zhang Z, Zhu R, Xiang Y, Yang Y, Harrington PB. Application of terahertz time-domain spectroscopy combined with chemometrics to quantitative analysis of imidacloprid in rice samples. J Quant Spectrosc Radiat Transf. (2015) 167:1–9. doi: 10.1016/j.jqsrt.2015.07.018
10. Liu J. Terahertz spectroscopy and chemometric tools for rapid identification of adulterated dairy product. Opt Quantum Electron. (2016) 49:1. doi: 10.1007/s11082-016-0848-8
11. Liang, QI, Maocheng Z, Jie Z, Yuweiyi T. Preliminary investigation of Terahertz spectroscopy to predict pork freshness non-destructively. Food Sci Technol. (2019) 39:563–570. doi: 10.1590/fst.25718
12. Trofimov VA, Varentsova SA. Essential limitations of the standard THz TDS method for substance detection and identification and a way of overcoming them. Sensors. (2016) 16:502. doi: 10.3390/s16040502
13. Markiewicz-Keszycka M, Cama-Moncunill X, Casado-Gavalda MP, Dixit Y, Cama-Moncunill R, Cullen PJ, et al. Laser-induced breakdown spectroscopy (LIBS) for food analysis: A review. Trends Food Sci Technol. (2017) 65:80–93. doi: 10.1016/j.tifs.2017.05.005
14. Noll R, Fricke-Begemann C, Connemann S, Meinhardt C, Sturm V. LIBS analyses for industrial applications – an overview of developments from 2014 to 2018. J Anal At Spectrom. (2018) 33:945–56. doi: 10.1039/C8JA00076J
15. Cremers DA. Space applications of LIBS. In: Musazzi S, Perini U editors. Laser-induced breakdown spectroscopy: Theory and applications. Berlin: Springer (2014). p. 257–91. doi: 10.1007/978-3-642-45085-3_10
16. Anglos D, Detalle V. Cultural heritage applications of LIBS. In: Musazzi S, Perini U editors. Laser-induced breakdown spectroscopy: Theory and applications. Berlin: Springer (2014). p. 531–54. doi: 10.1007/978-3-642-45085-3_20
17. Zhang Y, Zhang T, Li H. Application of laser-induced breakdown spectroscopy (LIBS) in environmental monitoring. Spectrochim Acta Part B At Spectrosc. (2021) 181:106218. doi: 10.1016/j.sab.2021.106218
18. Chen T, Zhang T, Li H. Applications of laser-induced breakdown spectroscopy (LIBS) combined with machine learning in geochemical and environmental resources exploration. TrAC Trends Anal Chem. (2020) 133:116113. doi: 10.1016/j.trac.2020.116113
19. Katerinopoulou K, Kontogeorgos A, Salmas CE, Patakas A, Ladavos A. Geographical origin authentication of agri-food products: A review. Foods. (2020) 9:489. doi: 10.3390/foods9040489
20. Baskali-Bouregaa N, Milliand M-L, Mauffrey S, Chabert E, Forrestier M, Gilon N. Tea geographical origin explained by LIBS elemental profile combined to isotopic information. Talanta. (2019) 211:120674. doi: 10.1016/j.talanta.2019.120674
21. Huang W, Guo L, Kou W, Zhang D, Hu Z, Chen F, et al. Identification of adulterated milk powder based on convolutional neural network and laser-induced breakdown spectroscopy. Microchem J. (2022) 176:107190. doi: 10.1016/j.microc.2022.107190
22. Bilge G, Sezer B, Velioğlu H, Eseller K, Berberoğlu H, Boyacı I. Identification of meat species by using laser-induced breakdown spectroscopy. Meat Sci. (2016) 119:118–22. doi: 10.1016/j.meatsci.2016.04.035
23. Sezer B, Durna S, Bilge G, Berkkan A, Yetisemiyen A, Boyaci IH. Identification of milk fraud using laser-induced breakdown spectroscopy (LIBS). Int Dairy J. (2018) 81:1–7. doi: 10.1016/j.idairyj.2017.12.005
24. Huang H, Liu L, Ngadi MO. Recent developments in hyperspectral imaging for assessment of food quality and safety. Sensors. (2014) 14:7248–76. doi: 10.3390/s140407248
25. Liu D, Zeng X-A, Sun D-W. Recent developments and applications of hyperspectral imaging for quality evaluation of agricultural products: A review. Crit Rev Food Sci Nutr. (2015) 55:1744–57. doi: 10.1080/10408398.2013.777020
26. Feng Y-Z, ElMasry G, Sun D-W, Scannell AG, Walsh D, Morcy N. Near-infrared hyperspectral imaging and partial least squares regression for rapid and reagentless determination of Enterobacteriaceae on chicken fillets. Food Chem. (2013) 138:1829–36. doi: 10.1016/j.foodchem.2012.11.040
27. Burger J, Gowen A. Data handling in hyperspectral image analysis. Chemometr Intell Lab Syst. (2011) 108:13–22. doi: 10.1016/j.chemolab.2011.04.001
28. Goetz AF, Vane G, Solomon JE, Rock BN. Imaging spectrometry for earth remote sensing. Science. (1985) 228:1147–53. doi: 10.1126/science.228.4704.1147
29. Edwards K, Manley M, Hoffman LC, Williams PJ. Non-destructive spectroscopic and imaging techniques for the detection of processed meat fraud. Foods. (2021) 10:448. doi: 10.3390/foods10020448
30. Gowen AA, O’Donnell CP, Cullen PJ, Downey G, Frias JM. Hyperspectral imaging–an emerging process analytical tool for food quality and safety control. Trends Food Sci Technol. (2007) 18:590–8. doi: 10.1016/j.tifs.2007.06.001
31. Gayo J, Hale SA. Detection and quantification of species authenticity and adulteration in crabmeat using visible and near-infrared spectroscopy. J Agric Food Chem. (2007) 55:585–92. doi: 10.1021/jf061801+
32. Williams PJ. Near infrared (NIR) hyperspectral imaging and X-ray computed tomography combined with statistical and multivariate data analysis to study Fusarium infection in maize. Stellenbosch: Stellenbosch University (2013).
33. Williams PJ. Near infrared (NIR) hyperspectral imaging for evaluation of whole maize kernels: Chemometrics for exploration and classification. Stellenbosch: University of Stellenbosch (2009).
34. Qin J, Chao K, Kim MS, Lu R, Burks TF. Hyperspectral and multispectral imaging for evaluating food safety and quality. J Food Eng. (2013) 118:157–71. doi: 10.1016/j.jfoodeng.2013.04.001
35. Ortega S, Guerra R, Diaz M, Fabelo H, López S, Callico GM, et al. Hyperspectral push-broom microscope development and characterization. IEEE Access. (2019) 7:122473–122491. doi: 10.1109/ACCESS.2019.2937729
36. Kamruzzaman M, Sun D-W, ElMasry G, Allen P. Fast detection and visualization of minced lamb meat adulteration using NIR hyperspectral imaging and multivariate image analysis. Talanta. (2013) 103:130–6. doi: 10.1016/j.talanta.2012.10.020
37. Elmasry G, Kamruzzaman M, Sun D-W, Allen P. Principles and applications of hyperspectral imaging in quality evaluation of agro-food products: A review. Crit Rev Food Sci Nutr. (2012) 52:999–1023. doi: 10.1080/10408398.2010.543495
38. Kamruzzaman M, Makino Y, Oshita S. Hyperspectral imaging in tandem with multivariate analysis and image processing for non-invasive detection and visualization of pork adulteration in minced beef. Anal Methods. (2015) 7:7496–502. doi: 10.1039/C5AY01617G
39. Zheng X, Li Y, Wei W, Peng Y. Detection of adulteration with duck meat in minced lamb meat by using visible near-infrared hyperspectral imaging. Meat Sci. (2019) 149:55–62. doi: 10.1016/j.meatsci.2018.11.005
40. Ropodi A, Pavlidis D, Mohareb F, Panagou E, Nychas G-J. Multispectral image analysis approach to detect adulteration of beef and pork in raw meats. Food Res Int. (2015) 67:12–8. doi: 10.1016/j.foodres.2014.10.032
41. Shafiee S, Polder G, Minaei S, Moghadam-Charkari N, Van Ruth S, Kuś PM. Detection of honey adulteration using hyperspectral imaging. IFAC PapersOnLine. (2016) 49:311–4. doi: 10.1016/j.ifacol.2016.10.057
42. Giraudeau P. Quantitative 2D liquid-state NMR. Magn Reson Chem. (2014) 52:259–72. doi: 10.1002/mrc.4068
43. Otte DA, Borchmann DE, Lin C, Weck M, Woerpel K. 13C NMR spectroscopy for the quantitative determination of compound ratios and polymer end groups. Organ Lett. (2014) 16:1566–9. doi: 10.1021/ol403776k
45. Fernandes A, Brás NF, Mateus N, de Freitas V. A study of anthocyanin self-association by NMR spectroscopy. New J Chem. (2015) 39:2602–11. doi: 10.1039/C4NJ02339K
46. Leydet Y, Gavara R, Petrov V, Diniz AM, Parola AJ, Lima JC, et al. The effect of self-aggregation on the determination of the kinetic and thermodynamic constants of the network of chemical reactions in 3-glucoside anthocyanins. Phytochemistry. (2012) 83:125–35. doi: 10.1016/j.phytochem.2012.06.022
47. Jakes W, Gerdova A, Defernez M, Watson A, McCallum C, Limer E, et al. Authentication of beef versus horse meat using 60 MHz 1H NMR spectroscopy. Food Chem. (2015) 175:1–9. doi: 10.1016/j.foodchem.2014.11.110
48. Craig AP, Franca AS, Irudayaraj J. Surface-enhanced Raman spectroscopy applied to food safety. Annu Rev Food Sci Technol. (2013) 4:369–80. doi: 10.1146/annurev-food-022811-101227
49. Yang D, Ying Y. Applications of Raman spectroscopy in agricultural products and food analysis: A review. Appl Spectrosc Rev. (2011) 46:539–60. doi: 10.1080/05704928.2011.593216
50. Zhao M, Downey G, O’Donnell CP. Dispersive Raman spectroscopy and multivariate data analysis to detect offal adulteration of thawed beefburgers. J Agric Food Chem. (2015) 63:1433–41. doi: 10.1021/jf5041959
51. Li S, Shan Y, Zhu X, Zhang X, Ling G. Detection of honey adulteration by high fructose corn syrup and maltose syrup using Raman spectroscopy. J Food Compos Anal. (2012) 28:69–74. doi: 10.1016/j.jfca.2012.07.006
52. Karacaglar NNY, Bulat T, Boyaci IH, Topcu A. Raman spectroscopy coupled with chemometric methods for the discrimination of foreign fats and oils in cream and yogurt. J Food Drug Anal. (2019) 27:101–10. doi: 10.1016/j.jfda.2018.06.008
53. Cheng Y, Dong Y, Wu J, Yang X, Bai H, Zheng H, et al. Screening melamine adulterant in milk powder with laser Raman spectrometry. J Food Compos Anal. (2010) 23:199–202. doi: 10.1016/j.jfca.2009.08.006
54. Danezis GP, Tsagkaris AS, Camin F, Brusic V, Georgiou CA. Food authentication: Techniques, trends & emerging approaches. TrAC Trends Anal Chem. (2016) 85:123–32. doi: 10.1016/j.trac.2016.02.026
55. Abbas O, Pissard A, Baeten V. Near-infrared, mid-infrared, and Raman spectroscopy. 2nd ed. In: Pico Y editor. Chemical analysis of food, techniques and applications. Waltham, MA: Elsevier (2020). p. 77–134. doi: 10.1016/B978-0-12-813266-1.00003-6
56. Manley M. Near-infrared spectroscopy and hyperspectral imaging: Non-destructive analysis of biological materials. Chem Soc Rev. (2014) 43:8200–14. doi: 10.1039/C4CS00062E
57. Ciurczak EW, Igne B, Workman J Jr., Burns DA. Handbook of near-infrared analysis. Boca Raton, FL: CRC press (2021). doi: 10.1201/b22513
58. Workman JJ. Review of process and non-invasive near-infrared and infrared spectroscopy: 1993–1999. Appl Spectrosc Rev. (1999) 34:1–89.
59. Blanco M, Villarroya I. NIR spectroscopy: A rapid-response analytical tool. TrAC Trends Anal Chem. (2002) 21:240–50. doi: 10.1016/S0165-9936(02)00404-1
60. Al-Jowder O, Defernez M, Kemsley EK, Wilson RH. Mid-infrared spectroscopy and chemometrics for the authentication of meat products. J Agric Food Chem. (1999) 47:3210–18.
61. Rady A, Adedeji A. Assessing different processed meats for adulterants using visible-near-infrared spectroscopy. Meat Sci. (2018) 136:59–67. doi: 10.1016/j.meatsci.2017.10.014
62. Kuswandi B, Cendekiawan KA, Kristiningrum N, Ahmad M. Pork adulteration in commercial meatballs determined by chemometric analysis of NIR Spectra. J Food Meas Charact. (2015) 9:313–23.
63. McCarthy WJ, Kemeny GJ. Fourier transform spectrophotometers in the near-infrared. Handbook of Near-Infrared Analysis. Boca Raton, FL: CRC Press (2007). p. 97–110. doi: 10.1201/9781420007374-10
64. Meza-Márquez OG, Gallardo-Velázquez T, Osorio-Revilla G. Application of mid-infrared spectroscopy with multivariate analysis and soft independent modeling of class analogies (SIMCA) for the detection of adulterants in minced beef. Meat Sci. (2010) 86:511–9. doi: 10.1016/j.meatsci.2010.05.044
65. Alamprese C, Amigo JM, Casiraghi E, Engelsen SB. Identification and quantification of turkey meat adulteration in fresh, frozen-thawed and cooked minced beef by FT-NIR spectroscopy and chemometrics. Meat Sci. (2016) 121:175–81. doi: 10.1016/j.meatsci.2016.06.018
66. Schmutzler M, Beganovic A, Böhler G, Huck CW. Methods for detection of pork adulteration in veal product based on FT-NIR spectroscopy for laboratory, industrial and on-site analysis. Food Control. (2015) 57:258–67. doi: 10.1016/j.foodcont.2015.04.019
67. Alamprese C, Casiraghi E. Application of FT-NIR and FT-IR spectroscopy to fish fillet authentication. LWT Food Sci Technol. (2015) 63:720–5. doi: 10.1016/j.lwt.2015.03.021
68. Airado-Rodríguez D, Høy M, Skaret J, Wold JP. From multispectral imaging of autofluorescence to chemical and sensory images of lipid oxidation in cod caviar paste. Talanta. (2014) 122:70–9. doi: 10.1016/j.talanta.2013.12.052
69. Lakhal L, Acha V, Aussenac T. Resolution of fluorophore mixtures in biological media using fluorescence spectroscopy and Monte Carlo simulation. Appl Spectrosc. (2014) 68:697–711. doi: 10.1366/12-06980
70. Albani JR. Principles and applications of fluorescence spectroscopy. Hoboken, NJ: John Wiley & Sons (2008).
71. Christensen J, Nørgaard L, Bro R, Engelsen SB. Multivariate autofluorescence of intact food systems. Chem Rev. (2006) 106:1979–94. doi: 10.1021/cr050019q
72. Karoui R, Hassoun A, Ethuin P. Front face fluorescence spectroscopy enables rapid differentiation of fresh and frozen-thawed sea bass (Dicentrarchus labrax) fillets. J Food Eng. (2017) 202:89–98. doi: 10.1016/j.jfoodeng.2017.01.018
73. Sahar A, Boubellouta T, Portanguen S, Kondjoyan A, Dufour E. Synchronous front-face fluorescence spectroscopy coupled with parallel factors (PARAFAC) analysis to study the effects of cooking time on meat. J Food Sci. (2009) 74:E534–9. doi: 10.1111/j.1750-3841.2009.01365.x
74. Sahar A, Dufour É. Classification and characterization of beef muscles using front-face fluorescence spectroscopy. Meat Sci. (2015) 100:69–72. doi: 10.1016/j.meatsci.2014.09.142
75. Ait-Kaddour A, Loudiyi M, Ferlay A, Gruffat D. Performance of fluorescence spectroscopy for beef meat authentication: Effect of excitation mode and discriminant algorithms. Meat Sci. (2018) 137:58–66. doi: 10.1016/j.meatsci.2017.11.002
76. Ruoff K, Luginbühl W, Künzli R, Bogdanov S, Bosset JO, von der Ohe K, et al. Authentication of the botanical and geographical origin of honey by front-face fluorescence spectroscopy. J Agric Food Chem. (2006) 54:6858–66. doi: 10.1021/jf060697t
77. Prabhu SS. Terahertz spectroscopy: Advances and applications. In: Gupta VP editor. Molecular and Laser Spectroscopy. Amsterdam: Elsevier (2018). p. 65–85. doi: 10.1016/B978-0-12-849883-5.00004-8
78. Wilke I. Terahertz spectroscopy applications?. 3rd ed. In: Worsfold P, Poole C, Townshend A, Miró M editors. Encyclopedia of Analytical Science. Oxford: Academic Press (2017). p. 1–5.
79. Zhang, L, Zhang M, Mujumdar AS. Terahertz spectroscopy: A powerful technique for food drying research. Food Rev Int. (2021) 17:1–18. doi: 10.1080/87559129.2021.1936004
80. Negi A, Lakshmi P, Praba K, Meenatchi R, Pare A. Detection of food adulterants in different foodstuff. Food Chem. (2021) 17:117–64. doi: 10.1002/9781119792130.ch5
81. Nespeca M, Lima A, Santos Junior D, Neto J, Ferreira E. Detection and quantification of adulterants in honey by LIBS. Food Chem. (2019) 311:125886. doi: 10.1016/j.foodchem.2019.125886
82. Roberts J, Power A, Chapman J, Chandra S, Cozzolino D. A short update on the advantages, applications and limitations of hyperspectral and chemical imaging in food authentication. Appl Sci. (2018) 8:505. doi: 10.3390/app8040505
83. Consonni R, Cagliani LR. The potentiality of NMR-based metabolomics in food science and food authentication assessment. Magn Reson Chem. (2019) 57:558–78. doi: 10.1002/mrc.4807
84. Xu Y, Zhong P, Jiang A, Shen X, Li X, Xu Z, et al. Raman spectroscopy coupled with chemometrics for food authentication: A review. TrAC Trends Anal Chem. (2020) 131:116017. doi: 10.1016/j.trac.2020.116017
85. Mendez J, Mendoza L, Cruz-Tirado J, Quevedo R, Siche R. Trends in application of NIR and hyperspectral imaging for food authentication. Scientia Agropecuaria. (2019) 10:143–61. doi: 10.17268/sci.agropecu.2019.01.16
86. Li F, Zhang J, Wang Y. Vibrational spectroscopy combined with chemometrics in authentication of functional foods. Crit Rev Anal Chem. (2022) 4:1–22. doi: 10.1080/10408347.2022.2073433
87. Ballin N, Lametsch R. Analytical methods for authentication of fresh vs. Thawed meat–A review. Meat Sci. (2008) 80:151–8. doi: 10.1016/j.meatsci.2007.12.024
88. Baltic MZ, Boskovic M. When man met meat: Meat in human nutrition from ancient times till today. Proc Food Sci. (2015) 5:6–9. doi: 10.1016/j.profoo.2015.09.002
89. Pereira PM, Vicente AF. Meat nutritional composition and nutritive role in the human diet. Meat Sci. (2013) 93:586–92. doi: 10.1016/j.meatsci.2012.09.018
90. Nakyinsige K, Man YBC, Sazili AQ. Halal authenticity issues in meat and meat products. Meat Sci. (2012) 91:207–14. doi: 10.1016/j.meatsci.2012.02.015
91. Downey G, Beauchêne D. Discrimination between fresh and frozen-then-thawed beef m. longissimus dorsi by combined visible-near infrared reflectance spectroscopy: A feasibility study. Meat Sci. (1997) 45:353–63. doi: 10.1016/S0309-1740(96)00127-1
92. Cawthorn D-M, Steinman HA, Hoffman LC. A high incidence of species substitution and mislabelling detected in meat products sold in South Africa. Food Control. (2013) 32:440–9. doi: 10.1016/j.foodcont.2013.01.008
93. Dean N, Murphy TB, Downey G. Using unlabelled data to update classification rules with applications in food authenticity studies. J R Stat Soc Ser C. (2006) 55:1–14. doi: 10.1111/j.1467-9876.2005.00526.x
94. Kademi HI, Ulusoy BH, Hecer C. Applications of miniaturized and portable near infrared spectroscopy (NIRS) for inspection and control of meat and meat products. Food Rev Int. (2019) 35:201–20. doi: 10.1080/87559129.2018.1514624
95. Premanandh J. Horse meat scandal–A wake-up call for regulatory authorities. Food Control. (2013) 34:568–9. doi: 10.1016/j.foodcont.2013.05.033
96. Ballin NZ. Authentication of meat and meat products. Meat Sci. (2010) 86:577–87. doi: 10.1016/j.meatsci.2010.06.001
97. Soares S, Amaral JS, Mafra I, Oliveira MBP. Quantitative detection of poultry meat adulteration with pork by a duplex PCR assay. Meat Sci. (2010) 85:531–6. doi: 10.1016/j.meatsci.2010.03.001
98. Vasconcellos LPdMK, Tambasco-Talhari D, Pereira AP, Coutinho LL, Regitano LCdA. Genetic characterization of Aberdeen Angus cattle using molecular markers. Genet Mol Biol. (2003) 26:133–7. doi: 10.1590/S1415-47572003000200005
99. Mazorra-Manzano MA, Torres-Llanez MJ, González-Córdova AF, Vallejo-Cordoba B. A capillary electrophoresis method for the determination of hydroxyproline as a collagen content index in meat products. Food Anal Methods. (2012) 5:464–70. doi: 10.1007/s12161-011-9271-8
100. Vallejo-Cordoba B, Rodríguez-Ramírez R, González-Córdova AF. Capillary electrophoresis for bovine and ostrich meat characterisation. Food Chem. (2010) 120:304–7. doi: 10.1016/j.foodchem.2009.09.080
101. Kamruzzaman M, Barbin D, ElMasry G, Sun D-W, Allen P. Potential of hyperspectral imaging and pattern recognition for categorization and authentication of red meat. Innov Food Sci Emerg Technol. (2012) 16:316–25. doi: 10.1016/j.ifset.2012.07.007
102. Sowoidnich K, Kronfeldt H-D. Shifted excitation Raman difference spectroscopy at multiple wavelengths for in-situ meat species differentiation. Appl Phys B. (2012) 108:975–82. doi: 10.1007/s00340-012-5160-0
103. Nolasco-Perez IM, Rocco LA, Cruz-Tirado JP, Pollonio MA, Barbon S, Barbon APA, et al. Comparison of rapid techniques for classification of ground meat. Biosyst Eng. (2019) 183:151–9. doi: 10.1016/j.biosystemseng.2019.04.013
104. Pospiech M, Zikmund T, Javùrková Z, Kaiser J, Tremlová B. An innovative detection of mechanically separated meat in meat products. Food Anal Methods. (2019) 12:652–7. doi: 10.1007/s12161-018-1394-8
105. Ghidini S, Varrà MO, Zanardi E. Approaching authenticity issues in fish and seafood products by qualitative spectroscopy and chemometrics. Molecules. (2019) 24:1812. doi: 10.3390/molecules24091812
106. Kamruzzaman M, Makino Y, Oshita S, Liu S. Assessment of visible near-infrared hyperspectral imaging as a tool for detection of horsemeat adulteration in minced beef. Food Bioprocess Technol. (2015) 8:1054–62. doi: 10.1007/s11947-015-1470-7
107. Loffredi E, Grassi S, Alamprese C. Spectroscopic approaches for non-destructive shell egg quality and freshness evaluation: Opportunities and challenges. Food Control. (2021) 129:108255. doi: 10.1016/j.foodcont.2021.108255
108. de Santana FB, Neto WB, Poppi RJ. Random forest as one-class classifier and infrared spectroscopy for food adulteration detection. Food Chem. (2019) 293:323–32. doi: 10.1016/j.foodchem.2019.04.073
109. Amane D, Ananthanarayan L. Detection of adulteration in black gram-based food products using DNA barcoding. Food Control. (2019) 104:193–200. doi: 10.1016/j.foodcont.2019.04.041
110. Acutis PL, Cambiotti V, Riina MV, Meistro S, Maurella C, Massaro M, et al. Detection of fish species substitution frauds in Italy: A targeted National Monitoring Plan. Food Control. (2019) 101:151–5. doi: 10.1016/j.foodcont.2019.02.020
111. Chai Z, Wang C, Bi H. Rapid identification between two fish species using UV-vis spectroscopy for substitution detection. Molecules. (2021) 26:6529. doi: 10.3390/molecules26216529
112. Zhang X-Y, Hu W, Teng J, Peng H-H, Gan J-H, Wang X-C, et al. Rapid recognition of marine fish surimi by one-step discriminant analysis based on near-infrared diffuse reflectance spectroscopy. Int J Food Propert. (2017) 20:2932–43. doi: 10.1080/10942912.2016.1261153
113. Velioğlu HM, Temiz HT, Boyaci IH. Differentiation of fresh and frozen-thawed fish samples using Raman spectroscopy coupled with chemometric analysis. Food Chem. (2015) 172:283–90. doi: 10.1016/j.foodchem.2014.09.073
114. Wang C, Li X, Zhao X, Bi H, Xie J. The investigation of storage situation of fish muscle via the analysis of its exudate by MALDI-TOF MS. Food Chem. (2022) 373:131450. doi: 10.1016/j.foodchem.2021.131450
115. Bi H, Zhong C, Shao M, Wang C, Yi J, Qiao L, et al. Differentiation and authentication of fishes at the species level through analysis of fish skin by matrix-assisted laser desorption/ionization time-of-flight mass spectrometry. Rapid Commun Mass Spectrom. (2019) 33:1336–43. doi: 10.1002/rcm.8474
116. Shao M, Bi H. Direct identification of fish species by surface molecular transferring. Analyst. (2020) 145:4148–55. doi: 10.1039/D0AN00510J
117. Wang C, Bi H, Xie J. Visualization of the distance among fishes by MALDI MS for rapid determination of the taxonomic status of fish fillets. J Agric Food Chem. (2020) 68:8438–46. doi: 10.1021/acs.jafc.0c01291
118. Wang C, Bi H. Super-fast seafood authenticity analysis by One-step pretreatment and comparison of mass spectral patterns. Food Control. (2021) 123:107751. doi: 10.1016/j.foodcont.2020.107751
119. Reilly A. Overview of food fraud in the fisheries sector. Rome: FAO Fisheries and Aquaculture Circular (2018).
120. Everstine K, Spink J, Kennedy S. Economically motivated adulteration (EMA) of food: Common characteristics of EMA incidents. J Food Protect. (2013) 76:723–35. doi: 10.4315/0362-028X.JFP-12-399
121. Gayo J. Species authenticity and detection of economic adulteration of Atlantic blue crab meat using VIS/NIR spectroscopy. Raleigh: North Carolina State University (2006).
122. Gayo J, Hale SA, Blanchard SM. Quantitative analysis and detection of adulteration in crab meat using visible and near-infrared spectroscopy. J Agric Food Chem. (2006) 54:1130–6. doi: 10.1021/jf051636i
123. Brodersen K, Bremner H. Exploration of the use of NIR reflectance spectroscopy to distinguish and measure attributes of conditioned and cooked shrimp (Pandalus borealis). LWT Food Sci Technol. (2001) 34:533–41. doi: 10.1006/fstl.2001.0802
124. Qu J-H, Cheng J-H, Sun D-W, Pu H, Wang Q-J, Ma J. Discrimination of shelled shrimp (Metapenaeus ensis) among fresh, frozen-thawed and cold-stored by hyperspectral imaging technique. LWT Food Sci Technol. (2015) 62:202–9. doi: 10.1016/j.lwt.2015.01.018
125. Wu D, Shi H, He Y, Yu X, Bao Y. Potential of hyperspectral imaging and multivariate analysis for rapid and non-invasive detection of gelatin adulteration in prawn. J Food Eng. (2013) 119:680–6. doi: 10.1016/j.jfoodeng.2013.06.039
126. Ottavian M, Facco P, Fasolato L, Novelli E, Mirisola M, Perini M, et al. Use of near-infrared spectroscopy for fast fraud detection in seafood: Application to the authentication of wild European sea bass (Dicentrarchus labrax). J Agric Food Chem. (2012) 60:639–48. doi: 10.1021/jf203385e
127. Rašković B, Heinke R, Rösch P, Popp J. The potential of Raman spectroscopy for the classification of fish fillets. Food Anal Methods. (2016) 9:1301–6. doi: 10.1007/s12161-015-0312-6
128. Saraiva C, Vasconcelos H, de Almeida JM. A chemometrics approach applied to Fourier transform infrared spectroscopy (FTIR) for monitoring the spoilage of fresh salmon (Salmo salar) stored under modified atmospheres. Int J Food Microbiol. (2017) 241:331–9. doi: 10.1016/j.ijfoodmicro.2016.10.038
129. Zhou J, Wu X, Chen Z, You J, Xiong S. Evaluation of freshness in freshwater fish based on near infrared reflectance spectroscopy and chemometrics. Lwt. (2019) 106:145–50. doi: 10.1016/j.lwt.2019.01.056
130. Leung MM-L, Ho Y-W, Lee C-H, Wang Y, Hu M, Kwok KWH, et al. Improved Raman spectroscopy-based approach to assess microplastics in seafood. Environ Pollut. (2021) 289:117648. doi: 10.1016/j.envpol.2021.117648
131. Fiorino GM, Losito I, De Angelis E, Arlorio M, Logrieco AF, Monaci L. Assessing fish authenticity by direct analysis in real time-high resolution mass spectrometry and multivariate analysis: Discrimination between wild-type and farmed salmon. Food Res Int. (2019) 116:1258–65. doi: 10.1016/j.foodres.2018.10.013
132. Farabegoli F, Pirini M, Rotolo M, Silvi M, Testi S, Ghidini S, et al. Toward the authentication of european sea bass origin through a combination of biometric measurements and multiple analytical techniques. J Agric Food Chem. (2018) 66:6822–31. doi: 10.1021/acs.jafc.8b00505
133. Caglayan MO, Üstündağ Z, Şahin S. Spectroscopic ellipsometry methods for brevetoxin detection. Talanta. (2022) 237:122897. doi: 10.1016/j.talanta.2021.122897
134. Heude C, Elbayed K, Jezequel T, Fanuel M, Lugan R, Heintz D, et al. Metabolic characterization of caviar specimens by 1H NMR spectroscopy: Towards caviar authenticity and integrity. Food Anal Methods. (2016) 9:3428–38. doi: 10.1007/s12161-016-0540-4
135. Chen Z, Wu T, Xiang C, Xu X, Tian X. Rapid identification of rainbow trout adulteration in Atlantic salmon by Raman spectroscopy combined with machine learning. Molecules. (2019) 24:2851. doi: 10.3390/molecules24152851
136. Yu X, Li L, Wang H, Song G, Wang J, Li S, et al. Lipidomics study of rainbow trout (Oncorhynchus mykiss) and salmons (Oncorhynchus tshawytscha and Salmo salar) using hydrophilic interaction chromatography and mass spectrometry. LWT. (2020) 121:108988. doi: 10.1016/j.lwt.2019.108988
137. Leng T, Li F, Xiong L, Xiong Q, Zhu M, Chen Y. Quantitative detection of binary and ternary adulteration of minced beef meat with pork and duck meat by NIR combined with chemometrics. Food Control. (2020) 113:107203. doi: 10.1016/j.foodcont.2020.107203
138. Yang L, Wu T, Liu Y, Zou J, Huang Y, Babu VS, et al. Rapid identification of pork adulterated in the beef and mutton by infrared spectroscopy. J Spectrosc. (2018) 2018:1–10. doi: 10.1155/2018/2413874
139. Gao F, Xu L, Zhang Y, Yang Z, Han L, Liu X. Analytical Raman spectroscopic study for discriminant analysis of different animal-derived feedstuff: Understanding the high correlation between Raman spectroscopy and lipid characteristics. Food Chem. (2018) 240:989–96. doi: 10.1016/j.foodchem.2017.07.143
140. Chu YW, Tang SS, Ma SX, Ma YY, Hao ZQ, Guo YM, et al. Accuracy and stability improvement for meat species identification using multiplicative scatter correction and laser-induced breakdown spectroscopy. Opt Express. (2018) 26:10119–27. doi: 10.1364/OE.26.010119
141. Fornal E, Montowska M. Species-specific peptide-based liquid chromatography–mass spectrometry monitoring of three poultry species in processed meat products. Food Chem. (2019) 283:489–98. doi: 10.1016/j.foodchem.2019.01.074
142. Hu Y, Zou L, Huang X, Lu X. Detection and quantification of offal content in ground beef meat using vibrational spectroscopic-based chemometric analysis. Sci Rep. (2017) 7:1–9. doi: 10.1038/s41598-017-15389-3
143. Liu Y, Ren X, Yu H, Cheng Y, Guo Y, Yao W, et al. Non-destructive and online egg freshness assessment from the egg shell based on Raman spectroscopy. Food Control. (2020) 118:107426. doi: 10.1016/j.foodcont.2020.107426
144. Joshi R, Lohumi S, Joshi R, Kim MS, Qin J, Baek I, et al. Raman spectral analysis for non-invasive detection of external and internal parameters of fake eggs. Sens Actuators B Chem. (2020) 303:127243. doi: 10.1016/j.snb.2019.127243
145. Chen H, Tan C, Lin Z. Non-destructive identification of native egg by near-infrared spectroscopy and data driven-based class-modeling. Spectrochim Acta Part A Mol Biomol Spectrosc. (2019) 206:484–90. doi: 10.1016/j.saa.2018.08.041
146. Ackermann SM, Lachenmeier DW, Kuballa T, Schütz B, Spraul M, Bunzel MNMR. -based differentiation of conventionally from organically produced chicken eggs in Germany. Magn Reson Chem. (2019) 57:579–88. doi: 10.1002/mrc.4838
147. Ropodi AI, Panagou EZ, Nychas G-JE. Multispectral imaging (MSI): A promising method for the detection of minced beef adulteration with horsemeat. Food Control. (2017) 73:57–63. doi: 10.1016/j.foodcont.2016.05.048
148. Coombs CE, Liddle RR, González LA. Portable vibrational spectroscopic methods can discriminate between grass-fed and grain-fed beef. J Near Infrared Spectrosc. (2021) 29:321–9. doi: 10.1177/09670335211049506
149. Hebling E Tavares JP, da Silva Medeiros ML, Barbin DF. Near-infrared techniques for fraud detection in dairy products: A review. J Food Sci. (2022) 87:1943–60. doi: 10.1111/1750-3841.16143
150. Ayvaz H, Mortas M, Dogan MA, Atan M, Yildiz Tiryaki G, Karagul Yuceer Y. Near-and mid-infrared determination of some quality parameters of cheese manufactured from the mixture of different milk species. J. Food Sci Technol. (2021) 58:3981–92. doi: 10.1007/s13197-020-04861-0
151. Chen H, Tan C, Lin Z, Wu T. Detection of melamine adulteration in milk by near-infrared spectroscopy and one-class partial least squares. Spectrochim Acta Part A Mol Biomol Spectrosc. (2017) 173:832–6. doi: 10.1016/j.saa.2016.10.051
152. Coppa M, Martin B, Agabriel C, Chassaing C, Sibra C, Constant I, et al. Authentication of cow feeding and geographic origin on milk using visible and near-infrared spectroscopy. J Dairy Sci. (2012) 95:5544–51. doi: 10.3168/jds.2011-5272
153. Villa C, Costa J, Oliveira MBP, Mafra I. Bovine milk allergens: A comprehensive review. Compr Rev Food Sci Food Saf. (2018) 17:137–64. doi: 10.1111/1541-4337.12318
154. Baptista M, Cunha JT, Domingues L. DNA-based approaches for dairy products authentication: A review and perspectives. Trends Food Sci Technol. (2021) 109:386–97. doi: 10.1016/j.tifs.2021.01.043
155. Cirak O, Icyer NC, Durak MZ. Rapid detection of adulteration of milks from different species using Fourier transform infrared spectroscopy (FTIR). J Dairy Res. (2018) 85:222–5. doi: 10.1017/S0022029918000201
156. Mafra I, Honrado M, Amaral JS. Animal species authentication in dairy products. Foods. (2022) 11:1124. doi: 10.3390/foods11081124
157. Abbas O, Zadravec M, Baeten V, Mikuš T, Lešić T, Vulić A, et al. Analytical methods used for the authentication of food of animal origin. Food Chem. (2018) 246:6–17. doi: 10.1016/j.foodchem.2017.11.007
158. Pereira EVdS, Fernandes DDdS, de Araújo MCU, Diniz PHGD, Maciel MIS. Simultaneous determination of goat milk adulteration with cow milk and their fat and protein contents using NIR spectroscopy and PLS algorithms. LWT. (2020) 127:109427. doi: 10.1016/j.lwt.2020.109427
159. Mabood F, Jabeen F, Ahmed M, Hussain J, Al Mashaykhi SA, Al Rubaiey ZM, et al. Development of new NIR-spectroscopy method combined with multivariate analysis for detection of adulteration in camel milk with goat milk. Food Chem. (2017) 221:746–50. doi: 10.1016/j.foodchem.2016.11.109
160. Zhang L-G, Zhang X, Ni L-J, Xue Z-B, Gu X, Huang S-X. Rapid identification of adulterated cow milk by non-linear pattern recognition methods based on near infrared spectroscopy. Food Chem. (2014) 145:342–8. doi: 10.1016/j.foodchem.2013.08.064
161. Tsenkova R, Atanassova S, Morita H, Ikuta K, Toyoda K, Iordanova IK, et al. Near infrared spectra of cows’ milk for milk quality evaluation: Disease diagnosis and pathogen identification. J Near Infrared spectrosc. (2006) 14:363–70. doi: 10.1255/jnirs.661
162. González-Martín MI, Vivar-Quintana AM, Revilla I, Salvador-Esteban J. The determination of fatty acids in cheeses of variable composition (cow, ewe’s, and goat) by means of near infrared spectroscopy. Microchem J. (2020) 156:104854. doi: 10.1016/j.microc.2020.104854
163. Santos PM, Pereira-Filho ER, Rodriguez-Saona LE. Rapid detection and quantification of milk adulteration using infrared microspectroscopy and chemometrics analysis. Food Chem. (2013) 138:19–24. doi: 10.1016/j.foodchem.2012.10.024
164. Balan B, Dhaulaniya AS, Jamwal R, Yadav A, Kelly S, Cannavan A, et al. Rapid detection and quantification of sucrose adulteration in cow milk using Attenuated total reflectance-Fourier transform infrared spectroscopy coupled with multivariate analysis. Spectrochim Acta Part A Mol Biomol Spectrosc. (2020) 240:118628. doi: 10.1016/j.saa.2020.118628
165. Upadhyay N, Jaiswal P, Jha SN. Application of attenuated total reflectance Fourier Transform Infrared spectroscopy (ATR–FTIR) in MIR range coupled with chemometrics for detection of pig body fat in pure ghee (heat clarified milk fat). J Mol Struc. (2018) 1153:275–81. doi: 10.1016/j.molstruc.2017.09.116
166. Temiz HT, Sezer B, Berkkan A, Tamer U, Boyaci IH. Assessment of laser induced breakdown spectroscopy as a tool for analysis of butter adulteration. J Food Compost Anal. (2018) 67:48–54. doi: 10.1016/j.jfca.2017.12.032
167. Moncayo S, Manzoor S, Rosales JD, Anzano J, Caceres JO. Qualitative and quantitative analysis of milk for the detection of adulteration by laser induced breakdown spectroscopy (LIBS). Food Chem. (2017) 232:322–8. doi: 10.1016/j.foodchem.2017.04.017
168. Uysal RS, Boyaci IH, Genis HE, Tamer U. Determination of butter adulteration with margarine using Raman spectroscopy. Food Chem. (2013) 141:4397–403. doi: 10.1016/j.foodchem.2013.06.061
169. Fu X, Kim MS, Chao K, Qin J, Lim J, Lee H, et al. Detection of melamine in milk powders based on NIR hyperspectral imaging and spectral similarity analyses. J Food Eng. (2014) 124:97–104. doi: 10.1016/j.jfoodeng.2013.09.023
170. Lim J, Kim G, Mo C, Kim MS, Chao K, Qin J, et al. Detection of melamine in milk powders using near-infrared hyperspectral imaging combined with regression coefficient of partial least square regression model. Talanta. (2016) 151:183–91. doi: 10.1016/j.talanta.2016.01.035
171. Barreto A, Cruz-Tirado J, Siche R, Quevedo R. Determination of starch content in adulterated fresh cheese using hyperspectral imaging. Food Biosci. (2018) 21:14–9. doi: 10.1016/j.fbio.2017.10.009
172. Durakli Velioglu S, Ercioglu E, Boyaci IH. Rapid discrimination between buffalo and cow milk and detection of adulteration of buffalo milk with cow milk using synchronous fluorescence spectroscopy in combination with multivariate methods. J Dairy Res. (2017) 84:214–9. doi: 10.1017/S0022029917000073
Keywords: dairy products, authentication, animal based products, spectroscopic techniques, pre-processing, chemometrics
Citation: Chaudhary V, Kajla P, Dewan A, Pandiselvam R, Socol CT and Maerescu CM (2022) Spectroscopic techniques for authentication of animal origin foods. Front. Nutr. 9:979205. doi: 10.3389/fnut.2022.979205
Received: 27 June 2022; Accepted: 29 August 2022;
Published: 20 September 2022.
Edited by:
Adriana Silva Franca, Federal University of Minas Gerais, BrazilReviewed by:
Daniel Cozzolino, University of Queensland, AustraliaJasenka Gajdoš Kljusurić, University of Zagreb, Croatia
Despina P. Kalogianni, University of Patras, Greece
Copyright © 2022 Chaudhary, Kajla, Dewan, Pandiselvam, Socol and Maerescu. This is an open-access article distributed under the terms of the Creative Commons Attribution License (CC BY). The use, distribution or reproduction in other forums is permitted, provided the original author(s) and the copyright owner(s) are credited and that the original publication in this journal is cited, in accordance with accepted academic practice. No use, distribution or reproduction is permitted which does not comply with these terms.
*Correspondence: Priyanka Kajla, a2FqbGFwcml5YW5rYTE4QGdtYWlsLmNvbQ==; R. Pandiselvam, YW5idXBhbmRpMTk4OUB5YWhvby5jby5pbg==; Claudia Terezia Socol, Y2xhdXNvY29sQHlhaG9vLmNvbQ==