 Ling Ao1,2Kai Guo1,2Xinran Dai1,2
 Wei Dong1,2*Xiaotao Sun1,2Baoguo Sun1,2
 Jinyuan Sun1,2*Guoying Liu3Anjun Li3
 Hehe Li1,2
 Fuping Zheng1,2
- 1Beijing Laboratory of Food Quality and Safety, Beijing Technology and Business University, Beijing, China
- 2Key Laboratory of Brewing Molecular Engineering of China Light Industry, School of Light Industry, Beijing, China
- 3Center for Solid-state Fermentation Engineering of Anhui Province, Bozhou, China
Nowadays, the classification of strong-aroma types of base Baijiu (base SAB) is mainly achieved by human sensory evaluation. However, prolonged tasting brings difficulties for sommeliers in guaranteeing the consistency of results, and may even cause health problems. Herein, an electronic tongue (E-Tongue) combined with a gas chromatography-mass spectrometry (GC-MS) method was successfully developed to grade high-alcoholic base SAB. The E-tongue was capable of identifying base SAB samples into four grades by a discriminant function analysis (DFA) model based on human sensory evaluation results. More importantly, it could effectively and rapidly predict the quality grade of unknown base SAB with an average accuracy up to 95%. The differences of chemical components between base SAB samples were studied by the GC-MS analysis and 52 aroma compounds were identified. The qualitative and quantitative results showed that with the increase of base SAB grade, the varieties and contents of aroma compounds increased. Overall, the comprehensive analysis of E-tongue data and GC-MS results could be in good agreement with human sensory evaluation results, which also proved that the newly developed method has a potential to be a useful alternative to the overall quality grading of base Baijiu.
Introduction
Baijiu, also called as Chinese liquor or spirit, is one of the most popular alcoholic beverages in China, with the annual production of about 7.156 billion liters in 2021 (1). Baijiu is mainly composed of water, ethanol, and other trace flavor compounds, in which the mass fraction of flavor compounds account for approximately 1–2% of the total mass of Baijiu. Although the proportion of the aforementioned flavor substances in Baijiu is relatively low, the quantitative blending of these flavor substances will play the most important role in the overall aroma. In decades, on the basis of its aroma characteristics, Baijiu are generally classified into twelve categories, such as strong, soy sauce, light, sesame, Chi, complex (Jian), herblike, Feng, rice, Fuyu, Te, and Laobaigan aroma-types (2). With the largest production among them, strong-aroma types of Baijiu (SAB) have gained popularity due to their sensory characterization, such as rich mellow, sweet, and pure, particularly the fragrant after drinking and aftertaste (3).
Based on the characteristics of SAB production, the fresh distillates (base SAB) and the finished product (commercial SAB) are both called SAB (4). In general, during SAB production, freshly distilled base SAB usually has undesirable characteristics and is not preferable for drinking (5). It needs to go through a long aging process, ranging from months to years, to develop a well-balanced “matured” Baijiu (6). Finally, the aforementioned base Baijiu is blended by sommeliers to obtain commercial SAB with standardized flavor and taste. Until now, the classification of base SAB is conventionally graded according to the human sensory evaluation (7). Moreover, coupled with multivariate data analysis (MVDA), the correlation between the chemical profiles and sensory evaluation of samples could be also demonstrated successfully (8). Recently, the contributions of many key aroma compounds to the overall flavor of Baijiu have been identified in this way, such as the “mud-like” aromas in base SAB (9), retronasal “burnt” flavor in soy sauce aroma-types of Baijiu (10), and the sweetness perception of Baijiu (11). However, the method mentioned above is susceptible to environmental impacts and subjective factors, making it difficult to ensure the results during a prolonged tasting in the busy season. More importantly, long-term and abundant base Baijiu tasting does harm to the sommelier because of the high alcohol content (generally at 60–70% alcohol by volume, ABV). Hence, developing a rapid and efficient method for the base SAB classification is of great value and demand.
The electronic tongue (E-tongue) is a kind of human sensory simulating system, which consists of a number of low-selective sensors and uses advanced mathematical procedures for signal processing based on pattern recognition and multivariate data analysis (12). In recent years, E-tongue has been widely used for the analysis of wines, fruit juices, coffee, milk, and beverages, in addition to the detection of trace amounts of impurities or pollutants in waters (13, 14). Moreover, it also has been extensively used for the discrimination of alcoholic beverages by their variety, age, taste, and geographical origin, and it can eliminate panelist bias for taste evaluation of liquor products (15, 16). For instance, an exploratory study was conducted by Schmidtke et al. whose results indicated that bitterness and astringency could be predicted from wines with good precision by using E-tongue and sensory evaluation (17). Legin et al. evaluated 56 Italian wines by recognition and quantitative analysis of E-tongue and concluded that E-tongue was capable of discriminating Barbera d’Asti and Gutturnio wines (18). However, the sensitivity of sensors is easily reduced or lost in high alcohol content.
Due to the high alcohol content of base SAB, the ability of alcohol tolerance of sensors determines whether they are suitable for the analysis of base SAB. Currently, it has been proved by numerous researchers that E-tongue based on inert metal electrodes or modified epoxy-composite sensors could be a good instrument for the distilling spirits analysis (19, 20). Among them, the Smartongue is a kind of E-tongue based on multifrequency large amplitude pulse voltammetry (MLAPV). More importantly, based on a combination of pulse applied relaxation techniques combined with the specific pattern recognition system and multivariate statistical analysis, a lot of signals could be processed more accurately and effectively by MLAPV compared with other sensors (16, 20). In 2007, Tian et al. discriminated six Baijiu samples successfully by using an electronic tongue based on MLAPV coupled with a series of metal electrodes at different frequency segments (21). However, to the best of our knowledge, only a few studies have been reported dealing with the application of E-tongue based on inert metal electrode sensors for the classification of base SAB. Moreover, they simply focused on the differences in statistics without considering the chemical composition.
Therefore, the main objectives of this work were to (i) grade the quality attributes of base SAB by the electronic tongue combined with gas chromatography-mass spectrometry (GC-MS), (ii) establish prediction models by principal component analysis (PCA) or discriminant function analysis (DFA) according to sensory evaluation results, and (iii) better elucidate the differences of aroma compounds from each grade of base SAB using the GC-MS analysis and compared with the national standard of GB/T 10781.1-2021. These results will be useful for the quick quality grading of SAB from the Baijiu industry.
Materials and methods
Chemicals
Authentic standards, including twenty-seven kinds of esters (ethyl acetate, ethyl butanoate, ethyl pentanoate, ethyl 4-methylpentanoate, ethyl hexanoate, hexyl acetate, propyl hexanoate, ethyl lactate, ethyl heptanoate, butyl hexanoate, ethyl octanoate, isopentyl hexanoate, hexyl hexanoate, ethyl decanoate, isoamyl octanoate, ethyl benzoate, diethyl butanedioate, ethyl phenylacetate, hexyl octanoate, ethyl dodecanoate, ethyl 3-phenylpropionate, ethyl tetradecanoate, ethyl hexadecanoate, ethyl octadecanoate, ethyl oleate, ethyl linoleate, and ethyl linolenate), twelve types of alcohols (1-propanol, 1-butanol, 2-butanol, 2-methylpropanol, 1-pentanol, 2-pentanol, 2-methylbutanol, 3-methylbutanol, 1-hexanol, 1-octanol, 2,3-butanediol, and phenylethyl alcohol), nine kinds of acids (acetic acid, 2-methylpropanoic acid, butanoic acid, 3-methylbutanoic acid, pentanoic acid, 4-methylpentanoic acid, hexanoic acid, heptanoic acid, and octanoic acid), three kinds of phenols (4-methylguaiacol, 4-ethylguaiacol, and 4-methylphenol), and one kind of acetal (diethyl acetal), were all purchased from Sigma-Aldrich (Beijing, China). Compounds, such as 4-octanol (internal standard, IS1), 4-hydroxy-2-butanone (IS2), n-pentyl acetate (IS3), and 2-ethylbutyric acid (IS4), used as internal standards in this study, were purchased from Sigma-Aldrich (Beijing, China). A C5-C30 n-alkane mixture (Sigma-Aldrich, Beijing, China) was employed for the determination of linear retention indices (RIs). Sodium chloride, anhydrous sodium sulfate, dichloromethane, kalium chloratum, and absolute ethanol were purchased from Sinopharm Chemical Reagent Co., Ltd. (Beijing, China). All the chemicals used above were of analytical reagent grade, with at least 97% purity.
Sampling and sample preparation
Sampling
A total of 140 base SAB samples from 140 different pits were obtained from Anhui Gujing Distillery Co., Ltd., (Anhui, China), with alcohol content ranging from 55 to 70% ABV. All samples (125 ml from each bottle) were stored at 4°C until analysis.
Sample preparation of base SAB for liquid-liquid extraction
According to the method reported by Zheng, and associated with some modifications (22), a total of 25 ml of base SAB sample was diluted to 10% ABV with Milli-Q water (Millipore, Bedford, MA, United States). Before being used, the water was boiled for 5 min, and then cooled to 20°C in a 1.0 L flask. The diluted base SAB sample was saturated with NaCl, and extracted 3 times with freshly distilled dichloromethane (50.0 ml each time). The dichloromethane extracts (about 150.0 ml) were dried with plenty of anhydrous Na2SO4 overnight, concentrated to a final volume of 1.0 ml under a gentle stream of nitrogen, and then the concentrated extracts were stored at −20°C before GC-MS analysis.
Sensory evaluation
Each base SAB sample (20 ml) was subjected to sensory descriptive judgment by the sommeliers at 20°C after it was poured into a glass cup. The procedure was conducted in a sensory laboratory following the national standard of GB/T 10345-2007 (23). There were eight panelists (4 men and 4 women, composed of a team, including 4 junior sommeliers, 2 intermediate sommeliers, 2 senior sommeliers, and age range 25–40 years) participating in the sensory evaluation session with a weighted score in this research. The weights of junior sommeliers, intermediate sommeliers, and senior sommeliers were 0.8, 1.0, and 1.2, respectively. The panelists were required to rinse their mouth thoroughly with purified water and rest for 1.0 min at least between two-samples-tasting and rest 10.0 min or more per four-samples-tasting. Each sample, randomly marked with a three-digit number, was presented randomly.
Smartongue analysis
In total, 140 target base SAB samples were analyzed by Smartongue (RuiFen International Trading Co., Ltd., Shanghai, China). The sensor of Smartongue should be preheated successively with 20.0 ml of 0.01 mol/L KCl solution and 20.0 ml SAB samples after each start of Smartongue. The programmed parameters of Smartongue were set as follows: the step voltage was set at 0.2 V, and 6 sensors were all chosen at 10–4 sensitivity. Each base SAB (20.0 ml) was subjected to test by the Smartongue at 20°C in a glass cup. Between each measurement, the sensors were rinsed with 25.0 ml of deionized water. Three replicate measurements were conducted for each base SAB sample.
GC-MS analysis
Qualitative analysis
The aroma compounds in the base SAB samples were detected by both direct injection and liquid–liquid extraction coupled with GC-MS method (3). The GC-MS analysis of base SAB samples was performed on an Agilent 7890 gas chromatograph equipped with an Agilent 5977A mass-selective detector (MSD) and a DB-WAX column (60 m × 0.25 mm i.d., 0.25 μm film thickness, J&W Scientific). The column carrier gas was helium at a constant flow rate of 1.0 ml/min and the direct injection volume was 1.0 μl with a split ratio of 5:1. The injector temperature was set at 250°C. The oven temperature was held at 40°C for 0.5 min, then programmed to 50°C at a rate of 10°C/min and held for 8 min and then, programmed to 70°C at a rate of 3°C/min and held for 5 min afterward. Next, it was programmed to 187°C at a rate of 3°C/min and held for 1 min, and finally programmed to 230°C at a rate of 5°C/min and held for 4 min. The temperature of the mass-selective detector transfer line was kept at 240°C. Mass spectra in the electron ionization mode (EI) were recorded at 70 eV. The temperature of the ion source was 230°C, and the mass range was from 40 to 500 amu at full-scan mode. Peak identifications of the odorants were performed by comparison of mass spectra with those of the NIST 19.0 database (Agilent Technologies Inc., Santa Clara, CA, United States). Positive identification was achieved by comparison of their retention indices (RIs) and mass spectra with those of pure standards. The RIs of the odorants were calculated from the retention times of n-alkanes (C5–C30), according to a modified Kovats method (24).
To confirm the identification of these aroma compounds, the analytical procedures were also performed on a TG-5MS non-polar capillary column (5% phenyl methylpolysiloxane, 30 m × 0.25 mm × 0.25 μm, Thermo Fisher Scientific). The GC-MS analysis of extracts was implemented by a Thermo Trace 1300 gas chromatograph equipped with a Thermo ISQ LT mass selective detector system (Thermo Fisher Scientific). Helium (> 99.999%) was applied as the carrier gas at a flow rate of 1.0 ml/min. The temperature of the injector was set at 250°C. The oven temperature was programmed as follows: 40°C for 2 min, 1°C/min up to 50°C and held for 2 min, 3°C/min up to 70°C and held for 3 min, 6°C/min up to 230°C and held for 2 min, and 20°C/min up to 320°C and held for 4 min. All injections were set in split mode, and the split ratio was 30:1. The mass spectrometer was operated in the electron ionization mode with electron energy set as 70 eV and the mass range was from 43 to 500 amu at full-scan mode. The transfer line and ion source temperatures were both set to 300°C. Most aroma compounds were identified by comparing their retention indices (RIs) and mass spectra with those of pure standards.
Quantitative analysis
Quantitative analyses were routinely performed following the IS method, and the internal standard compounds were n-pentyl acetate, 4-octanol, 4-hydroxy-2-butanone, and 2-ethylbutyric acid. The selected ion monitoring (SIM) mode was adopted, and each analyte was quantified on the basis of the peak area using one quantitative fragment and two qualitative fragments (Table 1). The selected quantitative ions of the four IS were m/z 70, 69, 43, and 73, respectively. Moreover, standard calibration curves were used to quantify the target aroma compounds using a suitable capillary column based on the ratio of the peak area of the compound relative to the peak area of the internal standard to determine the concentration of the analyte.
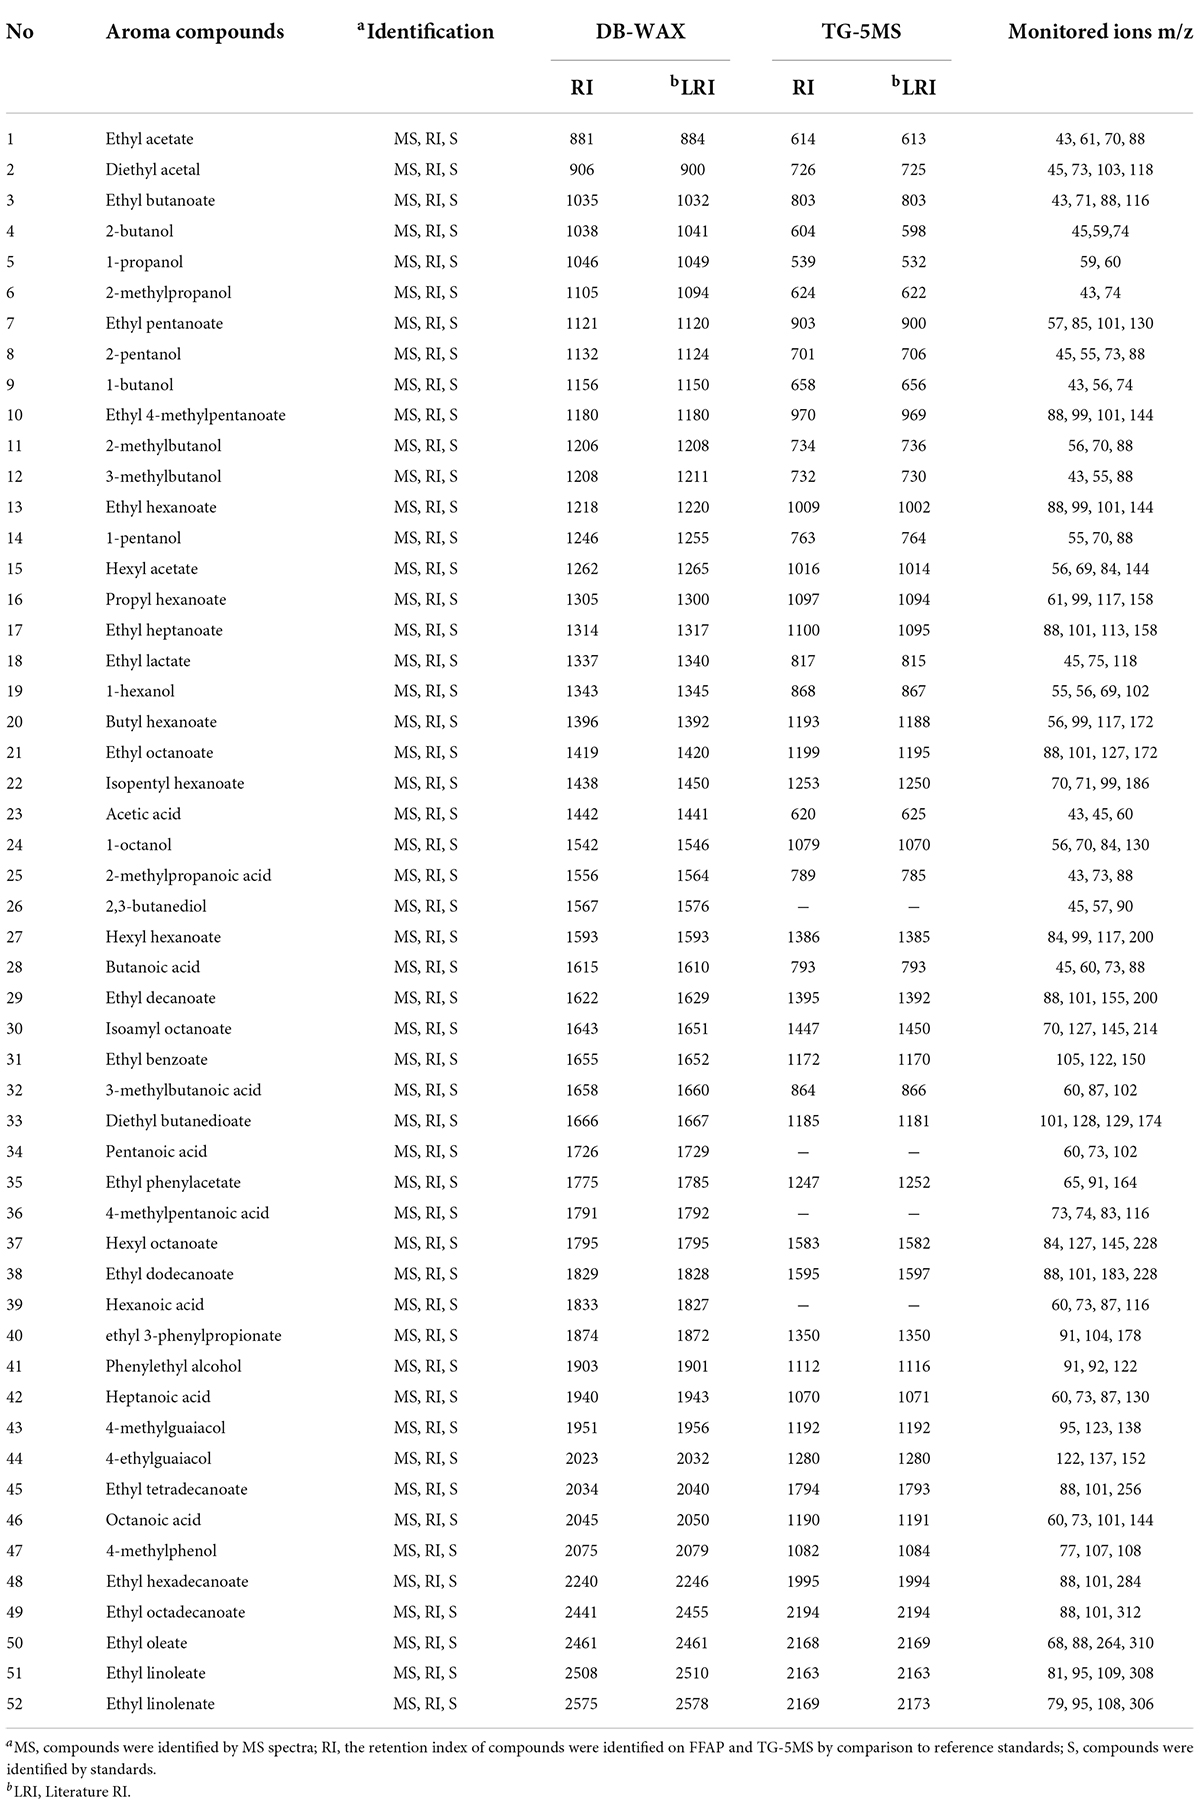
Table 1. Aroma compounds identified by gas chromatography-mass spectrometry (GC-MS) in four grades of strong-aroma types of base Baijiu (base SAB).
Statistical analysis
All chemical analyses in this work were carried out in triplicate, and the concentrations of each aroma compound acquired from GC-MS analysis were expressed as the means ± standard deviation (SD). The raw data obtained from the Smartongue were analyzed by both PCA and DFA pattern recognition techniques. PCA is mainly used to model, compress, and visualize multivariate data by setting a new coordinate system in which Euclidean distances between the objects remain the same. As a well-known unsupervised method, PCA allows the reduction of multidimensional data and simplifies the interpretation of the data by a few principal components (25). DFA is used to examine differences between or among groups by using a discriminant prediction equation, which allows for the rejection of variables that are little related to group distinctions (26). Among them, 120 types of base SAB samples were used to establish a quality grading model through PCA and DFA by the Smartongue system version 3.0 as a calibration set. The rest 20 base SAB samples were used to verify these models as validation set.
Results and discussion
Sensory evaluation
A total of 140 base SAB samples were classified into 4 grades (A, B, C, and D) through their taste characteristics by the eight sommeliers, and 35 types of base SAB samples of each grade were included. Among the sensory evaluation of these four grades, the base SAB from grades A, B, and C all showed strong cellar fragrance, pure, long aftertaste, and no peculiar smell with a tendency to decrease; however, grade D showed fermented grains flavor, less cellar fragrance, and short aftertaste. These results suggest that the rank of four grades from good to bad were successively A, B, C, and D according to the sensory requirements of national standard of GB/T 10781.1-2021 (27).
Smartongue analysis
In this study, 120 types of base SAB samples of 4 different grades (30 samples of each grade) were tested by the Smartongue and the map of its PCA and DFA are shown in Figure 1. As shown in Figure 1A, base SAB samples of grade C and grade D could be classified apparently by PCA; however, base SAB from grade A and grade B can be only discriminated with a little overlap. Moreover, Figure 1A also shows the score plot relative to the first and second principal components (PC1 and PC2) were 52.48 and 10.46%, respectively. The total principal component score (62.94%) indicated that base SAB samples could only be discriminated by PCA roughly. The discrimination index (DI, a number to evaluate the separation level for the above non-linear multivariate data analysis methods and its maximum DI value is 100%, indicating the best separation of the samples) value of PCA is 64.67, which also means base SAB samples could be discriminated reluctantly. As can be observed in Figure 1B, the four grades base SAB samples of A, B, C, and D could be discriminated obviously by the DFA. It could be seen that DFA had a good separation ability among these four grades (A, B, C, and D) base SAB samples with a DI value of 99.87. The analysis above showed that DFA was more applicable to grade base SAB samples than PCA. Therefore, the DFA was used to establish a quality grading prediction model.
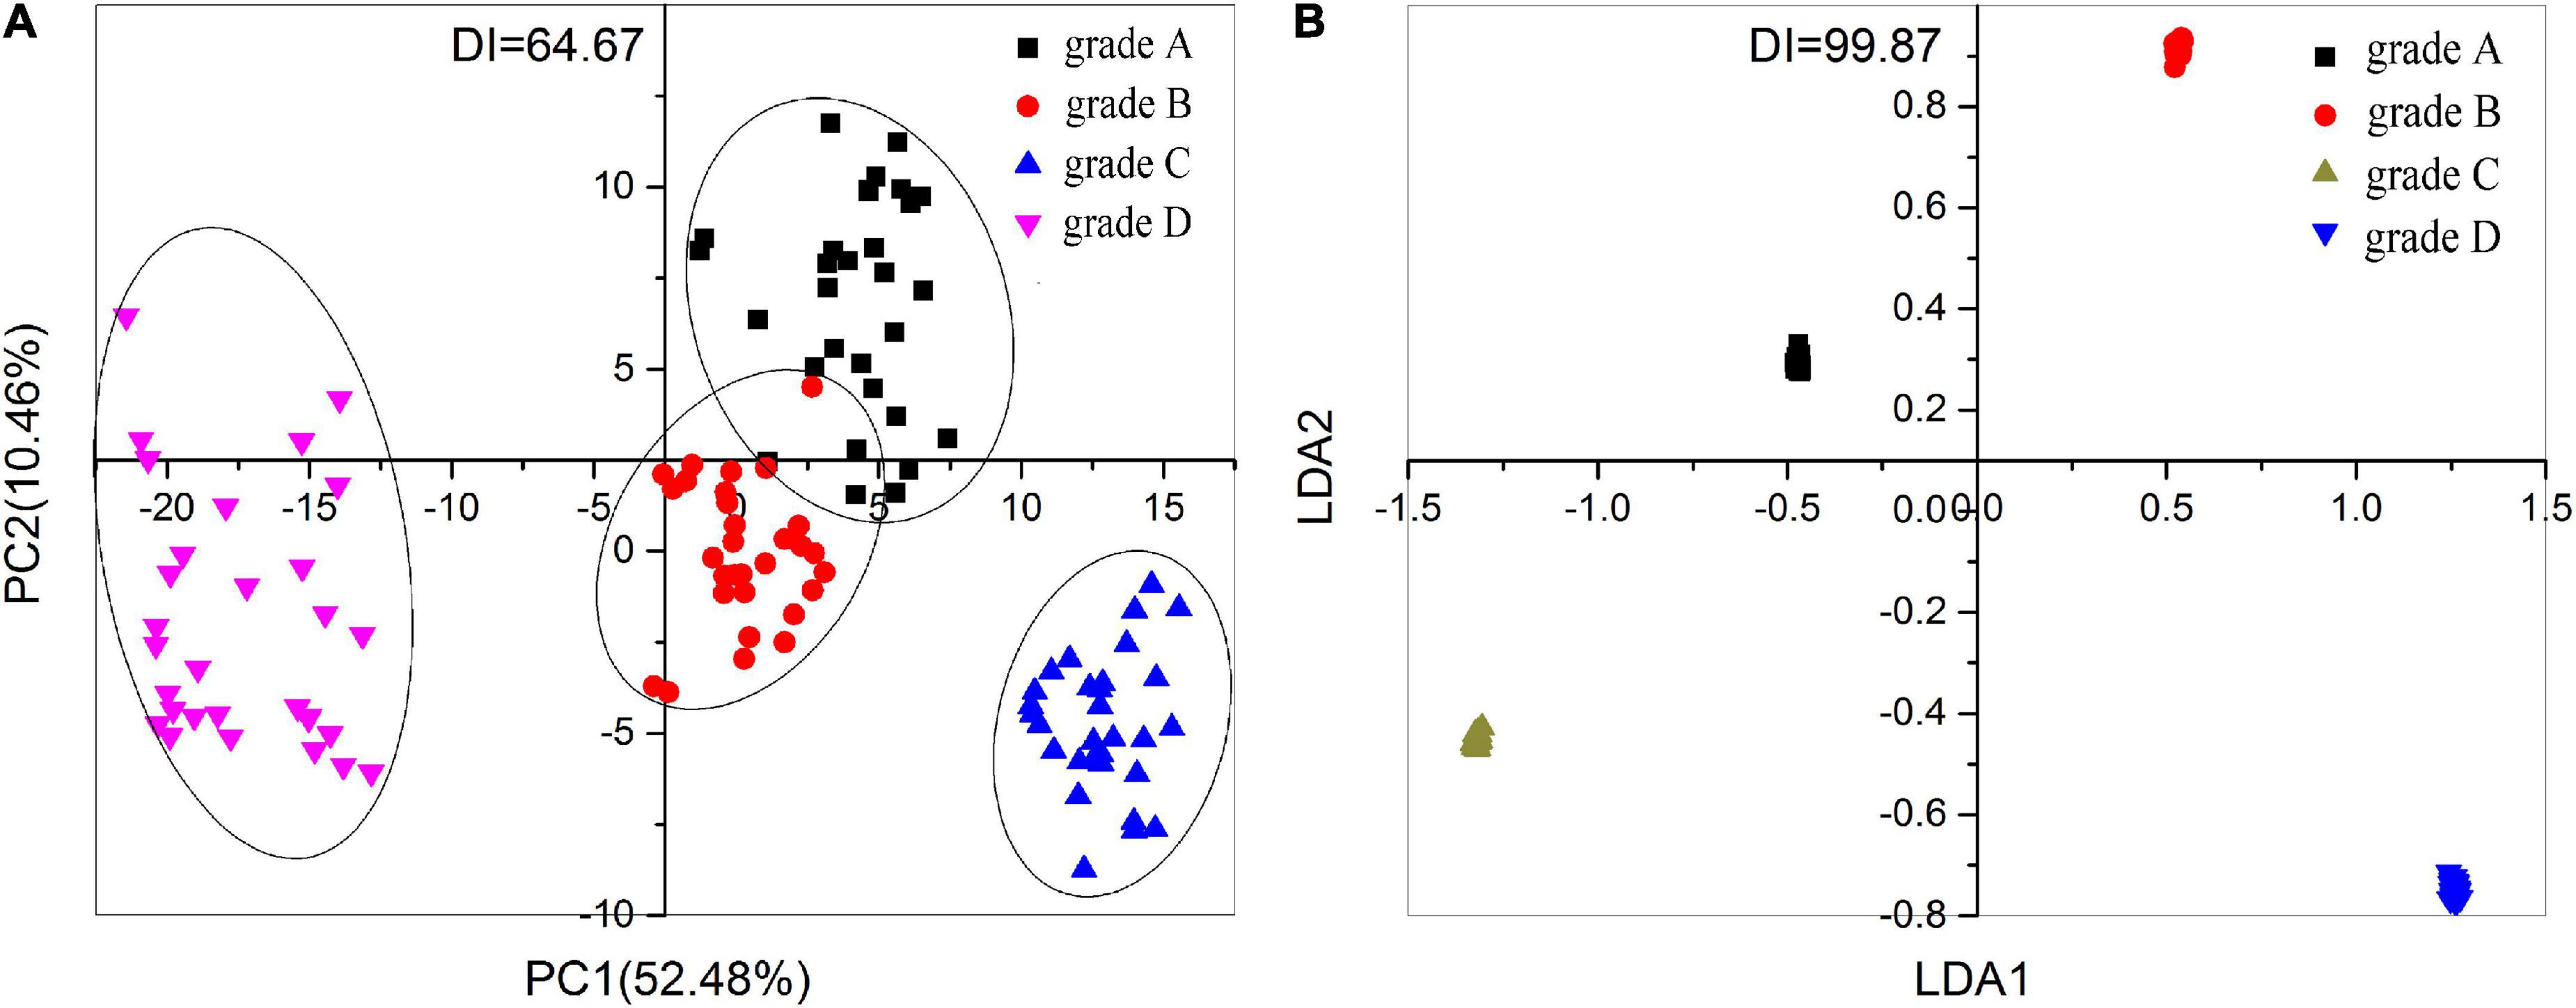
Figure 1. Multivariate statistical analysis based on the result of the Smartongue analysis: loading plot of (A) principal component analysis (PCA) and (B) discriminant function analysis (DFA) for the classification of 120 strong-aroma types of base Baijiu (base SAB) samples from four different grades.
On the basis of the DFA prediction model, the predicted quality grade result of the validation set is shown in Figure 2. As shown in Figure 2, 20 validations set base SAB samples from four grades could be classified obviously by the DFA model except for one base SAB sample from grade D. Hence, all the results above revealed that the Smartongue system was capable of classifying the base SAB and quality grade predicting results with an average accuracy up to 95%.
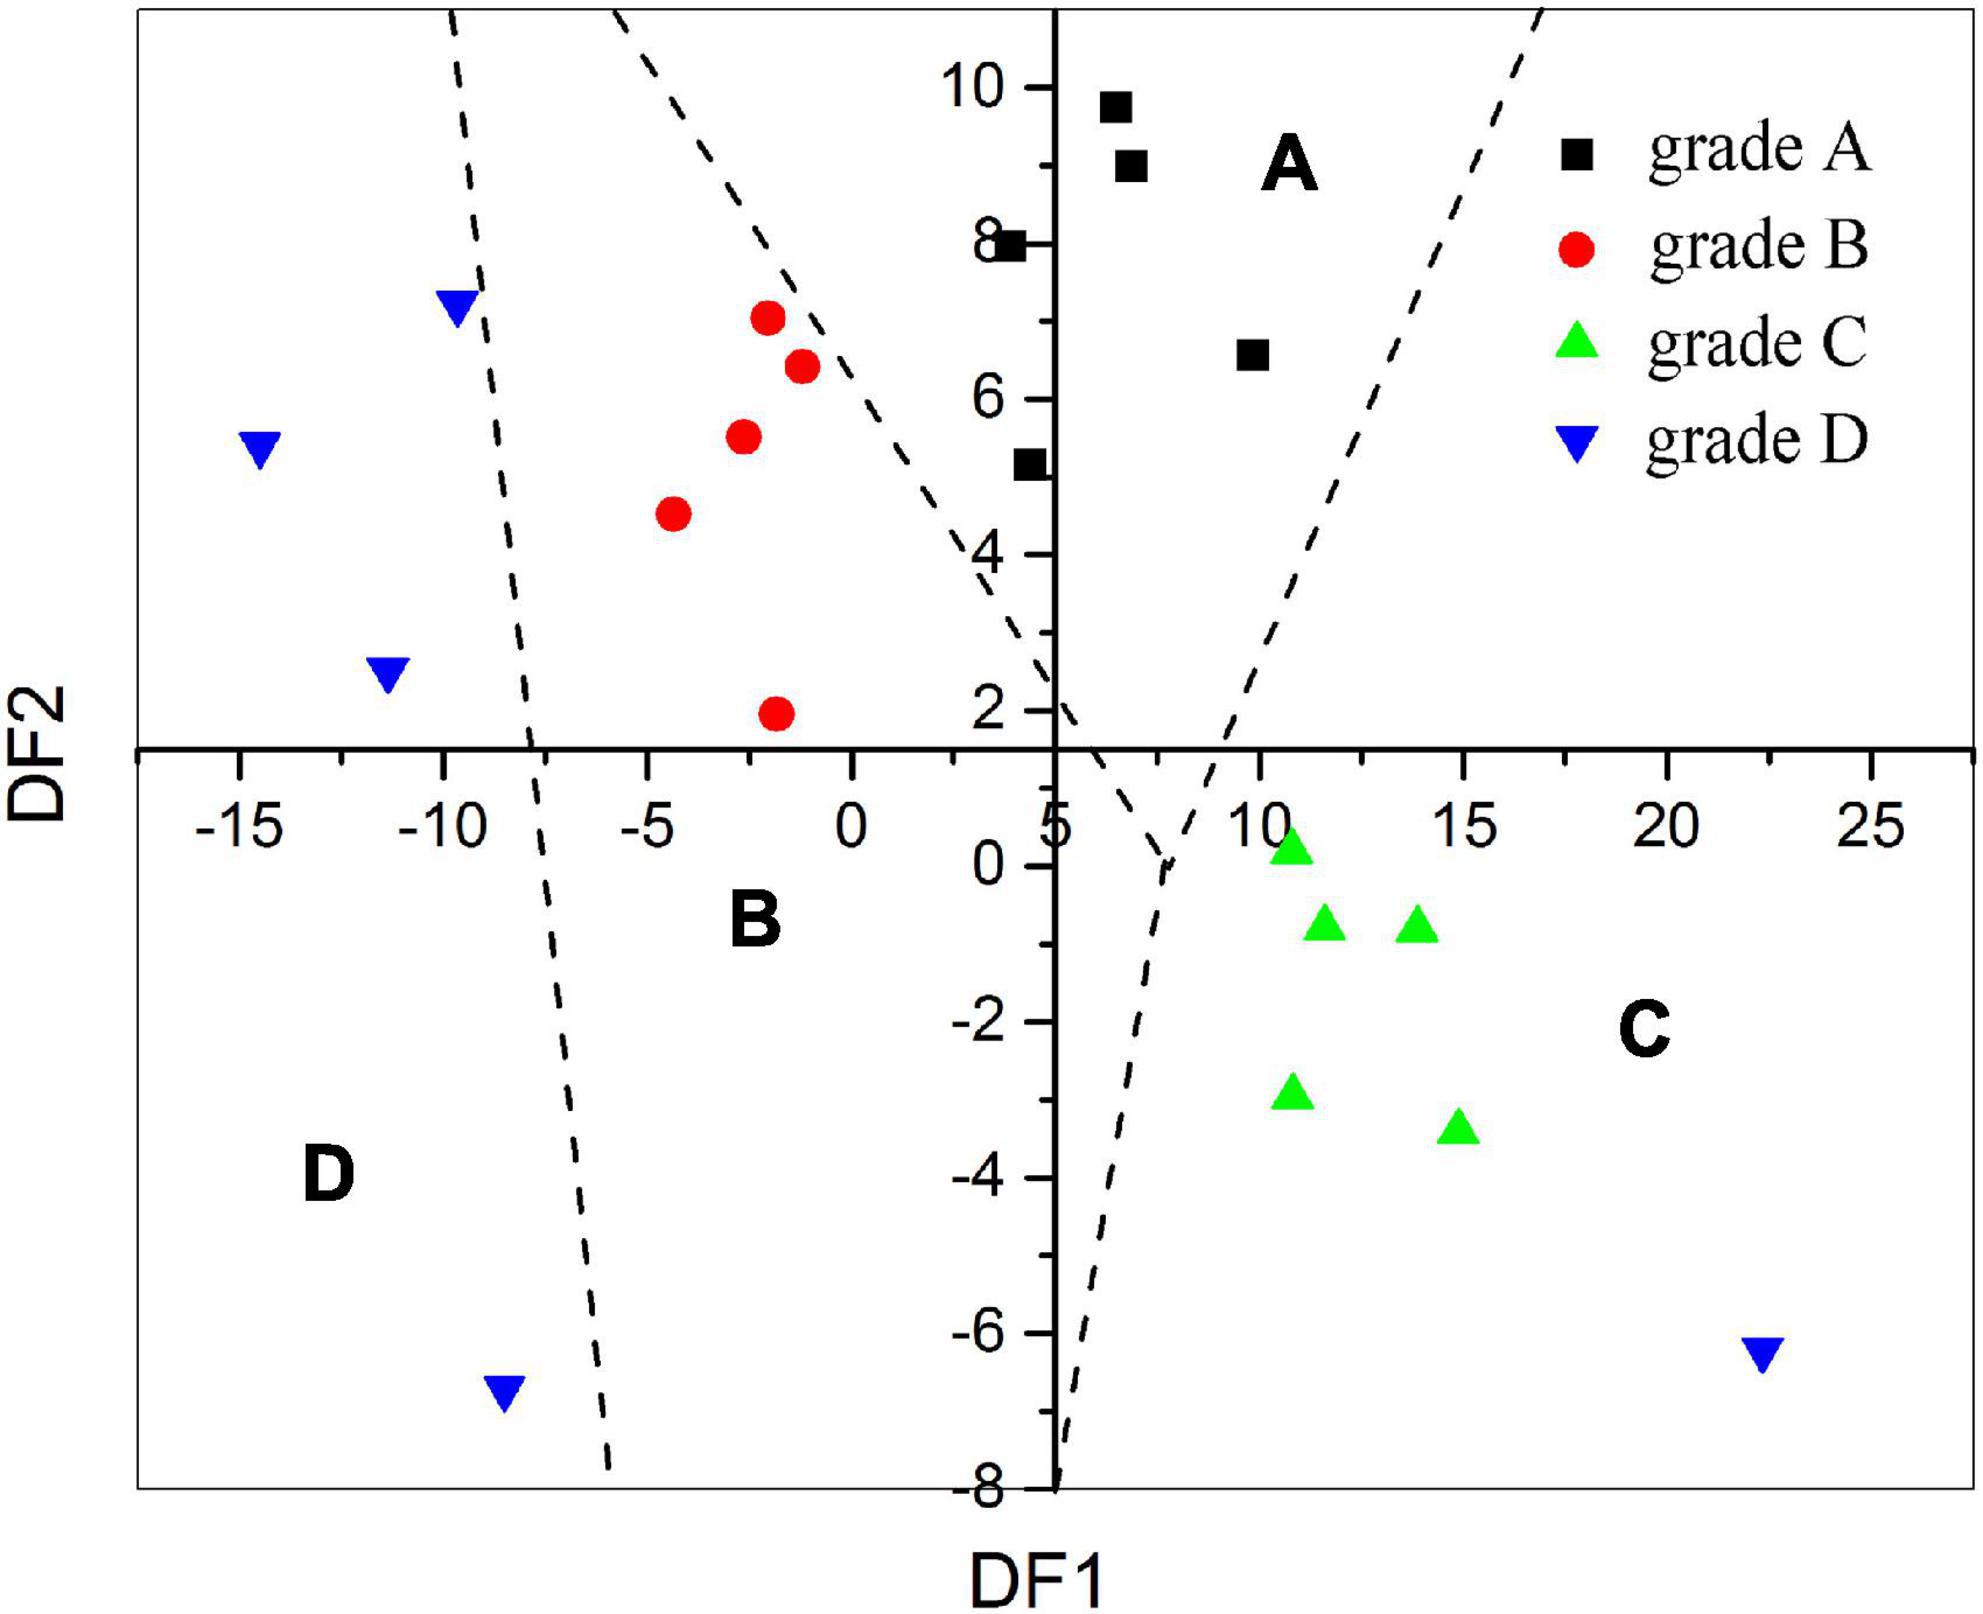
Figure 2. The established DFA model map was verified by 20 real SAB samples.
Qualitative analysis
A total of 52 aroma compounds, including 27 esters, 12 alcohols, 9 acids, 3 phenols, and 1 acetal, were determined in base SAB samples by direct injection and liquid-liquid extraction (LLE) coupled with GC-MS analysis (Table 1). As exhibited in Table 1, all aroma compounds could be successfully identified in grades A, B, and C base SAB samples while only 38 aroma compounds were identified in grade D, which suggested that the component is more abundant in higher grade samples. Main volatile compounds of SAB, such as ethyl acetate, ethyl lactate, ethyl butanoate, ethyl hexanoate, 1-butanol, 3-methylbutanol, butanoic acid, and hexanoic acid have been determined in previous literature (3, 28). Among them, ethyl hexanoate, hexyl hexanoate, ethyl pentanoate, and hexanoic acid were regarded as odor-active compounds and contribute greatly to the odors of SAB (29). Besides, most of these compounds have been earlier identified as aroma compounds in other aroma types of Baijiu (30). Hence, the qualitative method used in this study turned out to be appropriate and reliable.
Quantitative analysis
To gain a deeper insight into the characterization and relevance of base SAB samples, a total of 52 aroma compounds were quantitated in these four grades. As shown in Table 2, the obtained standard curves were observed to have a good linearity with a correlation coefficient (R2) ≥ 0.99 and the RSDs in triplicate of samples were ≤ 10%, which illustrated the good precision of the quantitative methods. Based on these result, ethyl hexanoate were present in the highest concentrations in grades A, B, C, and D (2,712.98, 2,245.57, 2,047.17, and 288.41 mg/L, respectively), followed by ethyl acetate (1,556.69 mg/L-A, 1,167.78 mg/L-B, 1,000.94 mg/L-C, and 979.83 mg/L-D), ethyl lactate (1,038.02 mg/L-A, 1,457.65 mg/L-B, 1,542.16 mg/L-C, and 1,570.86 mg/L-D), and ethyl butanoate (269.31 mg/L-A, 226.02 mg/L-B, 200.45 mg/L-C, and 107.12 mg/L-D). These 4 compounds were all present at levels above 100 mg/L, and they were taken as the key volatile components of SAB. Additionally, hexanoic acid (909.14 mg/L-A, 808.67 mg/L-B, 490.83 mg/L-C, and 59.62 mg/L-D), acetic acid (778.56 mg/L-A, 649.30 mg/L-B, 491.79 mg/L-C, and 528.11 mg/L-D), 1-propanol (596.94 mg/L-A, 320.97 mg/L-B, 238.34 mg/L-C, and 183.97 mg/L-D), and diethyl acetal (513.49 mg/L-A, 434.37 mg/L-B, 361.09 mg/L-C, and 250.17 mg/L-D) were also presented in high concentrations. Moreover, as shown in Table 3, the content of ethyl hexanoate, total acid, and total ester in grade A had reached the first grade standard of high alcohol content Chinese strong flavor Baijiu following the national standard of GB/T 10781.1-2021, but partly achieved in grades B, C, and D. These findings indicated that a high-grade base SAB sample (e.g., grade A) was superior to a low-grade base SAB sample (e.g., grade D). Besides, most of the concentrations of aroma compounds in grades A, B, C, and D presented a sequentially decreasing trend. Overall, the aforementioned results demonstrated that the quality ranks of four grades of base SAB samples from good to bad were A, B, C, and D, successively, which is consistent with the grading result acquired from the electronic tongue and human sensory evaluations.
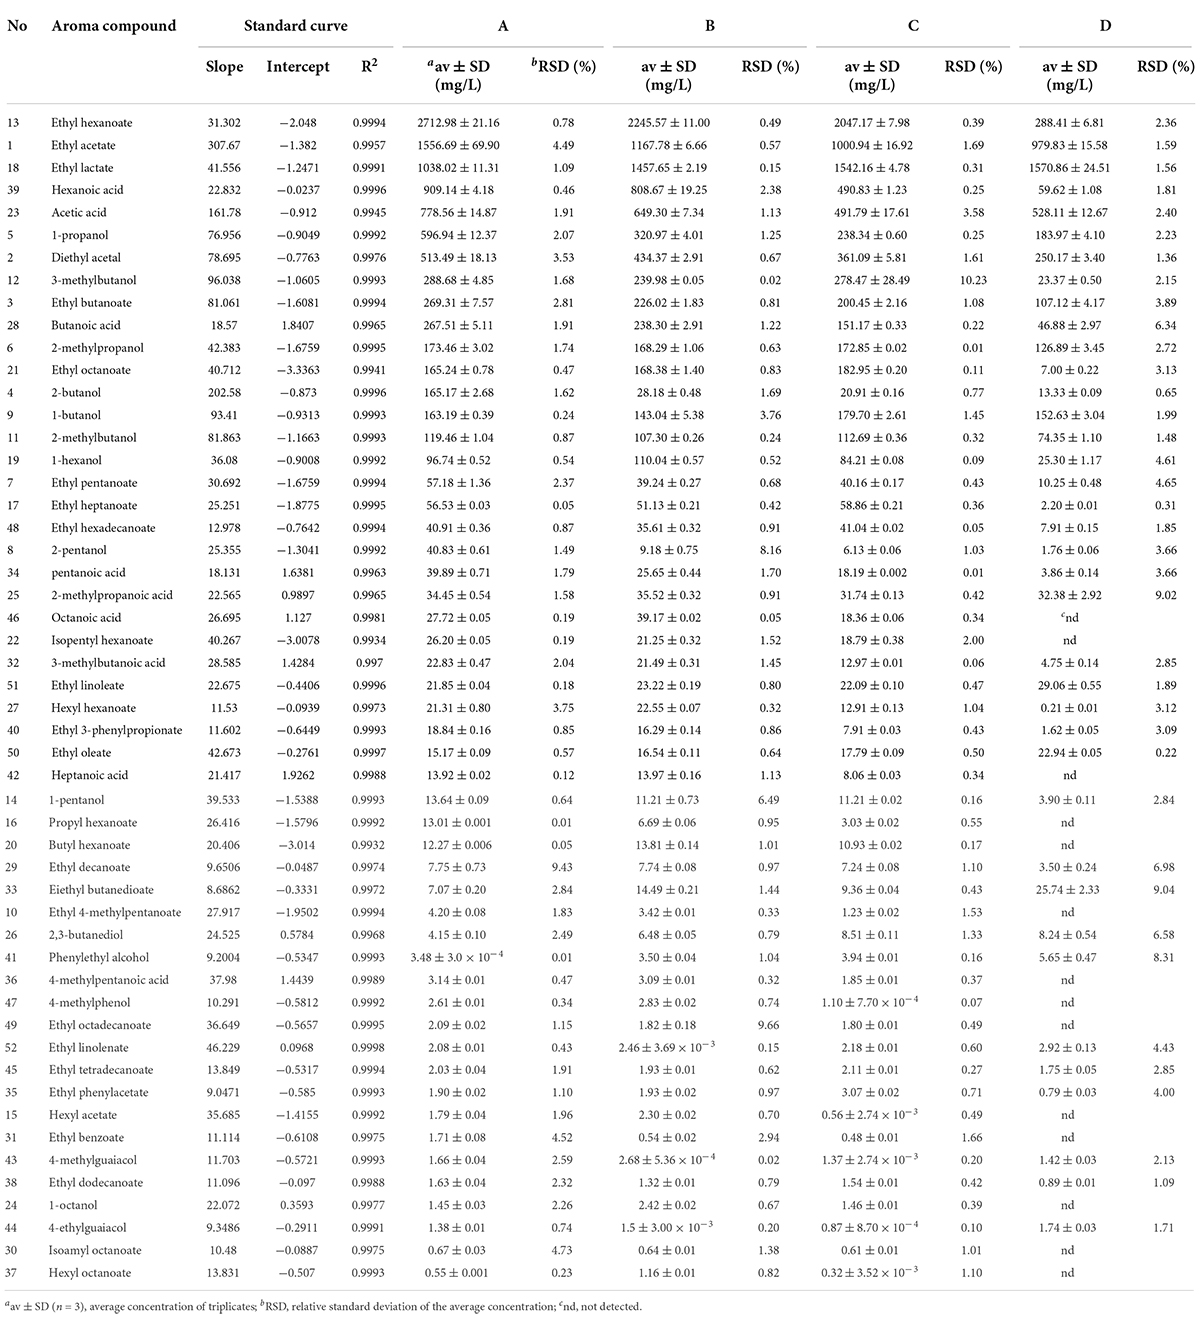
Table 2. Standard curves and concentrations of 52 aroma compounds in four grades of base SAB.
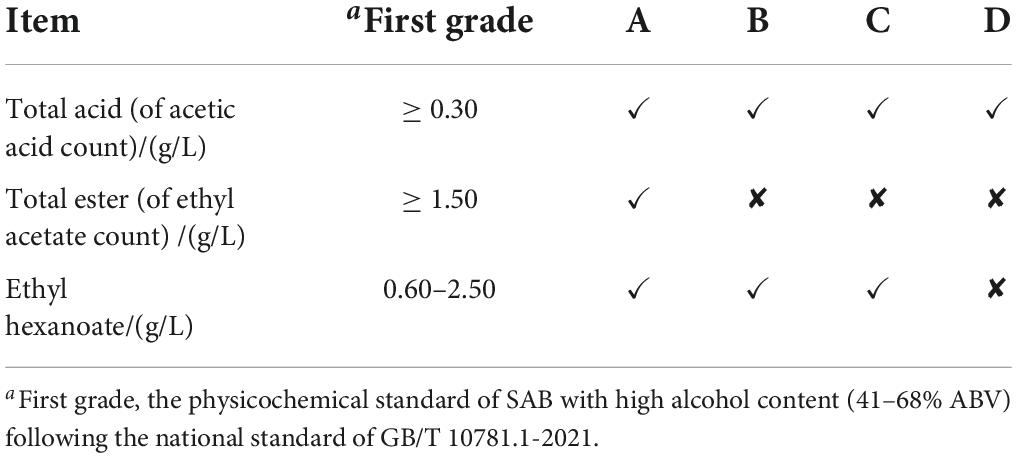
Table 3. Physicochemical indexes comparison of 4 grades of base SAB samples.
Conclusion
In the present study, an electronic tongue combined with the GC-MS method was developed to grade high-alcoholic base SAB for the first time. The E-tongue showed a good prediction in different grades of base SAB when models were established using DFA, which suggests that the E-tongue combined with data modeling is promising for flavor quantification and quality grading. Moreover, to gain a deeper insight into the characterization and relevance of base SAB samples, a total of 52 aroma compounds were identified in four grades of base SAB and differences in the composition of volatile components from four grades were observed by GC-MS analysis. In general, the variety and concentration of high-grade base SAB were more than that of low grade, which showed a good agreement with human sensory evaluation results. These findings provide a guide for Baijiu industries to select the proper method to the overall quality grading for base Baijiu. Nonetheless, we still question the applicability of E-tongue in quantifying the overall quality of base Baijiu from other aroma types. Further research on the quality classification by using more base Baijiu varieties will confirm and improve our findings.
Data availability statement
The original contributions presented in this study are included in the article/supplementary material, further inquiries can be directed to the corresponding authors.
Author contributions
LA: investigation, formal analysis, and writing—original draft. KG: methodology, validation, data curation, and writing—original draft. XD: investigation and visualization. WD: writing—review and editing and funding acquisition. XS: data curation and writing—review and editing. BS: editing, supervision, and funding. JS: writing—review and editing and visualization. GL: methodology and validation. AL: supervision and funding. HL: methodology and software. FZ: supervision and validation. All authors have read and approved the submitted version.
Funding
This work was supported by the National Natural Science Foundation of China (32102122), Department of Science and Technology of Sichuan Province (2019YFS0520 and 2021ZYD0102), and Beijing Outstanding Young Scientist Program (BJJWZYJH01201910011025).
Acknowledgments
Many thanks to the RuiFen International Trading Co., Ltd., for providing the experimental conditions.
Conflict of interest
The authors declare that the research was conducted in the absence of any commercial or financial relationships that could be construed as a potential conflict of interest.
Publisher’s note
All claims expressed in this article are solely those of the authors and do not necessarily represent those of their affiliated organizations, or those of the publisher, the editors and the reviewers. Any product that may be evaluated in this article, or claim that may be made by its manufacturer, is not guaranteed or endorsed by the publisher.
References
1. Wang J, Chen H, Wu Y, Zhao D. Uncover the flavor code of strong-aroma baijiu: Research progress on the revelation of aroma compounds in strong-aroma baijiu by means of modern separation technology and molecular sensory evaluation. J Food Compos Anal. (2022) 109:104499. doi: 10.1016/j.jfca.2022.104499
2. Du J, Li Y, Xu J, Huang M, Wang J, Chao J, et al. Characterization of key odorants in Langyatai Baijiu with Jian flavour by sensory-directed analysis. Food Chem. (2021) 352:129363. doi: 10.1016/j.foodchem.2021.129363
3. Dong W, Guo R, Liu M, Shen C, Sun X, Zhao M, et al. Characterization of key odorants causing the roasted and mud-like aromas in strong-aroma types of base Baijiu. Food Res Int. (2019) 125:108546. doi: 10.1016/j.foodres.2019.108546
4. Xu Y, Zhao J, Liu X, Zhang C, Zhao Z, Li X, et al. Flavor mystery of Chinese traditional fermented baijiu: The great contribution of ester compounds. Food Chem. (2022) 369:130920. doi: 10.1016/j.foodchem.2021.130920
5. Fan W, Qian MC. Headspace solid phase microextraction and gas chromatography-olfactometry dilution analysis of young and aged Chinese “Yanghe Daqu” liquors. J Agric Food Chem. (2005) 53:7931–8. doi: 10.1021/jf051011k
6. Huang Z, Zeng Y, Sun Q, Zhang W, Wang S, Shen C, et al. Insights into the mechanism of flavor compound changes in strong flavor baijiu during storage by using the density functional theory and molecular dynamics simulation. Food Chem. (2022) 373:131522. doi: 10.1016/j.foodchem.2021.131522
7. Jia W, Li Y, Du A, Fan Z, Zhang R, Shi L, et al. Foodomics analysis of natural aging and gamma irradiation maturation in Chinese distilled Baijiu by UPLC-Orbitrap-MS/MS. Food Chem. (2020) 315:126308. doi: 10.1016/j.foodchem.2020.126308
8. Ronningen IG, Peterson DA-O. Identification of aging-associated food quality changes in citrus products using untargeted chemical profiling. J Agric Food Chem. (2018) 66:682–8. doi: 10.1021/acs.jafc.7b04450
9. Dong W, Shi K, Liu M, Shen C, Li A, Sun X, et al. Characterization of 3-methylindole as a source of a “Mud”-like off-odor in strong-aroma types of base baijiu. J Agric Food Chem. (2018) 66:12765–72. doi: 10.1021/acs.jafc.8b04734
10. Zhao T, Chen S, Li H, Xu Y. Identification of 2-Hydroxymethyl-3,6-diethyl-5-methylpyrazine as a key retronasal burnt flavor compound in soy sauce aroma type baijiu using sensory-guided isolation assisted by multivariate data analysis. J Agric Food Chem. (2018) 66:10496–505. doi: 10.1021/acs.jafc.8b03980
11. Sun Y, Ma Y, Chen S, Xu Y, Tang K. Exploring the mystery of the sweetness of baijiu by sensory evaluation, compositional analysis and multivariate data analysis. Foods. (2021) 10:1–13. doi: 10.3390/foods10112843
12. Sierra-Padilla A, García-Guzmán JJ, López-Iglesias D, Palacios-Santander JM, Cubillana-Aguilera L. E-Tongues/Noses based on conducting polymers and composite materials: Expanding the possibilities in complex analytical sensing. Sensors. (2021) 21:4976. doi: 10.3390/s21154976
13. Zhu Y, Zhou X, Chen YP, Liu Z, Jiang S, Chen G, et al. Exploring the relationships between perceived umami intensity, umami components and electronic tongue responses in food matrices. Food Chem. (2022) 368:130849. doi: 10.1016/j.foodchem.2021.130849
14. Skládal P. Smart bioelectronic tongues for food and drinks control. TrAC Trends Anal Chem. (2020) 127:115887. doi: 10.1016/j.trac.2020.115887
15. Zhang H, Shao W, Qiu S, Wang J, Wei Z. Collaborative analysis on the marked ages of rice wines by electronic tongue and nose based on different feature data sets. Sensors. (2020) 20:1065. doi: 10.3390/s20041065
16. Han F, Zhang D, Aheto JH, Feng F, Duan T. Integration of a low-cost electronic nose and a voltammetric electronic tongue for red wines identification. Food Sci Nutr. (2020) 8:4330–9. doi: 10.1002/fsn3.1730
17. Schmidtke LM, Rudnitskaya A, Saliba AJ, Blackman JW, Scollary GR, Clark AC, et al. Sensory, chemical, and electronic tongue assessment of micro-oxygenated wines and oak chip maceration: Assessing the commonality of analytical techniques. J Agric Food Chem. (2010) 58:5026–33. doi: 10.1021/jf904104f
18. Legin A, Rudnitskaya A, Lvova L, Vlasov Y, Di Natale C, D’Amico A. Evaluation of Italian wine by the electronic tongue: Recognition, quantitative analysis and correlation with human sensory perception. Anal Chim Acta. (2003) 484:33–44. doi: 10.1016/S0003-2670(03)00301-5
19. Cetó X, Llobet M, Marco J, Valle MD. Application of an electronic tongue towards the analysis of brandies. Anal Methods. (2013) 5:1120–9. doi: 10.1039/C2AY26066B
20. Geanã E-I, Ciucure CT, Apetrei C. Electrochemical sensors coupled with multivariate statistical analysis as screening tools for wine authentication issues: A review. Chemosensors. (2020) 8:59. doi: 10.3390/chemosensors8030059
21. Tian S-Y, Deng S-P, Chen Z-X. Multifrequency large amplitude pulse voltammetry: A novel electrochemical method for electronic tongue. Sensor Actuat B Chem. (2007) 123:1049–56. doi: 10.1016/j.snb.2006.11.011
22. Zheng Y, Sun B, Zhao M, Zheng F, Huang M, Sun J, et al. Characterization of the key odorants in Chinese zhima aroma-type baijiu by gas chromatography–olfactometry, quantitative measurements, aroma recombination, and omission studies. J Agric Food Chem. (2016) 64:5367–74. doi: 10.1021/acs.jafc.6b01390
23. General Administration of Quality Supervision, Inspection and Quarantine [AQSIQ], SAC,. Method of analysis for Chinese spirits. Beijing: AQSIQ (2007).
24. Kovats E. Gas-chromatographische charakterisierung organischer verbindungen. Teil 1: Retentions indices aliphatischer halogenide, alkohole, aldehyde und ketone. Helv Chim Acta. (1958) 41:1915–32. doi: 10.1002/hlca.19580410703
25. Yang S, Li C, Mei Y, Liu W, Liu R, Chen W, et al. Determination of the geographical origin of coffee beans using terahertz spectroscopy combined with machine learning methods. Front Nutr. (2021) 8:680627. doi: 10.3389/fnut.2021.680627
26. Śliwiñska M, Wiśniewska P, Dymerski T, Namieśnik J, Wardencki W. Food analysis using artificial senses. J Agric Food Chem. (2014) 62:1423–48. doi: 10.1021/jf403215y
27. General Administration of Quality Supervision, Inspection and Quarantine [AQSIQ], SAC. Strong flavour Chinese spirits. Beijing: AQSIQ (2021).
28. Zhao D, Shi D, Sun J, Li A, Sun B, Zhao M, et al. Characterization of key aroma compounds in Gujinggong Chinese Baijiu by gas chromatography–olfactometry, quantitative measurements, and sensory evaluation. Food Res Int. (2018) 105:616–27. doi: 10.1016/j.foodres.2017.11.074
29. Liu H, Sun B. Effect of fermentation processing on the flavor of baijiu. J Agric Food Chem. (2018) 66:5425–32. doi: 10.1021/acs.jafc.8b00692
Keywords: strong-aroma types of base Baijiu, electronic tongue, principal component analysis, discriminant function analysis, GC-MS
Citation: Ao L, Guo K, Dai X, Dong W, Sun X, Sun B, Sun J, Liu G, Li A, Li H and Zheng F (2022) Quick classification of strong-aroma types of base Baijiu using potentiometric and voltammetric electronic tongue combined with chemometric techniques. Front. Nutr. 9:977929. doi: 10.3389/fnut.2022.977929
Received: 25 June 2022; Accepted: 18 August 2022;
Published: 12 September 2022.
Edited by:
Gang Fan, Huazhong Agricultural University, ChinaReviewed by:
Zhou Qi, Chinese Academy of Agricultural Sciences (CAAS), ChinaHonglei Tian, Shaanxi Normal University, China
Copyright © 2022 Ao, Guo, Dai, Dong, Sun, Sun, Sun, Liu, Li, Li and Zheng. This is an open-access article distributed under the terms of the Creative Commons Attribution License (CC BY). The use, distribution or reproduction in other forums is permitted, provided the original author(s) and the copyright owner(s) are credited and that the original publication in this journal is cited, in accordance with accepted academic practice. No use, distribution or reproduction is permitted which does not comply with these terms.
*Correspondence: Wei Dong, MjAyMDA4MTJAYnRidS5lZHUuY24=; Jinyuan Sun, c3VuamlueXVhbkBidGJ1LmVkdS5jbg==