
95% of researchers rate our articles as excellent or good
Learn more about the work of our research integrity team to safeguard the quality of each article we publish.
Find out more
ORIGINAL RESEARCH article
Front. Nutr. , 21 October 2022
Sec. Nutritional Epidemiology
Volume 9 - 2022 | https://doi.org/10.3389/fnut.2022.951738
This article is part of the Research Topic The Role of Front-of-Pack Labeling in Making Informed and Healthy Food Choices View all 10 articles
 Vanessa Bullón-Vela1,2
 Carmen Sayón-Orea1,2,3
 Clara Gómez-Donoso2,4
 J. A. Martínez3,5,6
 Miguel A. Martínez-González1,2,3,7
 Maira Bes-Rastrollo1,2,3*
Background and aims: Front-of-Pack (FoP) nutrition labelling has been established as a policy, empowering consumers to choose healthy food options for preventing diet-related non-communicable diseases. This study aimed to evaluate the association between the nutrient profile underlying the Chilean warning label score and all-cause mortality and to conduct a calibration with the Nutri-Score in a large cohort of Spanish university graduates.
Materials and methods: This prospective cohort study analysed 20,666 participants (8,068 men and 12,598 women) with a mean (standard deviation) age of 38 years (±12.4) from the SUN cohort. Dietary food intake was assessed by a validated semi-quantitative food-frequency questionnaire at baseline and after 10 years of follow-up. The warning label score was calculated by considering the threshold of nutrients (sugar, saturated fat, and sodium) and energy density per 100 g/ml of product, as established by Chilean Legislation. Participants were classified according to quartiles of consumption of daily label score: Q1 (≤5.0), Q2 (>5.0–7.1), Q3 (>7.1–9.8), and Q4 (>9.8). Time-dependent, multivariable-adjusted Cox models were applied. To compare the performance of the warning label score and Nutri-Score to predict mortality, we used the Akaike information criterion (AIC) and Bayesian information criterion (BIC) methods.
Results: During a median of 12.2 years of follow-up, 467 deaths were identified. A higher score in the warning label values (lower nutritional quality) was associated with an increased risk of all-cause mortality [HR (95% CI) Q4 vs. Q1: 1.51 (1.07–2.13); p-trend = 0.010] and cancer mortality [HR (95% CI) Q4 vs. Q1: 1.91 (1.18–3.10); p-trend = 0.006]. However, no statistically significant association was found for cardiovascular mortality. Furthermore, the warning label score and Nutri-Score exhibited comparable AIC and BIC values, showing similar power of prediction for mortality.
Conclusion: A diet with a higher warning label score (>9.8 per day) was a good predictor of all cases and cancer mortality in a large Spanish cohort of university graduates. Also, the warning label score was capable to predict mortality as well as the Nutri-Score. Our findings support the validity of the warning label score as a FoP nutrition labelling policy since it can highlight less healthy food products.
According to the World Health Organization (WHO), non-communicable diseases (NCDs), including cardiovascular diseases (CVDs), cancer, diabetes, respiratory diseases, and others, are still the world’s leading cause with 71% of premature death between 30 and 69 years of age (1). NCDs share key modifiable behavioural risk factors related to health-related behaviours such as tobacco use, excessive alcohol consumption, and eating habits (1, 2). In particular, it has been estimated that a suboptimal diet is associated with 11 million deaths and 255 million disability-adjusted life-years (2). Among these dietary risk factors, the lower intake of fruits and whole grains stands out (2, 3). Industry process methods such as drying, pasteurization, freezing, and others are important to extend the life of foods. However, the manufactured formulation of ultra-processed foods (UPF) uses many ingredients and employs several processing methods, making the final product high- or ultra-palatable (4). Ingredients include sugar, salt, stabilizers, preservatives, and sources of energy such as oils, fats, hydrogenated fats, and fructose corn syrup, and other ingredients are cosmetic additives to emulate sensorial qualities of unprocessed or minimally processed food (4). Existing evidence suggests that UPF is closely related to poorer diet quality and increased risk of mortality (5, 6). In this context, improving the nutritional quality of food products represents a crucial strategy to reduce the NCDs burden.
Over the past years, some governments have implemented Front-of-Package (FoP) nutrition labels as a part of their strategy to mitigate the global burden of diet-related NCDs (7, 8). FoP labelling complements nutrient declaration, helping consumers to identify the healthiest or unhealthiest options, and prompting the food industry to reformulate their products (7). Many FoP nutrition label formats such as stars, traffic lights, spectrum rating (Nutri-Score), and stop sign warnings (warning label score) are currently used worldwide (7). The warning label was first adopted in Chile for packaged food and drinks with unhealthy levels of sugar, saturated fats, sodium, and/or calories (7, 9). Similar warning label systems have been adopted or are being considered in Peru, Uruguay, Argentina, Mexico, and Brazil (7, 10). Whereas in Europe, many countries have adopted the Nutri-Score, a five-colour FoP label based on nutritional criteria established by the Food Standard Agency Nutrient Profiling System (FSA-NPS) (11). The last few years have witnessed huge growth in the number of studies suggesting an association between the Nutri-Score nutrient profile and the increased risk of mortality and NCDs the effect of (6, 12–16). However, there has not been any research evaluating the effect of food consumption with Chilean warning label scores on health outcomes. To address of our study this gap in the research outlined earlier, the main objective of our study was to prospectively assess the association between the nutrient profile underlying the Chilean warning label score and mortality. Secondly, we investigated the prediction power for mortality by comparing the warning label score and Nutri-Score nutrition profiles.
The Seguimiento Universidad de Navarra (SUN) project is an ongoing, multipurpose, prospective, and dynamic cohort study of Spanish university graduates (17). This cohort study investigates sociodemographic, lifestyle, and dietary factors related to the development of NCDs (17). The Institutional Review Board of the University of Navarra approved the study protocol. Individuals gave consent to participate in the study if they complete the first self-administrated questionnaire. All study procedures were conducted according to the Declaration of Helsinki. This study was registered at clinicaltrials.gov (NCT02669602).
Details of the design and methods of the SUN cohort have been previously published (17). In brief, the recruitment of volunteers started in December 1999 at the University of Navarra and other Spanish universities. Data collection and follow-up are done every 2 years by email or ordinary mail questionnaires. By December 2019, the cohort included 22,894 volunteers. To assure a minimum follow-up of 2 years and 9 months (to allow participants to fill the first follow-up questionnaire and account for the lag time in returning the questionnaire and avoid a potential selection bias), we only included participants recruited before March 2017. Out of 22,553 eligible participants, we excluded 450 individuals with an extreme total daily energy intake (<1st and >99th centiles) and 1,437 participants were lost to follow-up with a retention rate of 93%. For the present analysis, we included 20,666 participants (Figure 1).
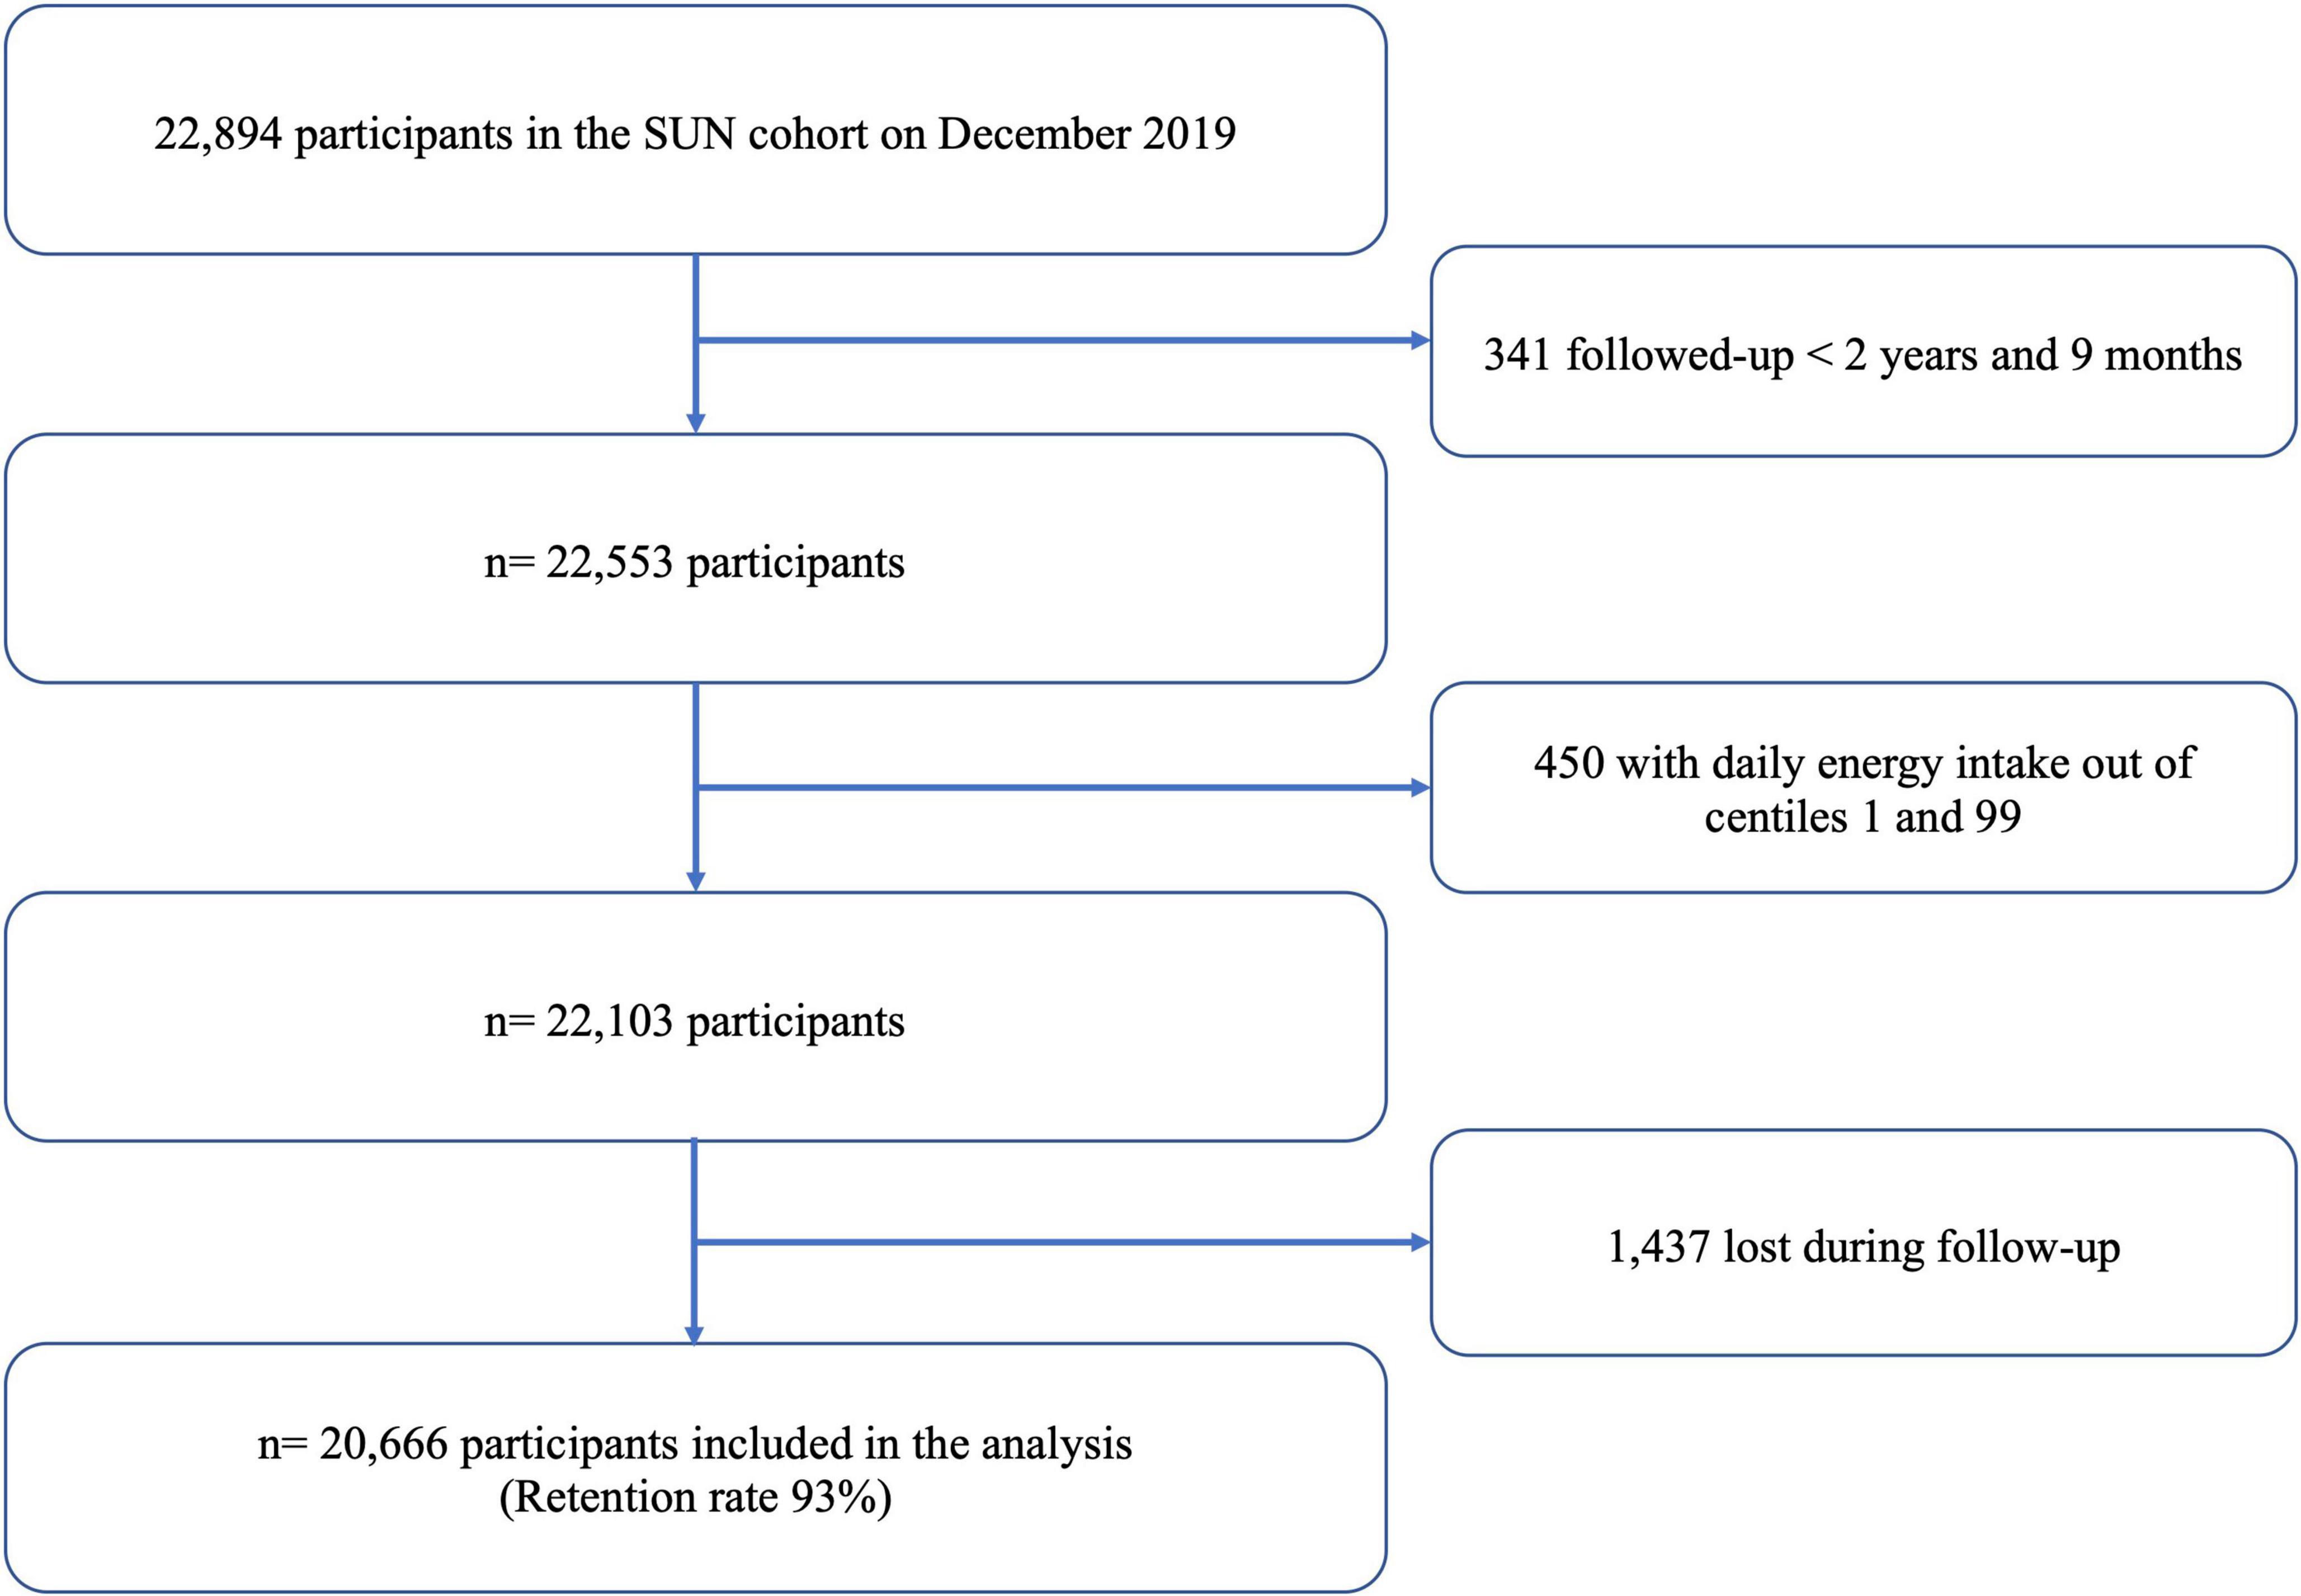
Figure 1. Flow chart for participants included in the SUN project.
At baseline, volunteers completed a self-administrated questionnaire that includes information related to sociodemographic (marital status, years of university education, others), anthropometric measurements (weight and height), lifestyle variables (smoking habits, alcohol intake, physical activity, amount of time spent on screen devices, others), as well as family and personal medical history. NCDs such as diabetes, cancer, and cardiovascular events were confirmed by medical reports. Self-reported measurements and diagnosis at baseline and during the follow-up were previously validated in a subsample of the cohort and have been found reliable (18–21).
The primary end-point was mortality from all causes, including CVD and cancer. Deaths were reported by next-of-kin, professional associations, or the postal system authority, which permitted us to identify more than 85% of deaths. For the rest of the deceased, the Spanish National Death Index was checked at least once a year to confirm the vital status of the participants and to request data about the cause of death. Trained physicians, blinded to the exposure, classified the cause of death considering the International Classification of Diseases (10th version) based on the data provided by the National Death Index.
Dietary intake was self-reported by participants at baseline and after 10 years of follow-up through a validated 136-item food-frequency questionnaire (FFQ) (22, 23). The FFQ includes foods and beverages frequently consumed in Spain, such as dairy products and derivates, eggs, meat (fresh and processed), fish, seafood, vegetables, fruits, legumes and cereals, oils and fats, pastries, beverages (alcoholic, sugar-sweetened, and artificially sweetened beverages), and a miscellaneous group. Participants were asked to report on average over the past year their frequency of consumption, considering a specific typical Spanish serving per day (slice, teaspoons, glass, and others) for each of 136 food items. The nutrient composition of the dietary intake was assessed based on Spanish food composition tables (24, 25). Frequency of consumption was split into nine categories ranging from never/almost never to >6 servings/day for each FFQ item. Daily consumption was calculated by multiplying portion size by frequency. Nutrient intakes were computed as the sum of the frequency of consumption (converted to daily intake) of each item multiplied by the nutrient composition of specified portion size. Adherence to the Mediterranean Diet (MedDiet) was evaluated using the well-known 0–9 Mediterranean Diet Score (26, 27).
The FoP nutrition label was established by the Chilean Government, according to the regulation of pre-packaged foods in 2019 (Figure 2) as part of a unique law mandating warning labels, restricting marketing, and regulating school sales for products classified as nutritionally unhealthy. The black-and-white stop sign (octagons) labels use data from the nutritional declaration for 100 g or 100 ml of product and include the expression “High in” if the amount of added sugar, sodium, saturated fat, and/or calories exceeds the acceptable thresholds (Figure 2; 9, 28, 29), according to the Spanish food composition in the case of our study (24, 25). Products are required to carry a stop sign warning for each nutrient exceeded, meaning some products can require up to four labels. The warning label should be placed on any place of the package if the surface is between 30 and 60 cm2, and in the main container package if the product is smaller than 30 cm2. The food groups considered in the present study (shown in Supplementary Table 1) correspond to pre-packaged products, including processed and ultra-processed, as well as fats such as margarine, butter, and lard. Processed foods include canned or bottled foods (legumes, vegetables, and fruits) preserved in salt or syrup; canned sardine or tuna; salted, smoked, or cured meat or fish; cheeses; and bread and baked products. Ultra-processed products comprise carbonated soft, sweetened drinks, or juices; sweet, salty, or fatty packaged snacks; biscuits (cookies and cakes); ice cream; candies (confectionery); sweetened breakfast cereals; sugared milk; and products ready to eat (instant soups, noodles, desserts, sausages, burgers, pizza, and all pre-prepared meat) (29, 30). We considered the density of liquid products (milkshakes, sugar-sweetened and artificially sweetened beverages, and bottle juice) as 1 g/ml. Only added sugars were considered to evaluate excess sugar for dairy products, not considering lactose. The products of the FFQ that exceeded any of the nutrient thresholds per 100 g/ml (Figure 2) were assigned the respective warning label (Supplementary Table 1). For the calculation of the warning labels, the average of the critical nutrients based on the Spanish food composition tables contained in each food item of the FFQ was used (e.g., the critical nutrients of sausages were estimated as the average of nutrients from the consumption of sausages, chorizo, and mortadella). At the individual level, the total score of warning labels was computed as the sum of the warning label of each food or beverage consumed divided by 100 g/100 ml of food/liquids:
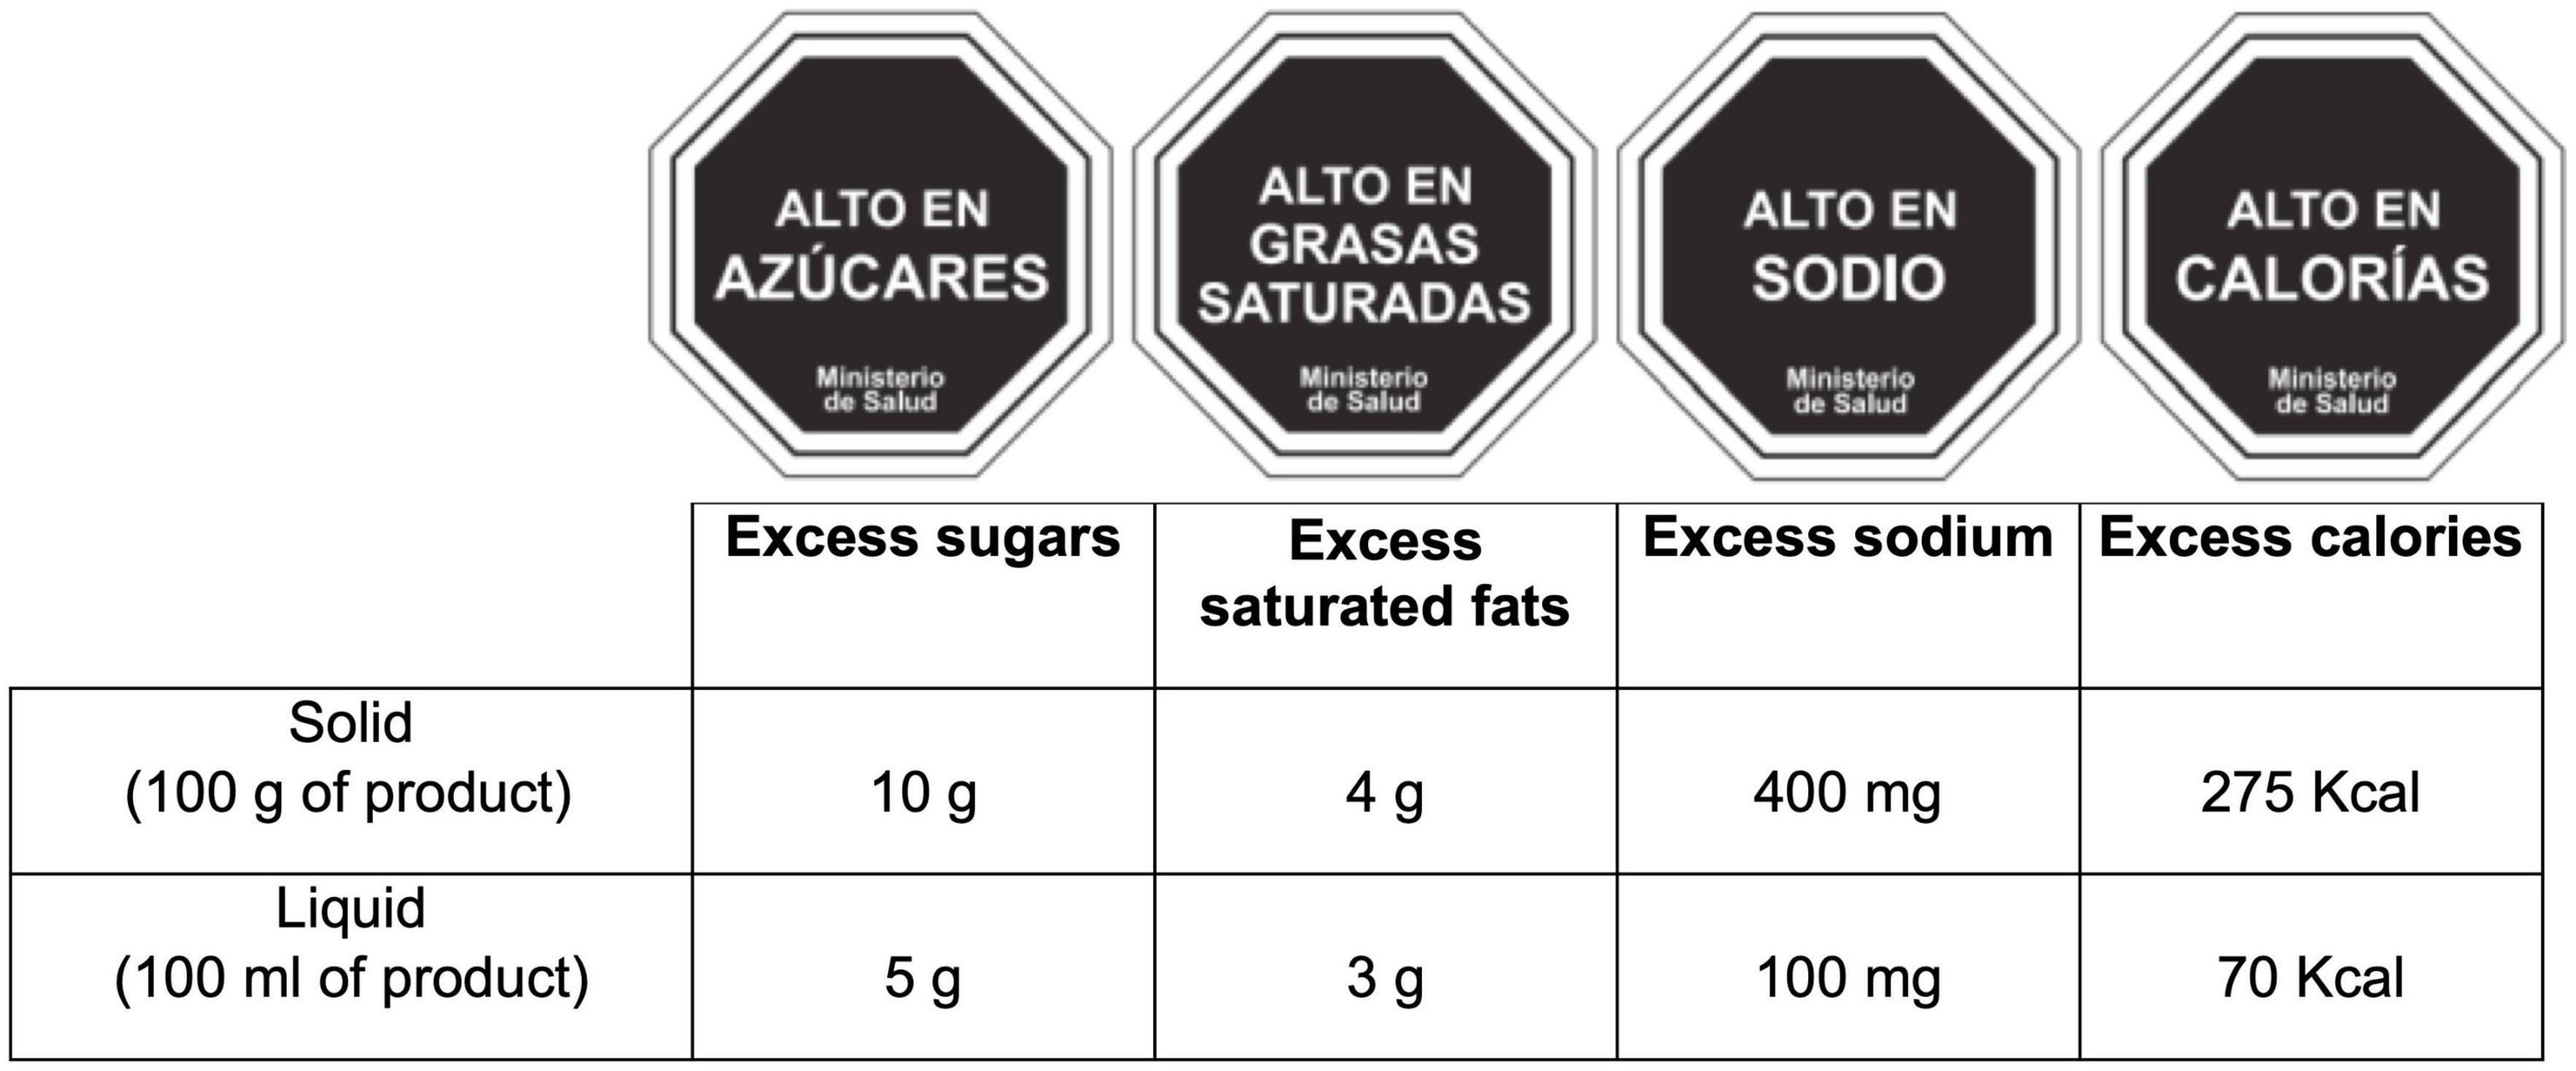
Figure 2. The four approved warning labels in Chile implemented as front-of-package labels and Chilean score computation for warning labels in pre-packaged food and beverage. All octagons indicate “Ministry of health”.
WS represents the number of warning labels of each food/beverage of the FFQ, i per 100 g/ml of product, and Ii the total intake of each food/beverage in grams or millilitres per day.
The computation of the Nutri-Score FOP labelling has been described elsewhere (6, 31, 32). In brief, the algorithm allocated points based on the nutrient content of 100 g/ml of a food or beverage (6, 12, 13, 16, 33–35). For the content of critical nutrients, which are relevant for the risk of NCD, 0–40 points were allocated (0–10 points for each following components: sugars [g], saturated fats [g], sodium [mg], and energy [kJ]) and 0–15 points were allocated for the content of beneficial nutrients that should be promoted (0–5 points for each component: fibres [g], proteins [g], and the percentage of vegetables, fruits, legumes, nuts, rapeseed, walnut, and olive oils that compose the total product [%]) (6). The total food/beverage-level score was computed by subtracting the content of nutrients that should be consumed in limited amounts (negative points) from the nutrients that should be encouraged (positive points) (6). Therefore, the final FSAm-NPS score for each food/beverage range from −15 (most healthy) to +40 (least healthy). The individual-level score was calculated as the sum of the FSAm-NPS score for each food/beverage consumed multiplied by the quantity of energy supplied by that product divided by the sum of energy consumption from all foods (6).
Participants were classified according to quartiles of consumption of the warning label score at baseline and for the repeated measurement analyses at 10 years of follow-up. Categorical and continuous variables are presented as percentages or means (standard deviation), respectively. Cox proportional hazard regression models with age as the underlying time variable (birth date as origin) were fitted to evaluate the potential association between quartiles of the warning label score and mortality, including all-cause, CVD, and cancer. Participants contributed person-time to the model from the date of returning the baseline questionnaire until the date of death, loss to follow-up, or when the last follow-up questionnaire was completed, whichever event occurred first. To minimize any measurement errors for variations in the dietary pattern during the follow-up, we performed time-dependent Cox regression models using repeated measures, considering cumulative average data and updated information on dietary consumption of the 10-year follow-up questionnaire for volunteers with follow-up longer than 10 years. The Pearson correlation coefficient between the score of warning labels at baseline vs. 10 years was moderate (r = 0.37; p < 0.001). For the analyses of CVD and cancer mortality, we excluded deaths attributable to other causes to rule out residual confounding. Hazard ratios (HR) and 95% CIs were estimated using the first quartile as the reference category. Multivariable models were stratified for deciles of age and recruitment period. After sex and age-adjusted analyses, multivariable models were also adjusted for marital status (married yes/no), physical activity evaluated as METs-h/week (continuous), alcohol intake (g/d, continuous), smoking status (never, current, and former), pack-years of cigarette smoking (continuous), snacking between meals (yes/no), following a special diet at baseline (yes/no), body mass index (linear and quadratic terms), total energy intake (quartiles), years of university education (continuous), family history of cardiovascular disease (CVD) and cancer, prevalent CVD, hypertension, diabetes, cancer and depression, and self-reported hypercholesterolemia at baseline. For the variable smoking pack-years, 7.9% of data were missing, and we applied simple imputations using as predictor variables age, sex, physical activity, years of university, BMI, alcohol consumption, adherence to the MedDiet, and mortality. A Linear trend test was conducted across quartiles assigning the median value to each category and treating them as a continuous variable. Furthermore, stratified analyses were carried out according to sex (men or women); age at recruitment (<45 or ≥45 years); baseline BMI (<25 or ≥25 kg/m2); and smoking habits at baseline (ever or never smoker). To evaluate the robustness of our findings, we applied the following sensitivity analyses: considering different plausible energy limits proposed by Willett (36), as well as percentiles 5–95 to avoid information bias due to over or under-reporters; excluding volunteers who had prevalent conditions at baseline (CVD, cancer, and diabetes); omitting premature death (if it occurred earlier than 2-year follow-up); excluding snacking between meals as a confounder; and additionally adjusted for fibre intake. Restricted cubic splines with three knots, considering zero as reference were applied to the flexible model to graphically represent the dose-response association between mortality and the warning label score (as continuous), as well as to evaluate non-linearity.
Exploratory analyses were performed to assess the effect of different food policy approaches on the risk of all-cause mortality. For this purpose, participants were categorized under or above the median (≥p50th) of the warning label score or Nutri-Score, and >4 servings/day of UPF based on previously published studies from our cohort (5, 6). We also evaluated multiple interactions between them by testing an interaction product term with the maximum likelihood ratio test. To find out the ability of predicting the relationship between all-cause mortality and the nutrient profiles of the warning label score and Nutri-Score, we categorized participants into quartiles of both FoP labels and compared the fourth vs. the first quartile of these exposures using the Akaike Information Criteria (AIC) and Bayesian Information Criteria (BIC) in the adjusted model previously mentioned. All tests were two-sided and statistical significance was set at the conventional 0.05 level. Analyses were performed using STATA version 16.0 (StataCorp, College Station, TX, USA).
A total of 20,666 participants, including 8,068 men and 12,598 women (Figure 1) with an average of 38 [12.4] years (mean [SD] age at baseline), were analysed. After a median follow-up of 12.2 years (238,217 person-years), a total of 467 overall deaths were registered of which 90 (19.3%) were attributed to CVD, 242 (51.8%) to cancer, 137 (26.1%) to other causes, and 13 (2.8%) to unknown causes. Table 1 shows baseline characteristics of the cohort study categorized by quartiles of warning label score. Participants in the highest quartile were more likely to be men, never smokers, spend more time watching TV and using computer, snack between meals, and have a lower prevalence of diabetes, cancer, and CVD at baseline compared to the lowest quartile. Regarding dietary components, individuals with a higher warning label score in their diet had an increased energy intake, saturated fats, sodium, and alcohol, as well as lower adherence to the MedDiet than those in the lowest category. Moreover, these participants (Q4) had a slightly low intake of vegetables, fruits, and low-fat dairy products compared to those in Q1. Meanwhile, individuals in the fourth quartile of the warning label score (Q4) showed slightly higher fibre consumption than participants in the first quartile. This result could be attributed to the fact that the foods included in the warning label score are not related to sources rich in fibre, such as fruits, vegetables, dry fruits, and others. On average, participants in the highest quartile had a higher intake of white bread, dairy products, red and processed meat, and UPF foods than individuals in the lowest quartile.
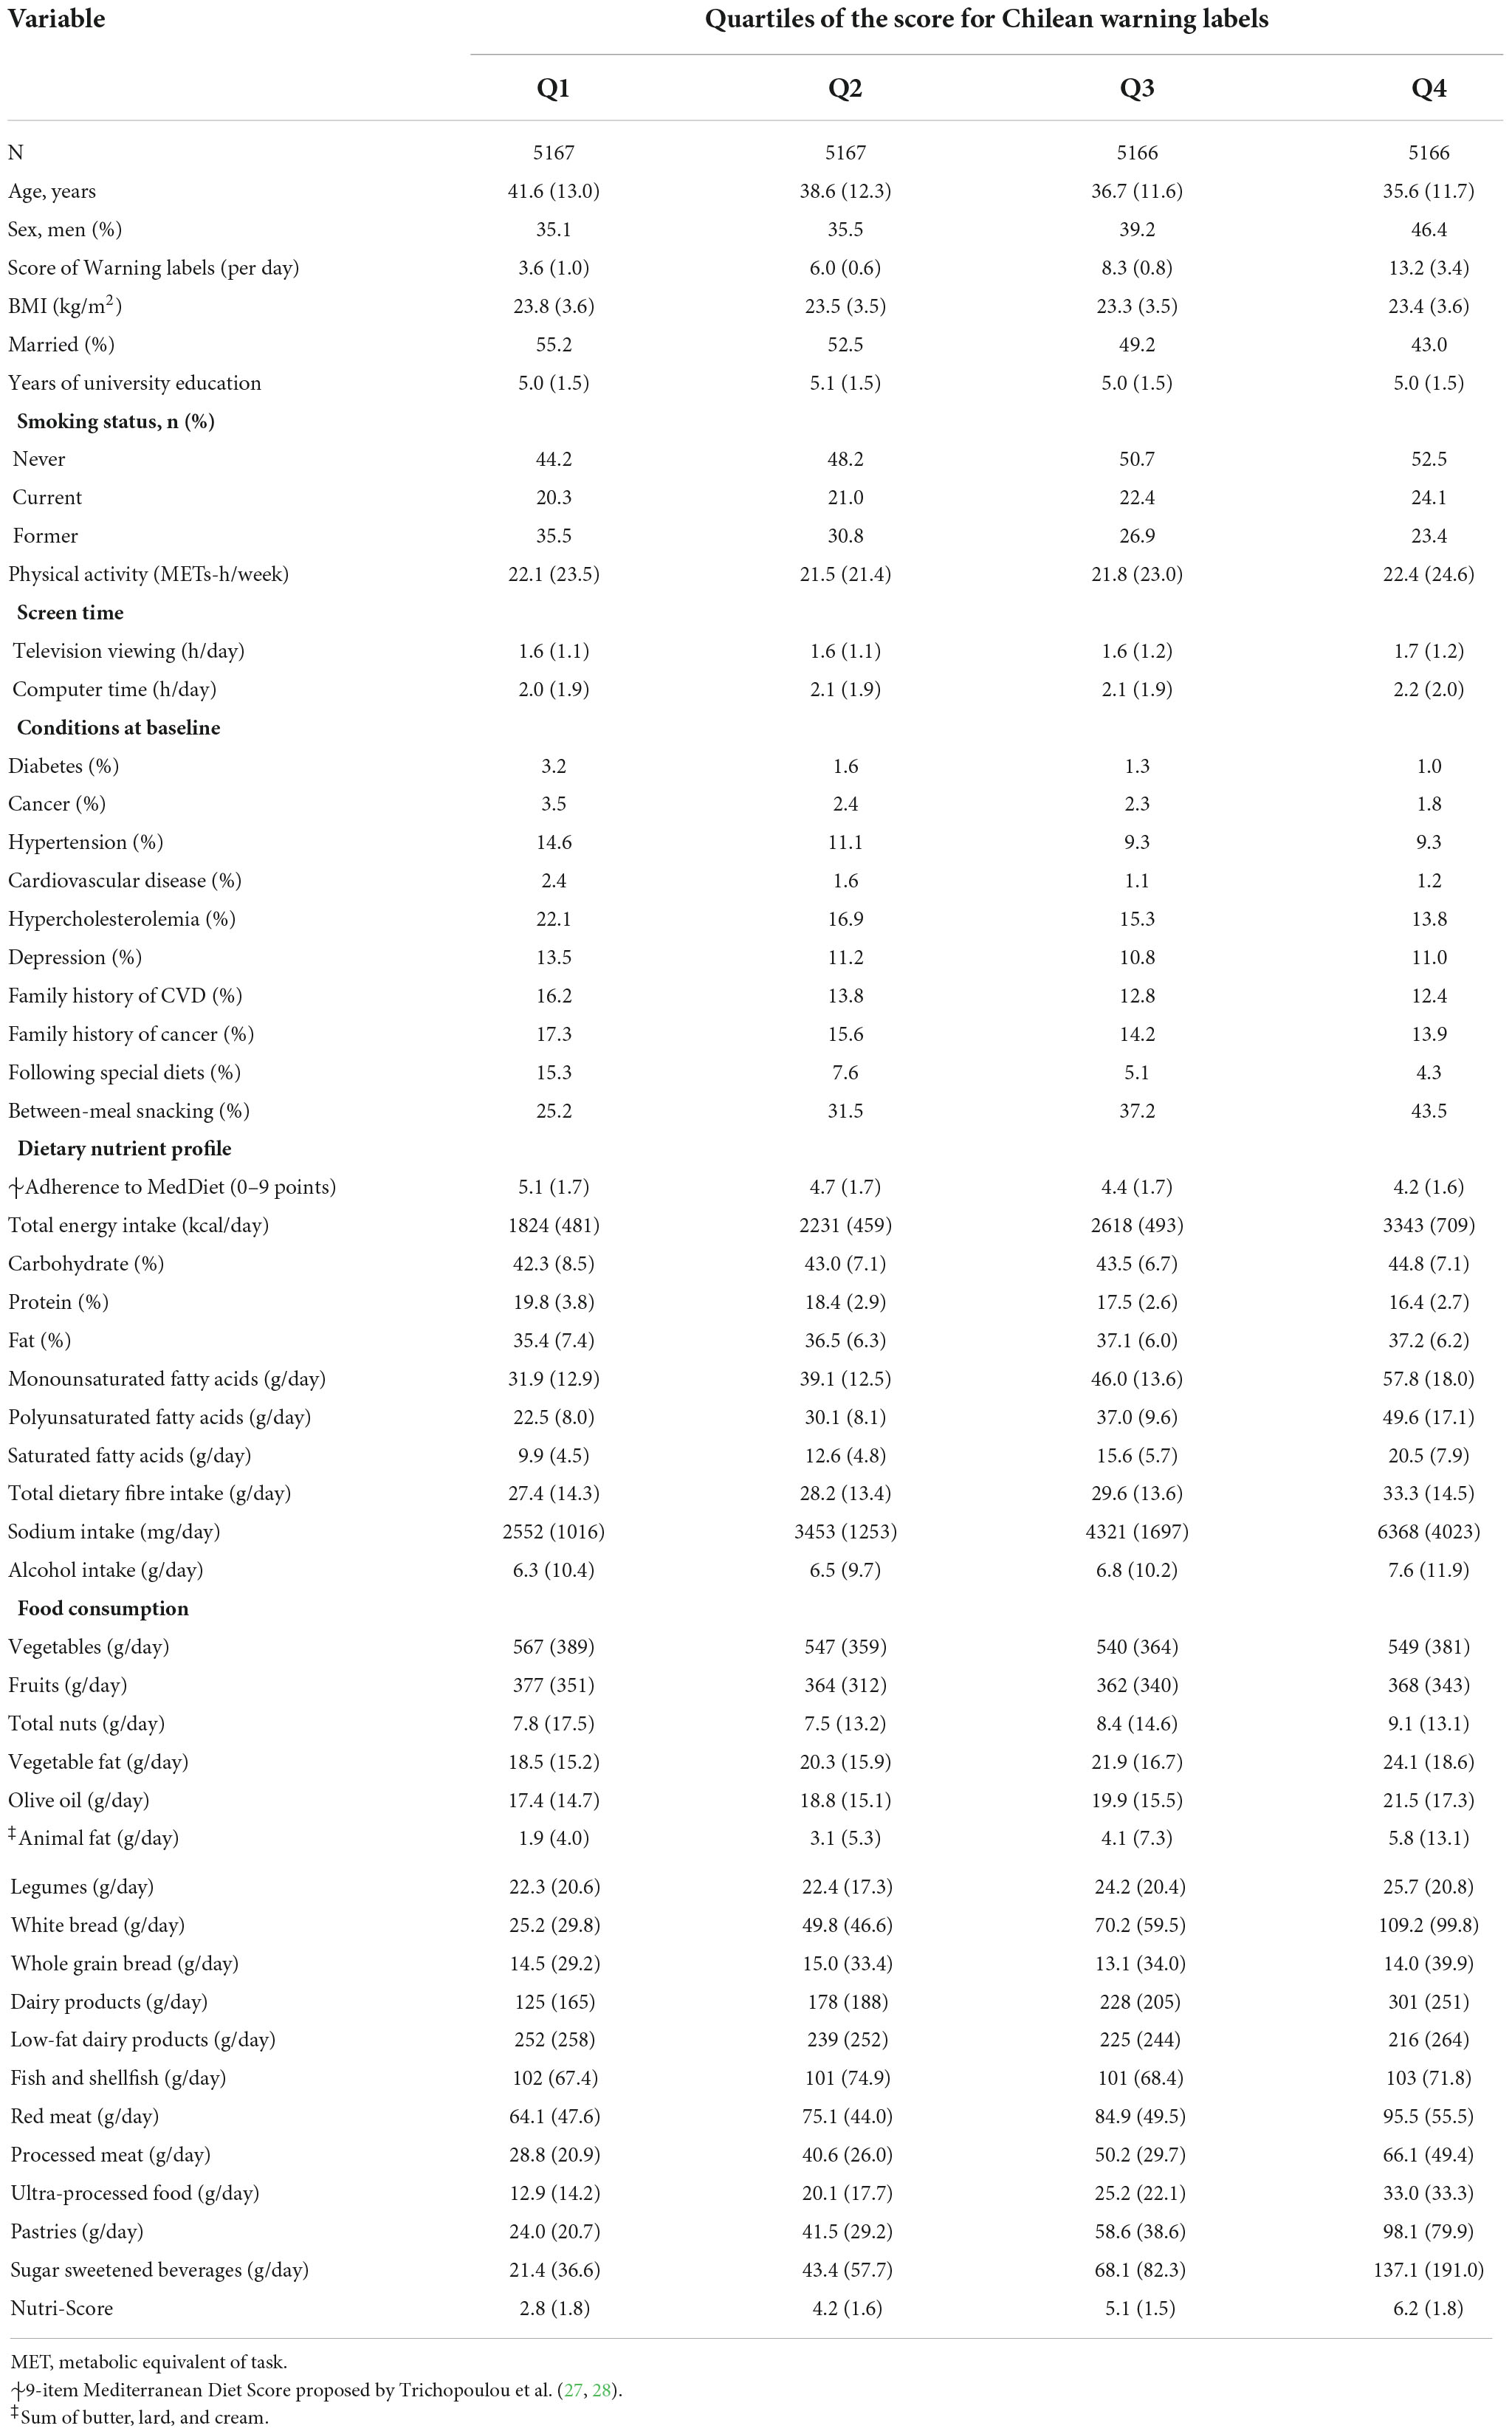
Table 1. Baseline characteristics of participants according to quartiles of the score calculated for Chilean warning labels: the SUN (Seguimiento Universidad de Navarra) cohort.
The HRs for all cause and cause specific mortality according to quartiles of the score of Chilean warning labels are presented in Table 2. Higher score of these warning labels (Q4) was associated with an increased risk of all-cause mortality compared to the lowest quartile (Q1: reference) in the fully adjusted model: 1.51 (95% CI: 1.07–2.13), and there was a linear dose-response relationship across quartiles (p-trend = 0.010). Moreover, the multivariable-adjusted model showed that participants in the fourth quartile of warning labels had an increased risk of cancer mortality [HR: 1.91 (95% CI: 1.18–3.10; p-trend = 0.006)] compared to the first quartile. However, there was no statistically significant association between this score of warning label and CVD mortality [(HR: 1.20; 95% CI: 0.54–2.69; p-trend = 0.670)]. Repeated measurements, using data from food consumption after 10 years of follow-up evidenced that the highest quartile of warning labels was consistently associated with a significantly higher risk to all-cause [(HR: 1.47; 95% CI: 1.04–2.08; p-trend = 0.089)] and cancer mortality [(HR: 1.84; 95% CI: 1.14–2.96; p-trend = 0.028)] as compared to the lowest quartile. Figure 3 shows the relationship between food consumption with the warning label score and overall mortality in subgroup analyse comparing the fourth vs. the first quartile. However, we did not find statistically significant interactions (all p-values > 0.1). To test the robustness of our main findings, several sensitivity analyses were conducted (Figure 4) after considering different scenarios. Results did not change in any of the different scenarios, suggesting that the association between higher scores of the Chilean warning label nutrient profile and all-cause mortality was robust. Nonetheless, when we excluded cases of prevalent conditions (CVD, cancer, and diabetes), the associations were no longer significant. Figure 5 shows the dose-response relationship between intake of warning labels and all-cause mortality. The restricted cubic spline model indicated that individuals who had more than 10 warning labels had a higher risk of all-cause mortality (Figure 5). In addition, we evaluated the relative influence of each of the warning labels by repeating the multivariable-adjusted Cox regression models excluding one warning label at a time and comparing the highest vs. lowest quartile (Figure 6). All HRs showed a direct association between mortality and higher intake of warning labels, but interestingly no significant association was found when excluding sugar warning labels (HR: 1.34; 95% CI: 0.96–1.89). Analyses combining exposures (warning label, UPF, or Nutri-Score) are shown in Table 3. Participants in the highest categories (warning label ≥ p50th and UPF > 4 servings/day) presented a 66% increased risk of mortality [HR (95% CI): 1.66 (1.21–2.26)] compared to the lowest category. Similar results were found for the highest score of warning label and Nutri-Score (both ≥ p50th) [HR (95% CI): 1.51 (1.14–2.01)], as well as when we evaluated the Nutri-Score and UPF intake [HR (95% CI): 1.60 (1.22–2.11)] (Supplementary Table 2). When comparing the warning label score and Nutri-Score (Table 4), fully adjusted models showed that the AIC and BIC values did not differ from each other when we compared the highest vs. lowest quartile. For the warning label: AIC = 4264, BIC = 4470; and for the Nutri-Score: AIC = 4266, BIC = 4472.
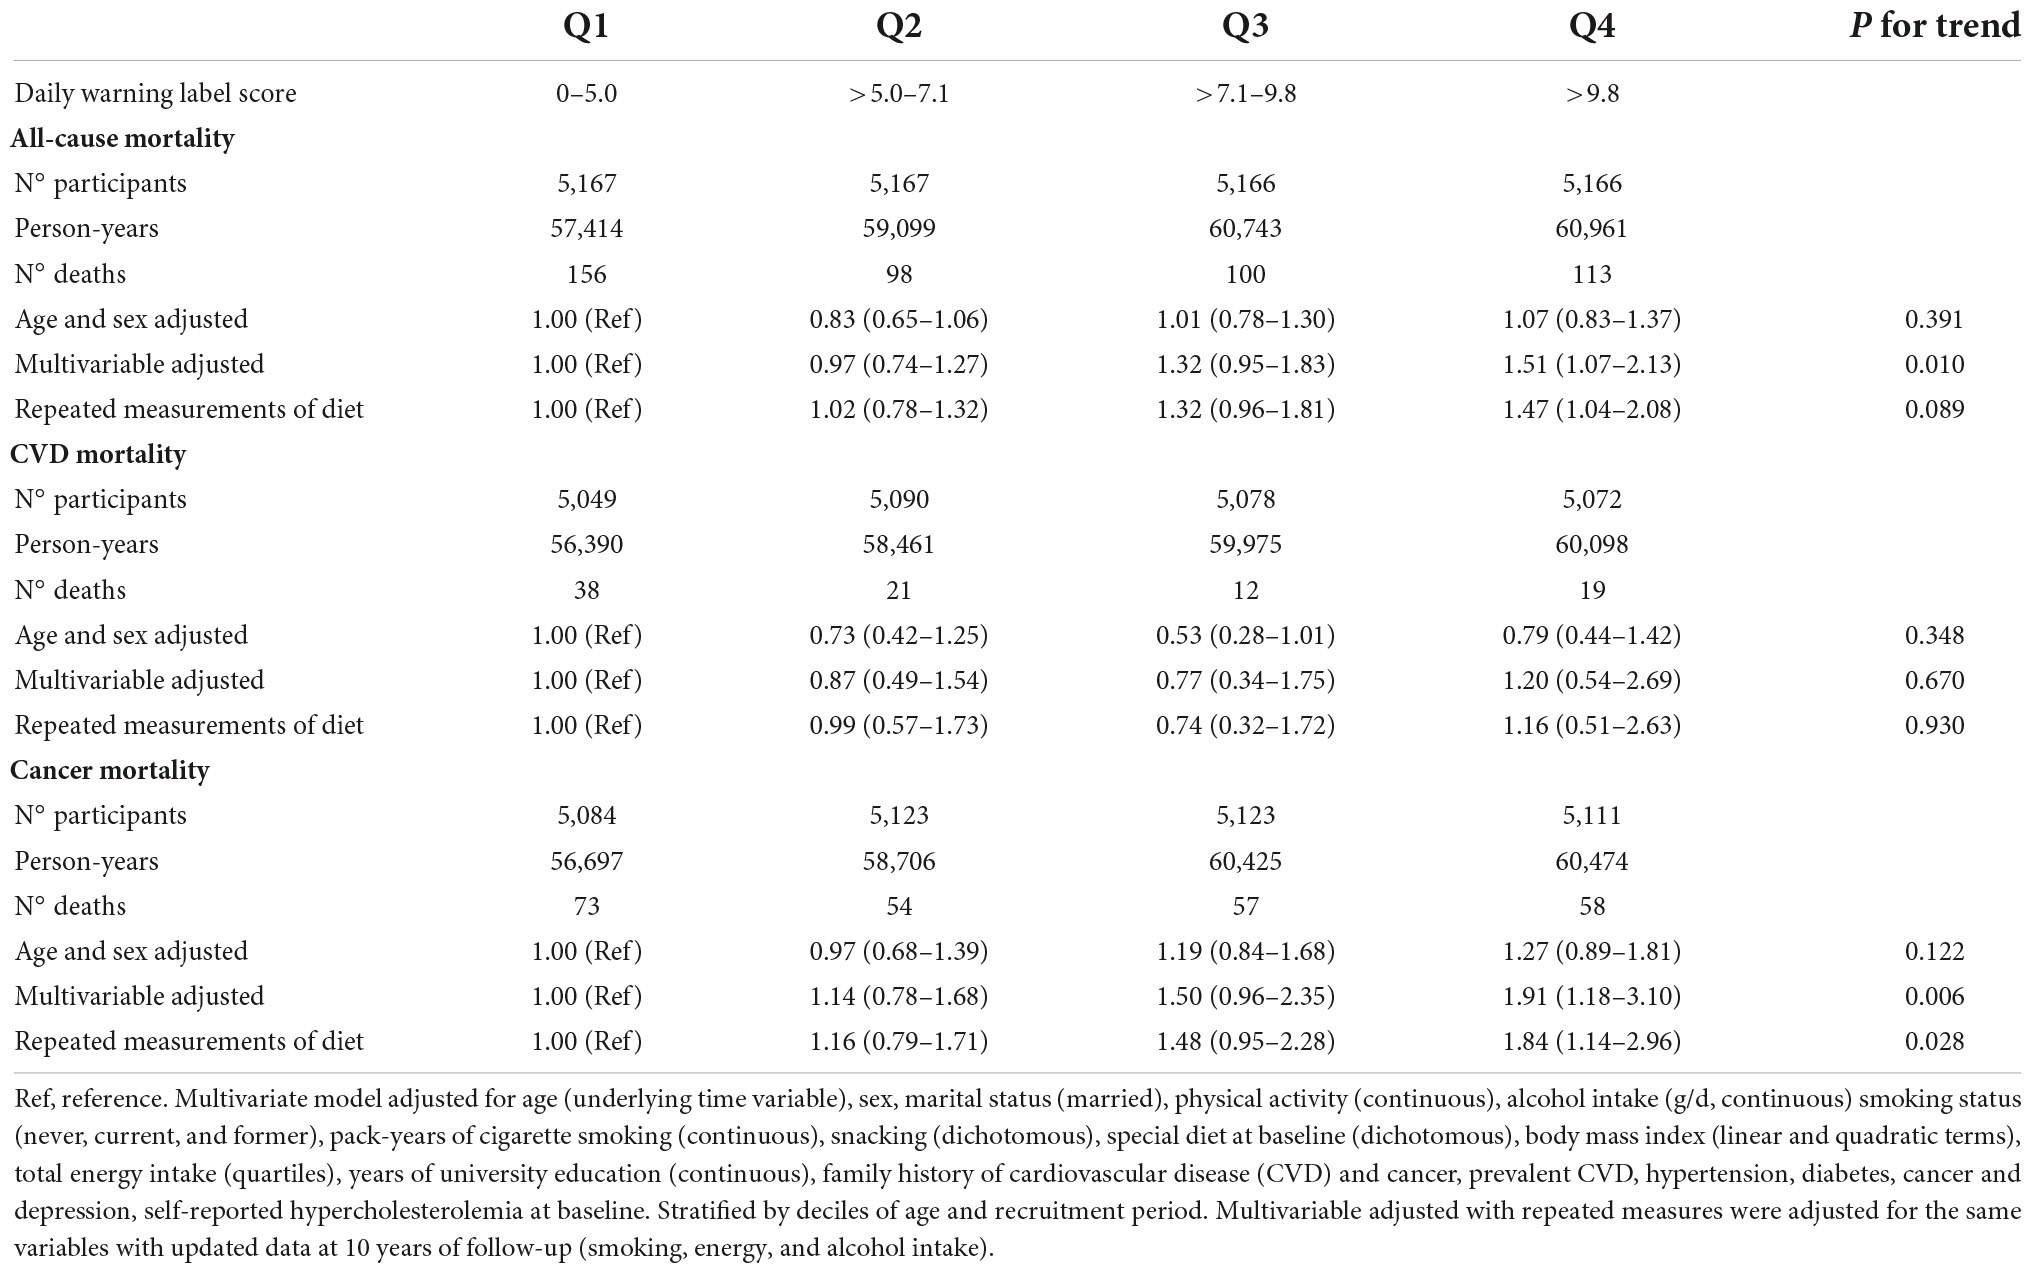
Table 2. Cox proportional hazard ratios (95% confidence intervals) for mortality according to quartiles of Chilean warning label score.
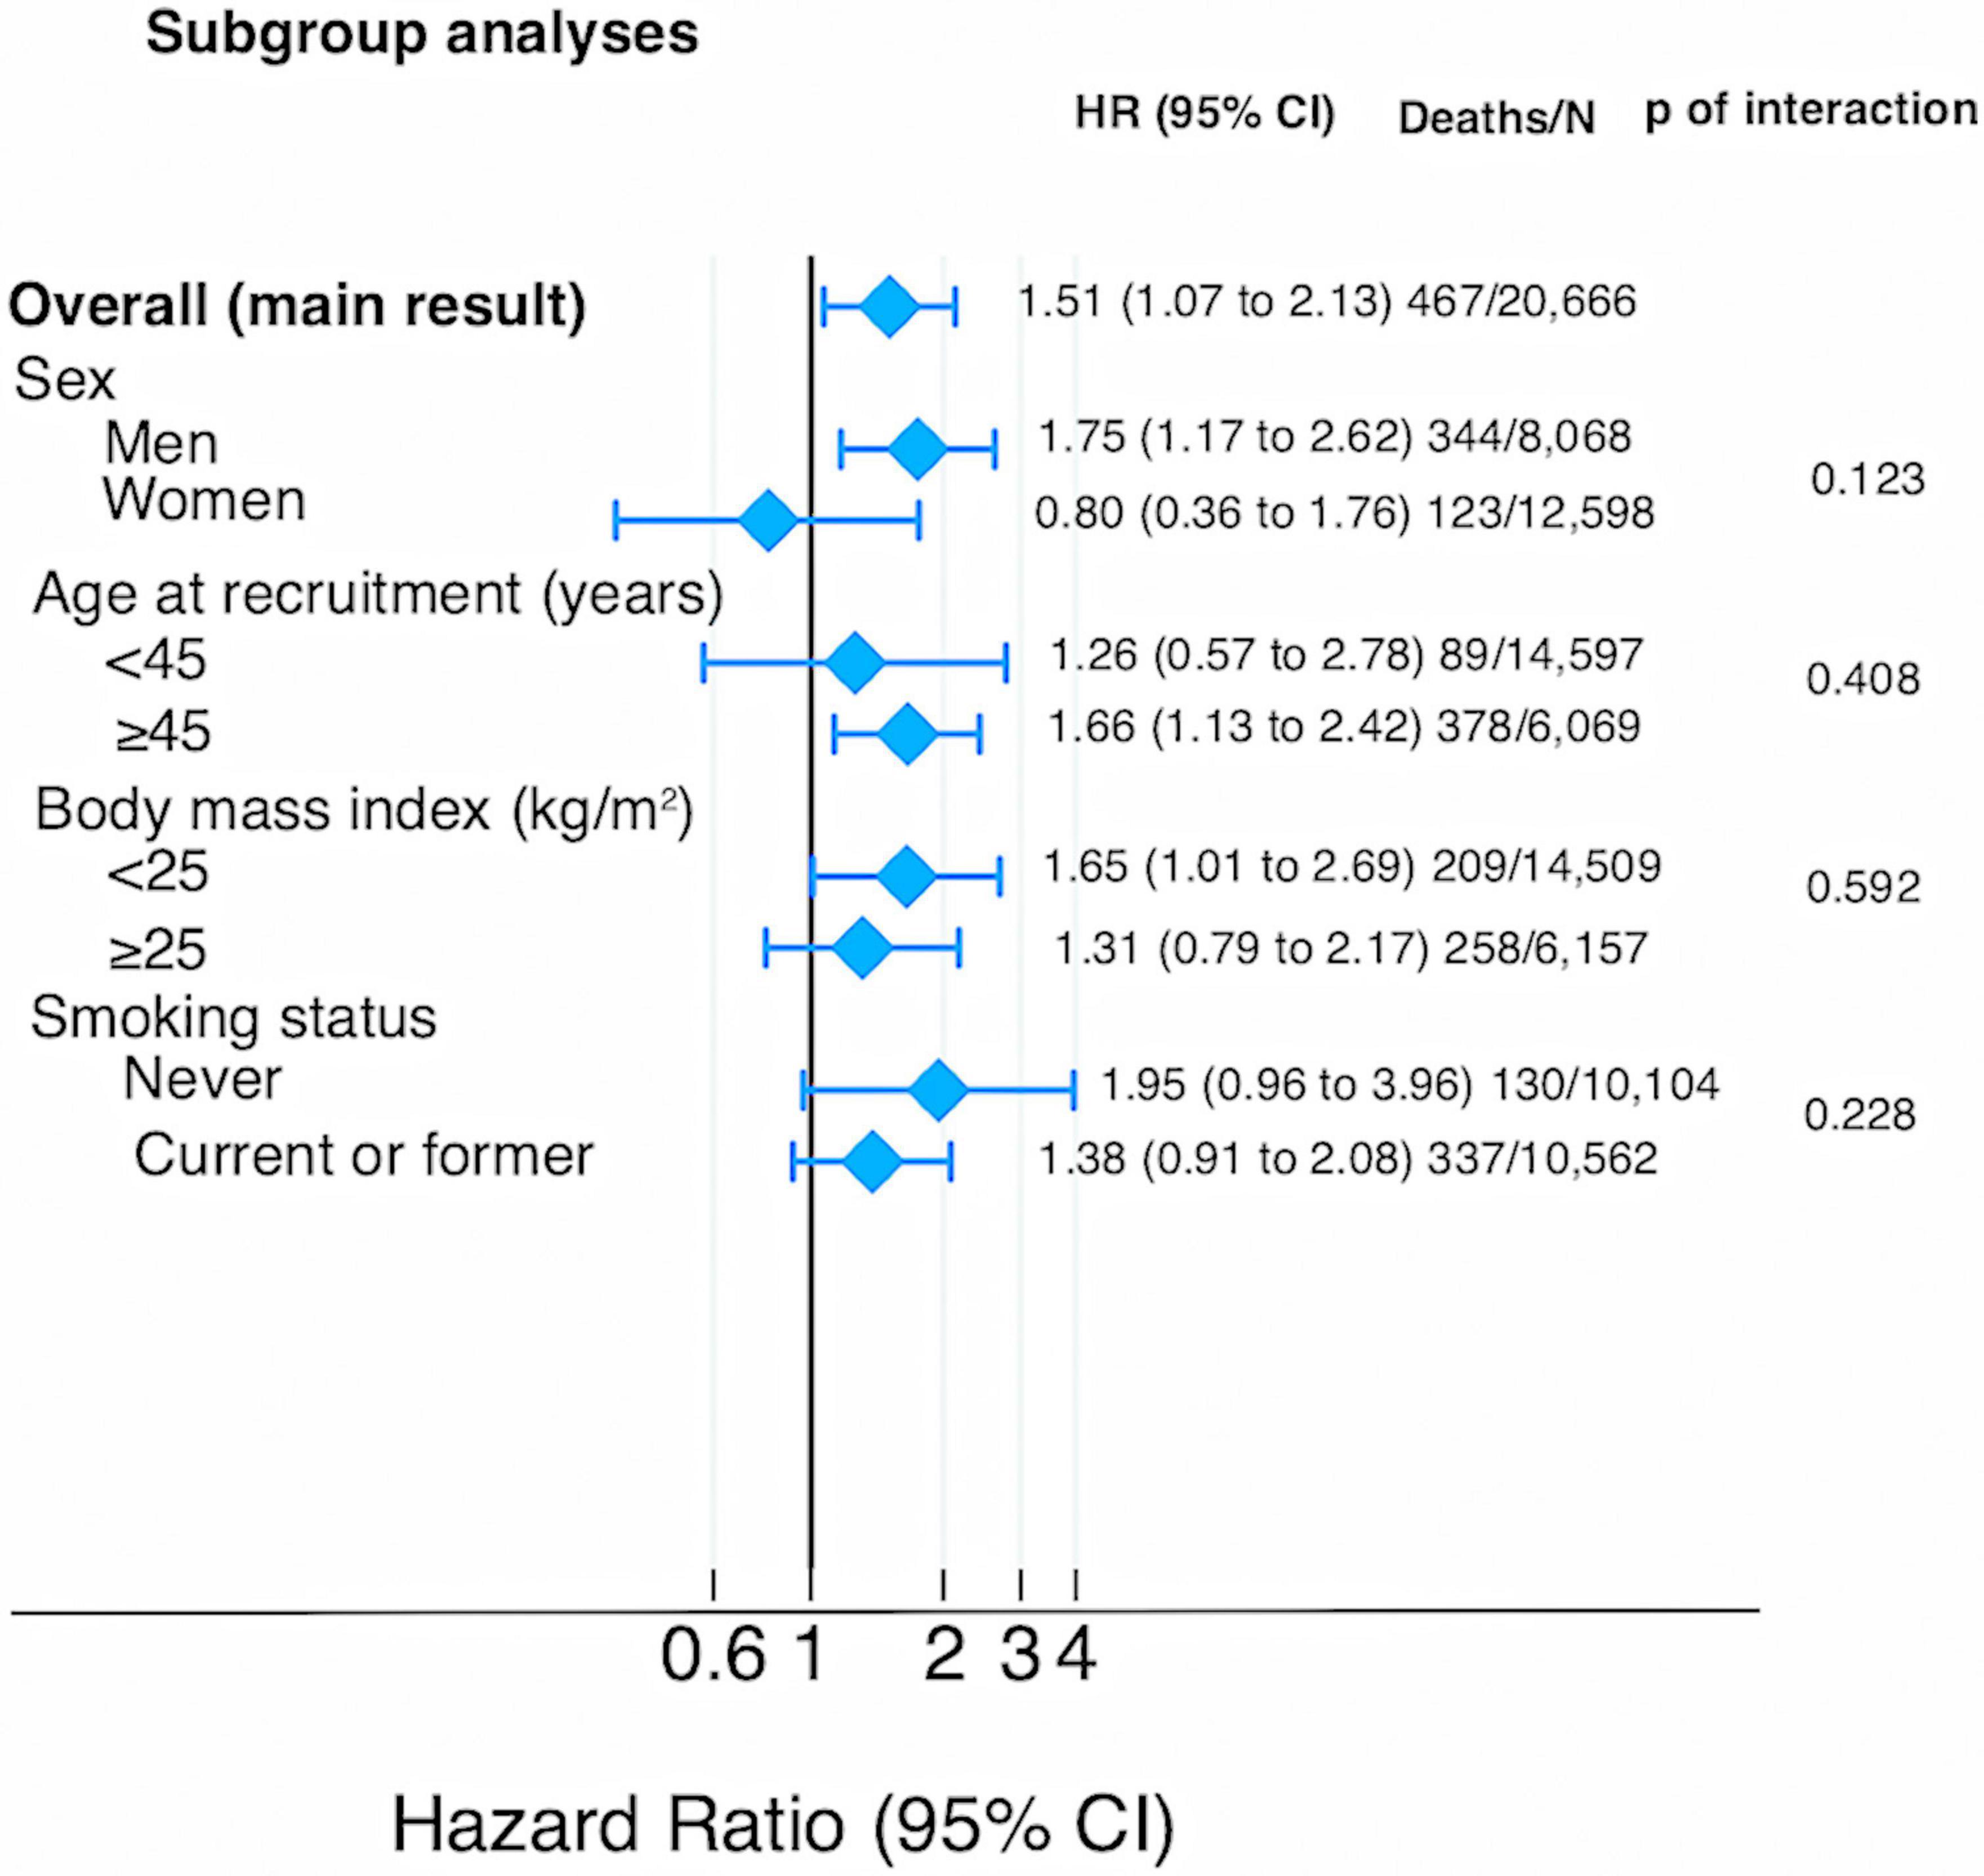
Figure 3. Sub-group analyses for the association between Chilean warning label score and all-cause mortality (multivariable-adjusted HR and 95% CI for the highest vs. lowest quartile).
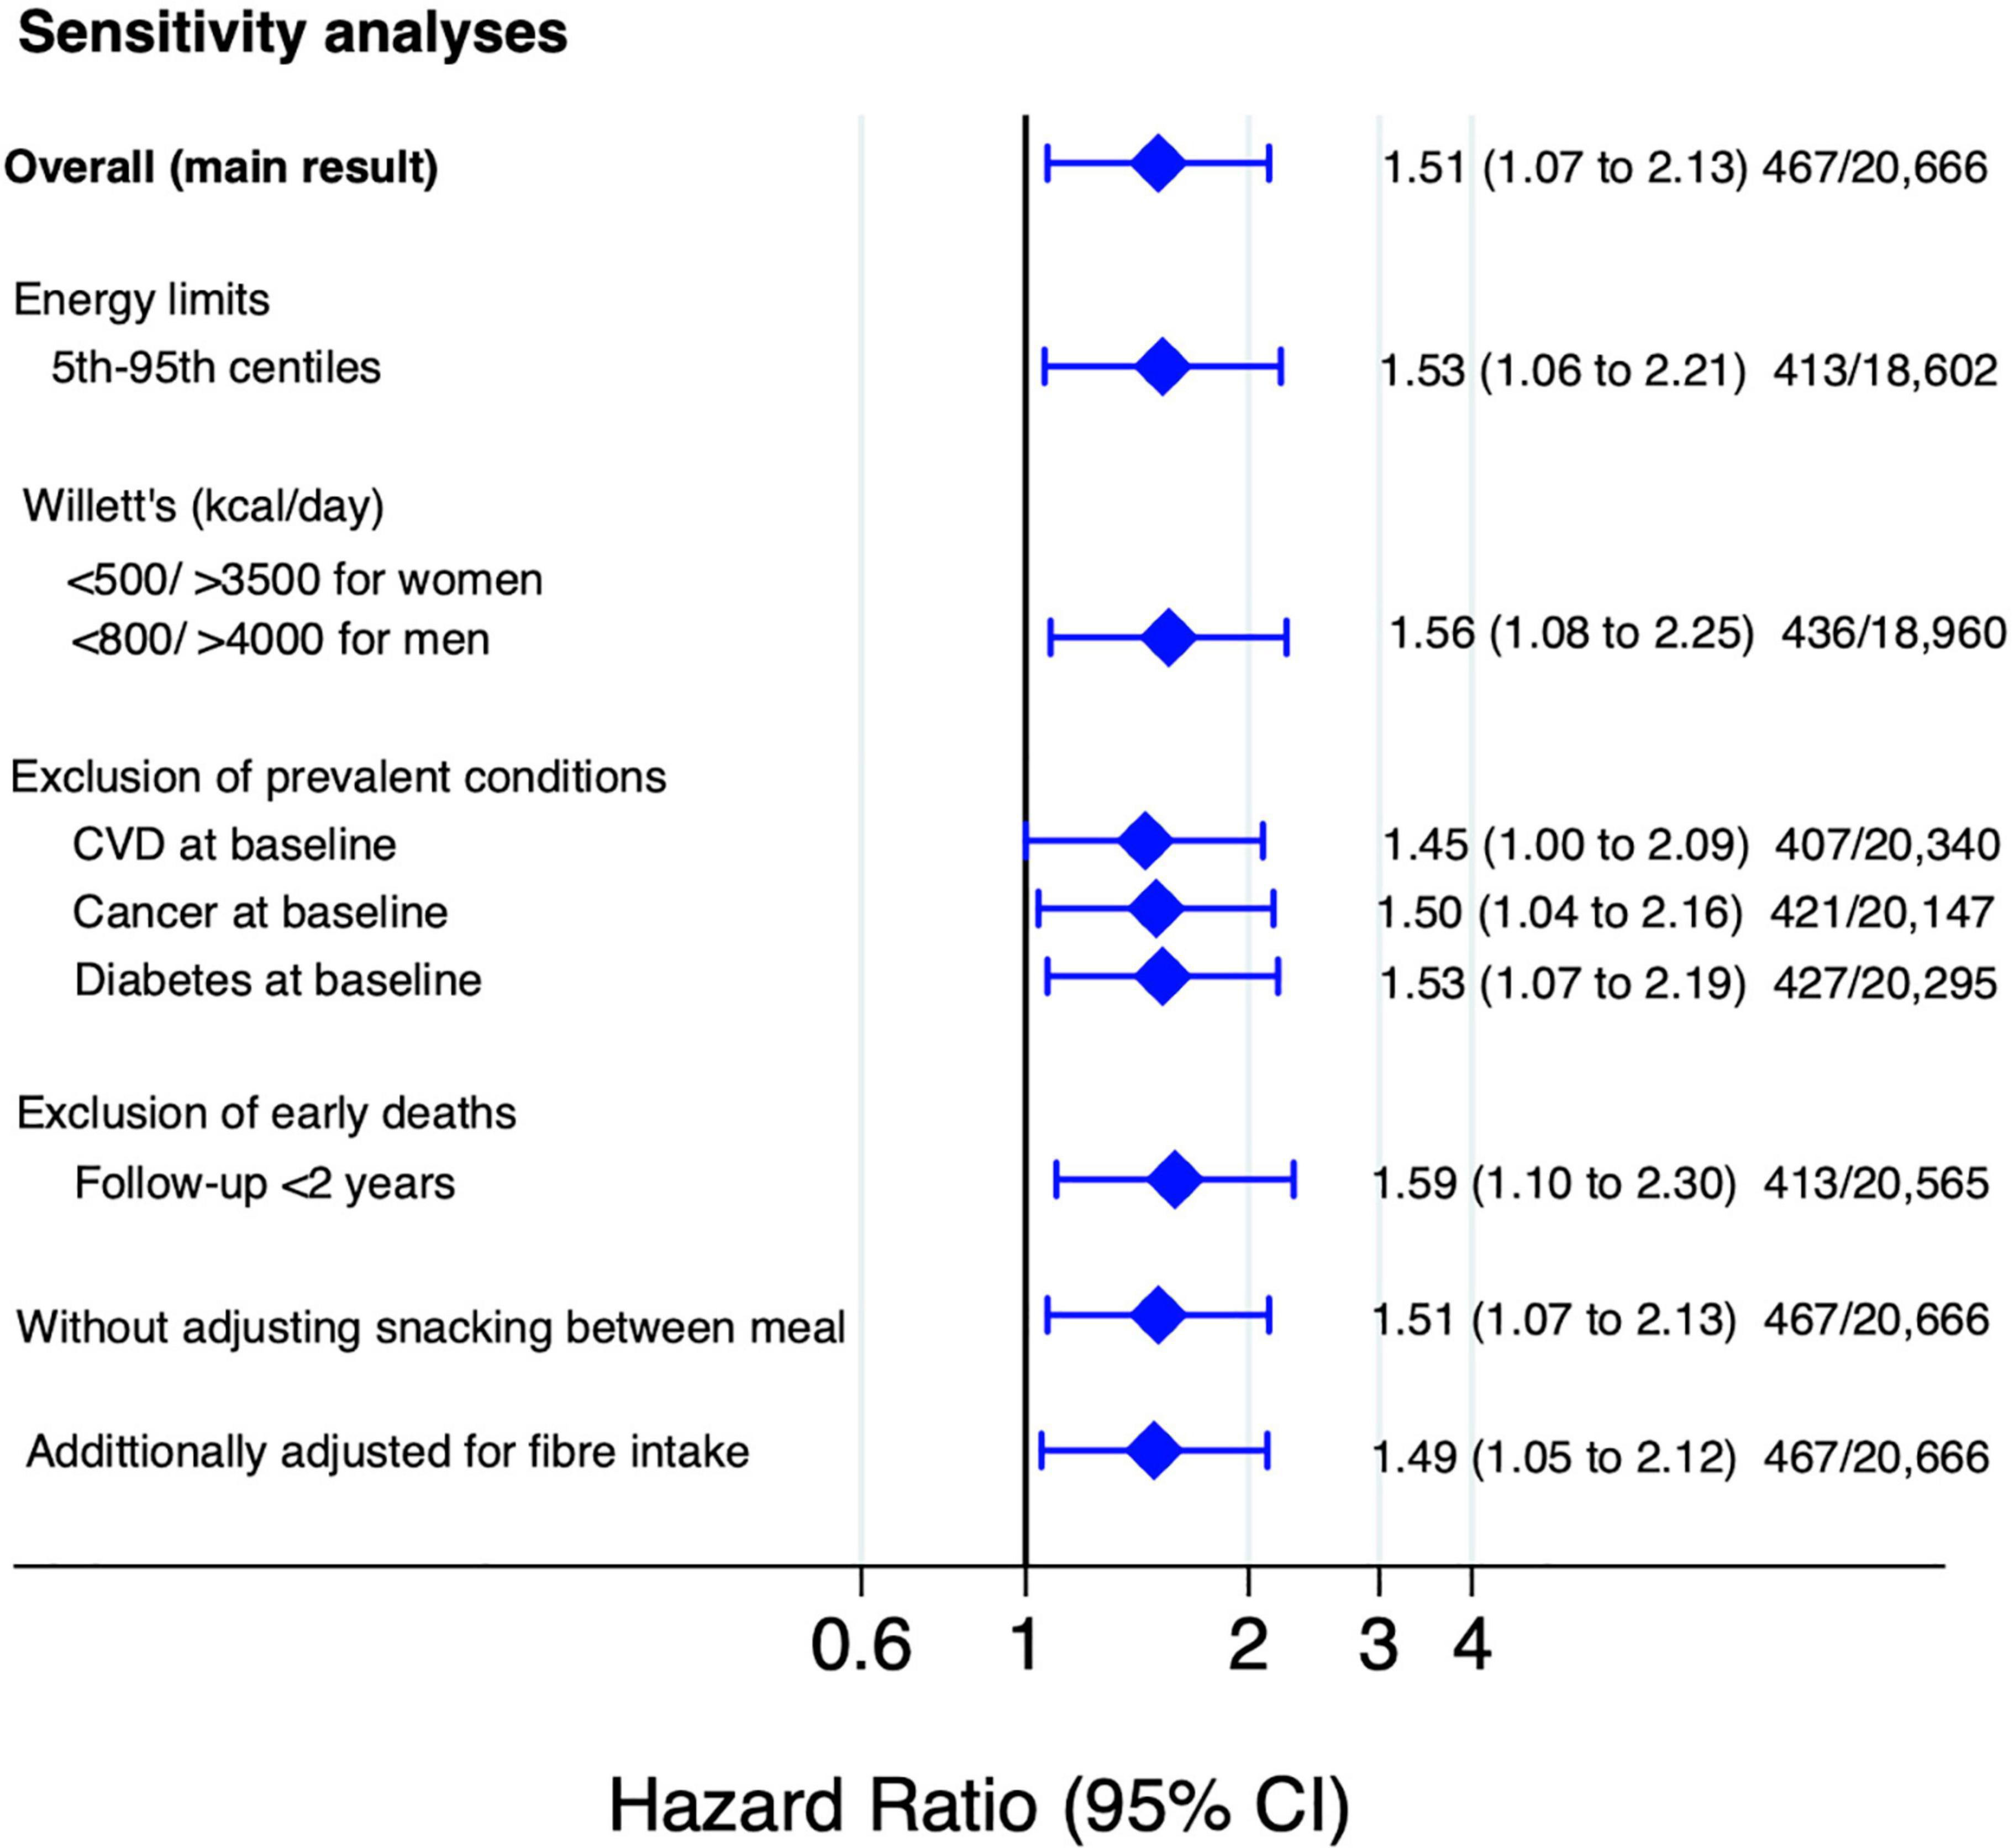
Figure 4. Sensitivity analyses for the association between Chilean warning label score and all-cause mortality (multivariable-adjusted HR and 95% CI for the highest vs. lowest quartile).
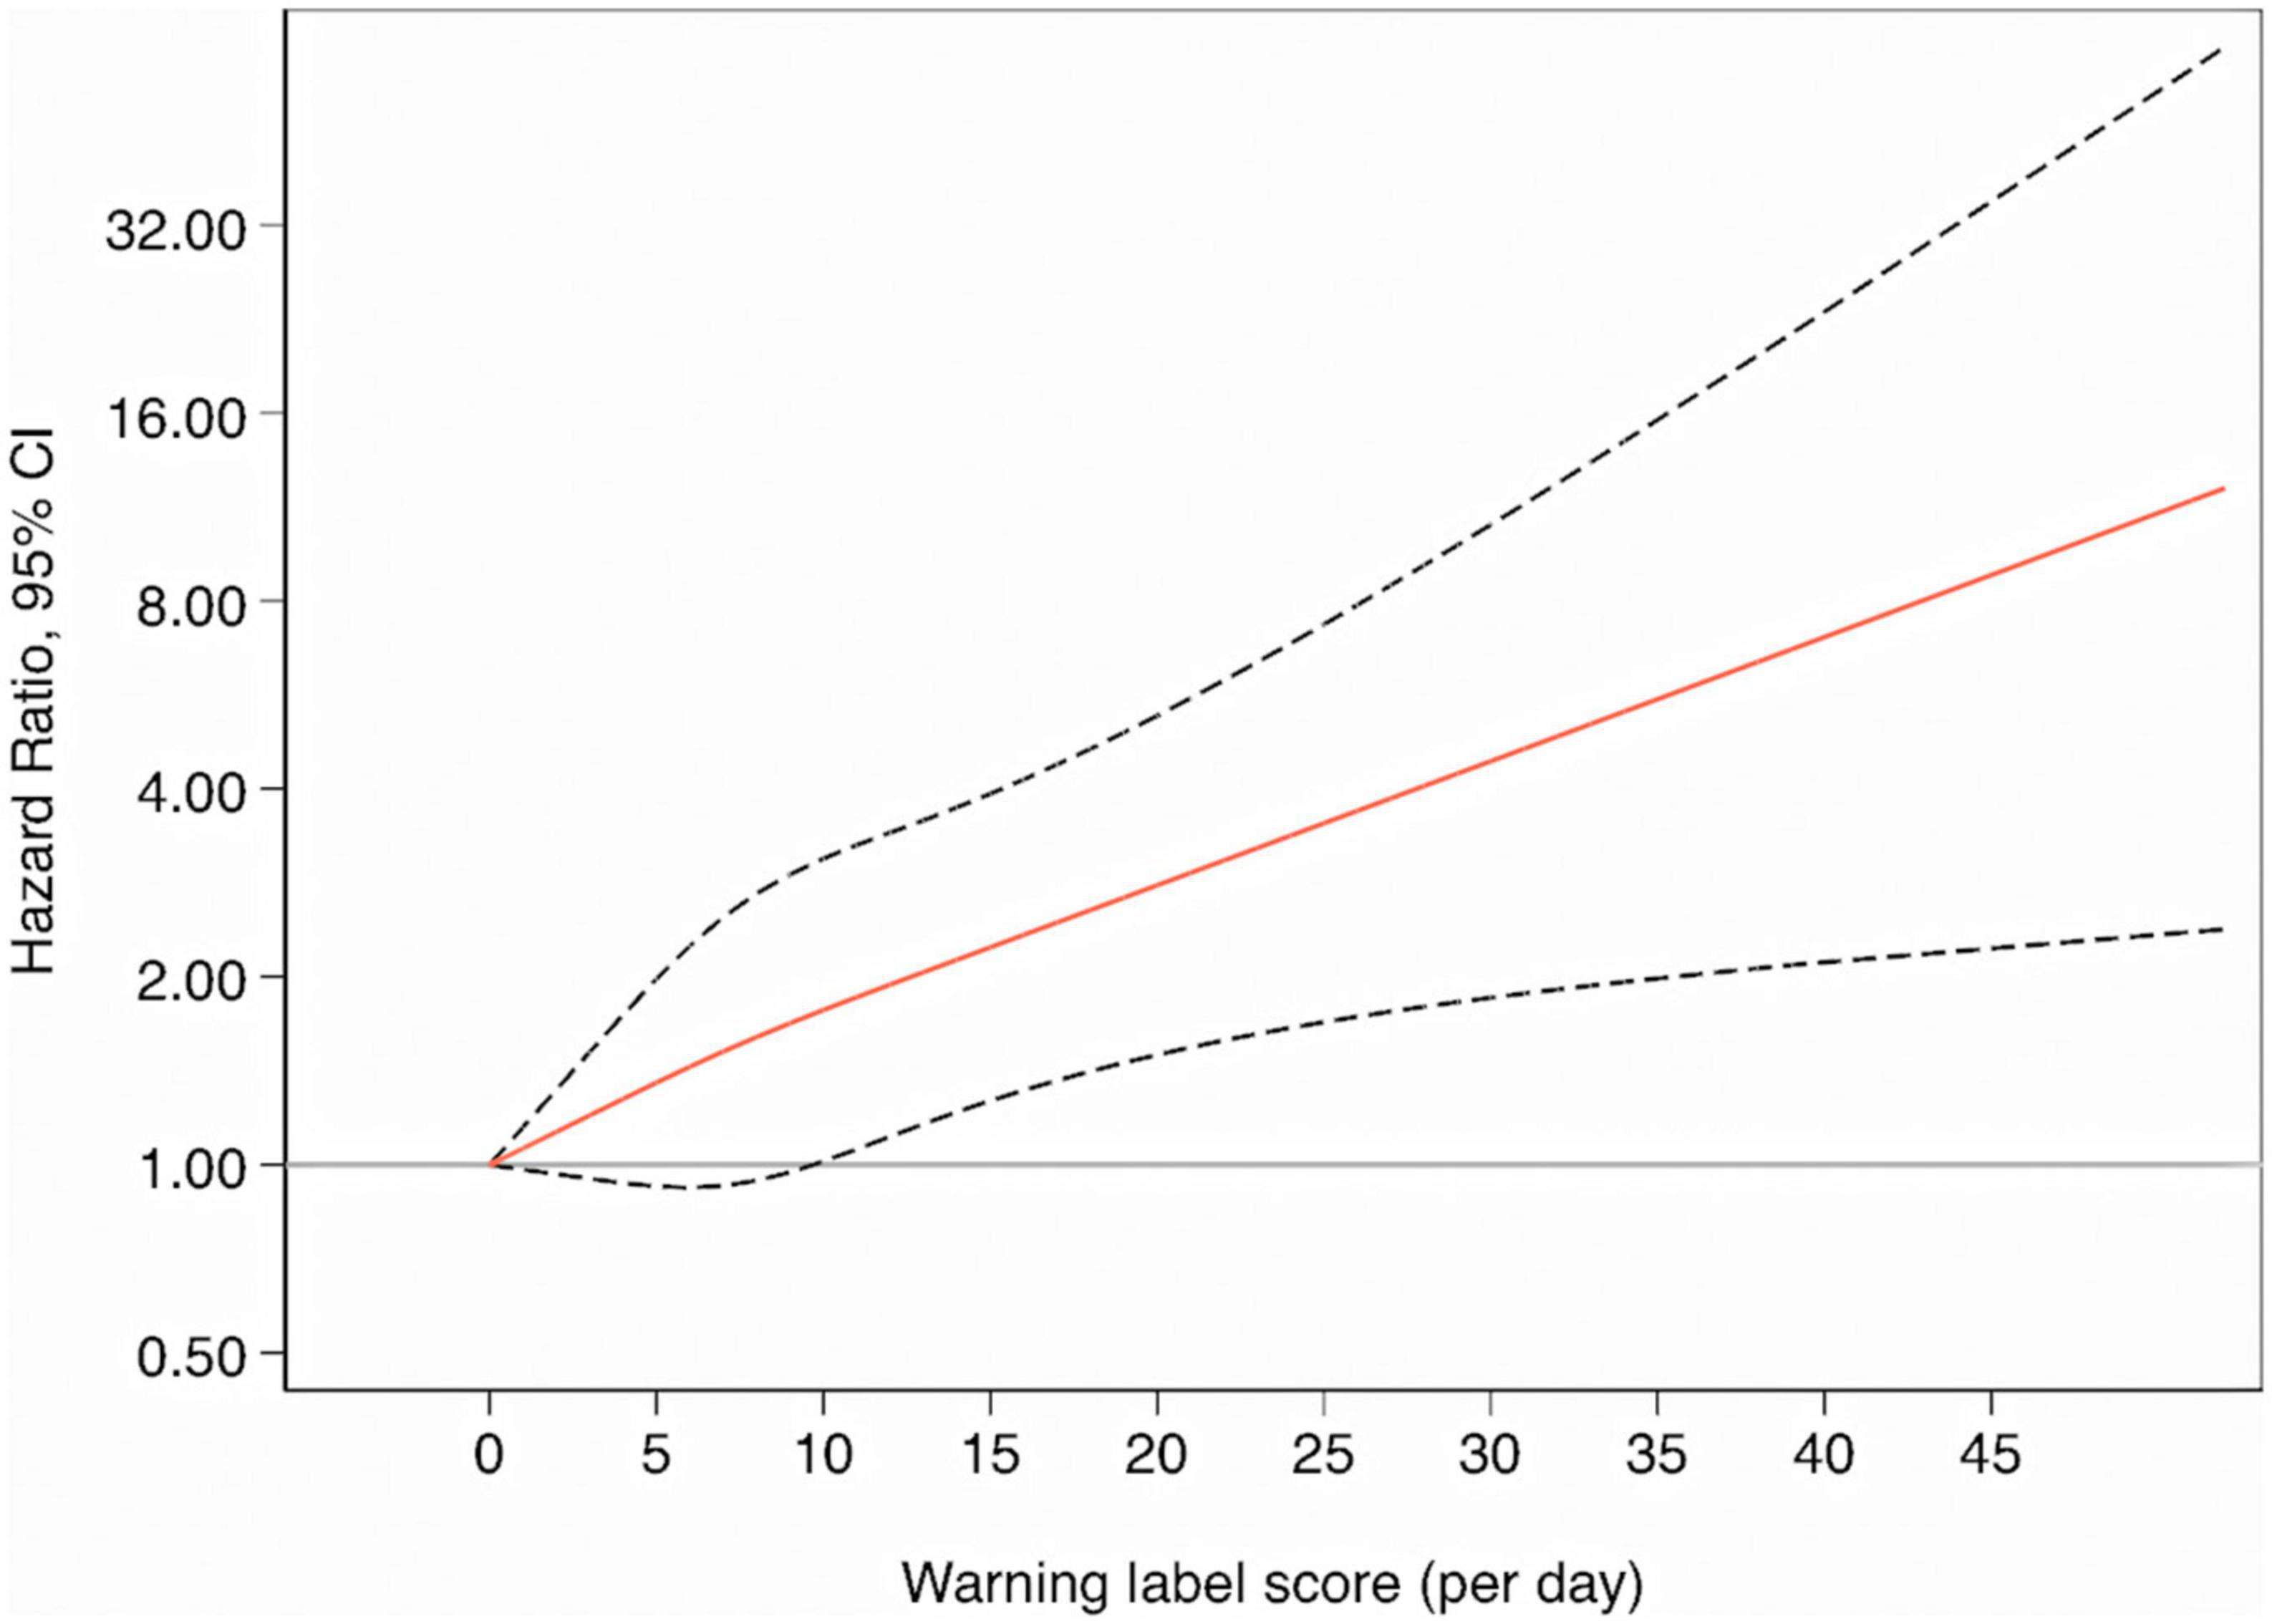
Figure 5. The smooth line represents the hazard ratio for the risk of all-cause mortality when using zero as the reference value for the warning label score (3 knots) whereas the dashed lines indicate 95% CIs.
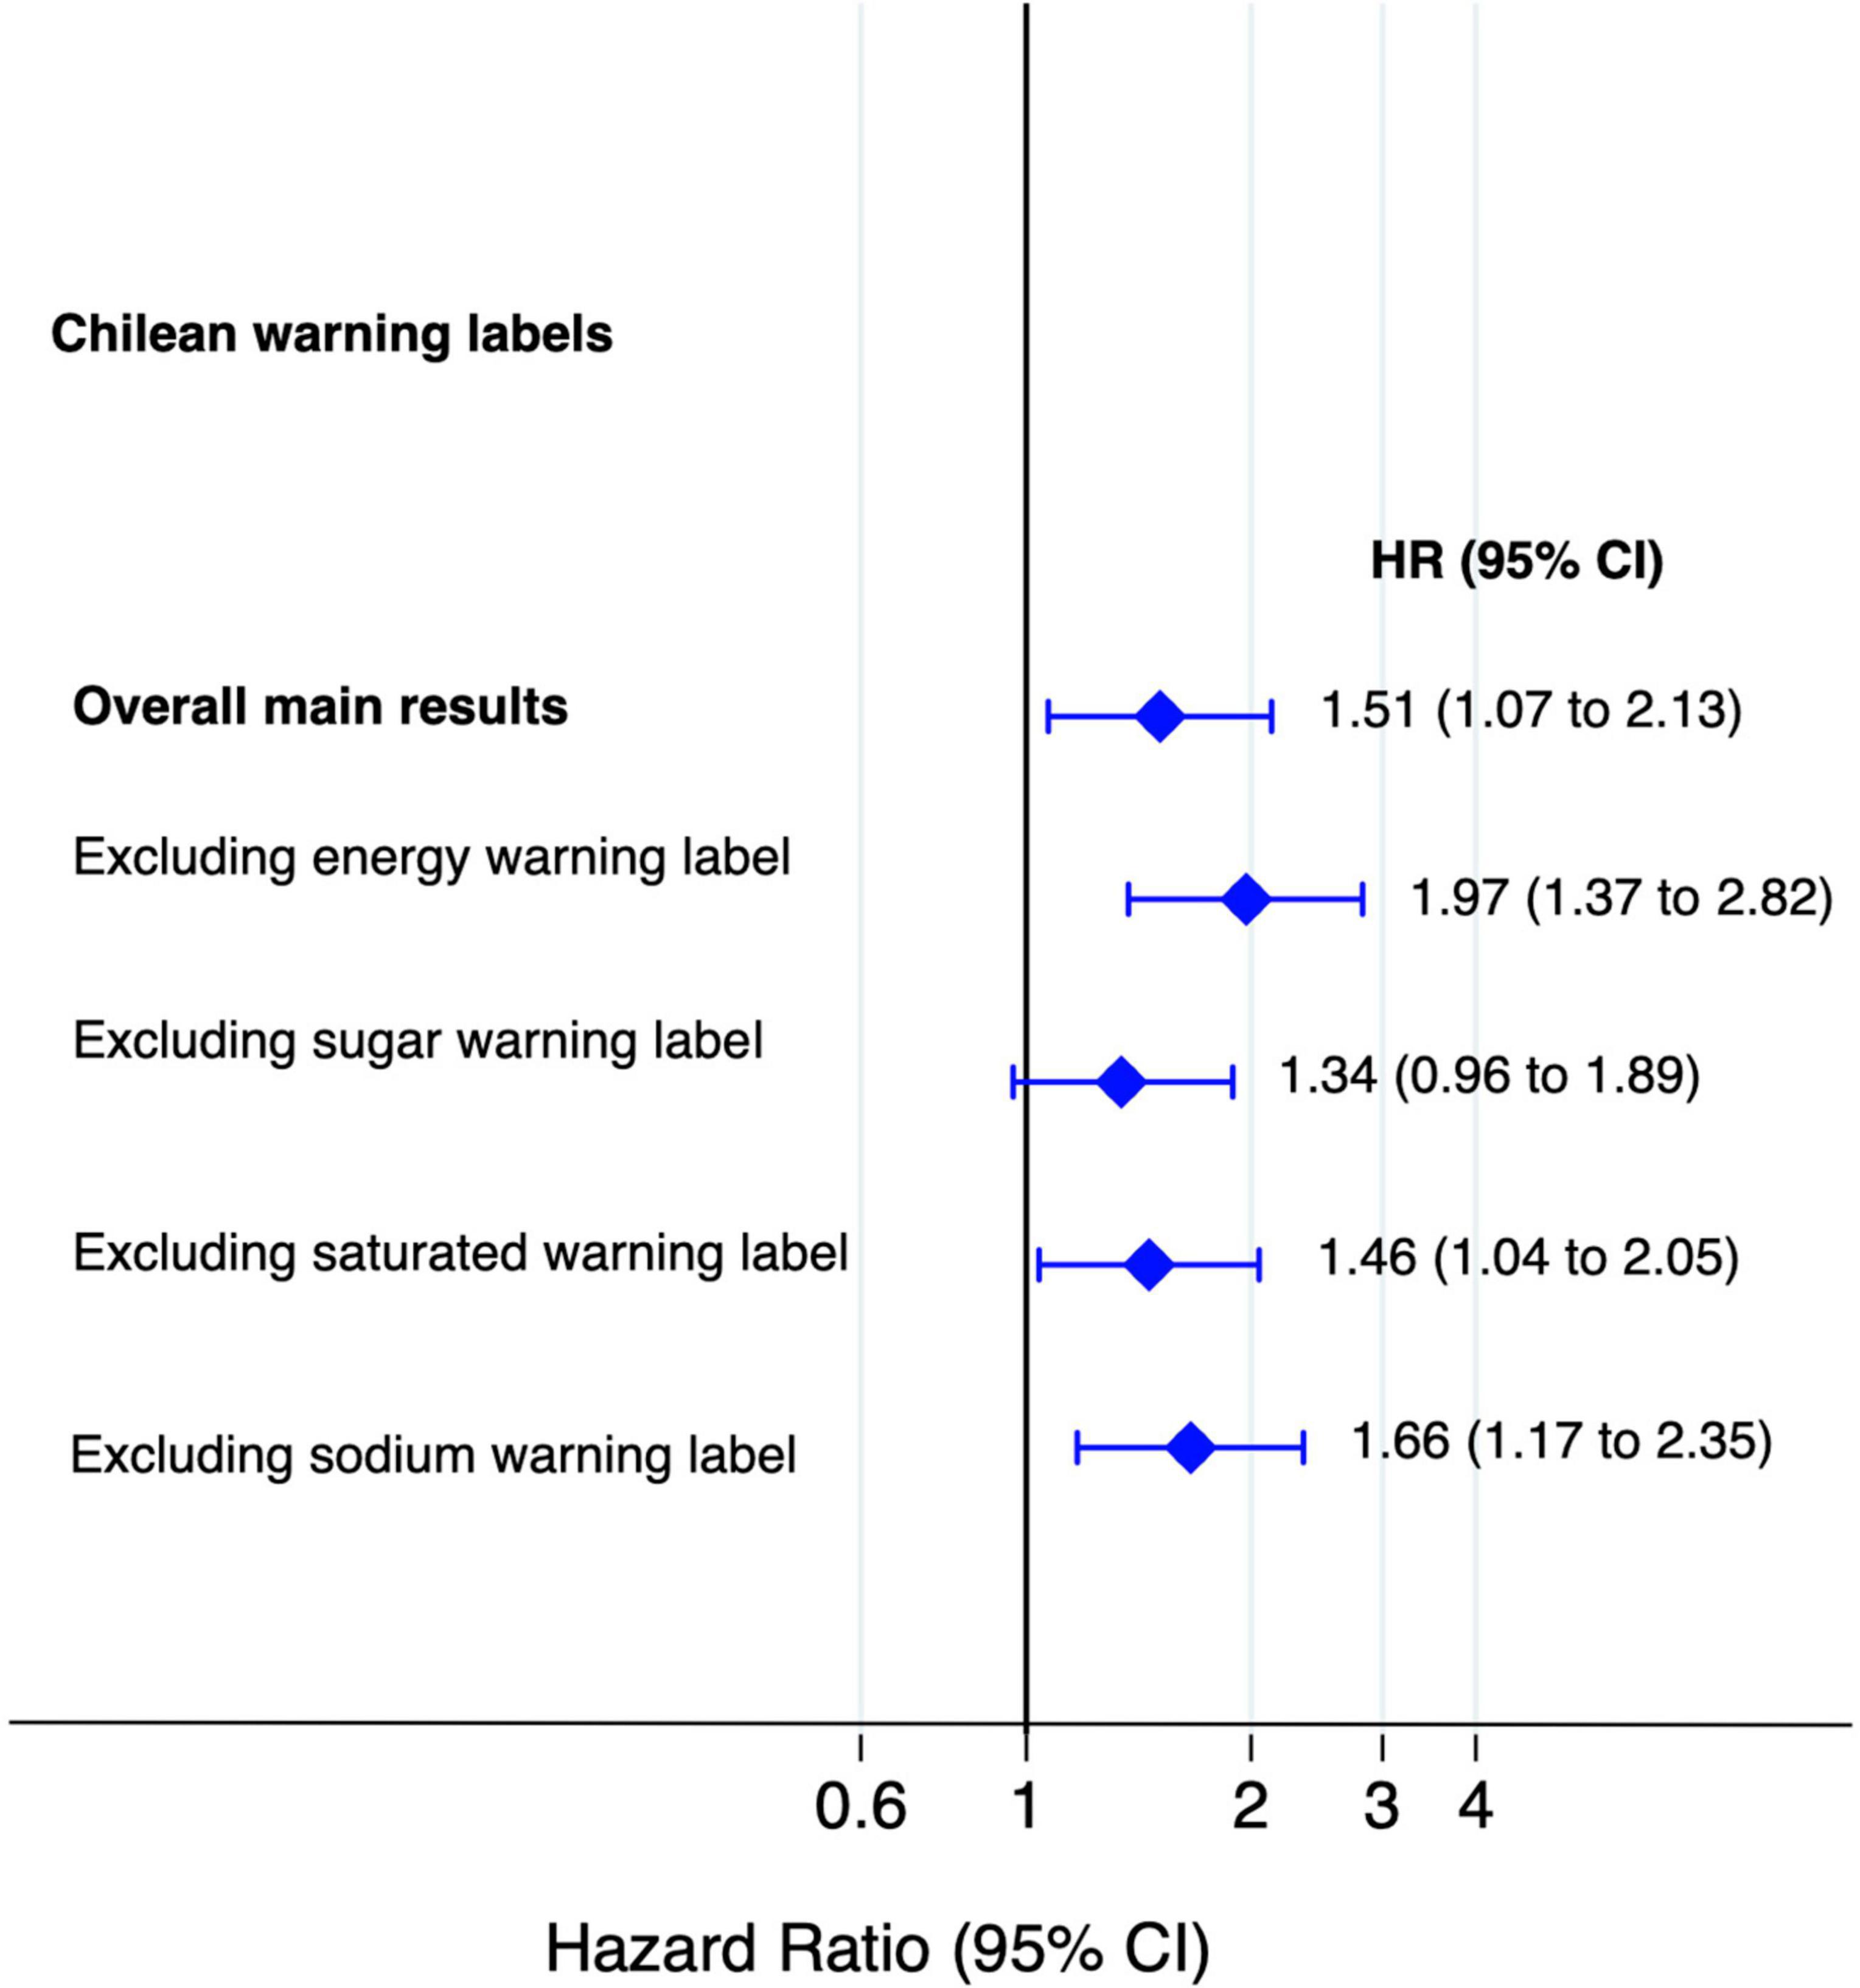
Figure 6. Association between food consumption with Chilean warning label score and mortality and excluding one warning label at time (multivariable-adjusted HR and 95% CI for the highest vs. lowest quartile).
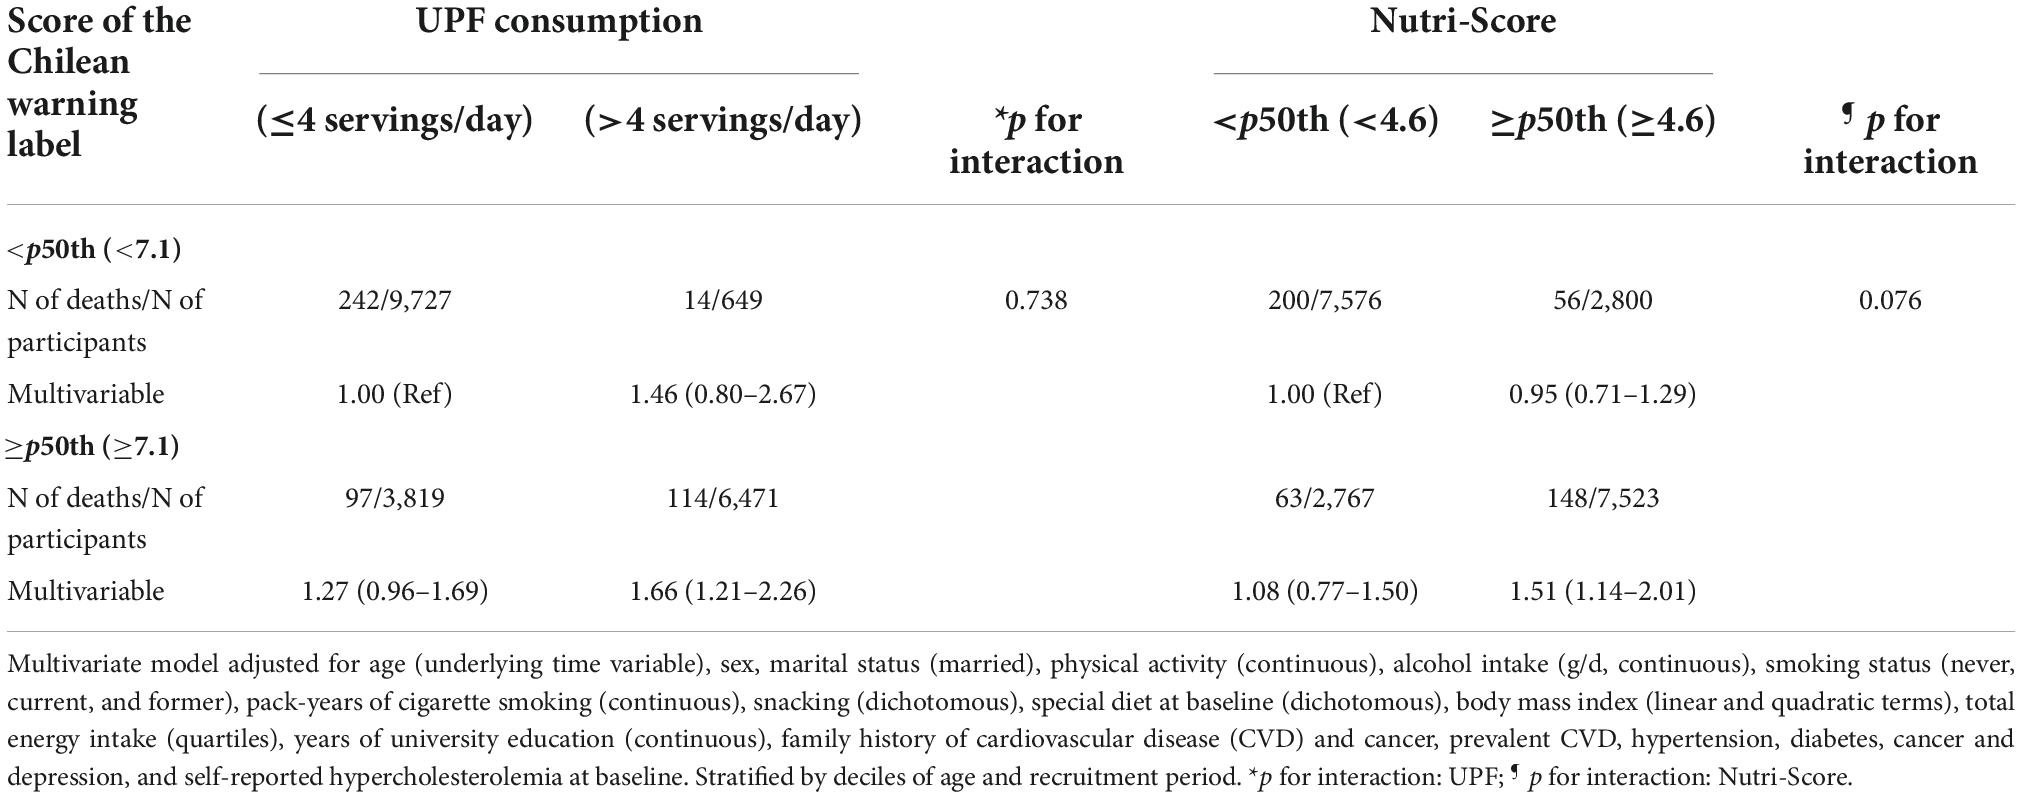
Table 3. Hazard ratios (95% confidence intervals) for all-cause mortality according to baseline median consumption of foods with Chilean warning labels, ultra-processed food (UPF), and Nutri-Score.
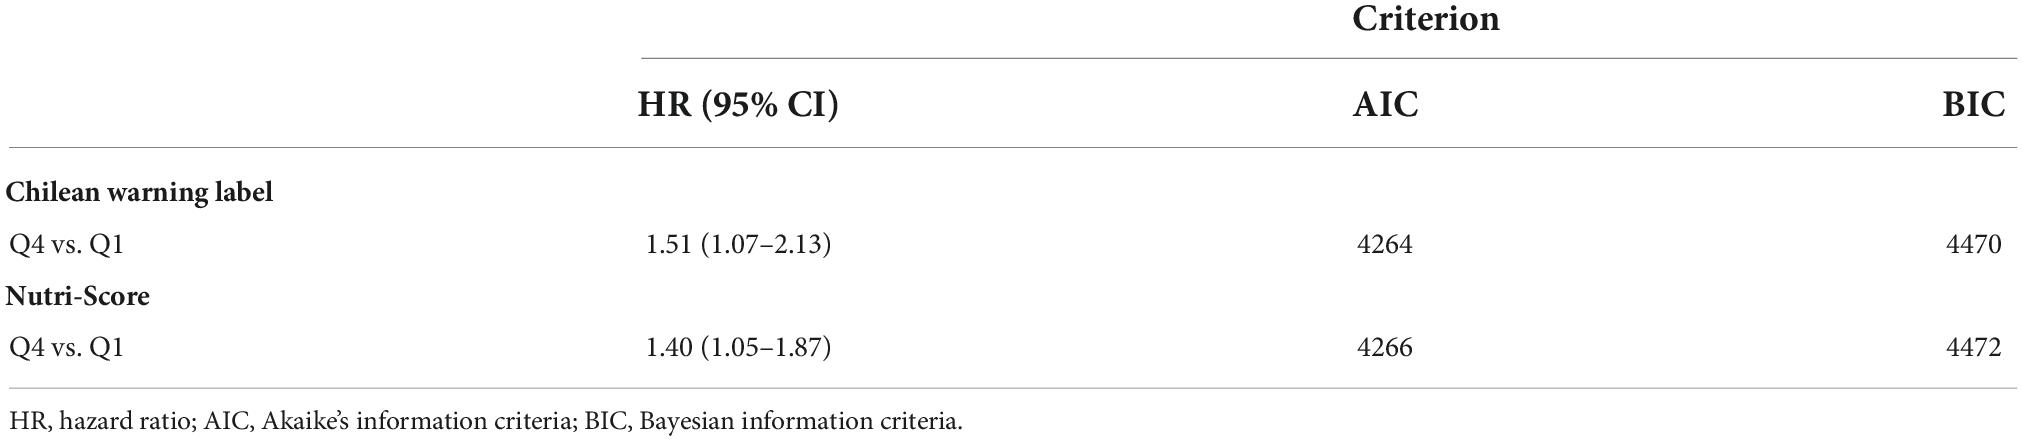
Table 4. Comparison of AIC and BIC values for the warning label score and Nutri-Score in relation to all-cause mortality.
The results of the present study provide new insights into the association between the nutrient profile underpinning the warning label score and mortality in a large prospective Spanish cohort. To our knowledge, this is the first study that suggests that higher consumption of foods with warning labels (>9.8/day) (poorer nutritional quality), indicating a lower healthiness, is significantly associated with the risk of all-cause and cancer mortality. These findings add to previous studies evaluating the relationship between the Nutri-Score FoP label and health outcomes in other prospective cohorts, including the SUN project. Gómez-Donoso et al. showed that higher FSAm-NPS (nutritional algorithm underpinning the Nutri-Score) characterised by a lower diet quality was associated with a higher risk of all-cause mortality [HR highest vs. lowest quartile (95% CI): 1.82 (1.34–2.47); p-trend < 0.001] and cancer mortality [HR highest vs. lowest quartile (95% CI): 2.44 (1.54–3.85); p-trend < 0.001] in the SUN cohort (6). Moreover, some studies of the European Prospective Investigation into Cancer and Nutrition (EPIC) cohort study have shown an association between a higher FSAm-NPS intake and a higher risk of cancer and higher rates of mortality overall and from cancer and diseases of the circulatory, respiratory, and digestive systems (12, 13).
A modelling study predicted the effect of warning labels on obesity reduction in Mexico 5 years after implementation (37). Investigators estimated a caloric reduction of an average of 36.8 kcal/person/day from beverages and snacks, which could reduce obesity rates by 14.7% (37). These results are relevant considering that obesity is recognized as a major risk factor for several cancers, CVDs, and premature death (38, 39). Our findings did not show a significant association between the nutrient profile of warning labels and CVD mortality, one possible explanation for this finding may be the lack of statistical power to detect any significant association in CVD mortality due to the low number of cases of CVD deaths. In addition, in the sensitivity analysis excluding participants with CVD at baseline, the statistical significance between warning label score and total mortality was weaker probably because the number of total deaths decreased. However, an increased intake of UPF was related to a higher warning label score. This result might be explained by the fact that the nutrient profile of the warning labels takes into account critical nutrients and energy content, a nutritional composition dimension closely related to the UPF. Bonaccio et al. reported that higher intake of UPF was directly associated with CVD mortality (highest vs. lowest quartile: 1.58; 95% CI: 1.23–2.03) and death from ischemic heart disease/cerebrovascular disease (highest vs. lowest quartile: 1.52; 95% CI: 1.10–2.09) among participants from Italy with a mean age of 55 years (40). It has to be mentioned that UPF are industrially manufactured ready-to-eat or heat foods that usually use industrial processes, modification of the food matrix, and food additives, leading to the production of several components closely related to CVD (41). Previous studies in the SUN cohort showed that the highest intake of UPF was associated with an increased risk of all-cause mortality (5) (HR: 1.62; 95% CI: 1.13–2.33) and obesity (42) (HR: 1.26; 95% CI: 1.10, 1.45) compared to the lowest intake of UPF. Also, our analyses showed that participants who had increased intake of UPF (≥4 servings/d) and warning label score (≥5.5) presented an HR of 1.66 (95% CI: 1.21–2.26) for overall mortality. Possible mechanisms are hypothesized to include disrupted renal sodium homeostasis, metabolic and hemodynamic modifications, alteration of the gut microbiota, glycaemic response and insulin sensitivity, and so on (41). Regulatory policies are needed to mitigate the impact of UPF on NCDs, depression, all-cause mortality, and other diseases (43).
The existing scientific evidence has consistently shown that foods with low diet quality, as estimated by FoP nutrition labelling systems, are closely related to the increased risk of NCDs and deaths (6, 12–15, 44). In this sense, it is noteworthy to mention that the warning label score and Nutri-Score have AIC and BIC values close to each other, indicating that the nutrient profiles of these FoP systems have similar power to predict mortality in our sample. Caution is needed in interpreting this result, considering that the scores at the individual level could vary across populations (e.g., different dietary patterns), but our results at least suggest that the nutrient profile and thresholds of warning label and Nutri-Score could highlight less healthy food products. In addition, individuals with warning labels and Nutri-Score values above median (combined exposures) exhibited a 51% increased risk of all-cause mortality. These FoP labels differ in the type of information provided (nutrient-specific or summary) and label format, and both are calculated per 100 g/ml of product (7). The Nutri-Score is a colour-coded graded scale ranging from higher (dark green) to lower nutritional (dark orange) quality based on five letters (from A to E) (7). Meanwhile, the warning systems focus on excessive amounts of “critical nutrients” (7, 10). The Nutri-Score is the FoP system most used in Europe. Egnell et al. evaluated five nutrition labelling systems across 12 countries and showed that the Nutri-Score has better performance to rank products considering their nutritional quality followed by the Multiple Traffic Lights, Health Star Rating system, Warning symbol, and the Reference Intakes (45). However, other studies indicated differences in consumers’ understanding across diverse FoP nutrition label schemes (29, 45–47). It is also important to mention that consumers’ preferences and perceptions could vary among countries, depending on cultural behaviour (11). Previous studies have reported that consumers with the highest income, education levels, and nutrition knowledge tend to have higher levels of awareness, which influenced their capability to use FoP nutrition labels (11). On the other hand, it is increasingly recognized that the warning label system is related to a decrease in purchases of packed products higher in calories and nutrients of concern (10, 46, 48, 49). These FoP warning labels have been increasingly adopted in Latin American countries such as Chile, Ecuador, Mexico, Peru, and Uruguay (7, 10). Studies conducted in Chile show that there has been a decrease in products that need the warning labels “high in sodium” and “high in sugar,” suggesting the tendency of food reformulation by the food industry (50).
Non-communicable diseases have rapidly risen around the world with a negative impact on burden diseases and premature deaths, leading to disproportions in low- and middle-income countries, which constitutes a public health challenge (51). The global tendency exhibits an increased volume and market of fast food and highly processed products in parallel with obesity rates (52). The FoP nutrition labels are part of a set of recommended policies aimed at reducing the global burden of diet-related NCDs by promoting market regulation, innovation-reformulation of packaged products, and fiscal measures (7, 8, 10, 52–54). There is no doubt that the implementation of FoP labelling has consistently proven to improve the ability to identify the healthfulness of food choices compared to no label (7, 8), suggesting that FoP labels play a pivotal role in improving the healthiness of food purchases and contribute to improving population diets.
The strengths of our study are the prospective and dynamic design, as well as the long follow-up and good retention rate (93%) of many participants from a Mediterranean country. Furthermore, the SUN cohort collects a wide range of potential confounders (sociodemographic and lifestyle data), and the analyses include the use of repeated measures of diet and the performance of exhaustive sensitivity analyses. Nevertheless, the present study has some limitations. First, the SUN cohort encompasses Spanish graduates who have high education levels. Thus, our sample is not representative of the general population, but this is an advantage in that the homogeneous university graduate cohort decreases the likelihood of misclassification bias. Second, the self-reported FFQ used for dietary data could be susceptible to misclassification. However, this FFQ has been previously validated in independent cohorts (22, 23, 55). Third, we could not evaluate specific food products that participants consumed (brand of the product and their variability in the nutrient content of the products inside each food item) or some features of manufactured products (e.g., level of processing) and unpackaged foods (e.g., homemade recipes rich in critical nutrients). Thus, it could have resulted in some misclassification of our exposures. Nonetheless, the FFQ used covered the main food groups of the usual dietary consumption of participants. Additionally, we used Spanish food composition tables, which enclosed representative values of main foods products consumed by the Spanish population. Last, although we included many potential confounders, the observational design can never completely rule out residual confounding bias.
A diet including foods with a higher score of warning labels (indicating a lower nutritional quality) was a good predictor of all-cause and cancer mortality in Spanish population. Also, the nutrient profiles of the warning label score and Nutri-Score have a similar power of prediction. Therefore, our results reinforce the suitability of FoP warning labels as a key policy action to improve health status and prevent NCDs.
As a policy response to prevent NCDs, governments should implement FoP nutrition labelling to enable consumers to make healthier food choices and encourage the food industry to reformulate products to be healthier. The FoP warning label is used in many countries (7, 10), showing positive effects on consumer’s choice, and from these results also finding a direct effect with better health. However, future research should be aimed at evaluating the consumption of foods with higher warning labels and NCDs in other ethnicities.
The raw data supporting the conclusions of this article will be made available by the authors, without undue reservation.
VB-V, MB-R, CS-O, and MAM-G: conceptualization, methodology, and formal analysis. VB-V: writing—original data. All authors interpretation of data, writing—review and editing, read, and agreed to the published version of the manuscript.
MAM-G was supported by Advanced Research Grant of the European Research Council (Agreement 340918). The SUN Project has received funding from the Spanish Government-Instituto de Salud Carlos III, the European Regional Development Fund (FEDER) (RD 06/0045, CIBER-OBN, Grants PI10/02658, PI10/02293, PI13/00615, PI14/01668, PI14/01798, PI14/01764, PI17/01795, PI20/00564, and G03/140), the Navarra Regional Government (27/2011, 45/2011, and 122/2014), the National Plan on Drugs (2020/021), and the University of Navarra.
We thank other members of the SUN group: Aguilera-Buenosvinos I., Alonso A., Álvarez-Álvarez I., Balaguer A., Barbagallo M., Barbería M., Barrientos I., Barrio-López M. T., Basterra-Gortari F. J., Battezzati A., Bazal P., Benito S., Bertoli S., Bes-Rastrollo M., Beulen Y., Beunza J. J., Buil-Cosiales P., Bullón-Vela V., Canales M., Carmona L., Cervantes S., Cristobo C., de Irala J., de la Fuente-Arrillaga C., de la O. V., de la Rosa P. A., Delgado-Rodríguez M., Díaz-Gutiérrez J., Díez Espino J., Domínguez L., Donat-Vargas C., Donazar M., Eguaras S., Fernández-Montero A., Fresán U., Galbete C., García-Arellano A., García López M., Gardeazábal I., Gutiérrez-Bedmar M., Gomes-Domingos A. L., Gómez-Donoso C., Gómez-Gracia E., Goñi E., Goñi L., Guillén F., Henn M., Henríquez P., Hernández A., Hershey M. S., Hidalgo-Santamaría M., Hu E., Lacarra C., Lahortiga F., Leone A., Llorca J., López del Burgo C., Marí A., Marques I., Martí A., Martín Calvo N., Martín-Moreno J. M., Martínez J. A., Martínez-Lapiscina E. H., Mendonça R., Menéndez C., Molendijk M., Molero P., Murphy K., Muñoz M., Núñez Córdoba J. M., Pajares R., Pano O., Papadaki A., Parletta N., Pérez-Araluce R., Pérez de Ciriza P., Pérez Cornago A., Pérez de Rojas J., Pimenta A. M., Pons J., Ramallal R., Razquin C., Rico-Campà A., Romanos-Nanclares A., Ruano C., Ruiz L., Ruiz-Canela M., Ruiz Zambrana A., Salgado E., San Julián B., Sánchez D., Sánchez-Bayona R., Sánchez-Tainta A., Sánchez-Villegas A., Santiago S., Sayón-Orea C., Schlatter J., Serrano-Martinez M., Toledo E., Toledo J., Tortosa A., Valencia F., Vázquez Z., Zarnowiecki D., and Zazpe I. We thank very specially all participants in the SUN cohort for their long-standing and enthusiastic collaboration and our advisors from Harvard TH Chan School of Public Health—Walter Willett, Alberto Ascherio, Frank B. Hu, and Meir J. Stampfer who helped us to design the SUN Project.
The authors declare that the research was conducted in the absence of any commercial or financial relationships that could be construed as a potential conflict of interest.
All claims expressed in this article are solely those of the authors and do not necessarily represent those of their affiliated organizations, or those of the publisher, the editors and the reviewers. Any product that may be evaluated in this article, or claim that may be made by its manufacturer, is not guaranteed or endorsed by the publisher.
The Supplementary Material for this article can be found online at: https://www.frontiersin.org/articles/10.3389/fnut.2022.951738/full#supplementary-material
1. World Health Organization. Noncommunicable Diseases. (2022). Available online at: https://www.who.int/news-room/fact-sheets/detail/noncommunicable-diseases (accessed January 24, 2022).
2. Afshin A, Sur PJ, Fay KA, Cornaby L, Ferrara G, Salama JS, et al. Health effects of dietary risks in 195 countries, 1990–2017: a systematic analysis for the global burden of disease study 2017. Lancet. (2019) 393:1958–72. doi: 10.1016/S0140-6736(19)30041-8
3. Ma Y, He FJ, Sun Q, Yuan C, Kieneker LM, Curhan GC, et al. 24-hour urinary sodium and potassium excretion and cardiovascular risk. N Engl J Med. (2022) 386:252–63. doi: 10.1056/NEJMoa2109794
4. Monteiro CA, Cannon G, Lawrence M, Laura Da Costa Louzada M, Machado PP. Ultra-Processed Foods, Diet Quality, and Health Using the NOVA Classification System. Rome: FAO (2019). p. 48
5. Rico-Campà A, Martínez-González MA, Alvarez-Alvarez I, Mendonça R, de la Fuente-Arrillaga C, Gómez-Donoso C, et al. Association between consumption of ultra-processed foods and all cause mortality: SUN prospective cohort study. BMJ. (2019) 365:l1949. doi: 10.1136/bmj.l1949
6. Gómez-Donoso C, Martínez-González MÁ, Perez-Cornago A, Sayón-Orea C, Martínez JA, Bes-Rastrollo M. Association between the nutrient profile system underpinning the nutri-score front-of-pack nutrition label and mortality in the SUN project: a prospective cohort study. Clin Nutr. (2021) 40:1085–94. doi: 10.1016/j.clnu.2020.07.008
7. Jones A, Neal B, Reeve B, Ni Mhurchu C, Thow AM. Front-of-pack nutrition labelling to promote healthier diets: current practice and opportunities to strengthen regulation worldwide. BMJ Glob Health. (2019) 4:e001882. doi: 10.1136/bmjgh-2019-001882
8. Labonté M-È, Poon T, Gladanac B, Ahmed M, Franco-Arellano B, Rayner M, et al. Nutrient profile models with applications in government-led nutrition policies aimed at health promotion and noncommunicable disease prevention: a systematic review. Adv Nutr. (2018) 9:741–88. doi: 10.1093/advances/nmy045
9. Corvalán C, Reyes M, Garmendia ML, Uauy R. Structural responses to the obesity and non-communicable diseases epidemic: update on the Chilean law of food labelling and advertising. Obes Rev. (2019) 20:367–74. doi: 10.1111/obr.12802
10. Pan American Health Organization. Front-of-Package Warning Labeling (FOPWL) in the Caribbean. (2022). Available online at: https://www.paho.org/en/front-package-warning-labeling-fopwl-caribbean (accessed February 7, 2022).
11. Delhomme V. Front-of-pack nutrition labelling in the European union: a behavioural, legal and political analysis. Eur J Risk Regul. (2021) 12:825–48. doi: 10.1017/err.2021.5
12. Deschasaux M, Huybrechts I, Julia C, Hercberg S, Egnell M, Srour B, et al. Association between nutritional profiles of foods underlying nutri-score front-of-pack labels and mortality: EPIC cohort study in 10 European countries. BMJ. (2020) 370:m3173. doi: 10.1136/bmj.m3173
13. Deschasaux M, Huybrechts I, Murphy N, Julia C, Hercberg S, Srour B, et al. Nutritional quality of food as represented by the FSAm-NPS nutrient profiling system underlying the nutri-score label and cancer risk in Europe: results from the EPIC prospective cohort study. PLoS Med. (2018) 15:e1002651. doi: 10.1371/journal.pmed.1002651
14. Adriouch S, Julia C, Kesse-Guyot E, Ducrot P, Péneau S, Méjean C, et al. Association between a dietary quality index based on the food standard agency nutrient profiling system and cardiovascular disease risk among French adults. Int J Cardiol. (2017) 234:22–7. doi: 10.1016/j.ijcard.2017.02.092
15. Adriouch S, Julia C, Kesse-Guyot E, Méjean C, Ducrot P, Péneau S, et al. Prospective association between a dietary quality index based on a nutrient profiling system and cardiovascular disease risk. Eur J Prev Cardiol. (2016) 23:1669–76. doi: 10.1177/2047487316640659
16. Julia C, Ducrot P, Lassale C, Fézeu L, Méjean C, Péneau S, et al. Prospective associations between a dietary index based on the British food standard agency nutrient profiling system and 13-year weight gain in the SU.VI.MAX cohort. Prev Med (Baltim). (2015) 81:189–94. doi: 10.1016/j.ypmed.2015.08.022
17. Martínez-González MA, Sánchez-Villegas A, De Irala J, Marti A, Martínez JA. Mediterranean diet and stroke: objectives and design of the SUN project. Nutr Neurosci. (2002) 5:65–73. doi: 10.1080/10284150290007047
18. Martínez-Gonzá Lez MA, López-Fontana C, Varo JJ, Sánchez-Villegas A, Martinez JA. Validation of the Spanish version of the physical activity questionnaire used in the nurses’ health study and the health professionals’ follow-up study. Public Health Nutr. (2005) 8:920–7. doi: 10.1079/PHN2005745
19. Bes-Rastrollo M, Pérez Valdivieso JR, Sánchez-Villegas A, Alonso Á, Martínez-González MÁ. Validación del peso e índice de masa corporal auto-declarados de los participantes de una cohorte de graduados universitarios. Rev Esp Obes. (2005) 3:352–8.
20. Alonso A, Beunza JJ, Delgado-Rodríguez M, Martínez-González MA. Validation of self reported diagnosis of hypertension in a cohort of university graduates in Spain. BMC Public Health. (2005) 5:94. doi: 10.1186/1471-2458-5-94
21. Sanchez-Villegas A, Schlatter J, Ortuno F, Lahortiga F, Pla J, Benito S, et al. Validity of a self-reported diagnosis of depression among participants in a cohort study using the structured clinical interview for DSM-IV (SCID-I). BMC Psychiatry. (2008) 8:43. doi: 10.1186/1471-244X-8-43
22. Martin-Moreno JM, Boyle P, Gorgojo L, Maisonneuve P, Fernandez-Rodriguez JC, Salvini S, et al. Development and validation of a food frequency questionnaire in Spain. Int J Epidemiol. (1993) 22:512–9. doi: 10.1093/ije/22.3.512
23. de la Fuente-Arrillaga C, Vázquez Ruiz Z, Bes-Rastrollo M, Sampson L, Martinez-González MA. Reproducibility of an FFQ validated in Spain. Public Health Nutr. (2010) 13:1364–72. doi: 10.1017/S1368980009993065
24. Moreiras O, Carbajal A, Cabrera LCC. Tabla de Composición de Alimentos [Food CompositionTables]. 17th ed. Madrid: Ediciones Pirámide (2015).
25. Mataix Verdú J. Tabla de Composición de Alimentos [Food Composition Tables]. 5th ed. Granada: Instituto de Nutrición y Tecnología de los Alimentos (2009).
26. Trichopoulou A, Costacou T, Bamia C, Trichopoulos D. Adherence to a mediterranean diet and survival in a Greek population. N Engl J Med. (2003) 348:2599–608. doi: 10.1056/nejmoa025039
27. Trichopoulou A, Bamia C, Trichopoulos D. Anatomy of health effects of mediterranean diet: Greek EPIC prospective cohort study. BMJ. (2009) 338:b2337. doi: 10.1136/bmj.b2337
28. Reyes M, Garmendia ML, Olivares S, Aqueveque C, Zacarías I, Corvalán C. Development of the Chilean front-of-package food warning label. BMC Public Health. (2019) 19:906. doi: 10.1186/s12889-019-7118-1
29. Arrúa A, Machín L, Curutchet MR, Martínez J, Antúnez L, Alcaire F, et al. Warnings as a directive front-of-pack nutrition labelling scheme: comparison with the guideline daily amount and traffic-light systems. Public Health Nutr. (2017) 20:2308–17. doi: 10.1017/S1368980017000866
30. Pan American Health Organization. Pan American Health Organization Nutrient Profile Model. (Vol. 18). Washington, DC: PAHO (2016). p. 20
31. Julia C, Kesse-Guyot E, Touvier M, Méjean C, Fezeu L, Hercberg S. Application of the British food standards agency nutrient profiling system in a French food composition database. Br J Nutr. (2014) 112:1699–705. doi: 10.1017/S0007114514002761
32. Santé Publique France. Nutri-Score. (2022). Available online at: https://www.santepubliquefrance.fr/determinants-de-sante/nutrition-et-activite-physique/articles/nutri-score (accessed August 1, 2022).
33. Julia C, Touvier M, Méjean C, Ducrot P, Péneau S, Hercberg S, et al. Development and validation of an individual dietary index based on the British food standard agency nutrient profiling system in a French context. J Nutr. (2014) 144:2009–17. doi: 10.3945/JN.114.199679
34. Deschasaux M, Julia C, Kesse-Guyot E, Lécuyer L, Adriouch S, Méjean C, et al. Are self-reported unhealthy food choices associated with an increased risk of breast cancer? Prospective cohort study using the British food standards agency nutrient profiling system. BMJ Open. (2017) 7:e013718. doi: 10.1136/BMJOPEN-2016-013718
35. Donnenfeld M, Julia C, Kesse-Guyot E, Méjean C, Ducrot P, Péneau S, et al. Prospective association between cancer risk and an individual dietary index based on the British food standards agency nutrient profiling system. Br J Nutr. (2015) 114:1702–10. doi: 10.1017/S0007114515003384
37. Basto-Abreu A, Torres-Alvarez R, Reyes-Sánchez F, González-Morales R, Canto-Osorio F, Colchero MA, et al. Predicting obesity reduction after implementing warning labels in Mexico: a modeling study. PLoS Med. (2020) 17:e1003221. doi: 10.1371/journal.pmed.1003221
38. Tobias DK, Hu FB. The association between BMI and mortality: implications for obesity prevention. Lancet Diabetes Endocrinol. (2018) 6:916–7. doi: 10.1016/S2213-8587(18)30309-7
39. World Cancer Research Fund International, American Institute for Cancer Research. Continuous Update Project Expert Report 2018. London: World Cancer Research Fund International (2022).
40. Bonaccio M, Di Castelnuovo A, Costanzo S, De Curtis A, Persichillo M, Sofi F, et al. Ultra-processed food consumption is associated with increased risk of all-cause and cardiovascular mortality in the Moli-sani Study. Am J Clin Nutr. (2021) 113:446–55. doi: 10.1093/ajcn/nqaa299
41. Juul F, Vaidean G, Parekh N. Ultra-processed foods and cardiovascular diseases: potential mechanisms of action. Adv Nutr. (2021) 12:1673. doi: 10.1093/ADVANCES/NMAB049
42. De Deus Mendonça R, Pimenta AM, Gea A, De La Fuente-Arrillaga C, Martinez-Gonzalez MA, Lopes ACS, et al. Ultraprocessed food consumption and risk of overweight and obesity: the university of Navarra follow-up (SUN) cohort study. Am J Clin Nutr. (2016) 104:1433–40. doi: 10.3945/AJCN.116.135004
43. Pagliai G, Dinu M, Madarena MP, Bonaccio M, Iacoviello L, Sofi F. Consumption of ultra-processed foods and health status: a systematic review and meta-analysis. Br J Nutr. (2021) 125:308–18. doi: 10.1017/S0007114520002688
44. Julia C, Fézeu LK, Ducrot P, Méjean C, Peneau S, Touvier M, et al. The nutrient profile of foods consumed using the British food standards agency nutrient profiling system is associated with metabolic syndrome in the SU.VI.MAX Cohort. J Nutr. (2015) 145:2355–61. doi: 10.3945/JN.115.213629
45. Egnell M, Talati Z, Hercberg S, Pettigrew S, Julia C. Objective understanding of front-of-package nutrition labels: an international comparative experimental study across 12 countries. Nutrients. (2018) 10:1542. doi: 10.3390/NU10101542
46. Machín L, Curutchet MR, Giménez A, Aschemann-Witzel J, Ares G. Do nutritional warnings do their work? Results from a choice experiment involving snack products. Food Qual Prefer. (2019) 77:159–65. doi: 10.1016/j.foodqual.2019.05.012
47. Khandpur N, de Morais Sato P, Mais LA, Bortoletto Martins A, Spinillo CG, Garcia MT, et al. Are front-of-package warning labels more effective at communicating nutrition information than traffic-light labels? A randomized controlled experiment in a Brazilian sample. Nutrients. (2018) 10:688. doi: 10.3390/nu10060688
48. Taillie LS, Bercholz M, Popkin B, Reyes M, Colchero MA, Corvalán C. Changes in food purchases after the chilean policies on food labelling, marketing, and sales in schools: a before and after study. Lancet Planet Health. (2021) 5:e526–33. doi: 10.1016/S2542-5196(21)00172-8
49. White M, Barquera S. Mexico adopts food warning labels, why now? Health Syst Reform. (2020) 6:e1752063. doi: 10.1080/23288604.2020.1752063
50. Reyes M, Smith Taillie L, Popkin B, Kanter R, Vandevijvere S, Corvalán C. Changes in the amount of nutrient of packaged foods and beverages after the initial implementation of the chilean law of food labelling and advertising: a nonexperimental prospective study. PLoS Med. (2020) 17:e1003220.
51. Buse K, Aftab W, Akhter S, Phuong LB, Chemli H, Dahal M, et al. The state of diet-related NCD policies in Afghanistan, Bangladesh, Nepal, Pakistan, Tunisia and Vietnam: a comparative assessment that introduces a ‘policy cube’ approach. Health Policy Plan. (2020) 35:503–21. doi: 10.1093/heapol/czz175
52. Pan American Health Organization, World Health Organization. Ultra-Processed Food and Drink Products in Latin America: trends, Impact on Obesity, Policy Implications. Washington, DC: PAHO (2015).
53. Monteiro CA, Moubarac J-C, Cannon G, Ng SW, Popkin B. Ultra-processed products are becoming dominant in the global food system. Obes Rev. (2013) 14 Suppl 2:21–8. doi: 10.1111/obr.12107
54. Bank W. Taxes on Sugar-Sweetened Beverages: international Evidence and Experiences. Washington, DC: World Bank (2020).
Keywords: all-cause mortality, cancer, CVD, front-of-pack nutrition labels, warning label, Nutri-Score
Citation: Bullón-Vela V, Sayón-Orea C, Gómez-Donoso C, Martínez JA, Martínez-González MA and Bes-Rastrollo M (2022) Mortality prediction of the nutrient profile of the Chilean front-of-pack warning labels: Results from the Seguimiento Universidad de Navarra prospective cohort study. Front. Nutr. 9:951738. doi: 10.3389/fnut.2022.951738
Received: 24 May 2022; Accepted: 03 October 2022;
Published: 21 October 2022.
Edited by:
Daniela Martini, University of Milan, ItalyReviewed by:
Maha Hoteit, Lebanese University, LebanonCopyright © 2022 Bullón-Vela, Sayón-Orea, Gómez-Donoso, Martínez, Martínez-González and Bes-Rastrollo. This is an open-access article distributed under the terms of the Creative Commons Attribution License (CC BY). The use, distribution or reproduction in other forums is permitted, provided the original author(s) and the copyright owner(s) are credited and that the original publication in this journal is cited, in accordance with accepted academic practice. No use, distribution or reproduction is permitted which does not comply with these terms.
*Correspondence: Maira Bes-Rastrollo, bWJlc0B1bmF2LmVz
Disclaimer: All claims expressed in this article are solely those of the authors and do not necessarily represent those of their affiliated organizations, or those of the publisher, the editors and the reviewers. Any product that may be evaluated in this article or claim that may be made by its manufacturer is not guaranteed or endorsed by the publisher.
Research integrity at Frontiers
Learn more about the work of our research integrity team to safeguard the quality of each article we publish.