 James Ntambara†
 Minjie Chu
- Department of Epidemiology, School of Public Health, Nantong University, Nantong, Jiangsu, China
Background: Although some studies have highlighted short birth interval as a risk factor for adverse child nutrition outcomes, the question of whether and to what extent long birth interval affects better nutritional outcomes in children remains unclear.
Methods: In this quantitative meta-analysis, we evaluate the relationship between different birth interval groups and child nutrition outcomes, including underweight, wasting, and stunting.
Results: Forty-six studies with a total of 898,860 children were included in the study. Compared with a short birth interval of <24 months, birth interval of ≥24 months and risk of being underweight showed a U-shape that the optimum birth interval group of 36–48 months yielded the most protective effect (OR = 0.54, 95% CI = 0.32–0.89). Moreover, a birth interval of ≥24 months was significantly associated with decreased risk of stunting (OR = 0.61, 95% CI = 0.55–0.67) and wasting (OR = 0.63, 95%CI = 0.50–0.79) when compared with the birth interval of <24 months.
Conclusion: The findings of this study show that longer birth intervals (≥24 months) are significantly associated with decreased risk of childhood undernutrition and that an optimum birth interval of 36–48 months might be appropriate to reduce the prevalence of poor nutritional outcomes in children, especially underweight. This information would be useful to government policymakers and development partners in maternal and child health programs, especially those involved in family planning and childhood nutritional programs.
Introduction
Despite significant progress in reducing child mortality attributed to undernutrition, childhood undernutrition remains a major public health concern in developing countries. Undernutrition is most often measured by anthropometry and evaluated in terms of underweight, stunting, and wasting (1). These undernutrition indices are classified according to the World Health Organization (WHO) classification using child growth standard medians in terms of standard deviations (SDs) (2). Weight-for-age, height-for-age, and weight-for-height provide different information about the cognitive growth and body composition of children. Stunting (low height-for-age) captures early chronic exposure to undernutrition, wasting (low weight-for-height) captures acute undernutrition, and underweight (low weight-for-age) is a composite indicator that includes elements of stunting and wasting (3). Undernutrition, especially stunting, in the first 1,000 days of life, is associated with fewer neural connections in the brain, leading to poor cognitive development, and this damage is irreversible (4). Therefore, more attention should be paid to undernourished children to avoid the adverse health effects of this irreversible damage on their future growth and development.
The WHO 2025 global nutrition target is to reduce the prevalence of stunting by 40% and wasting to <5% (5). However, the progress toward childhood malnutrition in developing countries has been deplorably slow. Globally, malnutrition among children under 5 years of age is estimated to contribute to more than one-third of all deaths, although it is rarely listed as the direct cause (6). The United Nations Children's Fund (UNICEF), WHO, and the World Bank Group reports recently revealed that globally, stunting affected an estimated 21.3% or 144 million children under the age of 5 years, and wasting continued to threaten the lives of an estimated 6.9%, or 47 million children under 5 years (7). Africa and Asia have the greatest burden of childhood undernutrition and account for 55 and 39% of global cases of undernutrition, respectively. In addition, more than half of all stunted children under 5 years live in Asia, whereas more than one-third live in Africa. More than two-thirds and more than one-quarter of wasted under 5 years of age live in Asia and Africa (8).
Adequate nutrition is essential for the healthy growth and development of children. The consumption of nutrients by children begins long before birth. Undernutrition during pregnancy stunts fetal growth and can lead to poor brain development, resulting in irreversible damage (9). During the growth period, especially in the first 5 years of a child's life, undernutrition can cause serious effects, such as wasting and stunting (10). In addition, undernutrition also has a negative effect on children's social skills and psychological development, such that underweight and stunted children are more likely to exhibit apathy, fewer positive emotions, and more insecure attachments (11). These children will have more problems with behavior, attention, and social relationships during their school years compared with non-stunted children (12). The intellectual and psychological deficits caused by undernutrition can persist into adolescence, which can negatively affect the nation's gross domestic product (13, 14). As a result, it is necessary to identify the underlying risk factors associated with malnutrition, based on the adopted WHO malnutrition framework model, so that governments and stakeholders can implement evidence-based policy and provide practical guidelines to improve childhood nutrition status (2).
Various studies have identified that low dietary intake, low birth weight, higher birth order, low parental education level, exclusive breastfeeding more than 6 months of age, illnesses such as diarrhea, and sex of child (male) are contributing factors to childhood undernutrition (15–18). However, the birth interval or the time interval between successive live births is a risk factor that has received little attention. According to a recent study conducted in 34 sub-Saharan countries, short birth intervals (<24 months) are strongly associated with childhood undernutrition and a 57% higher risk of infant mortality (19). Separate studies and reviews have also identified that short birth intervals could adversely affect the nutritional status of the mother and the child (20–23). However, the question of whether and to what extent long birth interval has on better nutritional outcomes in children remains unclear. Therefore, the present study aimed to carry out an in-depth analysis to evaluate different birth interval groups and child nutrition outcomes, including underweight, wasting, and stunting.
Materials and methods
Literature search strategies
This is a meta-analysis study and follows the Preferred Reporting Items for Systematic Reviews and Meta-Analysis (PRISMA) Guideline to examine the pooled odds ratio of the birth interval and its association with child undernutrition. A comprehensive literature search of research studies published before 30 June 2022 was conducted. Different search engines including PubMed, Web of Science, Science Direct, Google scholar, and Cochrane library were methodically searched. We tried to search for studies in different languages, but only English articles appeared to have relevant data about birth intervals and undernutrition, so we only used a single language for the search.
A further computerized search was conducted using a combination of medical subject headings or keyword terms for birth interval and child undernutrition and was used separately in combination using Boolean operators such as “OR” or “AND.” Terms for birth intervals included birth interval, birth spacing, interpregnancy interval, interbirth interval, preceding birth interval, and subsequent birth interval, and for the child undernutrition, these terms were also used: undernutrition, malnutrition, nutrition status, nutrition outcomes, child growth, stunting, wasting, and underweight.
Inclusion and exclusion criteria
Studies included in this review had to meet the following criteria: “(1) cross-sectional, case–control, or cohort studies that evaluated the relationship between birth interval and any of the child undernutrition indicators, namely underweight, stunting, and wasting; and (2) original data were available. Studies were excluded if they were case series or reports, editorials, and reviews and if original data to calculate the association were unavailable.
Data extraction
Two authors independently extracted all necessary data. The full text of these potentially eligible studies was retrieved and assessed for eligibility by two review team members. Any discrepancies were resolved jointly. The data extraction format included the first author's name, publication year, country, region, sample size, study design, interval group, undernutrition indicators measured, and the quality score of each study.
Quality assessment
Two authors independently assessed the quality of the eligible studies and controlled for possible bias by adapting specific protocol/sample characteristics. The criteria proposed in the Newcastle–Ottawa Scale quality assessment tool were adapted and used to assess the quality of each study. Two authors independently assessed the quality of each original study using the tool. Discrepancies between the two authors were resolved jointly.
Statistical analysis
The effect size of the meta-analysis was an odds ratio of underweight, stunting, and wasting reported in each study about the birth interval applied, the pooled odds ratio with a confidence interval of underweight, stunting, and wasting, according to the birth intervals grouped into (<24 and ≥24) were estimated. When heterogeneity between studies was absent, we merged the results using fixed effect models. Otherwise, a random-effects model was chosen. Subgroup analyses were conducted for the studies according to regions and by considering the birth intervals, which were classified into 24–48 against <24 and ≥48 against <24 to determine the extent to which a certain birth interval used is considered a risk factor or protective according to the nutrition outcomes (underweight, stunting, and wasting). To determine the extent of publication bias, funnel plots were scattered and tested for asymmetry, and Begg's tests were computed. The analysis was performed using STATA version 15 statistical software (24).
Outcome definition
This study had three main outcomes; undernutrition was the main outcome and had three different indicators: underweight, stunting, and wasting. Each of the three indicators was measured independently according to WHO classification using child growth standard medians in terms of standard deviations (2). The first outcome was underweight, which was defined as a weight-for-age Z-score below minus two standard deviations (−2 SD) from the mean of the reference population. The second outcome was stunting, defined as a height-for-age Z-score of <-2 SD from the mean of the reference population. The third outcome was wasting, which was defined as a weight-for-height Z-score of <-2 SD from the mean of the reference population (25).
Results
Study selection
As shown in Figure 1, our literature search strategy identified 3,460 studies that were exported to the database; 3,352 studies were first excluded (996 of which were excluded because of duplication, 2,356 were excluded because the study type did not match, the population source was unclear, and the study population was not available), resulting in 108 studies with titles and abstracts screened for the relevance. Of these, 52 studies were removed because they used only univariate analysis or the type of literature was Editorials or Reviews. The remaining 56 relevant studies were evaluated, and 10 of them were excluded because of insufficient data on the relationship between birth spacing and child nutrition outcomes. Finally, 46 eligible studies were included in the analysis (1, 15, 19, 22, 23, 25–65). Regarding the child nutrition outcomes reported in the total 46 studies with data, 27 underweight data were reported, 23 stunting data were reported among all studies, and 13 wasting data were reported; seven studies reported all three undernutrition indicators in their result tables.
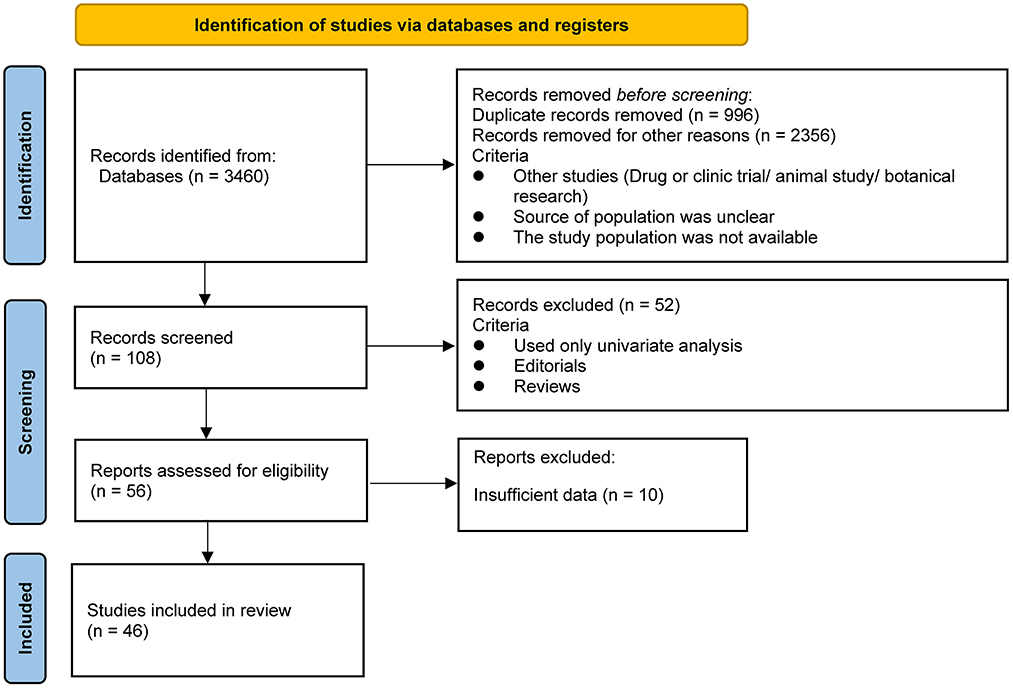
Figure 1. PRISMA flow diagram for the study selection process.
Description of included studies
As shown in Table 1, 46 studies involving 898,860 children were included to examine the relationship between birth interval and child nutrition outcomes. Most of the included studies were cross-sectional studies; 32 of the 46 studies were demographic health survey (DHS)-based cross-sectional studies. Concerning the study regions, 18 studies were conducted in Africa, 20 studies in Asia, and eight studies in others. The quality score among the 46 included studies ranged from 6 to 9.
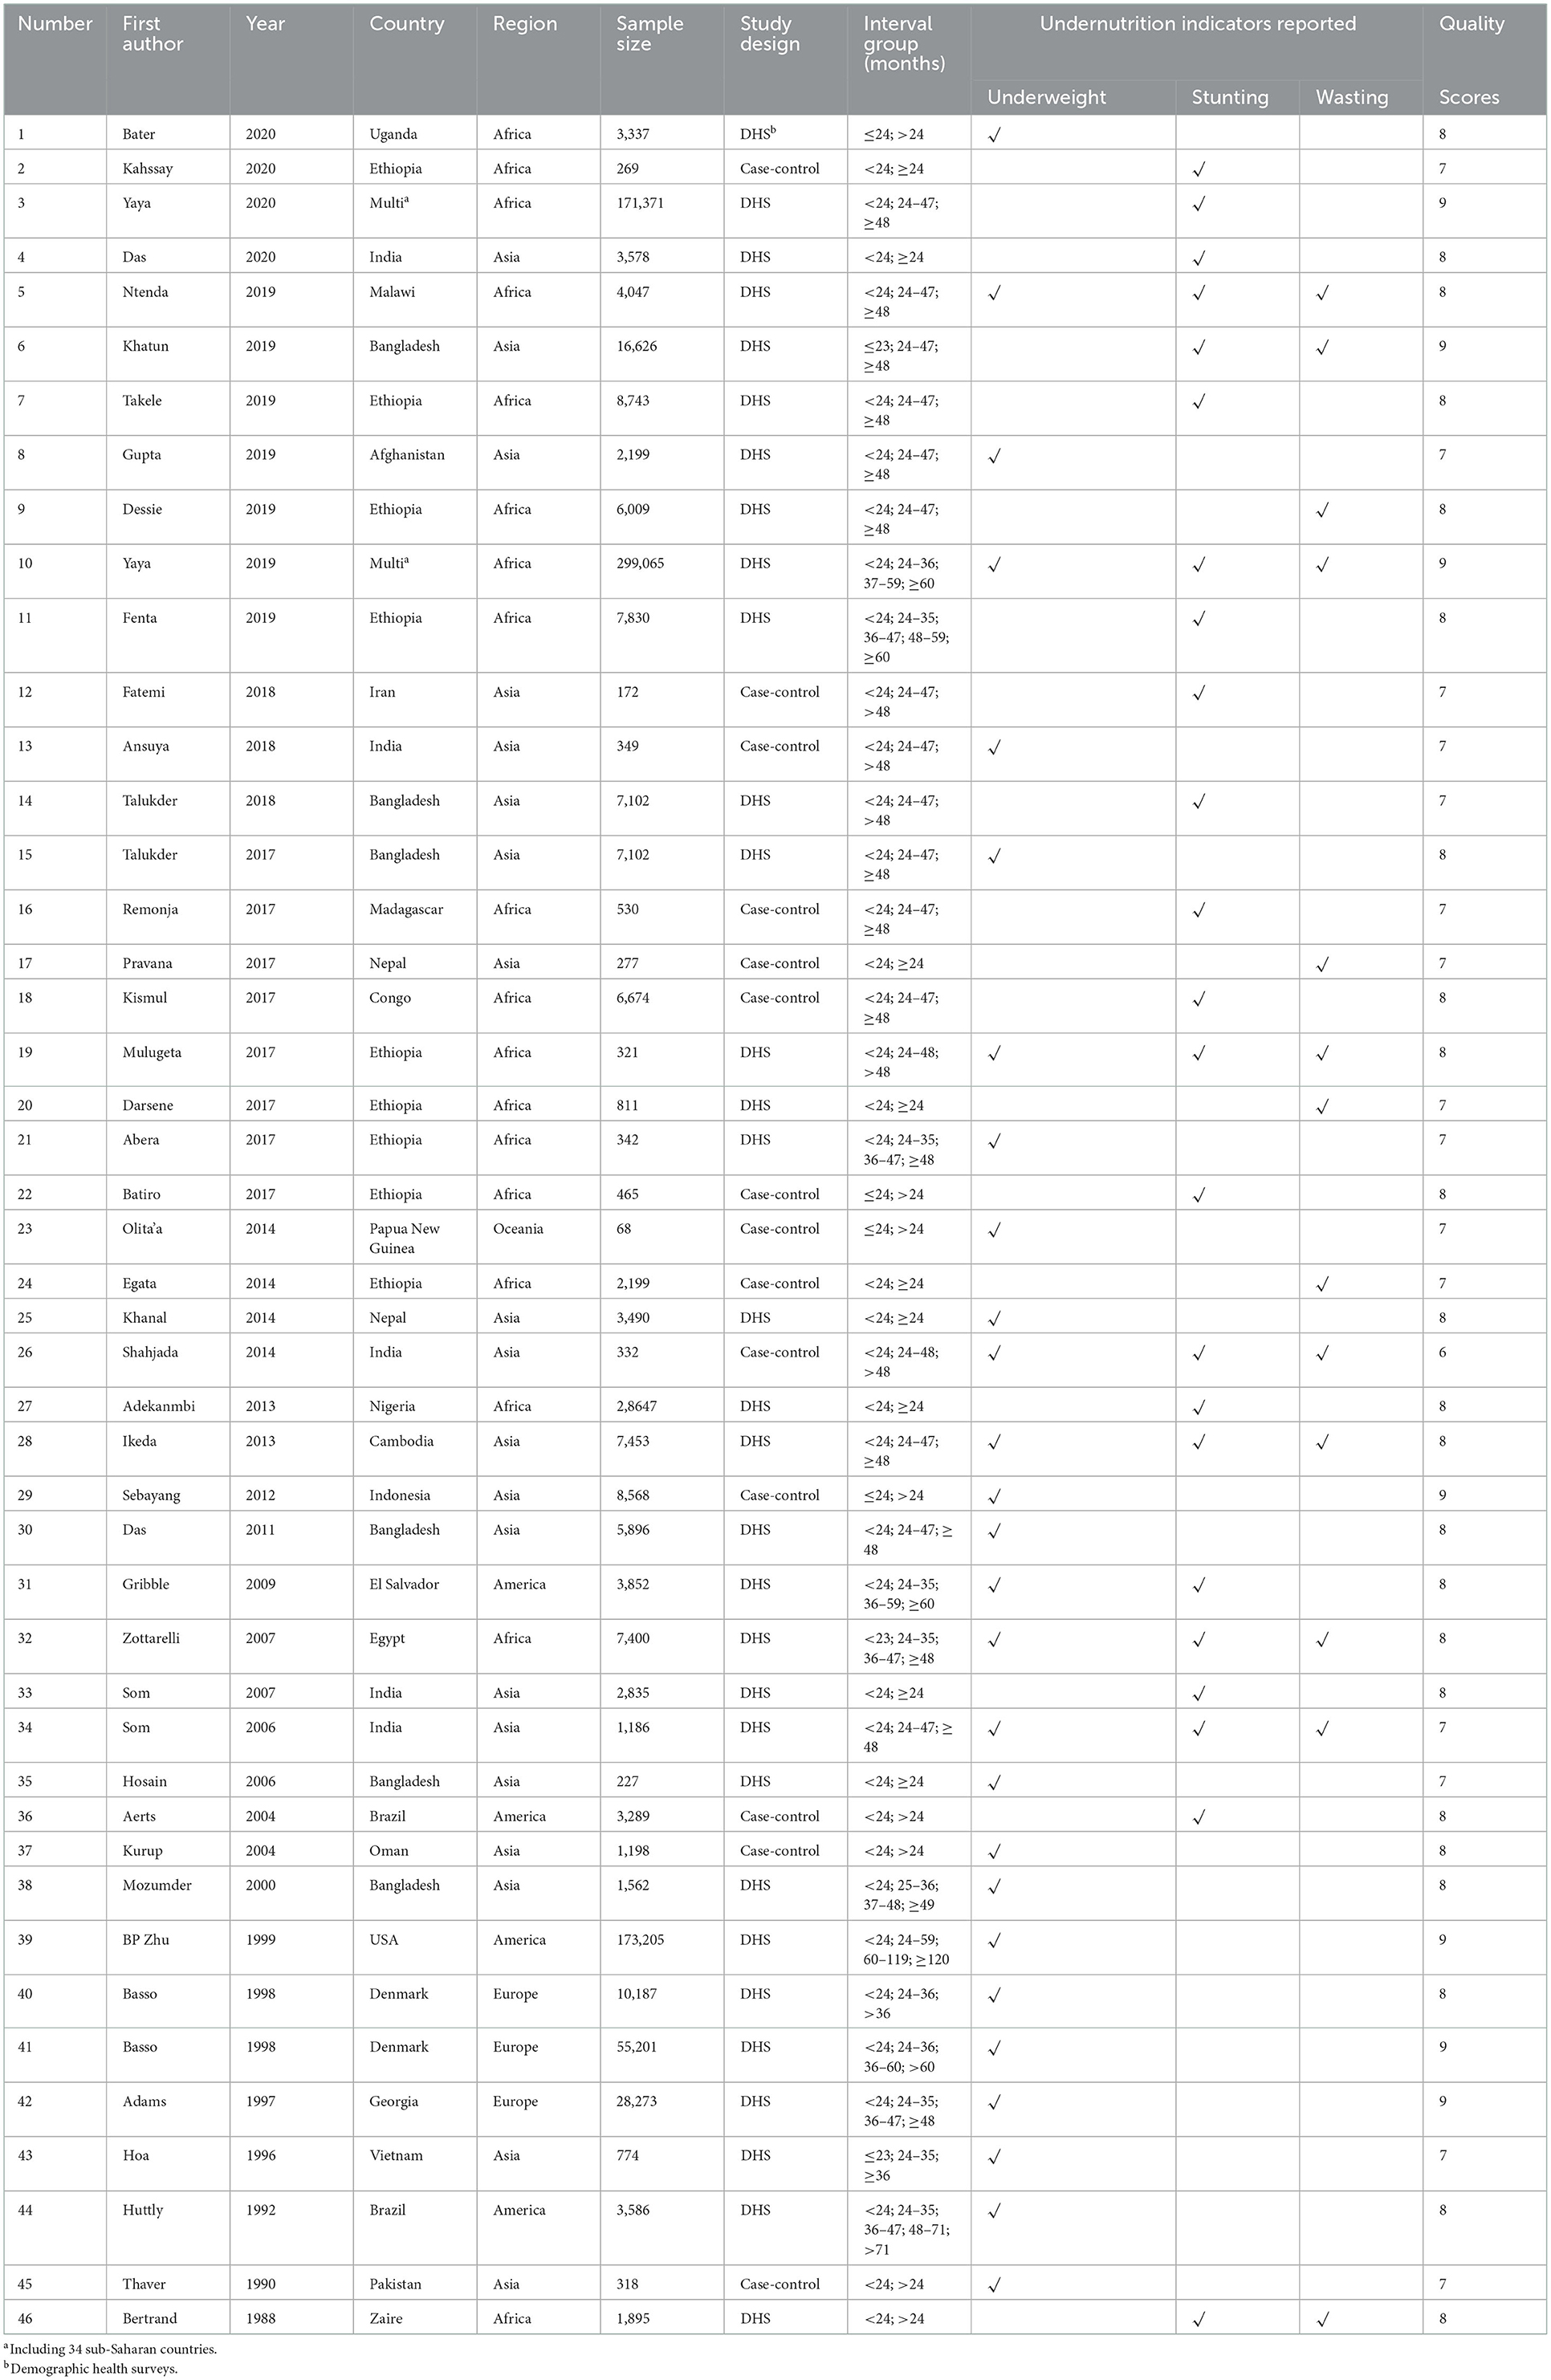
Table 1. Characteristics of literature included in the study.
Quantitative synthesis
As shown in Figure 2, compared with the birth interval of <24 months, the birth interval of ≥24 months was significantly associated with a decreased risk of being underweight (OR = 0.78, 95% CI = 0.72–0.85). Furthermore, when we further divided the birth intervals into subgroups, birth intervals and risk of being underweight showed a U-shape. As shown in Figures 2, 3, compared with the birth interval of <24 months group, the birth interval group of 24–36 months was significantly associated with a 22% decreased risk of being underweight (OR = 0.78, 95% CI = 0.67–0.91), while the group of 36–48 months was 46% more protective (OR = 0.54, 95% CI = 0.32–0.89). However, there was no protective effect in the group with a birth interval of ≥60 months when compared with the birth interval of <24 months (OR = 1.07, 95% CI = 0.83–1.38). Interestingly, in contrast, the birth interval group of ≥120 months was significantly associated with a 115% increased risk of being underweight when compared with the birth interval of <24 months (OR = 2.15, 95% CI = 1.89–2.44). Meanwhile, in the subgroup analysis based on regions (Figure 2), the protective effect was significant in Africans (OR = 0.53, 95% CI = 0.36–0.78) and Asians (OR = 0.80, 95% CI = 0.71–0.90).
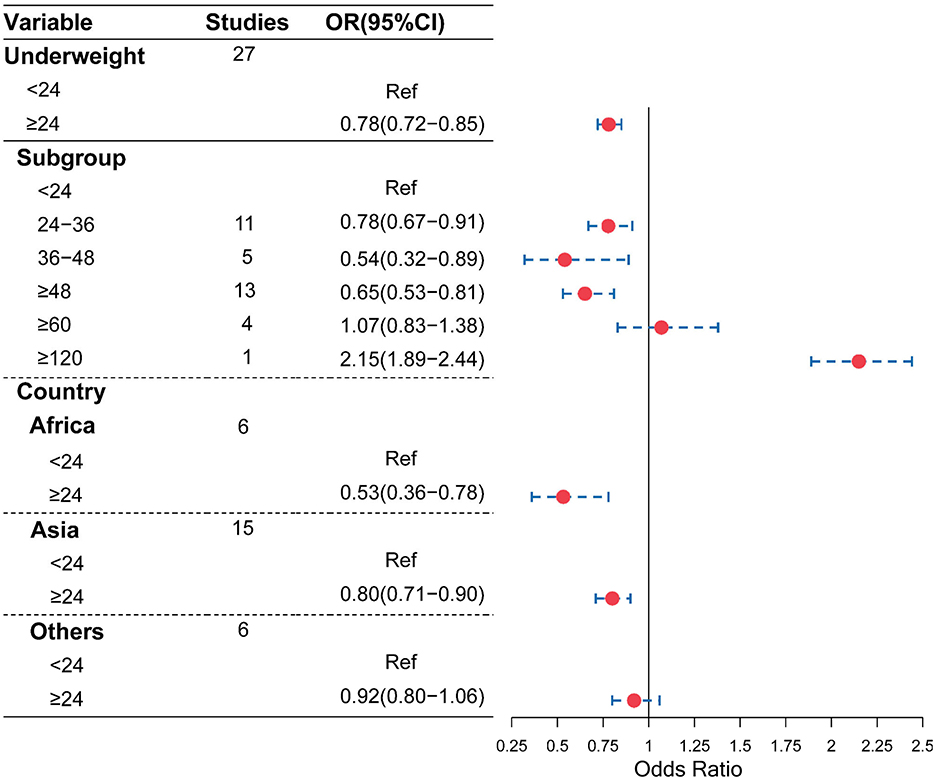
Figure 2. Association of the birth interval and child underweight.
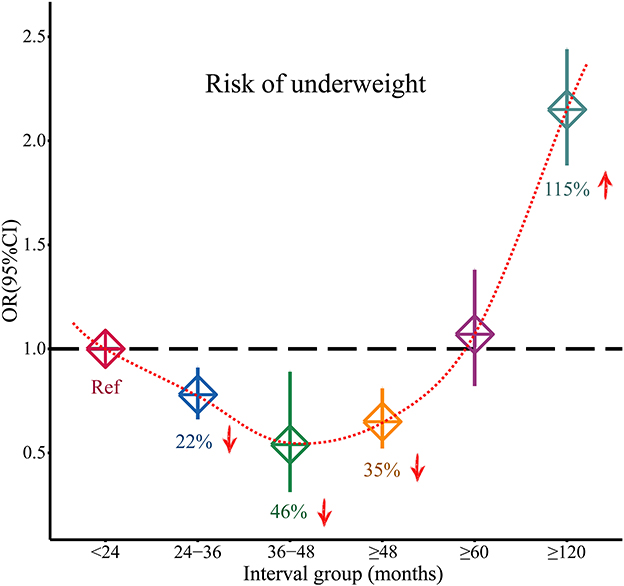
Figure 3. Changed effects of different birth interval groups and child underweight (<24 birth interval group was considered as the reference group; squares represent the ORs, and vertical lines represent the corresponding 95% CI).
Moreover, as shown in Figures 4, 5, compared with a birth interval of <24 months, a birth interval of ≥24 months was significantly associated with a decreased risk of stunting (OR = 0.61, 95% CI = 0.55–0.67) and wasting (OR = 0.63, 95% CI = 0.50–0.79), respectively. We further divided the birth interval into subgroups, the birth interval group of <24 months was considered as the reference group, as shown in Figure 4, and the results showed that the birth interval group of 24–48 months was significantly associated with a decreased risk of stunting (OR = 0.82, 95% CI = 0.77−0.88), while the above 48 months groups yielded a clearer protective effect of stunting compared with a birth interval of <24 months (OR = 0.63, 95% CI = 0.57–0.71). In the subgroup analysis based on regions, the protective effects with a birth interval of ≥24 months for stunting were both significant in Africans and Asians, while similar results were observed for wasting in Africans.
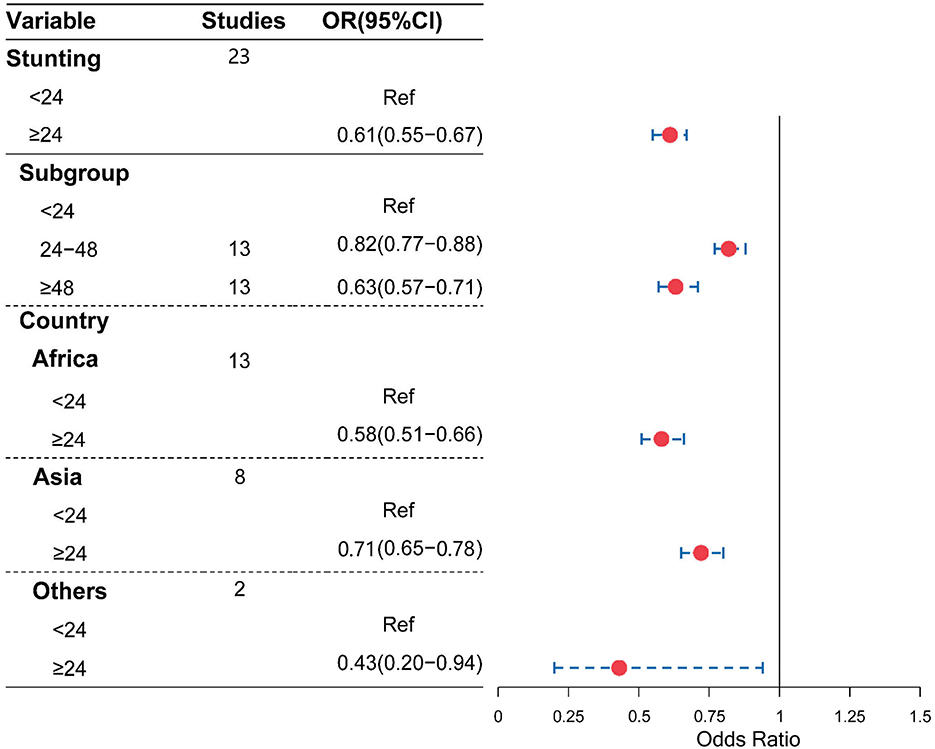
Figure 4. Association of birth interval and child stunting.
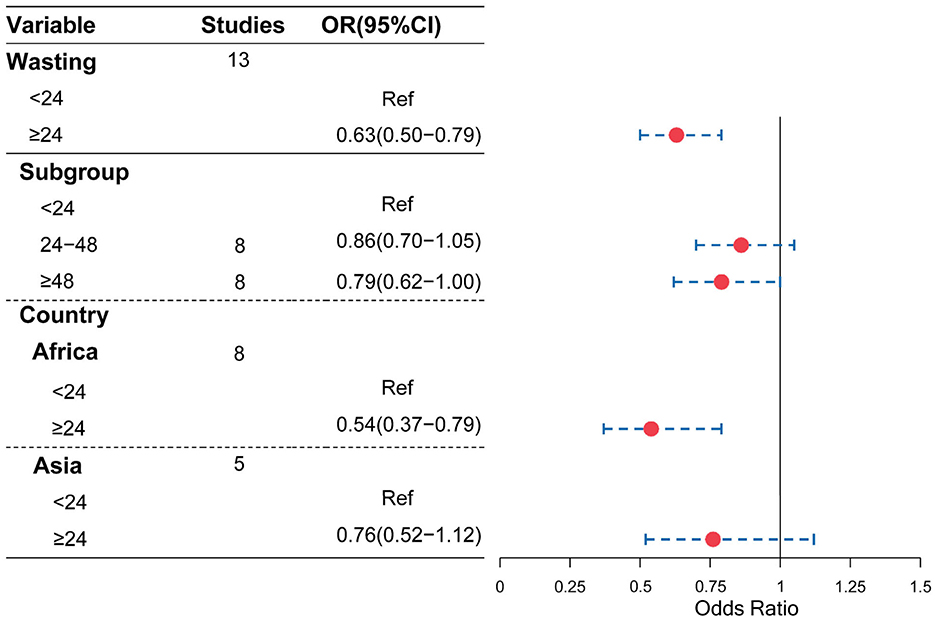
Figure 5. Association of birth interval and child wasting.
Publication bias
We then utilized the funnel plot and Begg's test to evaluate potential publication bias in the literature. The funnel plots were symmetrical in all the studied undernutrition outcomes (Figure 6). Moreover, Begg's test provided further statistical evidence for the absence of publication bias in all the studied undernutrition outcomes (P > 0.05).
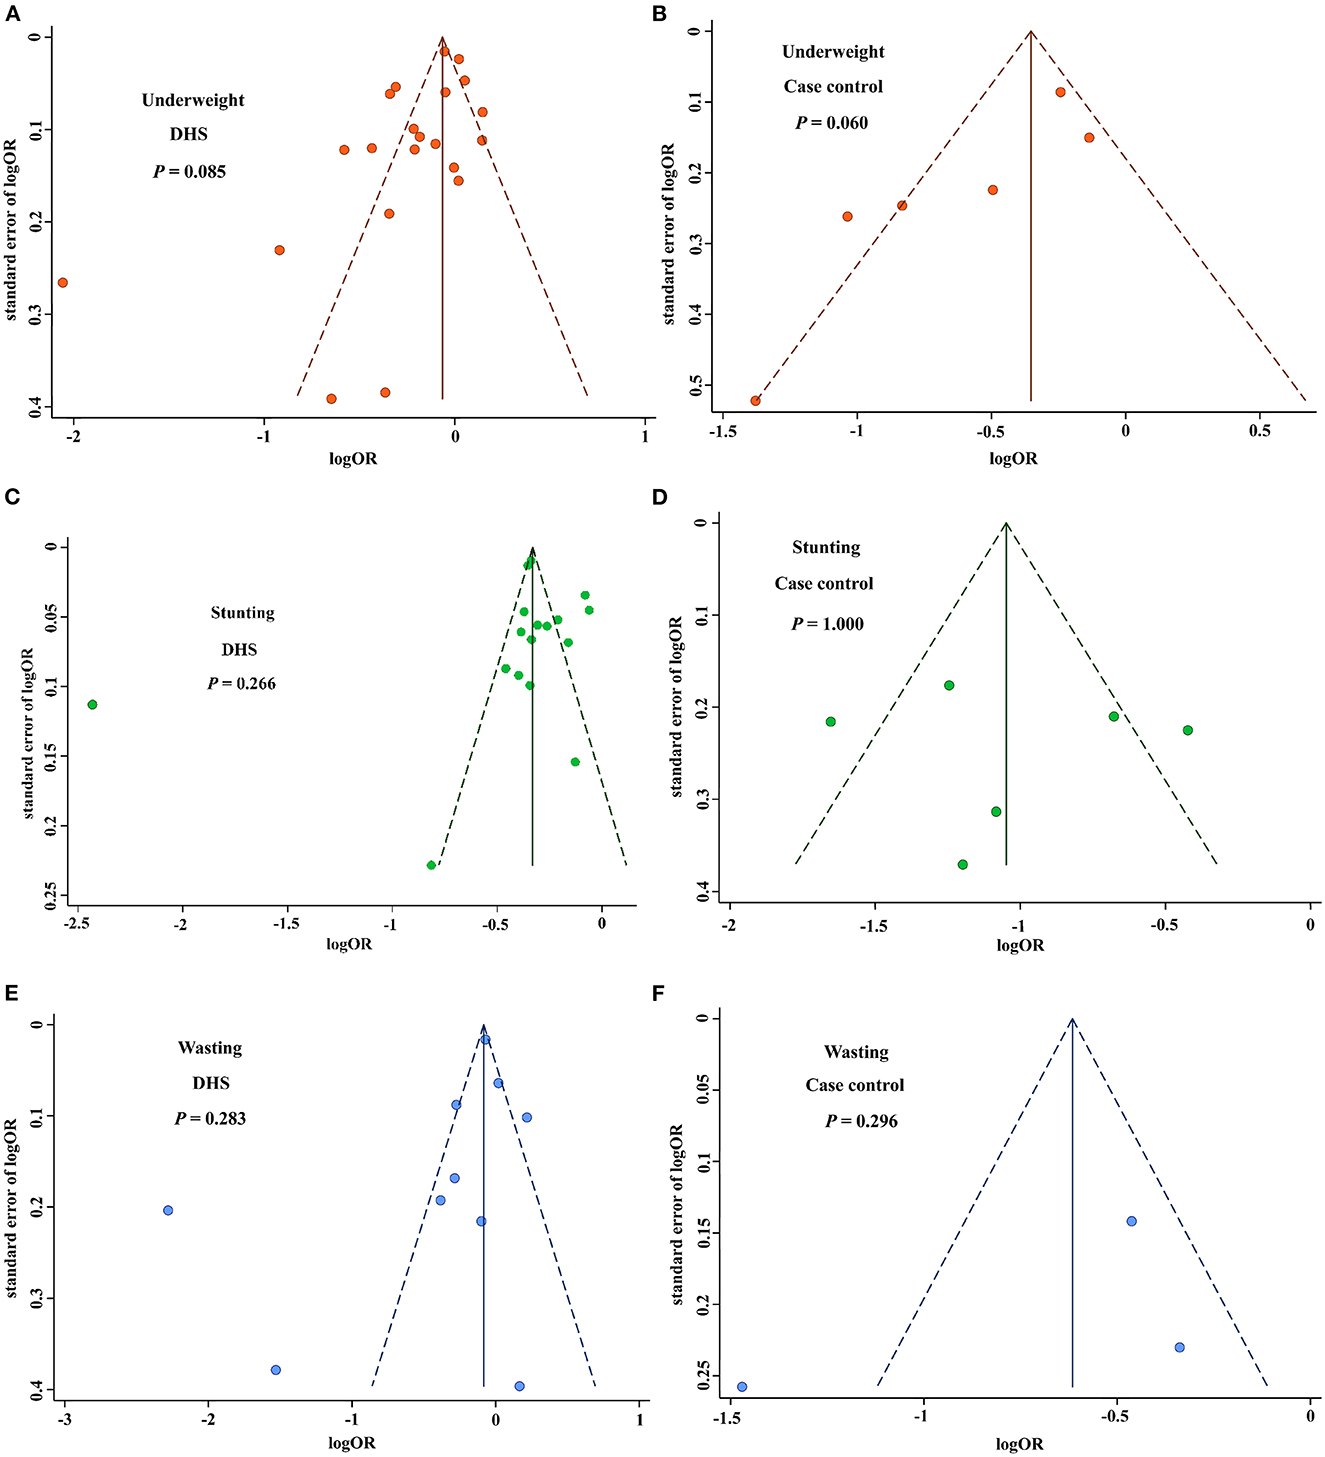
Figure 6. Funnel plot for publication bias of birth interval and childhood nutrition outcomes. (A) Funnel plot for publication bias of underweight based on the DHS studies. (B) Funnel plot for publication bias of underweight based on the case-control studies. (C) Funnel plot for publication bias of stunting based on the DHS studies. (D) Funnel plot for publication bias of stunting based on the case-control studies. (E) Funnel plot for publication bias of wasting based on the DHS studies. (F) Funnel plot for publication bias of wasting based on the case-control studies. DHS, demographic health surveys.
Discussion
The results of our study show that a longer birth interval (≥24 months) is significantly associated with a reduced risk of childhood undernutrition. Moreover, birth interval of ≥24 months and risk of underweight showed a U-shape that the optimum birth interval group of 36–48 months had the most protective effect compared with the birth interval of <24 months.
The most important risk factors for child undernutrition have been proven to occur early in life, including inadequate breastfeeding and maternal undernutrition during pregnancy (13). If longer birth intervals are maintained appropriately, more time will be provided for the care of older children, including the possibility of extended breastfeeding. The mother will also have time to recover from the nutritional burden of the last pregnancy, reducing the risk of undernutrition during the next pregnancy. Our study shows that an optimum birth interval between 36 and 48 months is independently associated with a significantly decreased risk of a child being underweight. Although the results cannot be directly compared with some studies due to different birth spacing boundaries and definitions, most studies report similar associations between birth spacing and poor child health outcomes. A cross-sectional study found that compared with the birth interval of >24 months, the risk of undernutrition was 1.43 times higher in children with birth intervals of <24 months (66). Moreover, a meta-analysis also reported a 3-fold increase in the odds of low birth weight for infants born <24 months apart (67). Generally, the short birth interval plays a major role in pregnancy outcomes, particularly among mothers with poor nutritional status, those with social-economic problems, and those with limited access to quality healthcare (68). The maternal nutrition depletion hypothesis states that a close sequence of pregnancies and periods of lactation worsens the mother's nutritional status (69, 70). This is because there is not enough time for the mother to recover from the physiological stresses of pregnancy before she is re-subjected to the stress. Our findings demonstrate that moderate birth intervals between 36 and 48 months would provide a mother with sufficient time to recover from the nutritional burden of pregnancy inherent during the prenatal period.
Some researchers have stipulated that having short birth intervals are caused by socioeconomic status, poorer lifestyles, failure to or inadequate use of healthcare services such as healthcare advice provided by healthcare advisers at community health centers, and other behavioral or physiological determinants, which will, in turn, lead to poorer pregnancy outcomes leading poor child nutrition outcomes (71, 72).
However, the effect of short birth intervals on children's nutritional status was not attenuated when socioeconomic and maternal characteristics were controlled (23, 73). This fact confirms that these confounding factors do not cause poor nutritional status endings, and short birth intervals are more likely to be an independent cause of poor nutritional status. Therefore, health policymakers should design appropriate policies to maintain desirable birth intervals, strengthen existing maternal and child nutrition interventions, and promote other relevant strategies to reduce child undernutrition, especially in developing countries.
This study had several strengths. First, our study presented a comparison between birth interval and all three undernutrition indicators: underweight, stunting, and wasting. Second, over 85% of the studies included in our meta-analysis were conducted in low-income and middle-income countries, which are mainly found in Africa and Asia, where the burden of child undernutrition is high. Therefore, this study supports the call to address the underlying causes of acute and chronic childhood undernutrition. Third, this study has identified areas where fellow researchers can design appropriate and strategic interventions to help the community to have healthy birth spacing based on our recommended birth interval.
There were some limitations to this study. First, there were few studies in developed countries, even though undernutrition is more prevalent in developing countries, so the results cannot be easily generalized. In addition, in many studies, assessing the relationship between birth interval and child nutritional outcomes was not a primary objective because birth interval was only one of the many variables examined. Most studies often lacked an assessment of all three nutritional indicators, namely, stunting, wasting, and underweight in their analysis. For three categories of child nutritional outcomes, further studies including a more comprehensive assessment of potentially confounding variables are needed to extract the complex factors involved in the relationship between birth interval and child nutritional outcomes.
Conclusion
Our study reveals that a longer birth interval (≥24 months) is significantly associated with decreased risk of childhood undernutrition including underweight, stunting, and wasting. More importantly, the optimum birth interval of 36–48 months yielded the most protective effect for underweight, and this would allow for repletion prior to the next conception and conserves required nutrients for the baby's growth during and after the delivery, hence boosting further child nutrition status while reducing unacceptably high burden of child undernutrition.
Data availability statement
The original contributions presented in the study are included in the article/supplementary material, further inquiries can be directed to the corresponding author.
Author contributions
JN, WZ, AQ, and ZC contributed to the literature search and painting of all figures. JN wrote the manuscript. WZ contributed to the critical revision of the manuscript. MC designed the study and had full access to all data in the study and take full responsibility for the accuracy of the analyses and their interpretation. All authors read and approved the final manuscript.
Funding
This work was partially supported by the National Natural Science Foundation of China (81502876) and the Natural Science Foundation of Jiangsu Province (BK20191449). The funding sources had no role to play in the study design, the collection and interpretation of the data, the writing of the report, or the decision to submit this study for publication.
Conflict of interest
The authors declare that the research was conducted in the absence of any commercial or financial relationships that could be construed as a potential conflict of interest.
Publisher's note
All claims expressed in this article are solely those of the authors and do not necessarily represent those of their affiliated organizations, or those of the publisher, the editors and the reviewers. Any product that may be evaluated in this article, or claim that may be made by its manufacturer, is not guaranteed or endorsed by the publisher.
Abbreviations
WHO, World Health Organization; SD, standard deviation; UNICEF, United Nations Children's Fund; PRISMA, the Preferred Reporting Items for Systematic Reviews and Meta-Analysis; DHS, demographic health surveys.
References
1. Darsene H, Geleto A, Gebeyehu A, Meseret S. Magnitude and predictors of undernutrition among children aged six to fifty nine months in ethiopia: a cross sectional study. Arch Public Health. (2017) 75:29. doi: 10.1186/s13690-017-0198-4
2. Benoist S, Brouquet A. Nutritional assessment and screening for malnutrition. J Visc Surg. (2015) 152 (Suppl 1):S3–7. doi: 10.1016/S1878-7886(15)30003-5
3. Victora CG, de Onis M, Hallal PC, Blossner M, Shrimpton R. Worldwide timing of growth faltering: revisiting implications for interventions. Pediatrics. (2010) 125:e473–80. doi: 10.1542/peds.2009-1519
4. Wrottesley SV, Lamper C, Pisa PT. Review of the importance of nutrition during the first 1000 days: maternal nutritional status and its associations with fetal growth and birth, neonatal and infant outcomes among African women. J Dev Orig Health Dis. (2016) 7:144–62. doi: 10.1017/S2040174415001439
5. Local Burden of Disease Child Growth Failure C. Mapping child growth failure across low- and middle-income countries. Nature. (2020) 577:231–4. doi: 10.1038/s41586-019-1878-8
6. Oguntoyinbo FA, Fusco V, Cho GS, Kabisch J, Neve H, Bockelmann W, et al. Produce from Africa's gardens: potential for leafy vegetable and fruit fermentations. Front Microbiol. (2016) 7:981. doi: 10.3389/fmicb.2016.00981
7. Amare ZY, Ahmed ME, Mehari AB. Determinants of nutritional status among children under age 5 in ethiopia: further analysis of the 2016 Ethiopia demographic and health survey. Global Health. (2019) 15:62. doi: 10.1186/s12992-019-0505-7
8. Das JK, Salam RA, Saeed M, Kazmi FA, Bhutta ZA. Effectiveness of interventions for managing acute malnutrition in children under five years of age in low-income and middle-income countries: a systematic review and meta-analysis. Nutrients. (2020) 12:116. doi: 10.3390/nu12010116
9. Prado EL, Dewey KG. Nutrition and brain development in early life. Nutr Rev. (2014) 72:267–84. doi: 10.1111/nure.12102
10. Vitolo MR, Gama CM, Bortolini GA, Campagnolo PD, Drachler Mde L. Some risk factors associated with overweight, stunting and wasting among children under 5 years old. J Pediatr (Rio J). (2008) 84:251–7. doi: 10.2223/JPED.1776
11. Gardner JM, Grantham-McGregor SM, Himes J, Chang S. Behaviour and development of stunted and nonstunted jamaican children. J Child Psychol Psychiatry. (1999) 40:819–27. doi: 10.1111/1469-7610.00497
12. Galler JR, Ramsey F. A follow-up study of the influence of early malnutrition on development: behavior at home and at school. J Am Acad Child Adolesc Psychiatry. (1989) 28:254–61. doi: 10.1097/00004583-198903000-00018
13. Walker SP, Wachs TD, Gardner JM, Lozoff B, Wasserman GA, Pollitt E, et al. Child development: risk factors for adverse outcomes in developing countries. Lancet. (2007) 369:145–57. doi: 10.1016/S0140-6736(07)60076-2
14. Umeokonkwo AA, Ibekwe MU, Umeokonkwo CD, Okike CO, Ezeanosike OB, Ibe BC. Nutritional status of school age children in abakaliki metropolis, ebonyi state, nigeria. BMC Pediatr. (2020) 20:114. doi: 10.1186/s12887-020-1994-5
15. Kismul H, Acharya P, Mapatano MA, Hatloy A. Determinants of childhood stunting in the democratic Republic of Congo: further analysis of demographic and health survey 2013-14. BMC Public Health. (2017) 18:74. doi: 10.1186/s12889-017-4621-0
16. Jabri L, Rosenthal DM, Benton L, Lakhanpaul M. Complementary feeding practices and nutrient intakes of children aged 6-24 months from Bangladeshi background living in tower hamlets, east London: a feasibility study. J Health Popul Nutr. (2020) 39:4. doi: 10.1186/s41043-020-0213-1
17. Tariq J, Sajjad A, Zakar R, Zakar MZ, Fischer F. Factors associated with undernutrition in children under the age of two years: secondary data analysis based on the pakistan demographic and health survey 2012(-)2013. Nutrients. (2018) 10:676. doi: 10.3390/nu10060676
18. Raj A, McDougal LP, Silverman JG. Gendered effects of siblings on child malnutrition in south asia: cross-sectional analysis of demographic and health surveys from Bangladesh, India, and Nepal. Matern Child Health J. (2015) 19:217–26. doi: 10.1007/s10995-014-1513-0
19. Yaya S, Uthman OA, Ekholuenetale M, Bishwajit G, Adjiwanou V. Effects of birth spacing on adverse childhood health outcomes: evidence from 34 countries in sub-Saharan Africa. J Matern Fetal Neonatal Med. (2020) 33:3501–8. doi: 10.1080/14767058.2019.1576623
20. Dewey KG, Cohen RJ. Does birth spacing affect maternal or child nutritional status? A systematic literature review. Matern Child Nutr. (2007) 3:151–73. doi: 10.1111/j.1740-8709.2007.00092.x
21. Conde-Agudelo A, Rosas-Bermudez A, Kafury-Goeta AC. Birth spacing and risk of adverse perinatal outcomes: a meta-analysis. JAMA. (2006) 295:1809–23. doi: 10.1001/jama.295.15.1809
22. Mozumder AB, Barkat EK, Kane TT, Levin A, Ahmed S. The effect of birth interval on malnutrition in Bangladeshi infants and young children. J Biosoc Sci. (2000) 32:289–300. doi: 10.1017/S0021932000002893
23. Gribble JN, Murray NJ, Menotti EP. Reconsidering childhood undernutrition: can birth spacing make a difference? An analysis of the 2002-2003 el salvador national family health survey. Matern Child Nutr. (2009) 5:49–63. doi: 10.1111/j.1740-8709.2008.00158.x
25. Pravana NK, Piryani S, Chaurasiya SP, Kawan R, Thapa RK, Shrestha S. Determinants of severe acute malnutrition among children under 5 years of age in nepal: a community-based case-control study. BMJ Open. (2017) 7:e017084. doi: 10.1136/bmjopen-2017-017084
26. Bater J, Lauer JM, Ghosh S, Webb P, Agaba E, Bashaasha B, et al. Predictors of low birth weight and preterm birth in rural Uganda: findings from a birth cohort study. PLoS ONE. (2020) 15:e0235626. doi: 10.1371/journal.pone.0235626
27. Das S, Chanani S, Shah More N, Osrin D, Pantvaidya S, Jayaraman A. Determinants of stunting among children under 2 years in urban informal settlements in Mumbai, India: evidence from a household census. J Health Popul Nutr. (2020) 39:10. doi: 10.1186/s41043-020-00222-x
28. Kahssay M, Woldu E, Gebre A, Reddy S. Determinants of stunting among children aged 6 to 59 months in pastoral community, Afar Region, North East Ethiopia: unmatched case control study. BMC Nutr. (2020) 6:9. doi: 10.1186/s40795-020-00332-z
29. Yaya S, Oladimeji O, Odusina EK, Bishwajit G. Household structure, maternal characteristics and children's stunting in sub-saharan africa: evidence from 35 countries. Int Health. (2020) 14:381–9. doi: 10.1093/inthealth/ihz105
30. Ntenda PAM. Association of low birth weight with undernutrition in preschool-aged children in Malawi. Nutr J. (2019) 18:51. doi: 10.1186/s12937-019-0477-8
31. Khatun W, Rasheed S, Alam A, Huda TM, Dibley MJ. Assessing the intergenerational linkage between short maternal stature and under-five stunting and wasting in Bangladesh. Nutrients. (2019) 11:1818. doi: 10.3390/nu11081818
32. Takele K, Zewotir T, Ndanguza D. Understanding correlates of child stunting in ethiopia using generalized linear mixed models. BMC Public Health. (2019) 19:626. doi: 10.1186/s12889-019-6984-x
33. Das Gupta R, Swasey K, Burrowes V, Hashan MR, Al Kibria GM. Factors associated with low birth weight in Afghanistan: a cross-sectional analysis of the demographic and health survey 2015. BMJ Open. (2019) 9:e025715. doi: 10.1136/bmjopen-2018-025715
34. Dessie ZB, Fentie M, Abebe Z, Ayele TA, Muchie KF. Maternal characteristics and nutritional status among 6-59 months of children in Ethiopia: further analysis of demographic and health survey. BMC Pediatr. (2019) 19:83. doi: 10.1186/s12887-019-1459-x
35. Fenta HM, Workie DL, Zike DT, Taye BW, Swain PK. Determinants of stunting among under-five years children in Ethiopia from the 2016 Ethiopia demographic and health survey: application of ordinal logistic regression model using complex sampling designs. Clin Epidemiol Glob Health. (2020) 8:404–13. doi: 10.1016/j.cegh.2019.09.011
36. Fatemi MJ, Fararouei M, Moravej H, Dianatinasab M. Stunting and its associated factors among 6-7-year-old children in Southern Iran: a nested case-control study. Public Health Nutr. (2018) 1−8. doi: 10.1017/S136898001800263X
37. Ansuya N, Unnikrishnan B, George A, N SY, Mundkur SC, et al. Risk Factors for malnutrition among preschool children in rural Karnataka: a case-control study. BMC Public Health. (2018) 18:283. doi: 10.1186/s12889-018-5124-3
38. Talukder A, Rahman Razu S, Hossain Z. Factors affecting stunting among under-five children in Bangladesh. Fam Med Primary Care Rev. (2018) 20:356–62. doi: 10.5114/fmpcr.2018.79348
39. Talukder A. Factors Associated with malnutrition among under-five children: illustration using Bangladesh demographic and health survey, 2014 data. Children (Basel). (2017) 4:88. doi: 10.3390/children4100088
40. Remonja CR, Rakotoarison R, Rakotonirainy NH, Mangahasimbola RT, Randrianarisoa AB, Jambou R, et al. The importance of public health, poverty reduction programs and women's empowerment in the reduction of child stunting in rural areas of moramanga and Morondava, Madagascar. PLoS ONE. (2017) 12:e0186493. doi: 10.1371/journal.pone.0189747
41. Mulugeta M, Mirotaw H, Tesfaye B. Dataset on child nutritional status and its socioeconomic determinants in Nonno District, Ethiopia. Data Brief. (2017) 14:6–14. doi: 10.1016/j.dib.2017.07.007
42. Abera L, Dejene T, Laelago T. Prevalence of malnutrition and associated factors in children aged 6-59 months among rural dwellers of damot gale district, south Ethiopia: community based cross sectional study. Int J Equity Health. (2017) 16:111. doi: 10.1186/s12939-017-0608-9
43. Batiro B, Demissie T, Halala Y, Anjulo AA. Determinants of stunting among children aged 6-59 months at Kindo Didaye Woreda, Wolaita Zone, Southern Ethiopia: unmatched case control study. PLoS ONE. (2017) 12:e0189106. doi: 10.1371/journal.pone.0189106
44. Olita'a D, Vince J, Ripa P, Tefuarani N. Risk factors for malnutrition in children at port moresby general hospital, Papua New Guinea: a case-control study. J Trop Pediatr. (2014) 60:442–8. doi: 10.1093/tropej/fmu049
45. Egata G, Berhane Y, Worku A. Predictors of acute undernutrition among children aged 6 to 36 months in east rural Ethiopia: a community based nested case - control study. BMC Pediatr. (2014) 14:91. doi: 10.1186/1471-2431-14-91
46. Khanal V, Sauer K, Karkee R, Zhao Y. Factors associated with small size at birth in Nepal: further analysis of Nepal demographic and health survey 2011. BMC Pregnancy Childbirth. (2014) 14:32. doi: 10.1186/1471-2393-14-32
47. Shahjada A, Sharma BK, Sharma S, Mahashabde P, Bachhotiya A. Effects of birth interval on nutritional status of underfive children in Periurban Area of Madhya Pradesh, India. Int J Med Sci Public Health. (2014) 3:723. doi: 10.5455/ijmsph.2014.070420141
48. Adekanmbi VT, Kayode GA, Uthman OA. Individual and contextual factors associated with childhood stunting in Nigeria: a multilevel analysis. Matern Child Nutr. (2013) 9:244–59. doi: 10.1111/j.1740-8709.2011.00361.x
49. Ikeda N, Irie Y, Shibuya K. Determinants of reduced child stunting in Cambodia: analysis of pooled data from three demographic and health surveys. Bull World Health Organ. (2013) 91:341–9. doi: 10.2471/BLT.12.113381
50. Sebayang SK, Dibley MJ, Kelly PJ, Shankar AV, Shankar AH, Group SS. Determinants of low birthweight, small-for-gestational-age and preterm birth in Lombok, Indonesia: analyses of the birthweight cohort of the summit trial. Trop Med Int Health. (2012) 17:938–50. doi: 10.1111/j.1365-3156.2012.03039.x
51. Das S, Rahman RM. Application of ordinal logistic regression analysis in determining risk factors of child malnutrition in Bangladesh. Nutr J. (2011) 10:124. doi: 10.1186/1475-2891-10-124
52. Zottarelli LK, Sunil TS, Rajaram S. Influence of parental and socioeconomic factors on stunting in children under 5 years in Egypt. East Mediterr Health J. (2007) 13:1330–42. doi: 10.26719/2007.13.6.1330
53. Som S, Pal M, Bharati P. Role of individual and household level factors on stunting: a comparative study in three Indian states. Ann Hum Biol. (2007) 34:632–46. doi: 10.1080/03014460701671772
54. Som S, Pal M, Bhattacharya B, Bharati S, Bharati P. Socioeconomic differentials in nutritional status of children in the states of West Bengal and Assam, India. J Biosoc Sci. (2006) 38:625–42. doi: 10.1017/S0021932005026921
55. Hosain GM, Chatterjee N, Begum A, Saha SC. Factors associated with low birthweight in rural Bangladesh. J Trop Pediatr. (2006) 52:87–91. doi: 10.1093/tropej/fmi066
56. Aerts D, Drachler Mde L, Giugliani ER. Determinants of growth retardation in Southern Brazil. Cad Saude Publica. (2004) 20:1182–90. doi: 10.1590/S0102-311X2004000500011
57. Kurup PJ, Khandekar R. Low birth weight as a determinant of protein energy malnutrition in “0-5 years” omani children of South Batinah Region, Oman. Saudi Med J. (2004) 25:1091–6.
58. Zhu BP, Rolfs RT, Nangle BE, Horan JM. Effect of the interval between pregnancies on perinatal outcomes. N Engl J Med. (1999) 340:589–94. doi: 10.1056/NEJM199902253400801
59. Basso O, Olsen J, Knudsen LB, Christensen K. Low birth weight and preterm birth after short interpregnancy intervals. Am J Obstet Gynecol. (1998) 178:259–63. doi: 10.1016/S0002-9378(98)80010-0
60. Basso O, Olsen J, Christensen K. Risk of preterm delivery, low birthweight and growth retardation following spontaneous abortion: a registry-based study in Denmark. Int J Epidemiol. (1998) 27:642–6. doi: 10.1093/ije/27.4.642
61. Adams MM, Delaney KM, Stupp PW, McCarthy BJ, Rawlings JS. The relationship of interpregnancy interval to infant birthweight and length of gestation among low-risk women, Georgia. Paediatr Perinat Epidemiol. (1997) 11 Suppl 1:48–62. doi: 10.1046/j.1365-3016.11.s1.8.x
62. Dinh PH, To TH, Vuong TH, Hojer B, Persson LA. Maternal factors influencing the occurrence of low birthweight in Northern Vietnam. Ann Trop Paediatr. (1996) 16:327–33. doi: 10.1080/02724936.1996.11747845
63. Huttly SR, Victora CG, Barros FC, Vaughan JP. Birth spacing and child health in urban Brazilian Children. Pediatrics. (1992) 89:1049–54. doi: 10.1542/peds.89.6.1049
64. Thaver IH, Ebrahim GJ, Richardson R. Infant mortality and undernutrition in the squatter settlements of Karachi. J Trop Pediatr. (1990) 36:135–40. doi: 10.1093/tropej/36.3.135
65. Bertrand WE, Mock NB, Franklin RR. Differential correlates of nutritional status in Kinshasa, Zaire. Int J Epidemiol. (1988) 17:556–67. doi: 10.1093/ije/17.3.556
66. Endris N, Asefa H, Dube L. Prevalence of malnutrition and associated factors among children in rural Ethiopia. Biomed Res Int. (2017) 2017:6587853. doi: 10.1155/2017/6587853
67. Endalamaw A, Engeda EH, Ekubagewargies DT, Belay GM, Tefera MA. Low birth weight and its associated factors in Ethiopia: a systematic review and meta-analysis. Ital J Pediatr. (2018) 44:141. doi: 10.1186/s13052-018-0586-6
68. Ahrens KA, Hutcheon JA. Birth spacing in the united states-towards evidence-based recommendations. Paediatr Perinat Epidemiol. (2019) 33:O1–4. doi: 10.1111/ppe.12523
69. Miller JE. Birth intervals and perinatal health: an investigation of three hypotheses. Fam Plann Perspect. (1991) 23:62–70. doi: 10.2307/2135451
70. Grisaru-Granovsky S, Gordon ES, Haklai Z, Samueloff A, Schimmel MM. Effect of interpregnancy interval on adverse perinatal outcomes–a national study. Contraception. (2009) 80:512–8. doi: 10.1016/j.contraception.2009.06.006
71. Klebanoff MA. the interval between pregnancies and the outcome of subsequent births. N Engl J Med. (1999) 340:643–4. doi: 10.1056/NEJM199902253400809
72. Brown W, Ahmed S, Roche N, Sonneveldt E, Darmstadt GL. Impact of family planning programs in reducing high-risk births due to younger and older maternal age, short birth intervals, and high parity. Semin Perinatol. (2015) 39:338–44. doi: 10.1053/j.semperi.2015.06.006
Keywords: birth interval, undernutrition, underweight, stunting, wasting
Citation: Ntambara J, Zhang W, Qiu A, Cheng Z and Chu M (2023) Optimum birth interval (36–48 months) may reduce the risk of undernutrition in children: A meta-analysis. Front. Nutr. 9:939747. doi: 10.3389/fnut.2022.939747
Received: 09 May 2022; Accepted: 23 December 2022;
Published: 13 January 2023.
Edited by:
Mainul Haque, National Defence University of Malaysia, MalaysiaReviewed by:
Prakash Doke, Bharati Vidyapeeth Deemed University, IndiaSonali Palkar, Bharati Vidyapeeth Deemed University, India
Copyright © 2023 Ntambara, Zhang, Qiu, Cheng and Chu. This is an open-access article distributed under the terms of the Creative Commons Attribution License (CC BY). The use, distribution or reproduction in other forums is permitted, provided the original author(s) and the copyright owner(s) are credited and that the original publication in this journal is cited, in accordance with accepted academic practice. No use, distribution or reproduction is permitted which does not comply with these terms.
*Correspondence: Minjie Chu,  Y2h1bWluamllQG50dS5lZHUuY24=
†These authors have contributed equally to this work