 Niki Bahrampour
 Farideh Shiraseb
 Sahar Noori1
 Cain C. T. Clark
 Khadijeh Mirzaei
94% of researchers rate our articles as excellent or good
Learn more about the work of our research integrity team to safeguard the quality of each article we publish.
Find out more
ORIGINAL RESEARCH article
Front. Nutr., 13 October 2022
Sec. Nutritional Epidemiology
Volume 9 - 2022 | https://doi.org/10.3389/fnut.2022.932225
This article is part of the Research TopicDiet and Nutrition for Non-communicable Diseases in Low and Middle-Income CountriesView all 30 articles
The resting metabolic rate (RMR) represents the largest component of total daily energy expenditure. The sale of ultra-processed foods (UPF) is increasing globally; however, UPF can have many adverse effects, including increasing inflammatory markers and altering RMRs. This cross-sectional study included 285 healthy overweight and obese women. Anthropometric measurements were evaluated using a bioelectrical impedance analyzer InBody 770 scanner. High-sensitivity C-reactive protein (hs-CRP), plasminogen activator-1 (PAI-1), monocyte chemoattractant protein (MCP-1), and interleukin-1 beta (IL-1β) blood levels were measured after a 12-h fasting. Indirect calorimetry was used to evaluate the RMR by using the Weir equation, and RMR deviation (RMR estimated - RMR actual), RMR per body mass index (BMI), and free fat mass (FFM) were estimated. A validated food frequency questionnaire (FFQ) was used, and seven groups of UPFs were extracted based on the NOVA method. A negative association between the RMR [β = −0.159, 95% confidence interval (CI): −0.471, −0.052, P = 0.044], RMR per BMI (β = −0.014, 95% CI: −0.025, −0.006, P = 0.036), and RMR per FFM (β = −0.241, 95% CI: −0.006, −0.000, P = 0.041) using the NOVA score was observed after adjusting for confounders. This association disappeared after inclusion of each inflammatory marker. All the markers may inversely mediate the relationship between the mentioned variables and the NOVA score. hs-CRP and MCP-1 also had a negative effect on the relationship between the NOVA score and RMR deviation. Finally, UPF intake is likely related with the RMR, mediated through changes in the production of hs-CRP, PAI-1, MCP-1, and IL-1β.
Knowledge of the resting metabolic rate (RMR) is necessary because it represents the largest component of total daily energy expenditure and has ramifications for nutrition support. Obesity and alterations in the RMR have a close link (1); indeed, obesity is one of the most important reasons for decreases in metabolism, and given that the prevalence of obesity and overweight has doubled in more than 70 countries since 1980 (50% of women are overweight and obese), an important consideration is the concomitant change in the RMR (1–3). The RMR is defined as the energy requirement of humans when they are awake in a normal temperature room, after food absorption, and not engaging in any activity for 12 h (4). Many previous studies have reported that the RMR is usually impacted by sex disparities, obesity, age, and racial/ethnic differences (4). For example, the RMR has been shown to be higher in men than in women due to their muscle mass (5), while aging has also been shown to affect the RMR (6). Dietary intake represents another factor that can affect the RMR; for instance, a recent study suggested that consuming protein in obese persons could contribute to an increase in resting energy expenditure (REE) (7). Lichtenbelt et al. found that consumption of polyunsaturated fatty acids to a greater extent than saturated fatty acids can result in an increasing RMR due to a higher oxidation rate (8). Other studies have reported that low-carbohydrate (<45% energy from carbohydrate) and low glycemic foods facilitate a RMR reduction in weight loss plans, largely due to more availability and the presence of endocrine mediators in anabolic and catabolic pathways (9). In order to identify processed foods, the NOVA classification system represents a novel tool for gaining insights into the epidemic (10). Foods are separated into unprocessed foods, processed culinary ingredients, processed foods, and ultra-processed foods (UPFs). UPFs refer to foods that are produced through industrial processes like hydrogenation, hydrolysis, extruding, molding, reshaping, and frying, and adding flavors, colors, emulsifiers, humectants, non-sugar sweeteners, and other additives (11); sodas, breakfast cereals, packaged cakes, and pre-prepared frozen foods are examples of this group.
There are serious concerns about ultra-processed food (UPF) intake and obesity (11). The sale of UPFs is increasing all over the world (to 43.7% until 2013) and has replaced fresh foods in low- and middle-income countries (12, 13). The 2015–2020 dietary guidelines for Americans suggest people increase high-quality dietary patterns for preventing chronic diseases (10). UPFs are made with various additives (salt, sugar, fat, etc.) and are low in dietary fiber and micronutrients (14), and the extant literature suggests a positive relationship between obesity, inflammation, and consumption of UPFs (14). In addition, recent studies have shown that a higher intake of UPFs is associated with lowering RMRs, slowing satiation, and weight gain, through lower protein, antioxidants, fiber, and higher energy density, and refined grain content present in them (15). Furthermore, unhealthy UPFs can interrupt gut–brain signaling, change vascular stiffness, and increase inflammatory markers (16, 17). Plasminogen activator-1 (PAI-1) is secreted by adiposity tissues in the blood and may have a negative effect on RMRs (18, 19). Moreover, UPF intake can increase the serum level of monocyte chemoattractant protein (MCP)-1 (20), while another inflammatory marker, interleukin-6 (IL-6), is decreased in a diets abundant in ω-3 polyunsaturated fatty acids (PUFAs) (21). Anti-inflammatory diets, such as the Mediterranean diet, which has a high amount of vegetables and fruit, fiber, and vitamins C and E, are related to decreased serum levels of pro-inflammatory biomarkers, like high-sensitivity C-reactive protein (hs-CRP) (22). Indeed, nutrients in these diets are low in UPF and may be important in regulating the immune system and changes in RMR (18).
To the best of our knowledge, no study has evaluated the impact of inflammatory markers on the relationship between RMR and UPF intake, using the NOVA classification, in Iran. Therefore, this study was designed to assess the possible mediatory role of inflammatory markers in the association between ultra-processed foods and the resting metabolic rate.
This cross-sectional study was performed with 285 overweight and obese women, who were referred to healthcare centers in Tehran, Iran. Participants were selected using multistage random sampling. The inclusion criteria were given as follows: aged between 18 and 48 years, body mass index (BMI) scores 25–29.9 kg/m2 for overweight and 30 kg/m2 for obesity, and without any chronic diseases, like hypertension, kidney or liver disorders, and cardiovascular diseases, which was ascertained by a face-to-face anamnesis interview. Women who were smokers; were alcohol consumers; had prescribed medication; and were pregnant, breastfeeding, or in menopausal stage; or had a history of weight loss in the last 6 months were excluded. In addition, only participants with a total energy intake between 800 and 4,200 kcal/d were included (23).
This study was conducted according to the guidelines of the Declaration of Helsinki, and all procedures involving human subjects/patients were approved by the ethics committee of Tehran University of Medical Sciences (TUMS) with the following identification: IR.TUMS.VCR.REC.1398.463. Written informed consent was obtained from all patients prior to participation.
Weight, BMI, and body fat mass (BFM) were measured using a multi-frequency bioelectrical impedance analyzer (BIA) InBody 770 scanner (Inbody Co., Seoul, Korea), where the women wore light clothes, without any metal subjects, and in accordance with manufacturer’s protocols. Anthropometric measurements were conducted between 8 and 9 a.m., after 12 h of fasting. The participants were asked to refrain from any non-habitual physical activity for the preceding 72 h. The test–re-test reliability of BIA in our laboratory was r = 0.98. BFM (kg), free fat mass (FFM) (kg), and fat mass index (FMI) (kg/m2) were extracted. The height of the participants was measured with a Seca 216 stadiometer, to the nearest 0.1 cm, with the participants in a standing position and unshod. The arm muscle circumference (cm) of the participants were also measured according to standard kinanthropometrist guidelines.
After fasting for 12 h, blood samples were drawn from the participants. The samples of blood were collected in parent tubes containing 0.1 EDTA, and tests were analyzed utilizing the Auto-Analyzer BT 1500 (Selectra 2; Vital Scientific, Spankeren, Netherlands). hs-CRP, PAI-1, MCP-1, and interleukin-1 beta (IL-1β) levels were measured by an immunoturbidimetric test using the Pars Azmoon kit (Pars Azmoon Inc., Tehran, Iran). Serum levels of high-density lipoprotein cholesterol (HDL-C), fasting blood sugar (FBS), low-density lipoprotein cholesterol (LDL-C), total cholesterol (TC), insulin, and triglyceride (TG) were also measured. Insulin resistance was assessed as HOMA-IR (homeostasis model assessment-estimated insulin resistance) = [glucose] (mmol/l) × [insulin] (μU/ml)/22.5 (24).
Indirect calorimetry (IC) is considered an accurate method of determining the RMR and was used to evaluate the RMR after an overnight fast. Respiratory gases were gathered using the MetaLyzer 3B-R3 (Cortex Biophysik GmbH, Leipzig, Germany) spirometer. The participants were asked to refrain from the consumption of caffeine and vigorous activity for a day prior to RMR measurements. The participants were asked to sleep in a silent place in a temperature between 24 and 26°C the night before the test and be free from emotional stress. Gaseous exchange was analyzed in the last 20 min of the resting time and during a minimum of 5 consecutive minutes in a steady-state condition. The RMR was measured using the Weir equation: RMR = [O2 consumed (liter) × 3.941 + produced Co2 (liter) × 1.11] × 1,440 min/d by assessing the amount of CO2 produced and O2 consumed through a one-way valve between the participants and the machine (25). RMR deviation was computed as RMR estimated - RMR actual (26). The RMR was also calculated per body surface area (BSA) using the Du Bois formula, BMI, and FFM (which were derived from BIA results) (27–29).
A validated food frequency questionnaire (FFQ), with 147 items, was used to assess the average food consumption of the participants over the past year (30). All dietary intakes, including foods and beverages, were converted to grams (31) and entered into Nutritionist IV software (version 7.0; N-Squared Computing, Salem, OR). In order to classify processed foods, the NOVA method was used (32). A total of 37 UPF items were categorized into seven food groups, and then the mean daily intake of each of seven UPF groups was divided by the total daily intake of UPF and multiplied by 100. These groups included non-dairy beverages (Cola, nectar drink, and instant coffee), cookies–cakes [cookies, biscuit, pastries (creamy and non-creamy), cake, pancake, doughnut, industrial bread, toasted bread, noodles, and pasta), dairy beverages [ice cream (non-pasteurized), ice cream (pasteurized), chocolate milk, and cocoa milk], potato chips—salty snacks [chips (crisps), crackers, and cheese puff], processed meat fast foods [burger, sausage, bologna, and pizza], oil sauces (margarine, ketchup, and mayonnaise), and sweets (jam, rock candy, candies, chocolates, sweets, nogal, sohan, Gaz, and sesame halva) (32).
The physical activity (PA) of the participants was also evaluated via the short form of the International Physical Activity Questionnaire (IPAQ) (33). The metabolic equivalent (MET) and MET-minutes per week (MET-min/wk) were ascertained by summing the activity hours per week.
The normality of data was evaluated using a Kolmogorov–Smirnov test. General characteristics of the participants within different tertiles of the NOVA score were described as mean ± standard deviation (SD) for quantitative variables and frequency (%) for categorical variables. Chi-square tests and one-way analysis of variance (ANOVA) and analysis of covariance (ANCOVA) were used for categorical variables and dietary intake in order to compare the differences among tertiles of NOVA scores. The NOVA score was divided into three groups (T1 < 383.681, 383.681 < T2 < 467.713, and T3 > 467.713). Bonferroni post hoc tests were used to investigate differences between tertiles. Linear regression was also used to investigate the relationship between outcomes and exposure in crude and two adjusted models and the role of inflammatory markers. Model 1 was adjusted for age, energy intake, BMI, physical activity, job status, and supplement intake. In model 2, additional controlling for legumes and vegetables was conducted. The results are shown as a beta (β) with 95% confidence intervals (95% CI). Pearson correlation was utilized to discern the association between inflammatory markers, RMR, and NOVA score. All analyses were conducted using Statistical Package for Social Sciences) SPSS) version 25 software (SPSS Inc., Chicago, Illinois), where P < 0.05 was considered statistically significant.
As shown in Supplementary Table 1, according to NOVA screening, most of the UPF intakes were via non-dairy beverages (39.12), and the smallest contribution was from oils and sauces (4.33%). General characteristics of the participants across NOVA score tertiles are shown in Table 1. The mean (SD) of weight, FFM, and BMI was 80.92 (12.39) kg, 46.76 (5.59) kg, and 31.02 (4.29) kg/m2, respectively. In addition, the total mean (SD) of serum levels of hs-CRP, IL-1β, MCP-1, and PAI-1 was 4.31 (4.65), 2.73 (0.94), 50.69 (92.46), and 16.10 (29.92) mg/dl, respectively. A total of 142 women had a moderate income, and 148 were taking dietary supplements. Age and height were significantly different among NOVA tertiles (P < 0.05) in the crude model. After adjusting for confounding variables, such as age, BMI, PA, and energy intake, hs-CRP, and age were all significant (P < 0.05) (Table 1).
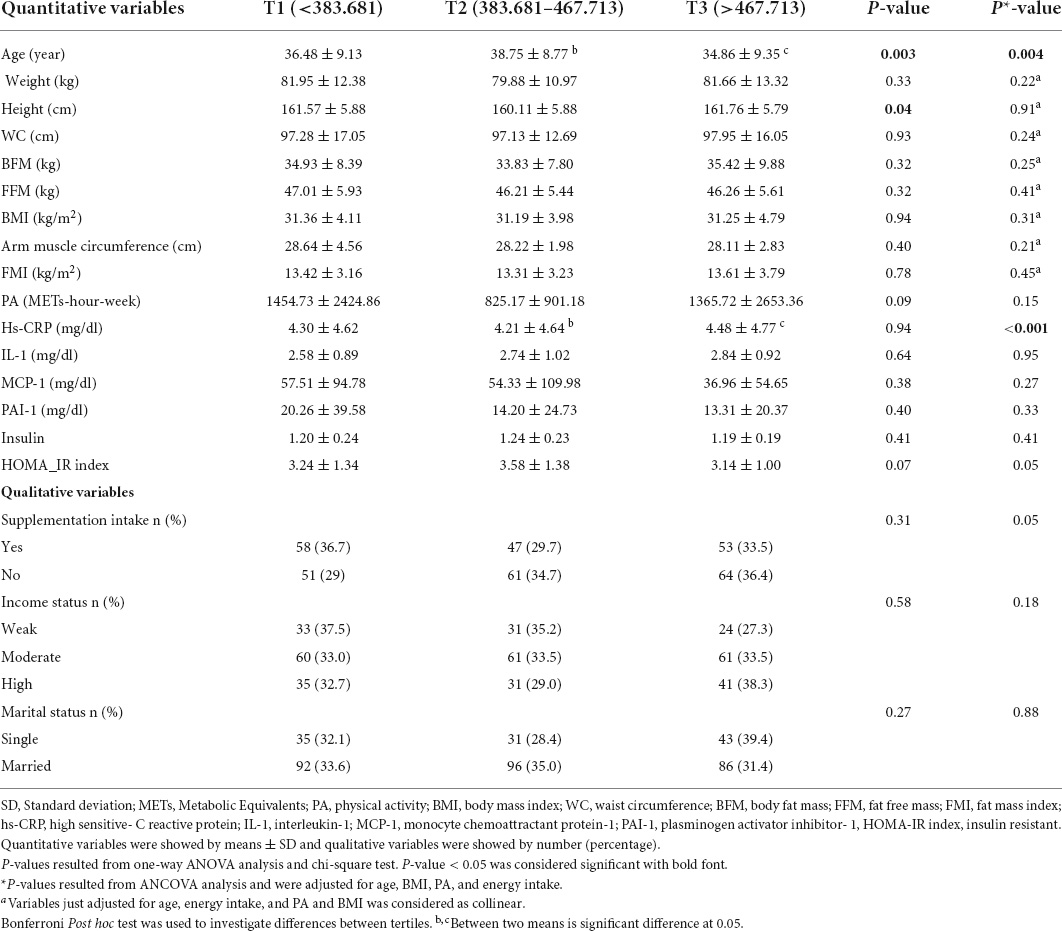
Table 1. Distribution of general variables of the participants among tertiles of UPF intake.
The dietary intake of subjects between NOVA tertiles is shown in Table 2. All of the food groups and components were statistically different among NOVA tertiles, except whole grain, vitamin D, and trans fat (P < 0.05). After adjusting for energy, vegetables (P = 0.003), legumes (P = 0.04), linolenic acid (P = 0.02), total fiber (P < 0.001), beta-carotene (P = 0.01), vitamin B1 (P = 0.002), B6 (P < 0.001), B9 (P < 0.001), biotin (P = 0.01), magnesium (P = 0.002), copper (P = 0.008), and chromium (P = 0.009) remained significantly different.
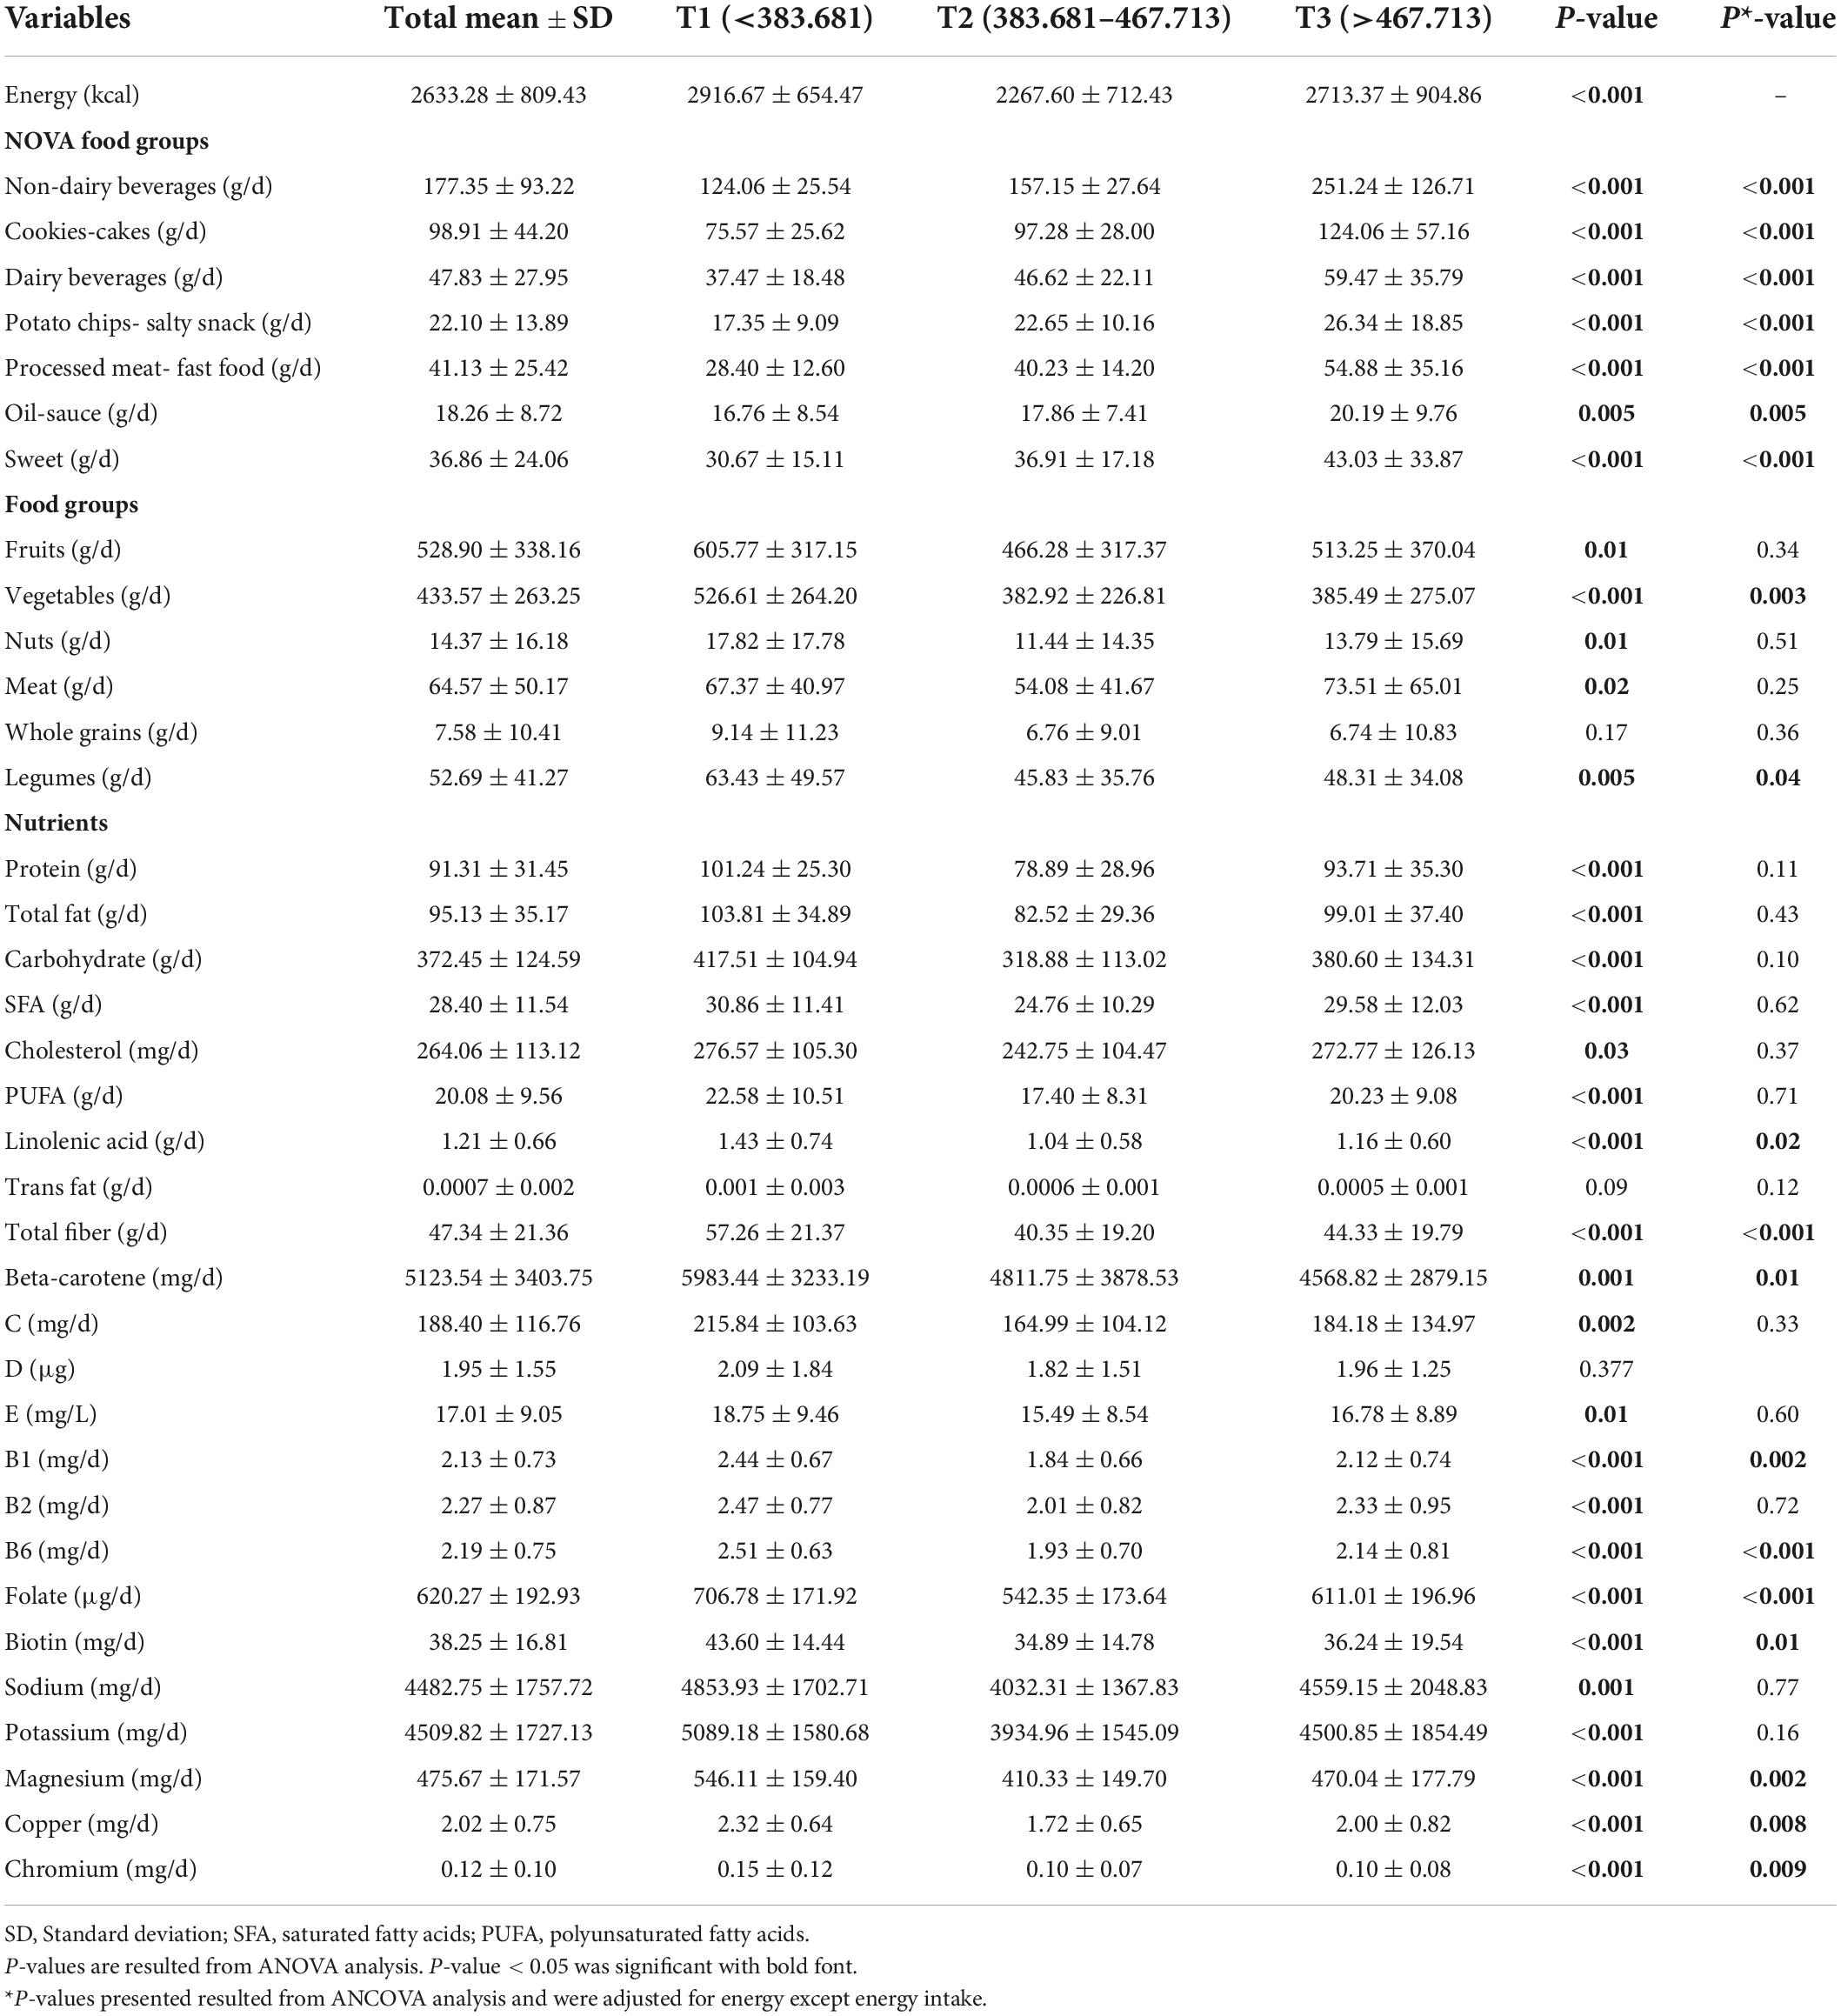
Table 2. Intake of UPF, food groups, and nutrients according to the UPF tertiles in overweight and obese women.
According to Table 3, the mean RMR was not significantly different between the tertiles of NOVA in the crude model. Deviation from the estimated normal RMR was significantly different in model 2 (P = 0.04).
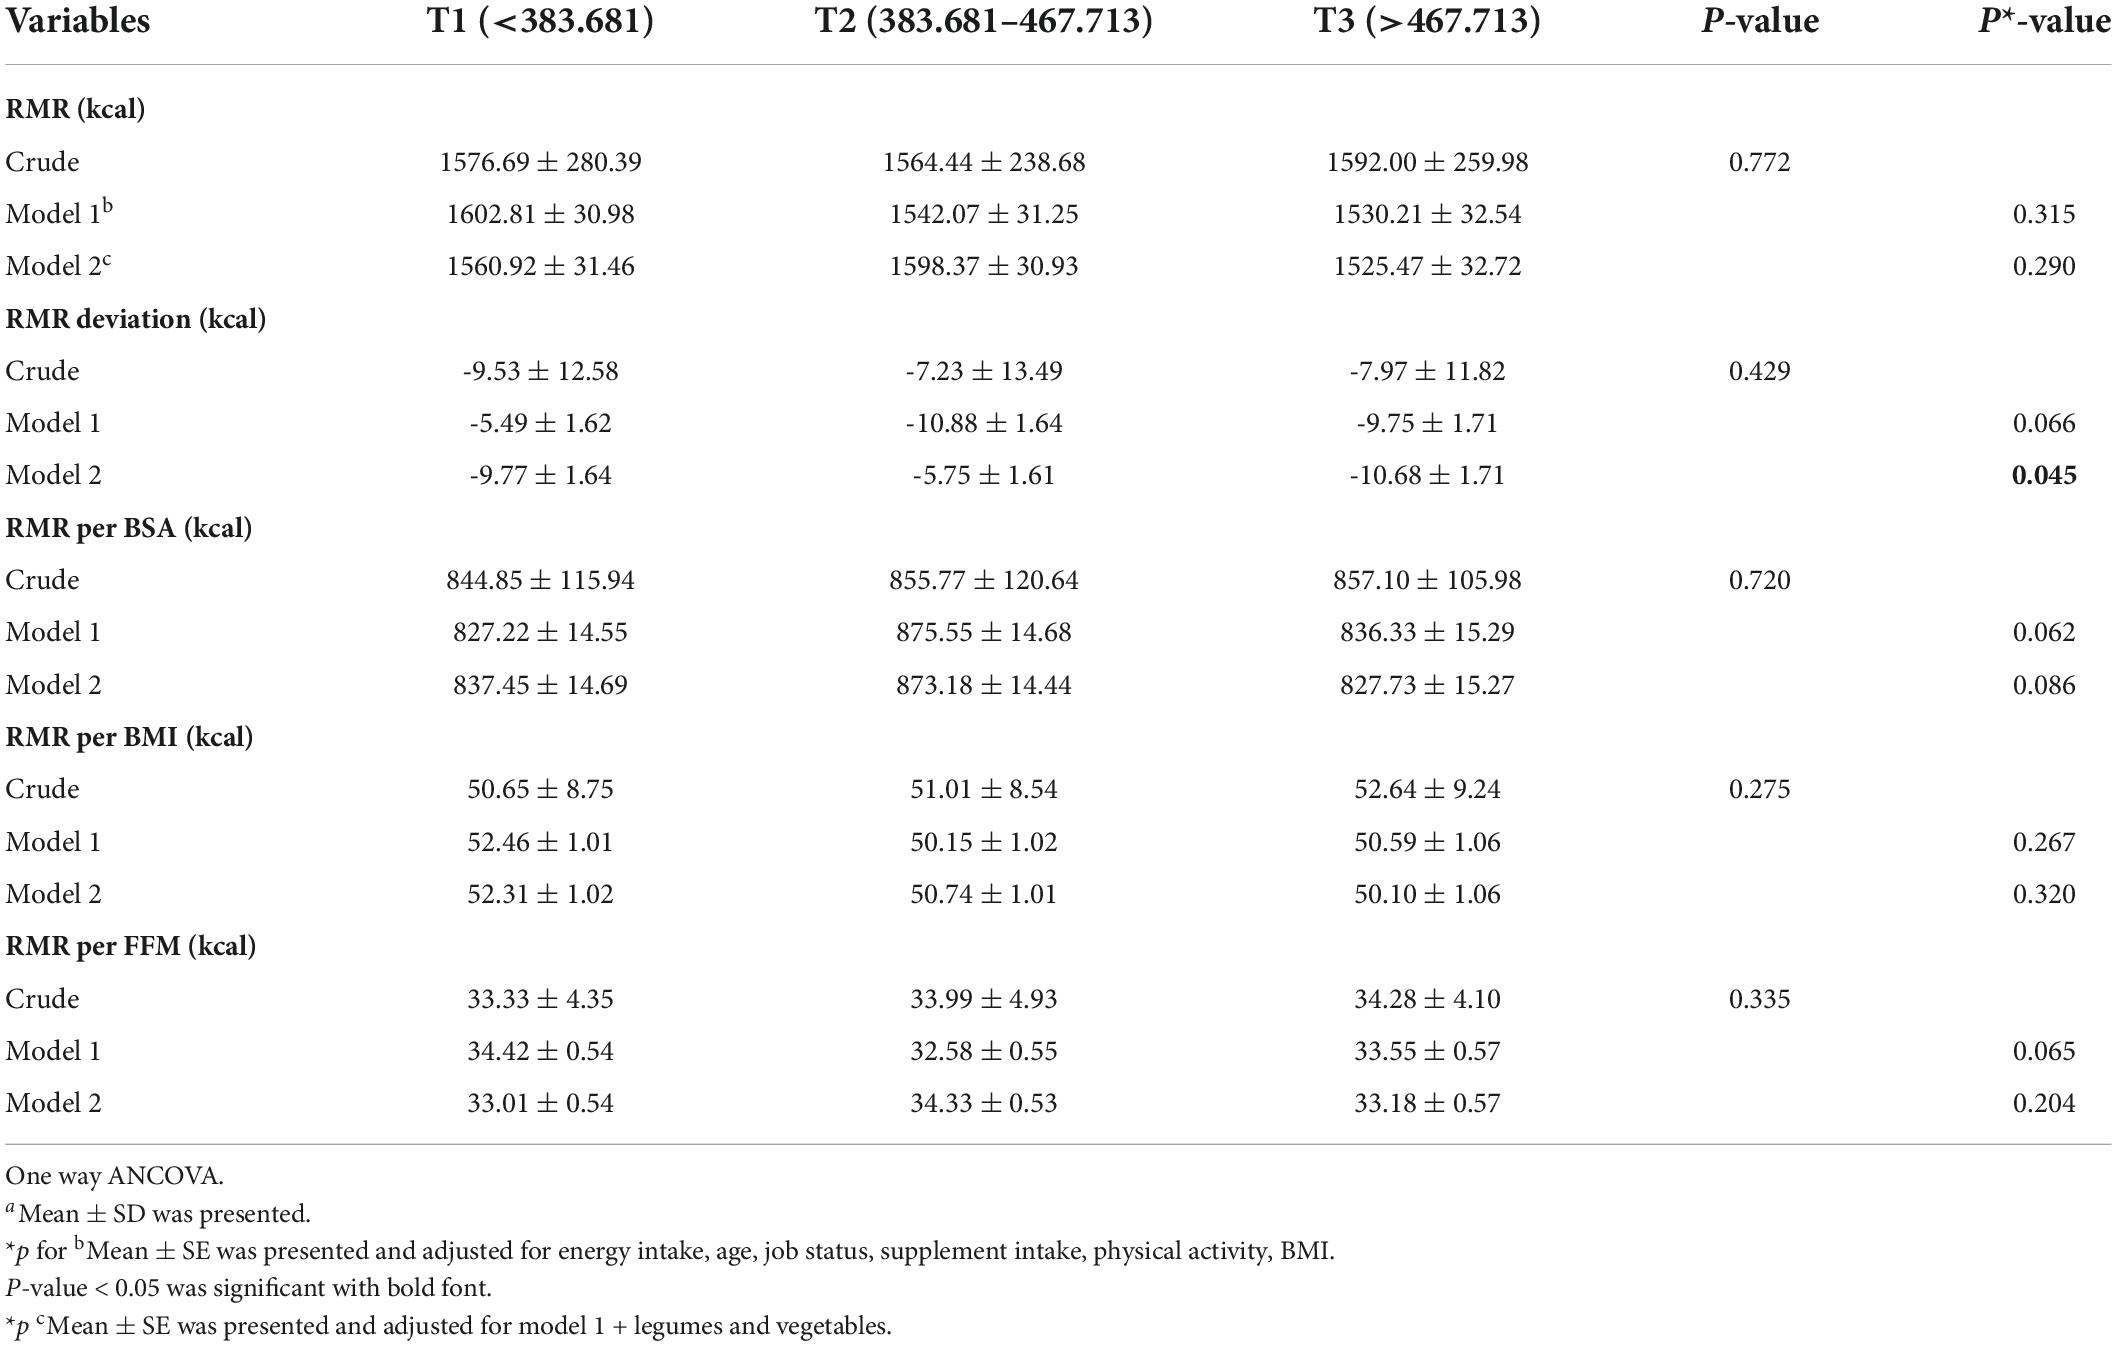
Table 3. The distribution of RMR subcategories between UPF intake tertiles.
The relationship between the RMR and NOVA score is shown in Table 4. No significant relationship of RMR variables were observed among NOVA groups in crude models. In model 1, a negative association between the RMR per BMI (β = −0.012, 95% CI: −0.022 to −0.002, P = 0.038) with the NOVA score was observed. This negative relationship remained after adjusting for all confounders in model 2. In addition, a negative association was appeared between the NOVA score and RMR (β = −0.15, 95% CI: −0.471 to -0.052, P = 0.04), and the RMR per FFM (β = −0.24, 95% CI: −0.006 to -0.000, P = 0.04) in model 2.
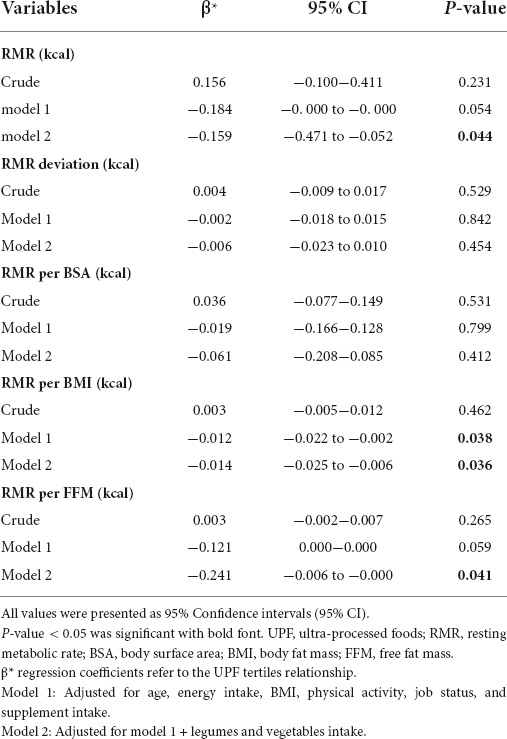
Table 4. Association between resting metabolic rate and related variables and UPF intakes.
The correlation between inflammatory markers and the RMR variables is shown in Supplementary Table 2. hs-CRP had a weak positive linear relationship with the RMR (r = 0.146, P = 0.024) and RMR per FFM (r = 0.128, P = 0.048), respectively.
The mediatory role of inflammatory markers on the relationship between UPF intakes and RMR is shown in Supplementary Figure 1. The association between the NOVA score and RMR (P-value primary = 0.04), RMR per BMI (P-value primary = 0.03), and RMR per FFM (P-value primary = 0.04) is shown in Table 4. After adjusting for all confounders (Table 5), it was evident that all of the markers may inversely mediate the relationship between the mentioned variables and NOVA scores. Furthermore, by entering hs-CRP (P-value after = 0.54), IL-1β (P-value after = 0.42), MCP-1(P-value after = 0.93), and PAI-1(P-value after = 0.43) as confounding variables, along with the other confounders in model 2, a potential negative relationship between the NOVA score and RMR per BSA was evident. In addition, hs-CRP (P = 0.564) and MCP-1 (P = 0.911) also had a possible negative mediatory role in the relationship between NOVA score groups and RMR deviation from normal.
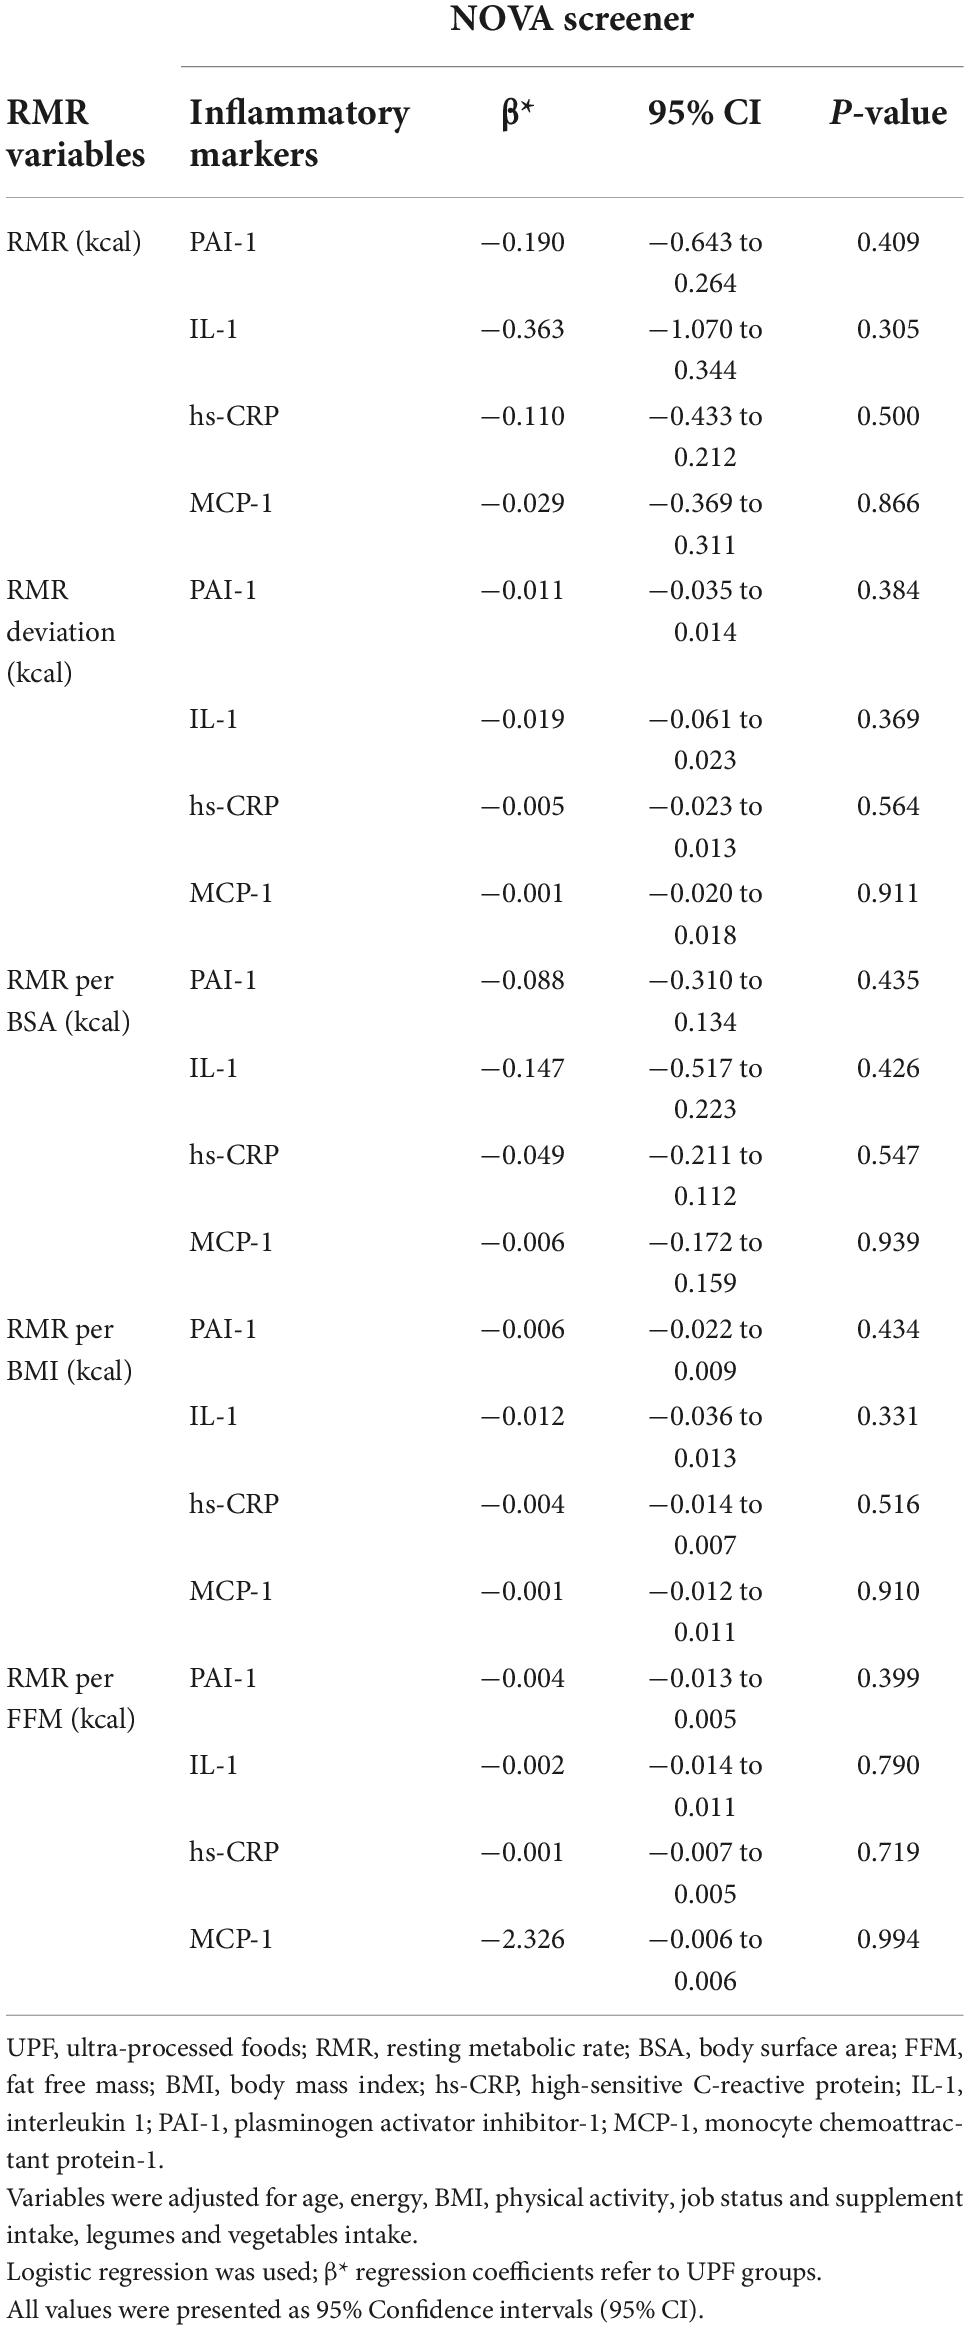
Table 5. The association of the mediating effect of inflammatory markers on RMR subcategories between UPF tertiles in overweight and obese women.
To the author’s knowledge, this is the first study to have investigated the possible mediatory role of inflammatory markers on the relationship between UPF and RMR in obese and overweight women. In this study, we found that with increasing NOVA scores, RMR deviation from the calculated normal RMR was increased, which indicates that with increasing UPF consumption, RMR decreased. In addition, a significant negative association between the RMR, RMR per BMI, and RMR per FFM, with NOVA score was observed after adjusting all confounders. This suggests that all the included markers may inversely mediate the relationship between the mentioned variables and NOVA score. In addition, hs-CRP and MCP-1 also had a possible negative mediatory role in the relationship between NOVA score groups and RMR deviation from normal.
High levels of CRP indicate low-grade inflammation that is, often, associated with several non-communicable diseases, including obesity, cardiovascular disease (CVD), and diabetes (34–37). In a study of 670 adolescent girls in Iran, it was found that there is a positive and significant relationship between adherence to a Western diet and higher serum levels of CRP (38). Western diets contain high amounts of refined grains, snacks, red meats and organ meat, pizza, fruit juices, industrial compote, mayonnaise, sugar, soft drinks, sweets, and desserts. On the other hand, the consumption of fruits and vegetables is inversely correlated with CRP levels, which is comparable to the findings in our study, where fruit and vegetable intake decreased with increasing NOVA scores, and the amount of hs-CRP increased (38). Findings of Lopes et al. suggest that a positive association between excess intake of UPFs and CRP levels in women may be mediated by adipocytes (39). The positive association between the consumption of UPFs and the CRP seen in women may be partly explained by the greater accumulation of body fat in women as BMI is strongly associated with CRP levels in women (40, 41). The consumption of UPFs is known to lead to the overproduction of reactive oxygen species and thereby enhances inflammation by increasing hs-CRP levels and decreasing adiponectin (42–44); indeed, the mechanism that may justify the mediatory role of hs-CRP on the relationship between UPFs and RMR may be related to insulin. In the presence of obesity, CRP levels increase (45, 46), and elevated levels are associated with inflammation and insulin resistance (46). However, insulin sensitivity is inversely related to the RMR (47), which indicates that with consumption of UPFs, hs-CRP levels, inflammation, and insulin resistance increase, which has a decreasing effect on the RMR.
In a group of healthy individuals with normal weight and overweight, the association between RMR and hs-CRP levels, indicative of inflammation, was investigated, and the authors reported that sex significantly affects the age-related changes in body composition, in addition to changes in body composition–REE relationship (48). From a biological perspective, IL-6, which is expressed in adipose tissue, stimulates the production of CRP in the liver and leads to higher levels of circulating hs-CRP. In addition, adipocytes produce and secrete fewer pro-inflammatory and anti-inflammatory cytokines, especially enlarged adipocytes, which may be associated with impaired glucose–insulin homeostasis and impaired energy metabolism (49–52). The products secreted by adipose tissue affect systemic metabolism by inflammatory cytokines, leptin, and PAI-1 (53). In fact, some of the nutritional properties of UPFs, such as high energy density, high glycemic load, and high content of saturated and trans fats, may stimulate inflammation by increasing oxidative stress (39). The results of Yunsheng et al. show that dietary fiber may have protective effects against hs-CRP (54), while in a recent review article (55), King et al. suggested that dietary fiber reduced lipid oxidation, which, in turn, was associated with reduced inflammation. Dietary fiber also helps maintain a healthy gut environment and natural flora, which help prevent inflammation (55); indeed, in our study, with the increasing NOVA score and increasing CRP, the amount of dietary fiber intake decreased.
The study by Bibiloni et al. showed an association between omega-3 and PIA-1 PUFAs in healthy women (56). PUFA intake in the Western diet mainly includes n-6 PUFA (mainly linoleic acid and arachidonic acid), with a ratio of n6:n-3 ranging from 10 to 20:1 (57). Arachidonic acid (AA) is released from the membrane through the lipoxygenase pathway to pro-inflammatory eicosanoids, which are involved in inflammatory activation (58). When n-3 PUFA intake is higher, eicosapentaenoic acid (EPA) and docosahexaenoic acid (DHA) partially replace AA in the cell membrane; thus, fewer biologically active substances are formed, and the balance of n-6 and n-3 eicosanoids changes to compounds with less inflammatory activity (59). Another study, by Miller and colleagues, showed that total fiber intake was inversely related to PAI-1, while insoluble fiber was inversely associated with PAI-1 and MCP-1 in overweight women (60). In our study, with the increasing NOVA score, the intake of linolenic acid and dietary fiber decreased, and the amount of hs-CRP increased, although no significant difference was seen in MCP-1 and PIA-1. The mechanism of the mediatory role of MCP-1, like hs-CRP, may also be related to insulin secretion and resistance. MCP-1 secretion is stimulated by tumor necrosis factor α (TNFα), IL-6, and IL-1β, which are secreted from adipose tissue (61, 62). Elevated MCP-1 levels are associated with insulin resistance and type 2 diabetes (T2DM) (63, 64), and as noted earlier, insulin resistance is inversely related to RMR (47). However, MCP-1 and hs-CRP had mediating effects on the association between RMR and UPF, which could be due to differences in the rate of inflammation and fiber intake (total, soluble, and insoluble), as compared with previous studies.
In a randomized controlled trial performed by Hall et al., it was reported that energy intake was higher during adherence to a UPF diet (16). Participants consumed more carbohydrates and fats and gained weight and body fat. The authors also showed that eating UPFs reduced the secretion of the hunger hormone ghrelin and also increased the level of the satiety hormone PYY (YY peptide) (11). Thus, UPFs may more efficiently regulate and stimulate biological mechanisms of hunger and satiety control than processed foods. The authors also asserted that with the unprocessed diet, a decrease in the inflammatory biomarker of hs-CRP was observed and that inflammation may be associated with satiety signals in animal studies (65).
Evidence is emerging regarding the mechanisms that strengthen the link between UPFs and adverse health outcomes. The mechanisms proposed are as follows: poor nutritional profile, UPFs are rich in sodium, added sugars, trans fats, and replace unprocessed foods in the diet (66–70), decrease in intestinal and brain satiety signal due to changes in physical properties caused by food processing and higher glycemic load (71–74), carcinogens formed during high-temperature cooking (acrylamide) (75, 76), and inflammatory responses associated with cellular nutrients and industrial food additives, increased intestinal permeability, and dysbiosis of the intestinal microflora (65, 77, 78).
Carbohydrate metabolism is more energy-intensive than fat metabolism, while protein metabolism requires the most energy (79–81). Processed foods have lower nutrient densities (less content and variety of nutrients per calorie) than whole foods, where extra simple carbohydrates (82–84) and less dietary fiber that make them chemically and structurally simple and digestible (82, 83, 85). All these reduce the volume of meals and reduce satiety, which consequently lead to increased daily caloric intake (31–39), which is associated with obesity and systemic inflammation (86–88).
The strengths of this study are the use of an FFQ questionnaire, which has been specifically validated in the Iranian population. Nevertheless, residual confounding related to recall bias must be acknowledged. Examining this association in one gender and only in Tehran represent limitations of this study because these results cannot be extrapolated to the entire Iranian population and all individuals. The cross-sectional design of this study precludes causal inferences being made. In addition, using BIA may overestimate lean body mass.
Ultra-processed foods may be related with changes in the production and secretion of cytokines and inflammatory factors and, ultimately, cause inflammation and reduced RMRs. A negative association between the RMR, RMR per BMI, and RMR per FFM with the NOVA score was observed in the present study. UPF intake is likely related with the RMR, RMR per BMI, and RMR per FFM, mediated by the production of hs-CRP, PAI-1, MCP-1, and IL-1β. hs-CRP and MCP-1 levels also had a possible negative mediatory role in the relationship between NOVA score groups and RMR deviation from normal. Given the novel evidence provided, further work, in the form of interventional studies, is needed in this area.
The original contributions presented in this study are included in the article/Supplementary material, further inquiries can be directed to the corresponding author.
The studies involving human participants were reviewed and approved by the Tehran University of Medical Sciences and Health Services. The patients/participants provided their written informed consent to participate in this study.
NB and FS designed the project. FS collected the samples and analyzed the data. NB and SN wrote the manuscript. FS, CC, and NB reviewed and edited the manuscript. KM conducted the research and had primary responsibility for the final content. All authors read and approved the final manuscript.
The Tehran University of Medical Sciences and Health Services funded and supported the present study (Grant ID: 9513468001).
We thank the study participants for their cooperation and assistance in physical examinations and CC who did language editing.
The authors declare that the research was conducted in the absence of any commercial or financial relationships that could be construed as a potential conflict of interest.
All claims expressed in this article are solely those of the authors and do not necessarily represent those of their affiliated organizations, or those of the publisher, the editors and the reviewers. Any product that may be evaluated in this article, or claim that may be made by its manufacturer, is not guaranteed or endorsed by the publisher.
The Supplementary Material for this article can be found online at: https://www.frontiersin.org/articles/10.3389/fnut.2022.932225/full#supplementary-material
Supplementary Figure 1 | The mediatory role of inflammatory markers on the relationship between UPF intakes and RMR.
RMR, resting metabolic rate; LED, low energy density; HED, high energy density; UPFs, ultra-processed foods; PA, physical activity; WC, waist circumference; WHR, waist-to-hip ratio; BMI, body mass index; PAI-1, plasminogen activator-1; IL-6, interleukin-6; PUFA, polyunsaturated fatty acids; MCP-1, monocyte chemoattractant protein; hs-CRP, high-sensitivity C-reactive protein; HDL-C, high-density lipoprotein cholesterol; FBS, fasting blood sugar; LDL-C, low-density lipoprotein cholesterol; TC, total cholesterol; TG, triglyceride; IC, indirect calorimetry; BSA, body surface area; FFM, free fat mass; FFQ, food frequency questionnaire; IPAQ, the International Physical Activity Questionnaire; METs, metabolic equivalents; ANOVA, one-way analysis of variance; ANCOVA, analysis of covariance.
1. Kaplan MS, Huguet N, Newsom JT, McFarland BH, Lindsay J. Prevalence and correlates of overweight and obesity among older adults: findings from the Canadian national population health survey. J Gerontol A Biol Sci Med Sci. (2003) 58:1018–30. doi: 10.1093/gerona/58.11.M1018
2. Astrup A, Buemann B, Toubro S, Ranneries C, Raben A. Low resting metabolic rate in subjects predisposed to obesity: a role for thyroid status. Am J Clin Nutr. (1996) 63:879–83. doi: 10.1093/ajcn/63.6.879
3. Song N, Liu F, Han M, Zhao Q, Zhao Q, Zhai H, et al. Prevalence of overweight and obesity and associated risk factors among adult residents of northwest China: a cross-sectional study. BMJ Open. (2019) 9:1–9. doi: 10.1136/bmjopen-2018-028131
4. McMurray RG, Soares J, Caspersen CJ, McCurdy T. Examining variations of resting metabolic rate of adults: a public health perspective. Med Sci Sports Exerc. (2014) 46:1352–8. doi: 10.1249/MSS.0000000000000232
5. Buchholz AC, Rafii M, Pencharz PB. Is resting metabolic rate different between men and women. Br J Nutr. (2001) 86:641–6. doi: 10.1079/BJN2001471
6. Schrack JA, Knuth ND, Simonsick EM, Ferrucci L. “IDEAL” aging is associated with lower resting metabolic rate: the baltimore longitudinal study of aging. J Am Geriatr Soc. (2014) 62:667–72. doi: 10.1111/jgs.12740
7. De Jonge L, Bray GA, Smith SR, Ryan DH, De Souza RJ, Loria CM, et al. Effect of diet composition and weight loss on resting energy expenditure in the POUNDS LOST study. Obesity. (2012) 20:2384–9. doi: 10.1038/oby.2012.127
8. Van Marken WD, Lichtenbelt RP, Westerterp MKR. The effect of fat composition of the diet on energy metabolism. Z Ernahrungswiss. (1997) 36:303–5. doi: 10.1007/BF01617803
9. Karl JP, Roberts SB, Schaefer EJ, Gleason JA, Fuss P, Rasmussen H, et al. Effects of carbohydrate quantity and glycemic index on resting metabolic rate and body composition during weight loss. Obesity. (2015) 23:2190–8. doi: 10.1002/oby.21268
10. Gibney MJ. Ultra-processed foods : definitions and policy issues. Curr Dev Nutr. (2018) 3:nzy077. doi: 10.1093/cdn/nzy077
11. Elizabeth L, Machado P, Zinöcker M, Baker P, Lawrence M. Ultra-processed foods and health outcomes: a narrative review. Nutrients. (2020) 12:1–36. doi: 10.3390/nu12071955
12. Sung H, Park JM, Oh SU, Ha K, Joung H. Consumption of ultra-processed foods increases the likelihood of having obesity in Korean women. Nutrients. (2021) 13:698. doi: 10.3390/nu13020698
13. Li M, Shi Z. Ultra-Processed food consumption associated with overweight_obesity among Chinese adult results from china health and nutrition survey 1997 2011. Nutrients. (2021) 13:2796. doi: 10.3390/nu13082796
14. Costa CDS, Faria FR, Gabe KT, Sattamini IF, Khandpur N, Leite FHM, et al. Nova score for the consumption of ultra-processed foods description and performance evaluation in Brazil. Rev Saude Publica. (2021) 55:13. doi: 10.11606/s1518-8787.2021055003588
15. Barr SB, Wright JC. Postprandial energy expenditure in whole-food and processed-food meals: implications for daily energy expenditure. Food Nutr Res. (2010) 54:1–10. doi: 10.3402/fnr.v54i0.5144
16. Hall KD, Ayuketah A, Brychta R, Cai H, Cassimatis T, Chen KY, et al. Ultra-Processed diets cause excess calorie intake and weight gain: an inpatient randomized controlled trial of ad libitum food intake. Cell Metab. (2019) 30:67–77.e3. doi: 10.1016/j.cmet.2019.05.008
17. Smiljanec K, Mbakwe AU, Ramos-Gonzalez M, Mesbah C, Lennon SL. Associations of ultra-processed and unprocessed/minimally processed food consumption with peripheral and central hemodynamics, and arterial stiffness in young healthy adults. Nutrients. (2020) 12:1–19. doi: 10.3390/nu12113229
18. Morais AHDA, Passos TS, Vale SHDL, Maia JKDS, Maciel BLL. Obesity and the increased risk for COVID-19: mechanisms and nutritional management. Nutr Res Rev. (2021) 34:209–21. doi: 10.1017/S095442242000027X
19. Grag MK, Dutta MK, Mahalle N. Adipokines (adiponectin and plasminogen activator inhhibitor-1) in metabolic syndrome. Indian J Endocrinol Metab. (2012) 16:116–23. doi: 10.4103/2230-8210.91206
20. Nestares T, Martín-Masot R, Flor-Alemany M, Bonavita A, Maldonado J, Aparicio VA. Influence of ultra-processed foods consumption on redox status and inflammatory signaling in young celiac patients. Nutrients. (2021) 13:156. doi: 10.3390/nu13010156
21. Aguayo-Patrón SV, Calderón de la Barca AM. Old fashioned vs. Ultra-processed-based current diets: possible implication in the increased susceptibility to type 1 diabetes and celiac disease in childhood. Foods. (2017) 6:100. doi: 10.3390/foods6110100
22. Bujtor M, Turner AI, Torres SJ, Esteban-Gonzalo L, Pariante CM, Borsini A. Associations of dietary intake on biological markers of inflammation in children and adolescents: a systematic review. Nutrients. (2021) 13:356. doi: 10.3390/nu13020356
23. Banna JC, McCrory MA, Fialkowski MK, Boushey C. Examining plausibility of self-reported energy intake data: considerations for method selection. Front Nutr. (2017) 4:45. doi: 10.3389/fnut.2017.00045
24. Gutch M, Kumar S, Razi SM, Gupta K, Gupta A. Assessment of insulin sensitivity/resistance. Indian J Endocrinol Metab. (2015) 19:160–4. doi: 10.4103/2230-8210.146874
25. Lam YY, Ravussin E. Indirect calorimetry: an indispensable tool to understand and predict obesity. Eur J Clin Nutr. (2017) 71:318–22. doi: 10.1038/ejcn.2016.220
26. Livingston EH, Kohlstadt I. Simplified resting metabolic rate—predicting formulas for normal−sized and obese individuals. Obes Res. (2005) 13:1255–62. doi: 10.1038/oby.2005.149
27. Cunningham JJ. Body composition and resting metabolic rate: the myth of feminine metabolism. Am J Clin Nutr. (1982) 36:721–6. doi: 10.1093/ajcn/36.4.721
28. Askarpour M, Yarizadeh H, Djafarian K, Mirzaei K. Association between the dietary inflammatory index and resting metabolic rate per kilogram of fat-free mass in overweight and obese women. J Iran Med Counc. (2020) 3:29–35.
29. Hosseini B, Mirzaei K, Maghbooli Z, Keshavarz SA, Hossein-Nezhad A. Compare the resting metabolic rate status in the healthy metabolically obese with the unhealthy metabolically obese participants. J Nutr Intermed Metab. (2016) 6:48–53. doi: 10.1016/j.jnim.2016.07.003
30. Mirmiran P, Hosseini-Esfahani F, Jessri M, Mahan LK, Shiva N, Azizi F. Does dietary intake by Tehranian adults align with the 2005 dietary guidelines for Americans? Observations from the Tehran lipid and glucose study. J Heal Popul Nutr. (2011) 29:39–52. doi: 10.3329/jhpn.v29i1.7564
31. Morgan KJ, Zabik ME, Stampley GL. The role of breakfast in diet adequacy of the U.S. adult population. J Am Coll Nutr. (1986) 5:551–63. doi: 10.1080/07315724.1986.10720156
32. Edalati S, Bagherzadeh F, Jafarabadi MA, Ebrahimi-Mamaghani M. Higher ultra-processed food intake is associated with higher DNA damage in healthy adolescents. Br J Nutr. (2021) 125:568–76. doi: 10.1017/S0007114520001981
33. Craig CL, Marshall AL, Sjöström M, Bauman AE, Booth ML, Ainsworth BE, et al. International physical activity questionnaire: 12-Country reliability and validity. Med Sci Sports Exerc. (2003) 35:1381–95. doi: 10.1249/01.MSS.0000078924.61453.FB
34. Wärnberg J, Nova E, Moreno LA, Romeo J, Mesana MI, Ruiz JR, et al. Inflammatory proteins are related to total and abdominal adiposity in a healthy adolescent population: the AVENA study. Am J Clin Nutr. (2006) 84:505–12. doi: 10.1093/ajcn/84.3.505
35. Ridker PM. High-sensitivity C-reactive protein: potential adjunct for global risk assessment in the primary prevention of cardiovascular disease. Circulation. (2001) 103:1813–8. doi: 10.1161/01.CIR.103.13.1813
36. Ridker PM. Clinical Application of C-Reactive Protein for Cardiovascular Disease Detection and Prevention. (2003). Available online at: https://pubmed.ncbi.nlm.nih.gov/12551853/ (accessed January 24, 2022).
37. Sai Ravi Kiran B, Mohanalakshmi T, Srikumar R, Prabhakar Reddy E. C-reactive protein and other markers of inflammation in the prediction of cardiovascular disease in diabetes. Int J Res Pharm Sci. (2017) 8:476–9.
38. Khayyatzadeh SS, Bagherniya M, Fazeli M, Khorasanchi Z, Bidokhti MS, Ahmadinejad M, et al. A Western dietary pattern is associated with elevated level of high sensitive C-reactive protein among adolescent girls. Eur J Clin Invest. (2018) 48:e12897. doi: 10.1111/eci.12897
39. Lopes AEDSC, Araújo LF, Levy RB, Barreto SM, Giatti L. Association between consumption of ultra-processed foods and serum c-reactive protein levels: cross-sectional results from the ELSA-Brasil study. Sao Paulo Med J. (2019) 137:169–76. doi: 10.1590/1516-3180.2018.0363070219
40. Rudnicka AR, Rumley A, Whincup PH, Lowe GD, Strachan DP. Sex differences in the relationship between inflammatory and hemostatic biomarkers and metabolic syndrome: British 1958 Birth Cohort. J Thromb Haemost. (2011) 9:2337–44. doi: 10.1111/j.1538-7836.2011.04517.x
41. Ahmadi-Abhari S, Luben RN, Wareham NJ, Khaw KT. Distribution and determinants of C-reactive protein in the older adult population: European prospective investigation into cancer-norfolk study. Eur J Clin Invest. (2013) 43:899–911. doi: 10.1111/eci.12116
42. Vasselli JR, Scarpace PJ, Harris RBS, Banks WA. Dietary components in the development of leptin resistance. Adv Nutr. (2013) 4:164–75. doi: 10.3945/an.112.003152
43. Bressan J, Hermsdorff HHM, Zulet MÁ, Martínez JA. Impacto hormonal e inflamatório de diferentes composições dietéticas: ênfase em padrões alimentares e fatores dietéticos específicos. Arq Bras Endocrinol Metabol. (2009) 53:572–81. doi: 10.1590/S0004-27302009000500010
44. Calle MC, Andersen CJ. Corrigendum to: assessment of dietary patterns represents a potential, yet variable, measure of inflammatory status: a review and update. Dis Markers. (2019) 2019:5454602. doi: 10.1155/2019/5454602
45. Kuller LH, Tracy RP, Shaten J, Meilahn EN. Relation of C-reactive protein and coronary heart disease in the MRFIT nested case-control study. Am J Epidemiol. (1996) 144:537–47. doi: 10.1093/oxfordjournals.aje.a008963
46. Mendall MA, Patel P, Ballam L, Strachan D, Northfield TCC. Reactive protein and its relation to cardiovascular risk factors: a population based cross sectional study. Br Med J. (1996) 312:1061–5. doi: 10.1136/bmj.312.7038.1061
47. Calton EK, Pathak K, Soares MJ, Alfonso H, Keane KN, Newsholme P, et al. Vitamin D status and insulin sensitivity are novel predictors of resting metabolic rate: a cross-sectional analysis in Australian adults. Eur J Nutr. (2016) 55:2075–80. doi: 10.1007/s00394-015-1021-z
48. Geisler C, Braun W, Pourhassan M, Schweitzer L, Glüer CC, Bosy-Westphal A, et al. Gender-specific associations in age-related changes in resting energy expenditure (REE) and MRI measured body composition in healthy Caucasians. J Gerontol A Biol Sci Med Sci. (2016) 71:941–6. doi: 10.1093/gerona/glv211
49. Deepa R, Velmurugan K, Arvind K, Sivaram P, Sientay C, Uday S, et al. Serum levels of interleukin 6, C-reactive protein, vascular cell adhesion molecule 1, and monocyte chemotactic protein 1 in relation to insulin resistance and glucose intolerance-the Chennai Urban Rural Epidemiology Study (CURES). Metabolism. (2006) 55:1232–8. doi: 10.1016/j.metabol.2006.05.008
50. Yudkin JS, Stehouwer CDA, Emeis JJ, Coppack SW. C-reactive protein in healthy subjects: associations with obesity, insulin resistance, and endothelial dysfunction: a potential role for cytokines originating from adipose tissue? Arterioscler Thromb Vasc Biol. (1999) 19:972–8. doi: 10.1161/01.ATV.19.4.972
51. Wellen KE, Hotamisligil GS, Wellen KE, Hotamisligil GS. Inflammation, stress, and diabetes. J Clin Invest. (2005) 115:1111–9. doi: 10.1172/JCI25102
52. Hotamisligil GS. Inflammation and metabolic disorders. Nature. (2006) 444:860–7. doi: 10.1038/nature05485
53. Scherer PE. Adipose tissue: from lipid storage compartment to endocrine organ. Diabetes. (2006) 55:1537–45. doi: 10.2337/db06-0263
54. Ma Y, Griffith JA, Chasan-Taber L, Olendzki BC, Jackson E, Stanek EJ, et al. Association between dietary fiber and serum C-reactive protein. Am J Clin Nutr. (2006) 83:760–6. doi: 10.1093/ajcn/83.4.760
55. Rutter MK, Meigs JB, Sullivan LM, D’Agostino RB, Wilson PWF. C-reactive protein, the metabolic syndrome, and prediction of cardiovascular events in the Framingham offspring study. Circulation. (2004) 110:380–5. doi: 10.1161/01.CIR.0000136581.59584.0E
56. Del Mar Bibiloni M, Maffeis C, Llompart I, Pons A, Tur JA. Dietary factors associated with subclinical inflammation among girls. Eur J Clin Nutr. (2013) 67:1264–70. doi: 10.1038/ejcn.2013.196
57. Simopoulos AP. Essential fatty acids in health and chronic diseases. Forum Nutr. (2003) 56:67–70.
58. Heller A, Koch T, Schmeck J, van Ackern K. Lipid mediators in inflammatory disorders. Drugs. (1998) 55:487–96. doi: 10.2165/00003495-199855040-00001
59. Schmidt EB, Dyerberg J. N−3 fatty acids and leucocytes. J Intern Med. (1989) 225:151–8. doi: 10.1111/j.1365-2796.1989.tb01449.x
60. Miller SJ, Batra AK, Shearrer GE, House BT, Cook LT, Pont SJ, et al. Dietary fibre linked to decreased inflammation in overweight minority youth. Pediatr Obes. (2016) 11:33–9. doi: 10.1111/ijpo.12017
61. Gerhardt CC, Romero IA, Cancello R, Camoin L, Strosberg AD. Chemokines control fat accumulation and leptin secretion by cultured human adipocytes. Mol Cell Endocrinol. (2001) 175:81–92. doi: 10.1016/S0303-7207(01)00394-X
62. Bruun JM, Lihn AS, Pedersen SB, Richelsen B. Monocyte chemoattractant protein-1 release is higher in visceral than subcutaneous human adipose tissue (AT): implication of macrophages resident in the AT. J Clin Endocrinol Metab. (2005) 90:2282–9. doi: 10.1210/jc.2004-1696
63. Kanda H, Tateya S, Tamori Y, Kotani K, Hiasa K, Kitazawa R, et al. MCP-1 contributes to macrophage infiltration into adipose tissue, insulin resistance, and hepatic steatosis in obesity1. J Clin Invest. (2006) 116:1494. doi: 10.1172/JCI26498
64. Herder C, Baumert J, Thorand B, Koenig W, de Jager W, Meisinger C, et al. Chemokines as risk factors for type 2 diabetes results from the MONICA KORA Augsburg study 1984-2002. Diabetologia. (2006) 49:921–9. doi: 10.1007/s00125-006-0190-y
65. Zinöcker MK, Lindseth IA. The Western diet–microbiome-host interaction and its role in metabolic disease. Nutrients. (2018) 10:365. doi: 10.3390/nu10030365
66. Marrón-Ponce JA, Sánchez-Pimienta TG, Louzada MLDC, Batis C. Energy contribution of NOVA food groups and sociodemographic determinants of ultra processed food consumption in the Mexican population. Public Health Nutr. (2018) 21:87–93. doi: 10.1017/S1368980017002129
67. Martínez Steele E, Baraldi LG, Louzada ML, Moubarac JC, Mozaffarian D, Monteiro CA. Ultra-processed foods and added sugars in the US diet: evidence from a nationally representative cross-sectional study. BMJ Open. (2016) 6:e009892. doi: 10.1136/bmjopen-2015-009892
68. Moubarac JC, Batal M, Louzada ML, Martinez Steele E, Monteiro CA. Consumption of ultra-processed foods predicts diet quality in Canada. Appetite. (2017) 108:512–20. doi: 10.1016/j.appet.2016.11.006
69. Bielemann RM, Motta JV, Minten GC, Horta BL, Gigante DP. Consumption of ultra-processed foods and their impact on the diet of young adults. Rev Saude Publica. (2015) 49:28. doi: 10.1590/S0034-8910.2015049005572
70. Poti JM, Mendez MA, Ng SW, Popkin BM. Is the degree of food processing and convenience linked with the nutritional quality of foods purchased by US households? Am J Clin Nutr. (2015) 101:1251–62. doi: 10.3945/ajcn.114.100925
71. Fardet A, Méjean C, Labouré H, Andreeva VA, Feron G. The degree of processing of foods which are most widely consumed by the French elderly population is associated with satiety and glycemic potentials and nutrient profiles. Food Funct. (2017) 8:651–8. doi: 10.1039/C6FO01495J
72. Fardet A. Minimally processed foods are more satiating and less hyperglycemic than ultra-processed foods: a preliminary study with 98 ready-to-eat foods. Food Funct. (2016) 7:2338–46. doi: 10.1039/C6FO00107F
73. Small DM, DiFeliceantonio AG. Processed foods and food reward. Science. (2019) 363:346–8. doi: 10.1126/science.aav0556
74. De Graaf C, Kok FJ. Slow food, fast food and the control of food intake. Nat Rev Endocrinol. (2010) 6:290–3. doi: 10.1038/nrendo.2010.41
75. Panel E, Chain F. Scientific opinion on acrylamide in food. EFSA J. (2015) 13:4104. doi: 10.2903/j.efsa.2015.4104
76. Gibis M. Heterocyclic aromatic amines in cooked meat products: causes, formation, occurrence, and risk assessment. Compr Rev Food Sci Food Saf. (2016) 15:269–302. doi: 10.1111/1541-4337.12186
77. Lerner A, Matthias T. Changes in intestinal tight junction permeability associated with industrial food additives explain the rising incidence of autoimmune disease. Autoimmun Rev. (2015) 14:479–89. doi: 10.1016/j.autrev.2015.01.009
78. Miclotte L, Van de Wiele T. Food processing, gut microbiota and the globesity problem. Crit Rev Food Sci Nutr. (2020) 60:1769–82. doi: 10.1080/10408398.2019.1596878
79. Whitehead JM, McNeill G, Smith JS. The effect of protein intake on 24-h energy expenditure during energy restriction. Int J Obes Relat Metab Disord. (1996) 20:727–32.
80. Dauncey MJ, Bingham SA. Dependence of 24 h energy expenditure in man on the composition of the nutrient intake. Br J Nutr. (1983) 50:1–13. doi: 10.1079/BJN19830066
81. Raben A, Agerholm-Larsen L, Flint A, Holst JJ, Astrup A. Meals with similar energy densities but rich in protein, fat, carbohydrate, or alcohol have different effects on energy expenditure and substrate metabolism but not on appetite and energy intake. Am J Clin Nutr. (2003) 77:91–100. doi: 10.1093/ajcn/77.1.91
82. Shahidi F. Nutraceuticals and functional foods: whole versus processed foods. Trends Food Sci Technol. (2009) 20:376–87. doi: 10.1016/j.tifs.2008.08.004
83. Monteiro CA. Nutrition and health. The issue is not food, nor nutrients, so much as processing. Public Health Nutr. (2009) 12:729–31. doi: 10.1017/S1368980009005291
84. Cordain L, Eaton SB, Sebastian A, Mann N, Lindeberg S, Watkins BA, et al. Origins and Evolution of the Western Diet: Health Implications for the 21st Century. (2010). p. 1–14. Available online at: https://pubmed.ncbi.nlm.nih.gov/15699220/ (accessed April 19, 2022).
85. Brand JC, Nicholson PL, Thorburn AW, Truswell AS. Food processing and the glycemic index. Am J Clin Nutr. (1985) 42:1192–6. doi: 10.1093/ajcn/42.6.1192
86. Raben A, Christensen NJ, Madsen J, Holst JJ, Astrup A. Decreased postprandial thermogenesis and fat oxidation but increased fullness after a high-fiber meal compared with a low-fiber meal. Am J Clin Nutr. (1994) 59:1386–94. doi: 10.1093/ajcn/59.6.1386
87. Roberts SB. High-glycemic index foods, hunger and obesity: is there a connection? Nutr Rev. (2000) 58:163–9. doi: 10.1111/j.1753-4887.2000.tb01855.x
Keywords: resting metabolic rate, ultra-processed foods (UPFs), inflammation, high-sensitivity C-reactive protein (hs-CRP), monocyte chemoattractant protein (MCP-1)
Citation: Bahrampour N, Shiraseb F, Noori S, Clark CCT and Mirzaei K (2022) Is there any putative mediatory role of inflammatory markers on the association between ultra-processed foods and resting metabolic rate? Front. Nutr. 9:932225. doi: 10.3389/fnut.2022.932225
Received: 29 April 2022; Accepted: 12 September 2022;
Published: 13 October 2022.
Edited by:
Mainul Haque, National Defence University of Malaysia, MalaysiaReviewed by:
José Cláudio Fonseca Moreira, Federal University of Rio Grande do Sul, BrazilCopyright © 2022 Bahrampour, Shiraseb, Noori, Clark and Mirzaei. This is an open-access article distributed under the terms of the Creative Commons Attribution License (CC BY). The use, distribution or reproduction in other forums is permitted, provided the original author(s) and the copyright owner(s) are credited and that the original publication in this journal is cited, in accordance with accepted academic practice. No use, distribution or reproduction is permitted which does not comply with these terms.
*Correspondence: Khadijeh Mirzaei, bWlyemFlaV9raEB0dW1zLmFjLmly; bWluYV9taXJ6YWVpMTAxQHlhaG9vLmNvbQ==
Disclaimer: All claims expressed in this article are solely those of the authors and do not necessarily represent those of their affiliated organizations, or those of the publisher, the editors and the reviewers. Any product that may be evaluated in this article or claim that may be made by its manufacturer is not guaranteed or endorsed by the publisher.
Research integrity at Frontiers
Learn more about the work of our research integrity team to safeguard the quality of each article we publish.