 Lin Zhang
 Yan Gao1,2
 Chuan Tong
 Jinsong Bao
- 1Hainan Institute, Zhejiang University, Yazhou Bay Science and Technology City, Sanya, China
- 2Institute of Nuclear Agricultural Sciences, Key Laboratory of Nuclear Agricultural Sciences of Ministry of Agriculture and Zhejiang Province, College of Agriculture and Biotechnology, Zhejiang University, Hangzhou, China
- 3College of Food Science and Technology, Zhejiang University of Technology, Hangzhou, China
Sweet potato flour is a key ingredient for the production of new food products worldwide, which imparts desired properties, nutritional value, antioxidants, and natural color to processed foods. However, little information regarding the functional properties of the sweet potato flour is available. In this study, the genetic diversity in the physiochemical, nutritional, and antioxidant properties of wholemeal flour from seven sweet potato varieties was investigated. The total phenolic content (TPC) of the free and bound fractions ranged from 13.85 to 90.74 mg gallic acid equivalent (GAE)/100 g and from 5.07 to 24.29 mg GAE/100 g, respectively. The average protein content of sweet potato was 5.41 g/100 g ranging from 3.40 to 8.60 g/100 g DW. The total amino acid content averaged 45.13 mg/g DW. The average contents of 12 mineral elements were in the order of K > P > Ca > Mg > Mn > Fe > Zn > Cu > Ni > Se > Cr > Cd. K and P contents were the highest among all accessions, which were positively correlated with most of the other minerals. The average starch content of sweet potato was 53.90 g/100 g DW, ranging from 31.68 to 64.90%. The peak viscosity (PV), hot paste viscosity (HPV), and cold paste viscosity (CPV) were in the range of 90.7–318.8 Rapid Visco Unit (RVU), 77.3–208.3 RVU, and 102.6–272.7 RVU, respectively. The hardness values and cohesiveness (Coh) varied among different sweet potatoes, with a range of 8.20–18.48 g and 0.22–0.68, respectively. The gelatinization onset, peak, conclusion temperatures, and enthalpy were in the ranges of 59.39–71.91°C, 70.19–88.40°C, 78.98–95.79°C, 1.85–5.65 J/g, respectively.
Introduction
Sweet potato (Ipomoea batatas L.) as a tuberous root belongs to the Convolvulaceae family, is seventh in the world’s crop statistics (after wheat, rice, corn, potatoes, cassava, and barley) (1), and is widely grown in more than 100 countries of tropical, subtropical, and temperate regions. The worldwide planting area and the total annual output of sweet potato reached 7.7689 × 10⁶ hm2 and 9.1821 × 10⁷ t in 2019 (2). Sweet potato is highly rich in starch, dietary fiber, minerals, vitamins, and phytochemicals with antioxidant activities, such as ascorbic acid, carotenoids, flavonoids, and other phenolic compounds (3, 4). Significant variation in nutrient composition, such as protein, β-carotene, calcium, magnesium, phosphorus, and potassium, was found among the sweet potato varieties (5). Abegunde et al. (6) found the flours and starches from different sweet potato cultivars differed in their amylose, amylopectin, ash and phosphorus contents, starch granule size, water absorption and solubility, retrogradation, crystallinity, and their thermal and pasting properties. In general, white-fleshed sweet potato had a high percentage of carbohydrate and reduced sugar and phenolics, and purple-fleshed sweet potato had high anthocyanin contents and antioxidant capacities, while yellow- and orange-fleshed ones had high levels of total protein, flavonoids, anthocyanins, and carotenoids (7).
The functional properties of sweet potato flours play an essential role in food manufacturing. Such properties decide the production and use of sweet potato flours as food ingredients for different foods and also regulate the processing and storage of these items (8). For example, functional properties, such as water absorption, oil absorption, and protein solubility, affect the product’s texture and appearance (9). Sajeev et al. (10) studied the textural and gelatinization characteristics of white sweet potato, cream, and orange sweet potato flours and they indicated that the considerable mealiness found in the white fleshed colored tubers could be a good option for infant food formulations. In their research with flours from 25 sweet potato cultivars, they reported that cultivars with restricted swelling and gelatinization might not be suitable for baked goods, where the final product volume is a quality parameter (10).
Mostly, sweet potatoes in China are consumed as fresh food or feed, and a few sweet potatoes are processed into starch or flour for vermicelli production (11). Processing and conversion of sweet potatoes into a staple form is also suggested as a choice to address the storage and transportation problems of fresh sweet potatoes. Processing of sweet potato not only increases the income of farmers and processors (12, 13) but also raises the awareness of the utilization potential of this crop worldwide (13, 14). However, little information about the genetic diversity in the physicochemical, antioxidant, and nutritional properties of wholemeal sweet potato flour is available.
In this study, seven sweet potato varieties were used to analyze the biodiversity in nutritional components and physicochemical properties of sweet potato wholemeal flour. The results of this study will provide a theoretical basis for the selection of suitable potato whole flour for food processing.
Materials and Methods
Materials
Seven pigmented sweet potato varieties (SP01 “Zheshu75,” SP02 “Zheshu 6025,” SP03 “Zheshu33,” SP04 “Zheshu 13,” SP05 “Zheshu 132,” SP06 “Zheshu 81,” and SP07 “Zheshu 259”) with different genetic background were used in this study. They were planted in early June 2017 in Anji, Zhejiang Province, China, and the root tubers were harvested in later October 2017. Harvested sweet potato roots of similar size were washed and peeled manually and were cut to pieces being before stored at –80°C. It is well known that different drying methods have different effects on the quality of sweet potato wholemeal flour (15–17). The freeze-drying method was applied to minimize the negative effects of the drying method on the physicochemical properties. The frozen sweet potato pieces were freeze dried for 48 h (vacuum freeze drier, Model FD-1A-135, Beijing, China). The dried sweet potato samples were ground into flour and stored at 4°C until the next analysis.
Extraction of Free/Soluble and Bound Phenolics
The extraction method of free/soluble phenolics was performed according to Ru et al. (18). Sweet potato flour (1.0 g) was defatted with 10 ml hexanes before to times extraction with 20 ml of 80% methanol at room temperature. The mixture solution was shaken for 30 min before centrifugation at 8,000 × g for 5 min. The supernatant was collected and adjusted its pH to 1.5–2.0 before being concentrated at 37°C using a rotary evaporator (IKA RV 10 digital V, Staufen, Germany). The concentrated solution was extracted with 20 ml ethyl acetate in triplicate. Each extract was combined and then evaporated using a rotary evaporator at 35°C. Finally, the evaporated extract was dissolved with 5 ml of 50% methanol, and the free phenolic acid solution was stored in the refrigerator at −20°C until the next analysis.
The solid residue after extracting soluble phenolics was subsequently used to extract bound phenolics. The residue was firstly digested with 20 ml of NaOH (4 M) for 2 h at room temperature. The mixture solution was adjusted to pH 1.5–2.0 using HCl before being extracted three times using 60 ml ethyl acetate. The pooled ethyl acetate extractions were evaporated and dissolved in methanol followed the same extraction procedures of free soluble phenolics.
Total Phenolic Content (TPC)
The TPC was measured using the colorimetric method with Folin–Ciocalteu reagent as described elsewhere (18). The TPC was expressed as milligrams of gallic acid equivalent (mg GAE) per 100 g of sweet potato.
Antioxidant Activity
1,1-diphenyl-2-picrylhydrazyl radical 2,2-diphenyl-1-(2,4,6-trinitrophenyl) hydrazyl (DPPH)⋅ assay was accomplished with the description of Ru et al. (18) with minor modification. Briefly, 200 μL of the diluted free or bound phenolics extracts were added to 3 mL OF DPPH⋅ radical solution (100 μM) with methanol. The reaction was kept in the dark at room temperature for 30 min, before measuring its absorbance at 517 nm. DPPH⋅ scavenging activity was expressed with inhibition (percent) of DPPH⋅ absorbance. The DPPH scavenging activity (%) of both samples and standard (Trolox) was calculated as follows: DPPH% = (1 – Asample/Acontrol) × 100%.
1,1-diphenyl-2-picrylhydrazyl radical 2,2-diphenyl-1-(2,4,6-trinitrophenyl) hydrazyl radical scavenging activities of crude extracts were expressed as μM of Trolox equivalents (TE) per gram of sweet potato flour using a standard curve of Trolox.
The assay of 2,2-azino-bis-3-ethylbenzothiazoline-6-sulphonic acid diammonium salt (ABTS) + radical cation scavenging activity was conducted according to the method described in Ru et al. (18). Firstly, 7 mM of ABTS and 2.45 mM of potassium per sulfate were mixed at room temperature in dark for 20 h to generate ABTS+ radical cation. Then, methanol was used to dilute the ABTS+ mixture to an absorbance around 0.700 at 734 nm. Finally, 3.9 ml of ABTS + solution was added to 0.1 ml of extracts. The reaction mixture was kept at room temperature for 6 min, then the absorbance was recorded at 734 nm. Trolox (0.5 mM) was served as a reference antioxidant.
Starch and Protein Content
The content of total starch was determined with an acid hydrolysis method (GB 5009.9–2016). Briefly, about 2 g of sweet potato flour was weighed and placed into a slow filter paper funnel. In total, 50 ml of petroleum ether was added to remove lipids, before moving soluble sugars with 150 ml 85% ethanol. The filter residue was placed in a 250 ml flask, added 30 ml of hydrochloric acid and supplemented with distilled water to 100 ml, inserted into a condensing tube, refluxed in a boiling water bath for 2 h, cooled to room temperature, neutralized with sodium hydroxide solution until slightly acidic, and filtered through qualitative filter paper or skim cotton in a 500 ml of volumetric flask. The reducing sugar content of the reserve solution was determined by using Fehling’s solution and then was converted to starch content. Protein content was carried out according to the Kjeldahl method with Kjeltec-Foss 2400 Auto-Analyzer (Foss, Denmark). The conversion coefficient of nitrogen to protein was 6.25.
Amino Acid Content
Extraction of sweet potato amino acid was followed by the method of Xu et al. (19). Free amino acids were extracted from 0.5 g flour samples with 300 ml 3% sulfosalicylic acid by vigorously shaking for 1 h. The suspension was then centrifuged at 10,000 × g for 10 min at 4°C. After three such extractions, the extracts were combined, filtered with 0.45 μm syringe filters, and stored at 4°C for analysis using the ninhydrin method with an automatic amino acid analyzer (L-8900, Hitachi, Tokyo, Japan).
Mineral Content
Sweet potato flour (0.5 g) was placed into a graduated polyethylene vial. The concentrated nitric acid (5.0 ml) and H2O2 (1.0 ml) were added before the polyethylene watch glass was covered and stood overnight. Samples were digested at a maximum temperature of 130°C until the solution became clear. The digests were diluted with deionized H2O to 50.0 ml. The minerals in the diluted solution were analyzed by an ICAP 6000 inductively coupled plasma optical emission spectrometer (ICP-OES) (Thermo Scientific, Cambridge, United Kingdom).
Pasting Properties
The viscosity characteristics of sweet potato flour were tested with an RVA instrument (RVA, Model 4500, Perten Instruments, Hägersten, Sweden). In total, 3.0 g of sweet potato flour and 25 ml of double deionized H2O were added into the aluminum can and were mixed well. Peak viscosity (PV), hot paste viscosity (HPV), cold paste viscosity (CPV), and two derivative parameters, i.e., breakdown (BD = PV − HPV) and setback (SB = CPV − HPV), were obtained. The viscosity was measured in Rapid Visco Units (RVU).
Texture Properties
After testing the RVA of the whole sweet potato powder, the aluminum sample tube was sealed with Parafilm ™ and placed in a refrigerator at 4°C for 24 h. Then the TA-XT2i texture analyzer (Stable Micro Systems, Surrey, United Kingdom) was used to determine the texture characteristics of the whole sweet potato flour. The texture analyzer uses a probe with a diameter of 5 mm to perform the test repeatedly four times, and the program was set to the displacement distance of 10 mm and the probe descent speed of 1 mm/s (20). In the texture map, the highest peak of the curve is called the hardness (HD), and the ratio of the area of the second compression to the first compression is called the cohesiveness (Coh).
Thermal Properties
The gelatinization properties of the whole sweet potato powder were measured using a differential scanning calorimeter (DSC-2920, TA Instruments, United States). First, weigh 2.0 mg whole sweet potato powder and mix it with 6 μl of ultrapure water in an aluminum pan, seal the aluminum pan, and let it stand at room temperature for 2 h. The differential scanning calorimeter program settings were as follows: the nitrogen flow rate is set to 50 ml/min, the temperature rises from 30 to 110°C, and the heating rate is 10°C/min. An empty pan was sealed as a reference sample. Parameters, such as onset temperature (To), peak temperature (Tp), conclusion temperature (Tc), and enthalpy of gelatinization (ΔH) were determined using the Universal Analysis (version 4.4A).
Statistical Analysis
The results were presented as mean ± standard deviation (SD), in which all the measurements were accomplished at least in duplicate. Duncan’s multiple range test of ANOVA and correlation analysis were conducted using the SPSS 20.0 software (SPSS, Inc., Chicago, IL, United States).
Results and Discussion
Total Phenolic Content
Phenolic compounds and flavonoids are the most common phenolic compounds as free and bound forms in nature (21). The TPC of the free fraction was much higher than the bound fraction in sweet potatoes (Table 1). The TPC of the free and bound fractions ranged from 13.85 to 90.74 mg GAE/100 g and from 5.07 to 24.29 mg GAE/100 g, respectively. The TPC of free fraction in SP05 was the highest among these sweet potato samples. In numerical terms, the TPC levels of the free and bound fractions of sweet potato were the lowest in SP01 and SP07. The TPC levels of sweet potatoes in this study (21.25–104.40 mg GAE/100 g) were greatly lower than that of Virginia-grown sweet potatoes (140.00–1230.00 mg GAE/100 g) (22). The variations may be attributed to the variety and extraction method of TPC. Furthermore, the TPC content of sweet potato was generally based on the soluble phenolic acid extraction and ignoring the bound phenolic acids (23). Here, our results showed that the bound phenolic content could account for 13.08–37.87% of the TPC.
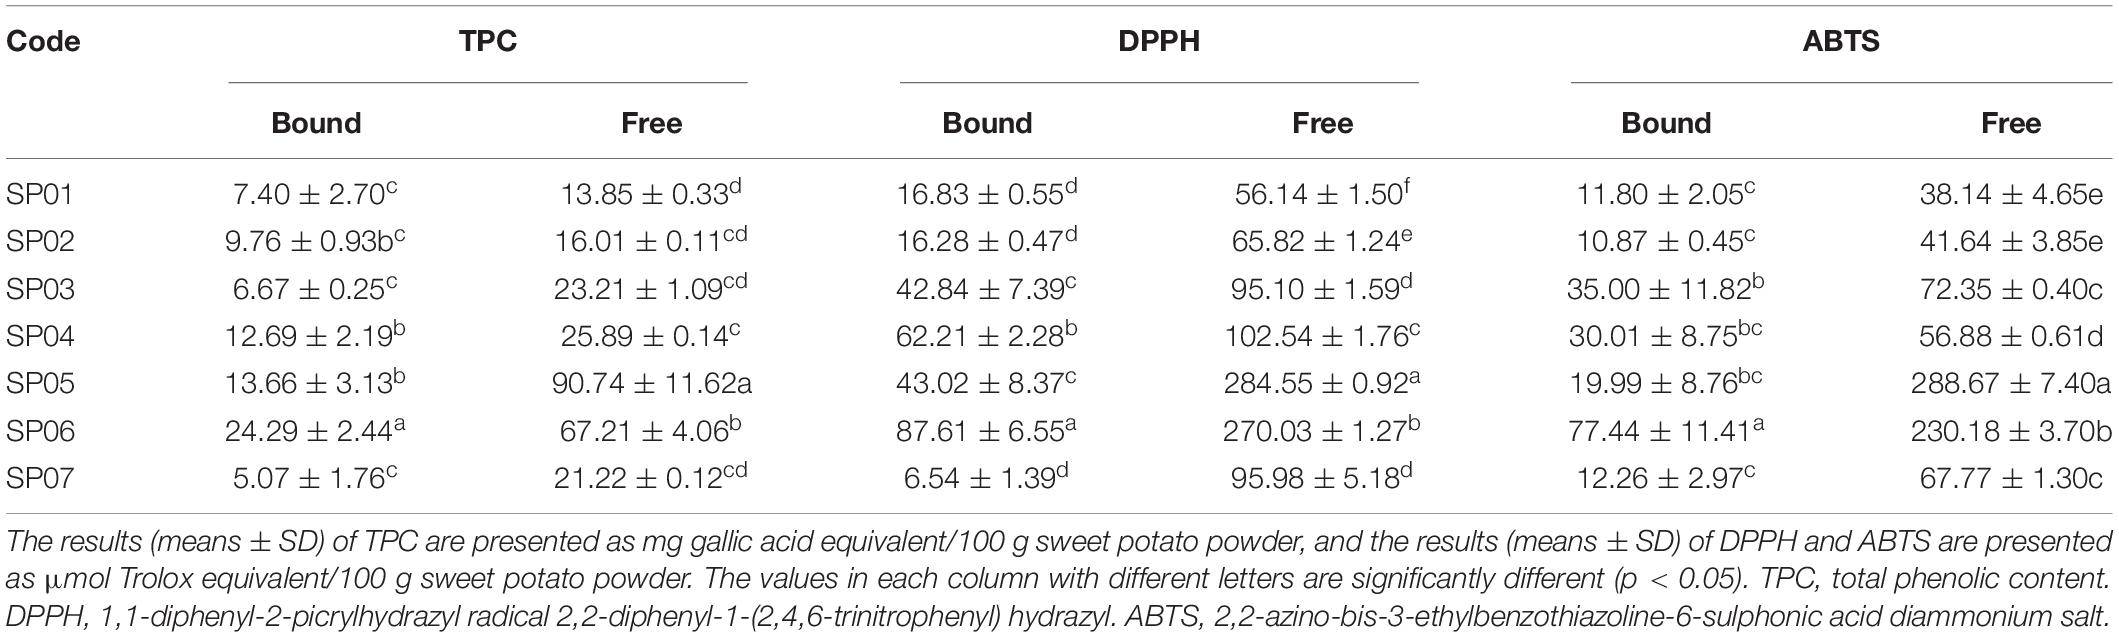
Table 1. TPC, DPPH, and ABTS radical scavenging of free and bound fractions of sweet potatoes.
Antioxidant Capacity and Its Relations With Total Phenolic Content
In vitro antioxidant activity of sweet potato extracts was evaluated by DPPH⋅ and ABTS + free-radical scavenging capacities. Results showed that DPPH⋅ and ABTS + radical scavenging capacity of sweet potatoes differed significantly among varieties (Table 1). Among all the samples, the DPPH⋅ and ABTS + radical scavenging activities of the bound fraction were much lower than those of the free fraction. The DPPH⋅ radical scavenging activities of free and bound fractions ranged from 56.14 to 284.55 and from 6.54 to 87.61 μM TE/100 g, respectively. The ABTS + radical cation scavenging activity of free and bound fractions ranged from 38.14 to 288.64 and from 10.87 to 77.44 μM TE/100 g, respectively. Results showed for the free fraction that SP05 had a much higher antioxidant capacity and SP06 had a much higher antioxidant capacity of bound fraction.
Pearson correlations between the TPC of free and bound fractions and total antioxidant activities were analyzed to reveal the contribution of TPC to the antioxidant activity (Table 2). No matter what fractions, free or bound, the correlation coefficients between TPC, DPPH, and ABTS were higher than 0.83, indicating that the higher the phenolic content, the higher the antioxidant activity. The correlations between free and bound fractions were significant (p < 0.01). These findings were similar to the previous studies (22–24).
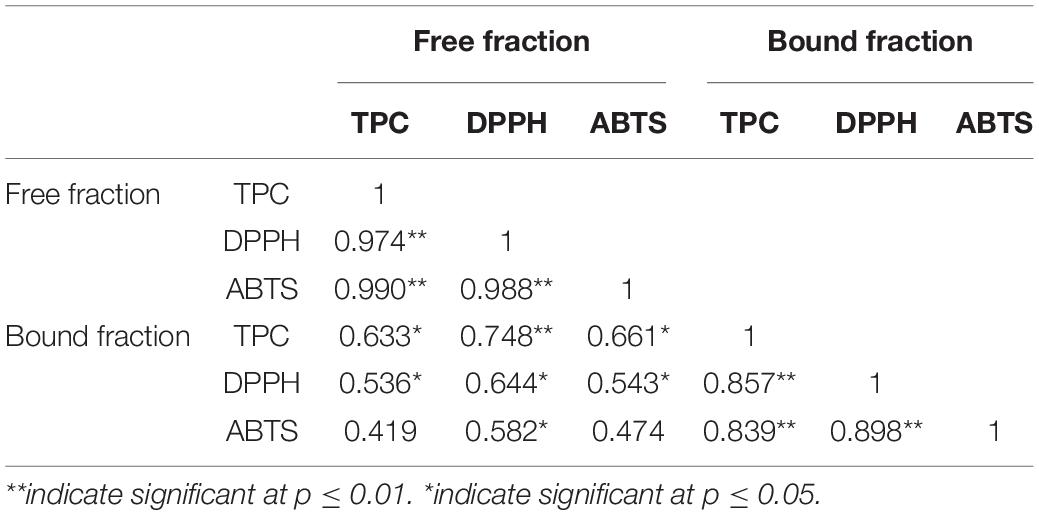
Table 2. Pearson pairwise correlations between TPC, DPPH, and ABTS in the free and bound fractions in the seven sweet potatoes.
The Starch and Protein Content
Starch was the principal carbohydrate in seven sweet potatoes with an average content of 53.90%, ranging from 31.68 to 64.90% (Figure 1A). The starch content of different sweet potato flours was quite different. The average starch content of sweet potatoes in this study was similar to those of Virginia-grown varieties (55.1% on average) (22). The starch content of SP01 was 64.90%, which was significantly higher than the other samples (p < 0.05) and was approximately two times higher than the values in SP06. These results were different from other studies in that total starch content varies between 57 and 90% (4), 55.76 and 83.65% (25), and 36.6 and 75.0% (26), due to different regions and varieties. In a previous study, Tong et al. (27) investigated the amylose content (AC) of the same set of sweet potato varieties used in this study and found that AC varied from 18.63 (SP02) to 20.45% (SP05).
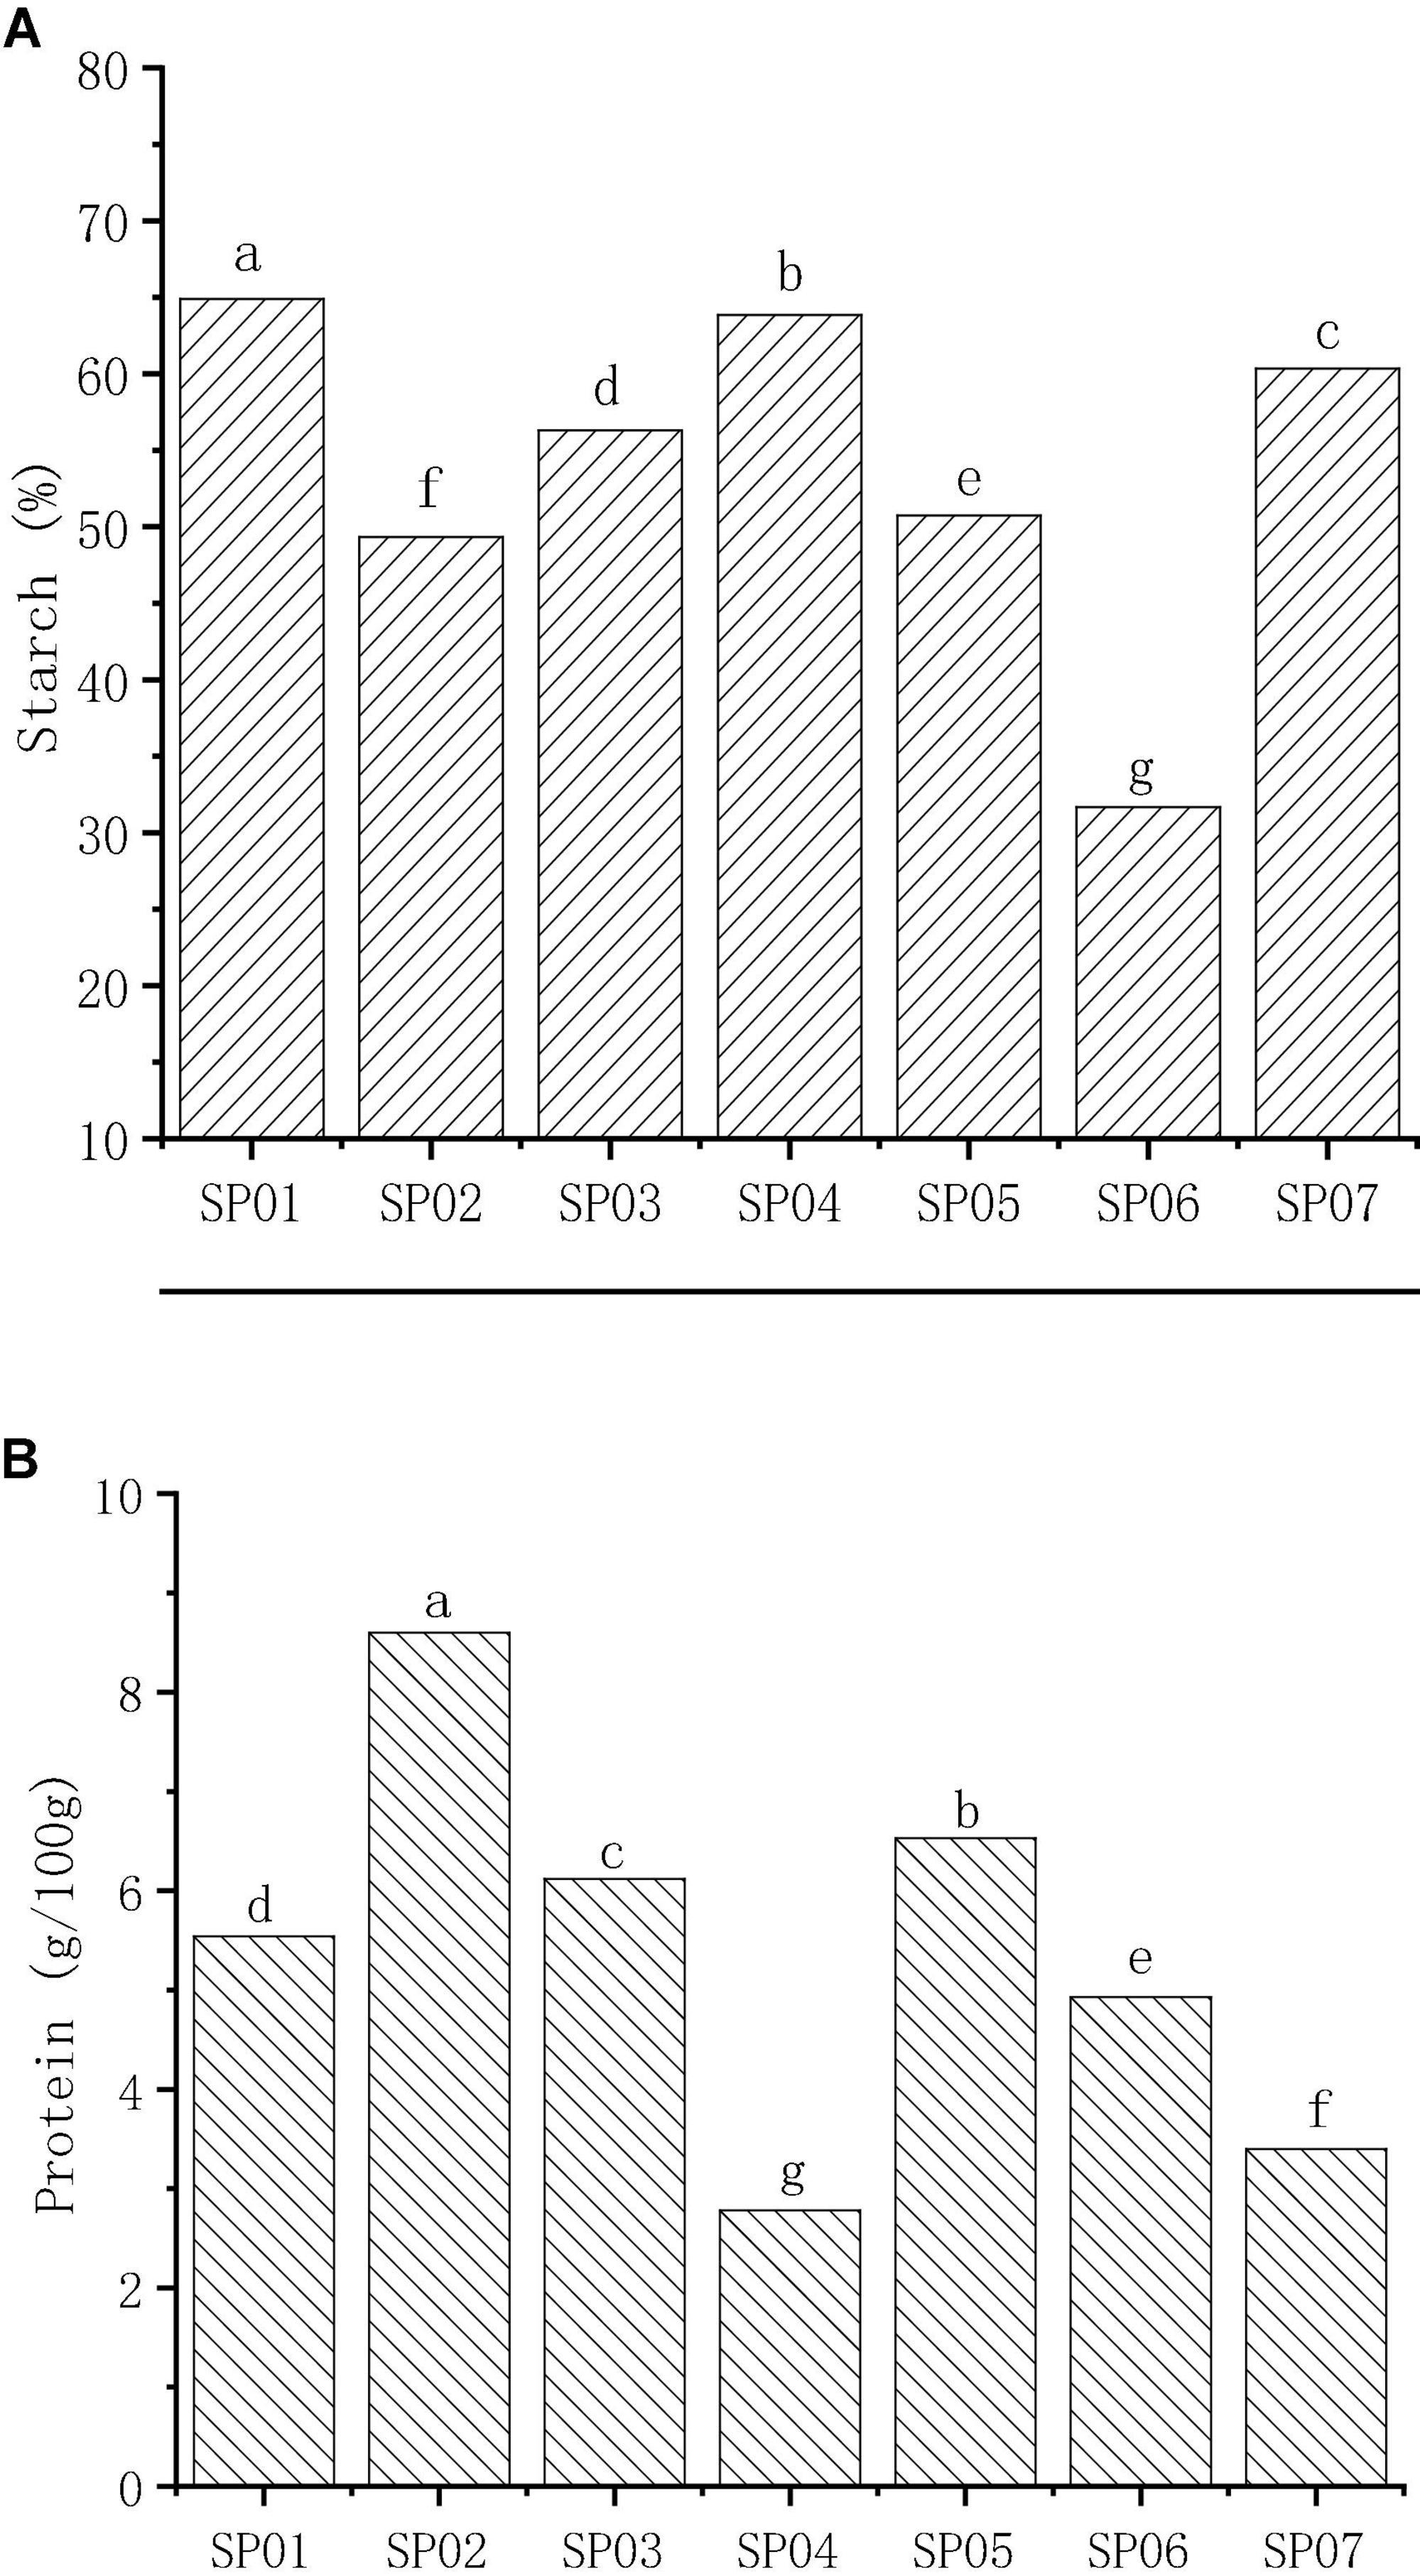
Figure 1. The content of starch (A) and protein (B) in different varieties of sweet potato powder. Different letters indicate significant differences (p < 0.05).
The mean total protein content of sweet potato was 5.41 g/100 g DW with a range of 2.78–8.60 g/100 g DW (Figure 1B), which was consistent with the results of Osundahunsi et al. (28). The protein content in different sweet potato flours was 1.0–14.2% (4), 1.9–2.6% (29), and 2.4–2.9% (30), dependent on the environmental conditions. It is found that the total protein content differs significantly between different sweet potato varieties. SP02 had the highest content (8.60 mg/100 g), and SP04 had the lowest content (2.78 mg/100 g). This shows that among the seven kinds of sweet potato, SP02 is a high-protein variety.
Amino Acid Contents
The content of 17 free amino acids and gamma-aminobutyric acid (GABA) in sweet potato flour was detected (Table 3). The average total amino acid content of seven sweet potato varieties was 45.13 mg/g, of which SP02 had the highest content (77.07 mg/g), and SP04 had the lowest content (20.44 mg/g). Hou et al. (31) reported free amino acids accounted for less than 3.1% of the total amino acids in corn kernels, peanuts, pistachios, soybeans, wheat, and white rice, but 34 and 28% in potatoes and sweet potatoes, respectively. This is inconsistent with our results and might be attributed to the different species selected. Aspartic acid (Asp) and glutamic acid (Glu) were the two most abundant amino acids in sweet potatoes (Table 3). The average content of GABA in these sweet potatoes was 0.19 mg/g, of which SP06 had the highest GABA content (0.25 mg/g), and the GABA content of SP02 was the lowest at 0.12 mg/g.
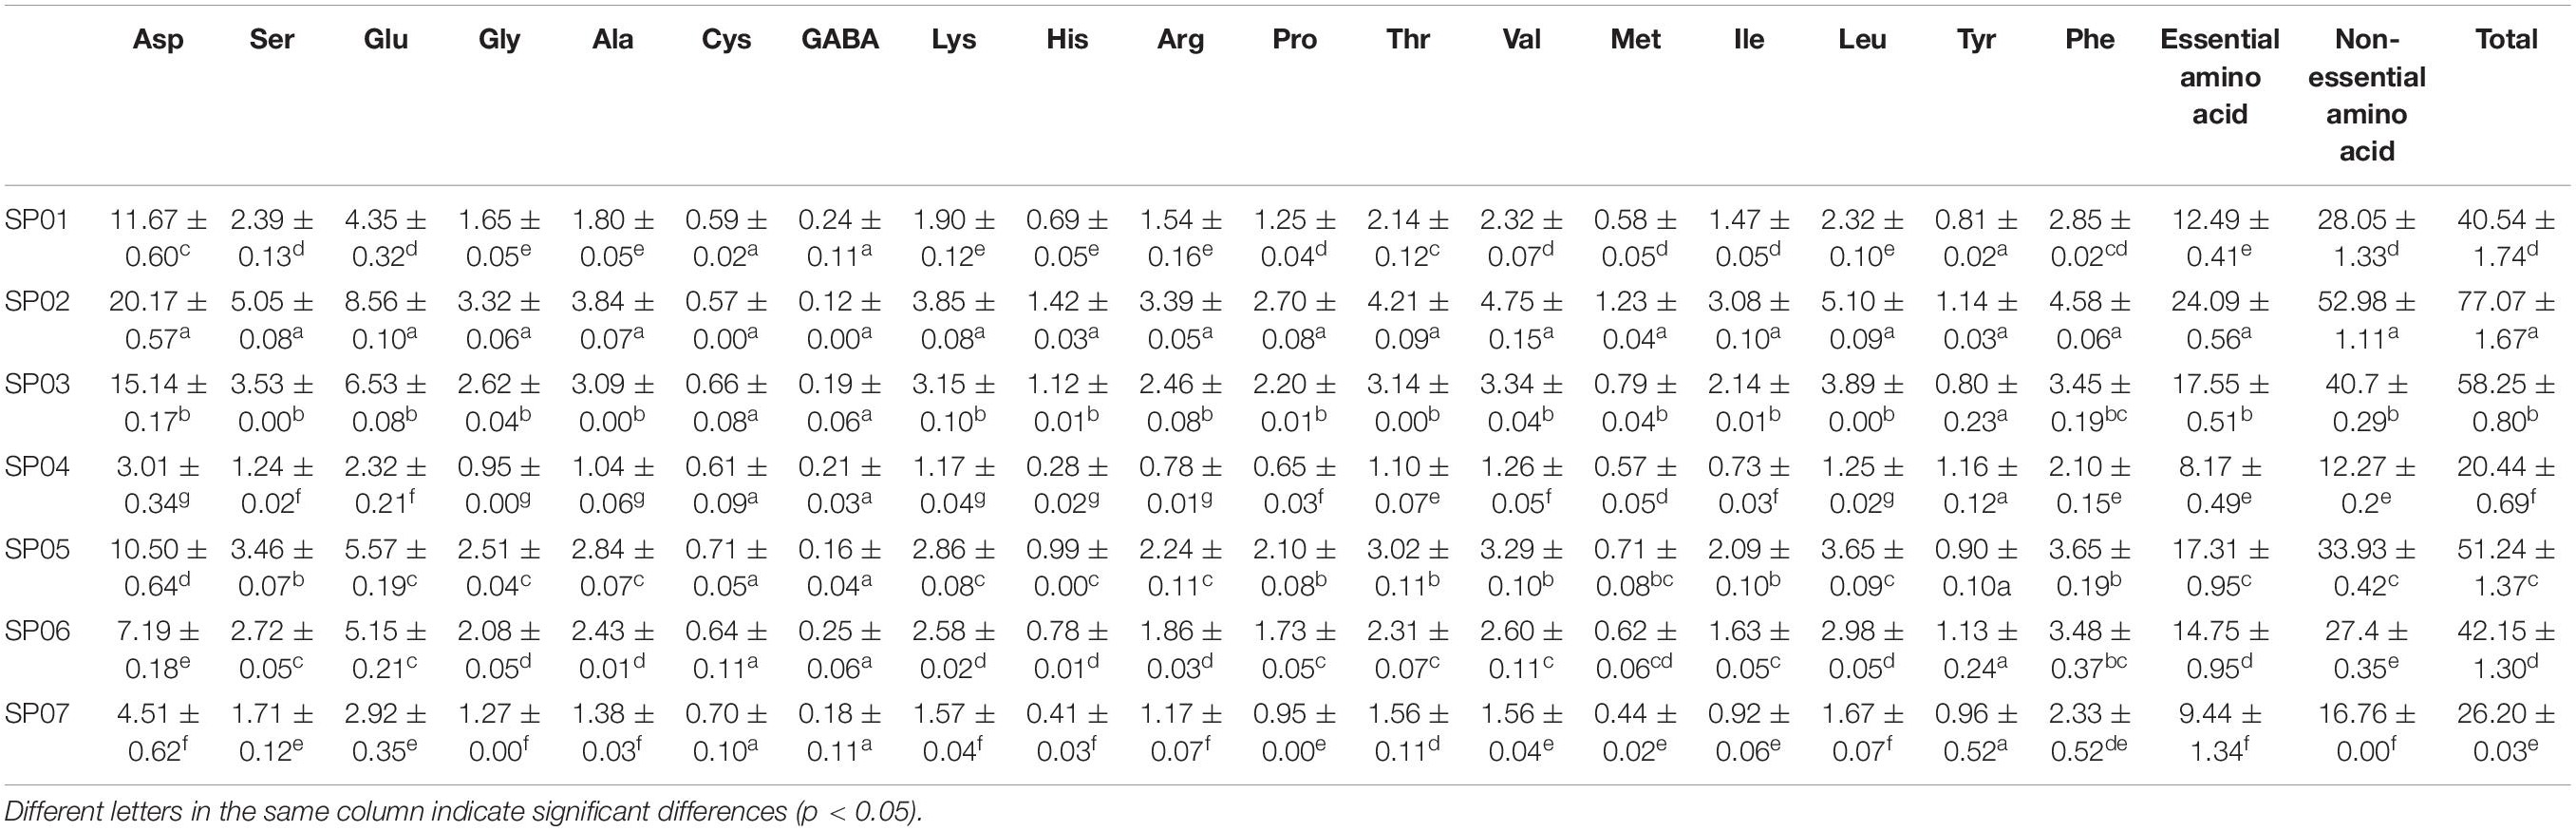
Table 3. Amino acid content of sweet potato powder with different varieties (mg/g).
The total amino acids were divided into essential and semi-essential amino acid (EAA) and non-EAA groups. It is found that the EAAs and non-EAAs differ significantly between different sweet potato varieties. For sweet potato samples, SP02 (24.09 mg/g) and SP04 (8.17 mg/g) exhibited the highest and lowest EAA contents. The same was observed for the non-essential contents at 52.98 and 12.27 mg/g, respectively. Ju et al. (32) observed that sweet potato variety of Jishu 4 had the highest EAA content at 12.39 mg/g, while a variety of Xushu 18 had the lowest EAA content at 6.24 mg/g. This indicated that the amino acid composition of SP02 was relatively balanced, and the protein content level was high.
The nutritional values of sweet potatoes were further evaluated by the limiting amino acids (32). Among the seven sweet potato varieties, the limiting amino acids are cysteine (Cys) and methionine (Met). The amino acid limiting the biological value of sweet potato protein was mainly lysine, followed by arginine and methionine (1). The difference in the results is due to the different genotypes. The average contents of the Cys and Met were 0.64 and 0.71 mg/g, respectively, of which SP05 has maximum Cys content (0.71 mg/g). In addition to these two restricted amino acids, the contents of tyrosine (Tyr) and histidine (His) are also low, and the average values were 0.98 and 0.81 mg/g, respectively.
Mineral Contents
The content of 12 mineral elements was determined. A large number of elements were K and P, and the medium elements were Mg and Ca, and the trace elements were Fe, Zn, Cu, Mn, Cr, Ni, Se, and Cd (Table 4). The average content of minerals of these seven sweet potatoes was in the order K > P > Ca > Mg > Mn > Fe > Zn > Cu > Ni > Se > Cr > Cd. In detail, the average content of K was 10,641 mg/kg with a range of 5885.50–18,286 mg/kg. The mean of P was 1343.3 mg/kg with a range of 803.6–2158.1 mg/kg. The content of K was about 2.73–22.75 times of P content. The average content of Mg was 566.32 mg/kg, ranging from 301.45 to 928.05 mg/kg. The average content of Ca was 738.8 mg/kg, and the amplitude of change was 401.25–1260.35 mg/kg. Among the trace elements, the contents of Mn, Fe, Zn, and Cu were relatively high, with the average contents of 23.79, 15.79, 10.42, and 6.26 mg/kg, respectively; the contents of Ni, Se, Cr, and Cd were relatively low, with average levels of 1.19, 0.049, 0.040, and 0.020 mg/kg. Therefore, sweet potato was a promising flour for supplementary claims in the nutraceutical and pharmaceutical industries (8). However, our results were inconsistent with Ju et al. (32), who obtained that the most abundant macro-element was K (196.39–531.29 mg 100 g–1 DW) and Ca (190.70–405.82 mg 100 g–1 DW) in ten sweet potato cultivars.
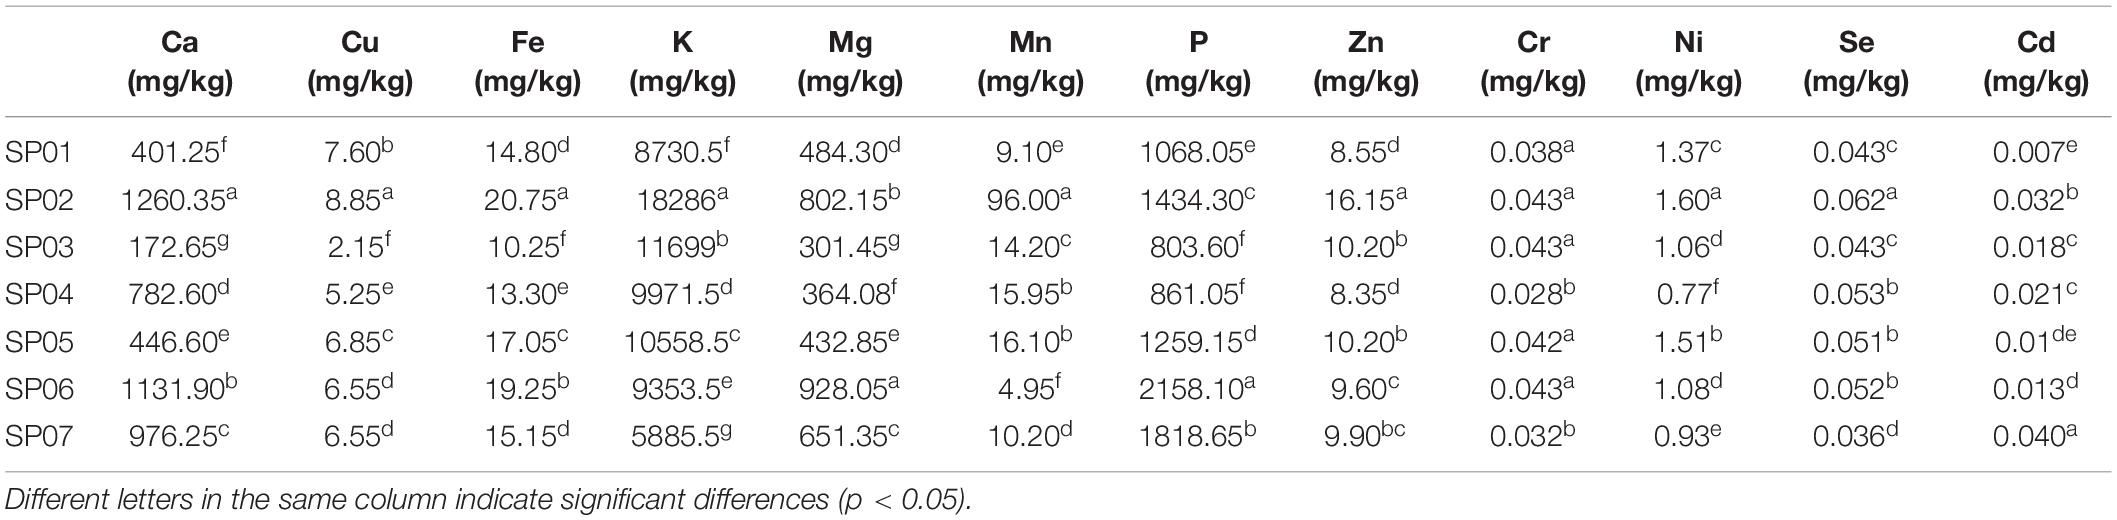
Table 4. The mineral content of sweet potato powder with different varieties.
Pasting Viscosity Characteristics
The viscosity characteristics of seven sweet potato flours are shown in Table 5. The range of PV was 90.7–318.8 RVU, where SP06 had the lowest PV value, and SP04 had the highest PV value. Aina et al. (33) obtained the PV with 9.6–100.2 RVU, which could be attributed to different drying methods. Air drying in an oven as carried out in the study of Aina et al. (33) might cause starch degradation, leading to low PV. The PV was reported to correlate negatively with the AC of the starch in flours. Amylose affected the swelling capacity of starch by restricting it and hence lowering the PV (34). It was generally observed that flours with high AC also showed low PV in these samples (27).
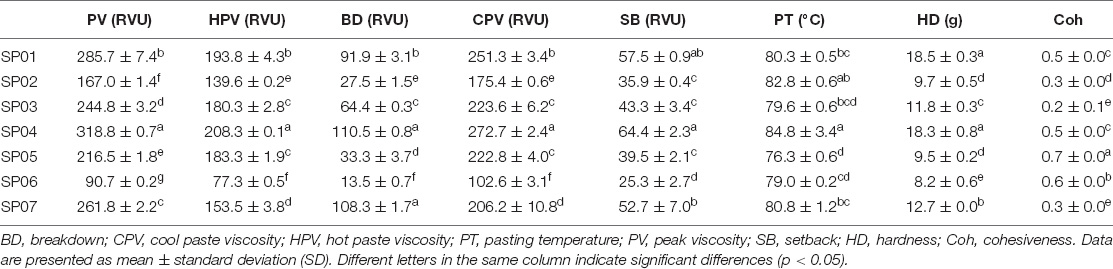
Table 5. Pasting properties and textural properties of different varieties of sweet potato powder.
Hot paste viscosity (HPV) is the minimum viscosity value in the constant temperature phase of the RVA profile measuring the ability of paste to withstand breakdown during cooling (9). Here, the HPV ranged from 77.3 (SP06) to 208.3 RVU (SP04). Fetuga et al. (12) reported 4.3–140.0 RVU of HPV for sweet potato flour prepared from different varieties and drying methods. Olatunde et al. (25) reported a range of 7.1–145.8 RVU of HPV for sweet potato flours prepared from different varieties, pretreatments, and drying methods. High HPV values may represent low cooking losses and the superior eating quality (35).
Cold paste viscosity (CPV) indicates the ability of a material to gel or paste after cooking or cooling in actual use (36) and determines a particular starch-based food quality (9). The range of CPV values was 102.6–272.7 RVU, the variety with the highest CPV value was SP04, and the variety with the lowest CPV value was SP06. Olatunde et al. (25) reported a range of 10.2–225.5 RVU of CPV for sweet potato flours prepared from different varieties, pretreatments, and drying methods. A high value of CPV has been attributed to the aggregation of amylose and a low final viscosity indicates the resistance of the paste to shear stress during stirring (35). The CPV of sweet potato flour from various varieties and at different processing methods has been collated by Fetuga et al. (12) and the values vary considerably not only among varieties but also at different processing methods.
Breakdown viscosity (BD) is an indicator of the paste’s resistance to disintegration in response to heat and shear (9). It has occurred as a result of holding slurries at high temperature and the difference between the PV and the trough viscosity (37). In this study, the range of BD values was 13.5–110.5 RVU. Fetuga et al. (12) found that BD has ranged from 0.5 RVU of American orange-fleshed to 92.3 RVU of Nigerian yellow-fleshed as compared to 34.9 RVU of Ugandan yellow-fleshed varieties. The BD in this study is similar to that reported by Olatunde et al. (25) who reported it in the range of 11.0–125.3 RVU but higher than that reported by Aina et al. (33) who reported it in the range of 3.3–50.2 RVU. A lower breakdown value of the sample indicated higher stability of starch under thermal conditions (9, 36) and higher stability of its paste (38).
Gel Textural Properties
The texture characteristics of sweet potato powder are listed in Table 5. The HD value was in the range of 8.20–18.48 g, among which SP06 had the lowest HD value, and the HD value in SP01 was the highest. The range of Coh was from 0.22 (SP03) to 0.68 (SP05). In this experiment, the difference in Coh was very large. This may be caused by the differences in other compounds in different sweet potato whole powders, such as protein and cellulose. It showed that there were both high-cohesive varieties and low-cohesive varieties among the seven types of sweet potatoes.
Gelatinization Properties
According to the gelatinization endothermic peak in the DSC curve, the gelatinization onset temperature (To), peak temperature (Tp), conclusion temperature (Tc), and gelatinization enthalpy (ΔH) can be calculated. Initial temperatures were closed to those obtained by Giselle et al. (39), which ranged from 59.39 (SP06) to 71.91°C (SP04), while Tp was higher than those obtained by Guo et al. (40), between 70.19 (SP01) and 88.40°C (SP07). The range of Tc value was 78.98–95.79°C, higher than those found by Ndangui et al. (30). SP02 had the highest Tc value, and SP03 had the lowest Tc value (Table 6). Varietal differences, environmental conditions, and the experimental protocols, such as the level of moisture, sample preparation, rate of heating, and instrument, were the factors affecting the gelatinization temperatures values (41). The lower values of enthalpy were noticed in this study, as compared to those reported by Ndangui et al. (30). The range of ΔHg was 1.85–5.65 J/g. This indicated that lesser energy was needed to break the intermolecular bonds in starch granules of such flour to achieve gelatinization (38).
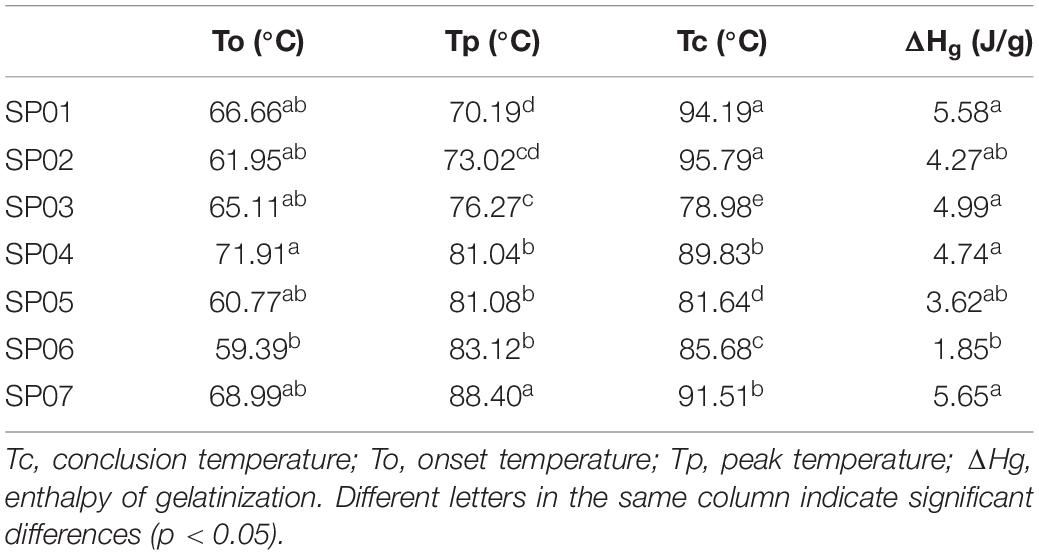
Table 6. Gelatinization properties of different varieties of sweet potato powder.
Conclusion
In this study, the nutrition quality and physicochemical properties (viscosity, texture, and gelatinization) of seven sweet potato flours were analyzed for food processing. Results showed that the SP05 had the highest phenolic acid content and SP06 had the highest antioxidant activity among these varieties, reflecting the genetic diversity of sweet potato in phenolic substances. However, SP02 had the highest content of total protein, total amino acids, and EAAs, while SP05 and SP03 had the highest content of two limiting amino acids (Cys and Met). The K and P were the two most abundant elements of sweet potatoes, which was positively correlated with each mineral. The starch content of SP01 and SP04 was higher than 60% and had higher viscosity, which may have wide application in food processing. These results provided a theoretical basis for the selection of suitable sweet potato flour for food processing.
Data Availability Statement
The original contributions presented in this study are included in the article/supplementary material, further inquiries can be directed to the corresponding authors.
Author Contributions
JB and CT contributed to the conception and design of the study. LZ, YG, BD, and WR performed the experiments and analyzed the data. LZ and CT wrote the first draft of the manuscript. YG and JB wrote sections of the manuscript. All authors contributed to manuscript revision, read, and approved the submitted version.
Funding
This research was financially supported by the Starry Night Science Fund of Zhejiang University Shanghai Institute for Advanced Study, grant no. SN-ZJU-SIAS-0012; and the National Natural Science Foundation of China (32072282).
Conflict of Interest
The authors declare that the research was conducted in the absence of any commercial or financial relationships that could be construed as a potential conflict of interest.
Publisher’s Note
All claims expressed in this article are solely those of the authors and do not necessarily represent those of their affiliated organizations, or those of the publisher, the editors and the reviewers. Any product that may be evaluated in this article, or claim that may be made by its manufacturer, is not guaranteed or endorsed by the publisher.
Acknowledgments
We thank Chao Xiang from the Zhejiang Academy of Agricultural Sciences for providing the sweet potato varieties.
References
1. Sawicka B, Pszczółkowski P, Krochmal-Marczak B, Barbaś P, Özdemir FA. The effects of variable nitrogen fertilization on amino acid content in sweet potato tubers (Ipomoea batatas L.) cultivated in central and eastern Europe. J Sci Food Agric. (2020) 100:4132–8. doi: 10.1002/jsfa.10452
2. FAO. FAO Statistics. (2021). Available online at: http://www.fao.org/faostat/en/#data/QC
3. Rath D, George J, Mukherjee A, Naskar SK, Mohandas C. Antibacterial activity of leaf and tuber extract of orange, purple flesh antioxidants rich sweet potato (Ipomoea batatas (L.)). Merit Res J Food Sci Technol. (2016) 4:67–71.
4. Van Hal M. Quality of sweet potato flour during processing and storage. Food Rev Int. (2000) 16:37–41. doi: 10.1081/FRI-100100280
5. Tang Z, Wei M, Chen X, Shi X, Zhang A, Li H, et al. Characters and comprehensive evaluation of nutrient quality of sweetpotato storage root with different flesh colors. Sci Agric Sin. (2014) 47:1705–14.
6. Abegunde OK, Mu TH, Chen JW, Deng FM. Physicochemical characterization of sweet potato starches popularly used in Chinese starch industry. Food Hydrocoll. (2013) 33:169–77. doi: 10.1016/j.foodhyd.2013.03.005
7. Tang Y, Cai W, Xu B. Profiles of phenolics, carotenoids and antioxidative capacities of thermal processed white, yellow, orange and purple sweet potatoes grown in Guilin, China. Food Sci Hum Wellness. (2015) 4:123–32. doi: 10.1016/j.fshw.2015.07.003
8. Dereje B, Girma A, Mamo D, Chalchisa T. Functional properties of sweet potato flour and its role in product development: a review. Int J Food Prop. (2020) 23:1639–62. doi: 10.1080/10942912.2020.1818776
9. Ojo MO, Ariahu CC, Chinma EC. Proximate, functional and pasting properties of cassava starch and mushroom (Pleurotus Pulmonarius) flour blends. Am J Food Sci Technol. (2017) 5:11–8.
10. Sajeev MS, Sreekumar J, Vimala B, Moorthy SN, Jyothi AN. Textural and gelatinization characteristics of white, cream, and orange fleshed sweet potato tubers (Ipomoea Batatas L.). Int J Food Prop. (2012) 15:912–31. doi: 10.1080/10942912.2010.509895
11. Wang X, Wang J, Liu H, Zhao L, Wang Y, Wu X, et al. Improving the production efficiency of sweet potato starch using a newly designed sedimentation tank during starch sedimentation process. J Food Process Preserv. (2020) 2020:e14811. doi: 10.1111/jfpp.14811
12. Fetuga G, Henshaw F, Idowu M. Effect of variety and processing method on functional properties of traditional sweet potato flour (“Elubo”) and sensory acceptability of cooked paste (“Amala”). Food Sci Nutr. (2014) 2:682–91. doi: 10.1002/fsn3.161
13. Julianti E, Rusmarilin H, Yusraini E. Functional and rheological properties of composite flour from sweet potato, maize, soybean and xanthan Gum. J Saudi Soc Agric Sci. (2017) 16:171–7. doi: 10.1016/j.jssas.2015.05.005
14. Olubunmi AA, Abraham IO, Mojirade LA, Afolake B, Kehinde OE. Development, evaluation and sensory quality of orange fleshed sweet potato (Ipomoea Batatas Lam) extruded pasta products. Croat J Food Technol Biotechnol Nutr. (2017) 12:83–9.
15. Li L, Zhang M, Bhandari B. Influence of drying methods on some physicochemical, functional and pasting properties of Chinese yam flour. LWT. (2019) 111:182–9. doi: 10.1016/j.lwt.2019.05.034
16. Qiu G, Jiang YL, Deng Y. Drying characteristics, functional properties and in vitro digestion of purple potato slices dried by different methods. J Integr Agric. (2019) 18:2162–72. doi: 10.1016/S2095-3119(19)62654-7
17. Yang Z, Zhang Y, Wu Y, Ouyang J. The role of drying methods in determining the in vitro digestibility of starch in whole chestnut flour. LWT. (2022) 153:112583. doi: 10.1016/j.lwt.2021.112583
18. Ru WD, Pang YH, Gan YR, Liu Q, Bao JS. Phenolic compounds and antioxidant activities of potato cultivars with white, yellow, red and purple flesh. Antioxid. (2019) 8:419. doi: 10.3390/antiox8100419
19. Xu YJ, Ying YN, Ouyang SH, Duan XL, Sun H, Jiang SK, et al. Factors affecting sensory quality of cooked japonica rice. Rice Sci. (2018) 25:330–9. doi: 10.1021/acs.jafc.6b00083
20. Bao JS, Shen SQ, Sun M, Corke H. Analysis of genotypic diversity in the starch physicochemical properties of nonwaxy rice: apparent amylose content, pasting viscosity and gel texture. Starch Stärke. (2006) 58:259–67. doi: 10.1002/star.200500469
21. Nardini M, Ghiselli A. Determination of free and bound phenolic acids in beer. Food Chem. (2004) 84:137–43. doi: 10.1016/S0308-8146(03)00257-7
22. Arrieyana C, Jaron W, Edward S, Jody A, Erin F, Leonard G, et al. Physiochemical, nutritional and antioxidant properties of fourteen Virginia-grown sweet potato varieties. J Food Meas. (2017) 11:1333–41. doi: 10.1007/s11694-017-9511-8
23. Makori SI, Mu TH, Sun HN. Total polyphenol content, antioxidant activity, and individual phenolic composition of different edible parts of 4 sweet potato cultivars. Nat Prod Commun. (2020) 15:1–12.
24. Shadrack IM, Mu TH, Sun HN. Total polyphenol content, antioxidant activity, and individual phenolic composition of different edible parts of 4 sweet potato cultivars. Nat Prod Commun. (2020) 15:1–12.
25. Olatunde GO, Henshaw FO, Idowu MA, Tomlins K. Quality attributes of sweet potato flour as influenced by variety, pretreatment and drying method. Food Sci Nutr. (2016) 4:623–35. doi: 10.1002/fsn3.325
26. Jangchud K, Phimolsiripol Y, Haruthaithanasan V. Physicochemical properties of sweet potato flour and starch as affected by blanching and processing. Starch Stärke. (2003) 55:258–64. doi: 10.1002/star.200390053
27. Tong C, Ru WD, Wu LH, Wu WC, Bao JS. Fine structure and relationships with functional properties of pigmented sweet potato starches. Food Chem. (2020) 311:126011. doi: 10.1016/j.foodchem.2019.126011
28. Osundahunsi OF, Fagbemi TN, Kesselman E, Shimoni E. Comparison of the physicochemical properties and pasting characteristics of flour and starch from red and white sweet potato cultivars. J Agric Food Chem. (2003) 51:2232–6. doi: 10.1021/jf0260139
29. Mais A, Brennan CS. Characterisation of flour, starch and fibre obtained from sweet potato (Kumara) tubers, and their utilisation in biscuit production. Int J Food Sci Technol. (2008) 43:373–9. doi: 10.1111/j.1365-2621.2007.01652.x
30. Ndangui CB, Petit J, Gaiani C, Nzikou J, Scher J. Impact of thermal and chemical pretreatments on physicochemical, rheological, and functional properties of sweet potato (Ipomea Batatas Lam) flour. Food Bioprocess Technol. (2014) 7:3618–28. doi: 10.1007/s11947-014-1361-3
31. Hou Y, He W, Hu S, Wu G. Composition of polyamines and amino acids in plant-source foods for human consumption. Amino Acids. (2019) 51:1153–65. doi: 10.1007/s00726-019-02751-0
32. Ju D, Mu TH, Sun HN. Sweet potato and potato residual flours as potential nutritional and healthy food material. J Integr Agric. (2017) 16:2632–45. doi: 10.1016/S2095-3119(16)61601-5
33. Aina AJ, Falade KO, Akingbala JO, Titus P. Physicochemical properties of twenty-one caribbean sweet potato cultivars. Int J Food Sci Technol. (2009) 44:1696–704. doi: 10.1111/j.1365-2621.2009.01941.x
34. Shimelis E, Meaza M, Rakshit M. Physicochemical properties, pasting behaviour and functional characteristics of flour and starches from improved bean (Phaseolus vulgaris L.) varieties in East Africa. Int J Arg Biol Eng. (2006) 8:1–18.
35. Asaam ES, Adubofuor J, Amoah I, Apeku OD, Yildiz F. Functional and pasting properties of yellow maize-soya bean-pumpkin composite flours and acceptability study on their breakfast Cereals. Cogent Food Agric. (2018) 4:1–15. doi: 10.1080/23311932.2018.1501932
36. Sanni LO, Tomlins K, Owo HO, Sobukola OP, Obadina OA, Kajihausa OE. Influence of storage conditions and packaging materials on some quality attributes of water yam flour. Cogent Food Agric. (2017) 10:1–26.
37. Nabubuya A, Namutebi A, Byaruhanga Y, Narvhus J, Wicklund T. Potential use of selected sweet potato (Ipomea Batatas Lam) varieties as defined by chemical and flour pasting characteristics. Food Nutr Sci. (2012) 3:889–96. doi: 10.4236/fns.2012.37118
38. Kaur M, Singh N. Relationships between selected properties of seeds, flours, and starches from different chickpea cultivars. Int J Food Prop. (2006). 9:597–608. doi: 10.1080/10942910600
39. Giselle LPS, Juliana ACB, Gislane OR, Luciano ML, Manoel SSJ, Márcio C. Application potential and technological properties of colored sweet potato starches. Starch Stärke. (2020) 73:202000100. doi: 10.1002/star.202000100
40. Guo K, Liu TX, Xu AH, Zhang L., Bian XF, Wei CX. Structural and functional properties of starches from root tubers of white, yellow, and purple sweet potatoes. Food Hydrocoll. (2019). 89:829–36. doi: 10.1016/j.foodhyd.2018.11.058
Keywords: sweet potato, wholemeal flour, nutritional properties, physicochemical properties, phenolics
Citation: Zhang L, Gao Y, Deng B, Ru W, Tong C and Bao J (2022) Physicochemical, Nutritional, and Antioxidant Properties in Seven Sweet Potato Flours. Front. Nutr. 9:923257. doi: 10.3389/fnut.2022.923257
Received: 19 April 2022; Accepted: 23 May 2022;
Published: 15 June 2022.
Edited by:
Gulzar Ahmad Nayik, Government Degree College Shopian, IndiaReviewed by:
Amir Gull, University of Kashmir, IndiaJohannes Delgado-Ospina, University of San Buenaventura Cali, Colombia
Copyright © 2022 Zhang, Gao, Deng, Ru, Tong and Bao. This is an open-access article distributed under the terms of the Creative Commons Attribution License (CC BY). The use, distribution or reproduction in other forums is permitted, provided the original author(s) and the copyright owner(s) are credited and that the original publication in this journal is cited, in accordance with accepted academic practice. No use, distribution or reproduction is permitted which does not comply with these terms.
*Correspondence: Jinsong Bao, anNiYW9Aemp1LmVkdS5jbg==; Chuan Tong, Y2h1YW50b25nQGhvdG1haWwuY29t