
94% of researchers rate our articles as excellent or good
Learn more about the work of our research integrity team to safeguard the quality of each article we publish.
Find out more
REVIEW article
Front. Nutr., 07 July 2022
Sec. Nutrition and Metabolism
Volume 9 - 2022 | https://doi.org/10.3389/fnut.2022.919112
 Klara G. Dokova1*
 Rouzha Z. Pancheva2
 Natalya V. Usheva1
 Galina A. Haralanova1Silviya P. Nikolova1
 Todorka I. Kostadinova3
 Caue Egea Rodrigues4Jessica Singh5,6
 Anne-Kathrin Illner7
 Krasimira Aleksandrova8,9*
The current review aims to summarize published research on nutrition transition patterns (depicting changes in dietary consumption) in European populations over the last three decades (1990–2020), with a focus on East-West regional comparisons. Pubmed and Google-Scholar databases were searched for articles providing information on repeated dietary intakes in populations living in countries across Europe, published between January 1990 and July 2021. From the identified 18,031 articles, 62 were found eligible for review (17 from Eastern and 45 from Western European populations). Overall, both in Eastern and Western Europe, there have been pronounced changes in dietary consumption patterns over the last three decades characterized by reductions in average reported intakes of sugar, carbohydrates and saturated fats and increases in reported fruit and vegetable consumption. There has also been a tendency toward a reduction in traditional foods, such as fish, observed in some Mediterranean countries. Overall, these data suggests that European countries have undergone a nutrition transition toward adopting healthier dietary behaviors. These processes occurred already in the period 1990–2000 in many Western European, and in the last decades have been also spreading throughout Eastern European countries. Firm conclusions are hampered by the lack of standardized methodologies depicting changes in dietary intakes over time and the limited coverage of the full variety of European populations. Future studies based on standardized dietary assessment methods and representative for the whole range of populations across Europe are warranted to allow monitoring trends in nutrition transition within and among European countries.
The recent decades have been characterized by dramatic changes in the economic and social outlook of Europe (1). Increasing health inequalities both within and between countries continue to be a challenge and despite decreasing overall national mortality rates, a clear East-West gradient in the population health remains to exist (2). An example is the life expectancy gap between East and West European countries which is even greater for men than it was four decades ago (3, 4). Additionally, the study of Mackenbach et al. (2) found that the East-West difference in morbidity and mortality is extremely high among lowly educated, middle-aged population groups.
Environmental, political, social, educational and economic circumstances have all played a major role in the epidemiological transition (5). Dietary changes resulting from the introduction of a market economy in Eastern countries, accompanied by changes in the availability of various food items have been hypothesized as an important candidate explaining existing health disparities between East and West Europe (6–8). Aging, urbanization and migration have posed additional challenge to public health systems across Europe and have contributed to the dynamics in the nutrition and health patterns in the recent decades (9–11).
Previously, Grigg (12) published a study on European regional variations in food consumption noting a trend of convergence of the nutritional composition of diet between Western and Eastern Europe in the decades after the Second World War. However, no recent evaluation of the existing evidence outlining trends in nutrition changes in European populations have been performed. Several studies provided an evaluation of dietary intake in European populations, such as the DAFNE project, based on household budget surveys data, however these studies were based only on a selected list of European countries and did not cover the whole period included in our review (13, 14). The Global Burden of Disease (GBD) study represents another source of valuable information of dietary intakes in the period 1990–2010 for the majority of European countries (15, 16).
To depict dynamics linking nutritional patterns with the socio-demographic and epidemiological shifts, the concept of “nutrition transition” has emerged as a theoretical framework outlining nutrition changes over time, between and within populations (17, 18).
While the nutrition transition phenomenon was extensively explored in various countries across the globe, e.g., Asia, Africa, the Middle East, and Latin America (19–21), there has been little research outlining nutrition transition patterns in Europe. It remains particularly unclear whether specific nutrition transition dynamics can be traced across populations in Eastern and Western Europe over the recent decades and whether socio-economic transitions have influenced these changes. Such research would be especially valuable in guiding prevention strategies and public health policies that address the health inequalities across various populations in Europe, in particular with regard to nutrition-related chronic diseases.
To address these gaps, we aimed to collect and summarize published research on nutrition transition patterns in European populations over the last three decades (1990–2020) with a focus on East-West regional comparisons.
The present narrative review is based on the general framework of narrative reviews proposed by Ferrari (22) and complies with the requirements of the Scale for the Assessment of Narrative Review Articles (SANRA) (23).
A literature search of the PubMed and Google-Scholar databases (January 1990 to July 2021) was conducted using the following combination of terms and text words [“nutrition(al) transition” OR “nutrition, dietary, (national) survey” OR “dietary change/trend/pattern” OR “dietary behavior”]. Each of the above 1 to 4 key words were combined with the words: Europe, United Kingdom, and the names of each of the 27 European Union member states, i.e., Austria, Belgium, Bulgaria, Croatia, Republic of Cyprus, Czech Republic, Denmark, Estonia, Finland, France, Germany, Greece, Hungary, Ireland, Italy, Latvia, Lithuania, Luxembourg, Malta, Netherlands, Poland, Portugal, Romania, Slovakia, Slovenia, Spain, and Sweden. Additionally, article bibliographies and gray literature sources were searched for relevant publications. Publications accessible in full text were selected for the review.
Studies were included based on the following criteria: (1) studies providing information on dietary intakes over time (from repeated measurements in the same sample, or consecutive samples from the same population); (2) studies reporting on populations living in any one of the 27 countries, members of the European Union by the date of last literature search (July 2021) and the UK, as it was a member of the EU for the 29 of the 30 years period; (3) studies reporting on adult populations, i.e., 18 years and older.
The exclusion criteria were: (1) studies focused on specific population subgroups based on age, gender, ethnic group etc. such as children, adolescents, pregnant women, elderly; (2) studies reporting only behavioral data (i.e., knowledge, attitudes, and beliefs studies with no dietary assessment data reported); (3) food safety research studies; (4) studies providing only data on physical activity or body composition with no reference to diet; (5) studies reporting on factors affecting dietary intake and habits and not actual intake; (6) studies on associations between diet and various health outcomes without data on dietary intakes; (7) studies reporting on specific or clinical nutrition models and narrow aspects of diet, such as specific food groups or nutrients e.g., fats, vitamins, etc. and not whole of diet; (8) studies reporting on consumption in specific circumstances only, such as diet consumed away from home; (9) economic research studies (food sales, costs and purchase and advertisements of foods); (10) dietary/nutritional intervention or methodological studies.
The process of study selection, including identification, screening, eligibility, and inclusion is illustrated with a flowchart presented in Figure 1. The search strategy retrieved 18,031 unique records. Based on the initial evaluation, 195 records were selected for full-text detailed evaluation. After manual search of the references of the selected papers and an additional targeted search for publications from the countries for which initially there were no publications fulfilling the criteria, 34 additional articles were identified resulting in 229 articles eligible for full text review. Any discrepancies and disagreements were discussed and resolved by consensus among reviewers. A total of 62 articles were selected for data extraction in the present review.
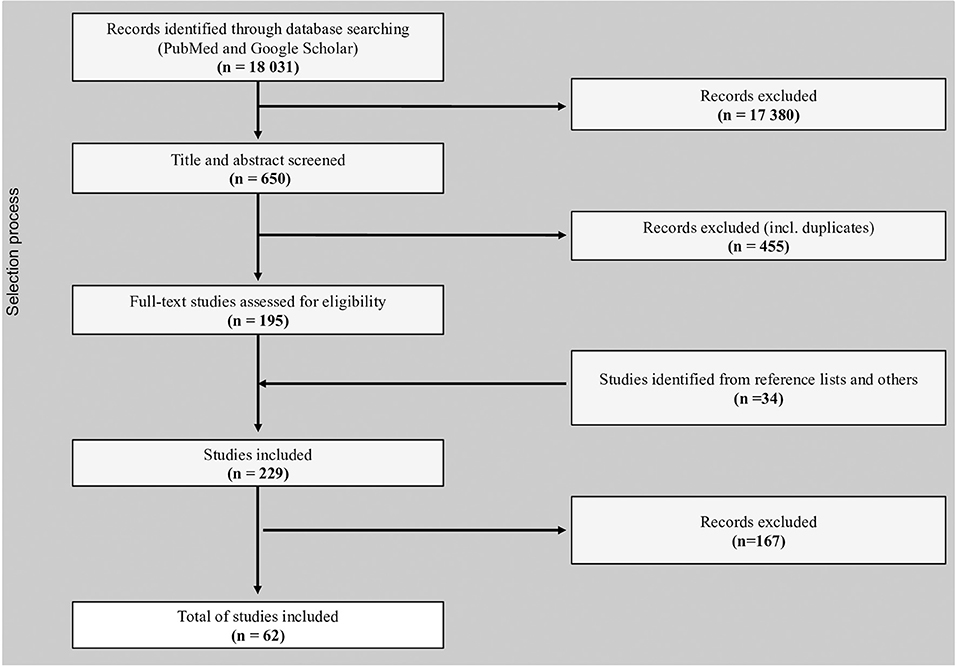
Figure 1. Flow diagram of the stages of the selection process indicating the number of publications at each stage.
Data extraction was performed by four reviewers (KD, RP, NU, GH) using a predefined data extraction table. The following information was extracted: (1) Country; (2) First author and year of publication; (3) Study design; (4) Time period of the study; (5) Level of data; (6) Number of participants; (7) Age range; (8) Method of dietary assessment. Any discrepancies in the data extraction were discussed and resolved by consensus among the reviewers.
The following information depicting nutrition transition dynamics in the respective European region and individual countries was specifically extracted denoting intakes of specific micro- and macronutrients, and food groups including: (1) “carbohydrates,” incl. bread, bakery products, cereals, rice, pasta, flour, potatoes, potato products; (2) “saturated fatty acids”, incl. animal lipids, butter, added lipids (if no other data); (3) “sugars,” incl. sugar, sugar products, honey, chocolate, and other confectionary”; (4) “fruits and vegetables”; and (5) “fish,” incl. fresh, frozen, canned, fish products. Furthermore, data was extracted according to predefined time periods (decades): (1) 1990–1999; (2) 2000–2009; (3) 2010–2019, and also extracted based on country (categorized into each of the 28 European Union countries). Eastern and Central European countries (referred shortly as Eastern European countries) included those that joined the EU after 2004, characterized by political and economic transition (shifts from non-market to market economies) in the last 30 years. These include the following 11 countries: Bulgaria, Croatia, Czech Republic, Estonia, Hungary, Latvia, Lithuania, Poland, Slovakia, Slovenia and Romania. Only Eastern European EU member states were included in the search due to the recognition that in these countries efforts were concentrated on direct measures to harmonize requirements, including nutritional, and, later, on the establishment of an “internal market.” Subsequently, a concerted shift in emphasis necessitated a greater emphasis on food safety harmonization. Hence, the legislation in Eastern European EU countries was adapted to the EU regulations and the choice for stratification was based on the attempt to standardize the group of participants. The remaining 17 countries included Western European countries traditionally characterized by market economies and representing the initial EU member states.
The identified studies were evaluated according to the theoretical framework proposed by Popkin (17, 24) categorizing the nutrition transition according to 5 patterns: (1) “collecting food pattern” with diets high in carbohydrates and fiber and low in saturated fat; (2) “famine pattern” with diets dominated by cereals and emergence of nutritional deficiencies; (3) “receding famine pattern” which is characterized by low-fat, high-fiber diet with an increase in the consumption of fruits, vegetables, animal protein and a decrease in starchy staples; (4) “degenerative diseases pattern”—diets high in fat, sugar, refined carbohydrates, processed foods, and reduced fiber (5) “behavioral change pattern” characterized with intentional reduction in calorie and fat intake and increased consumption of fruits, vegetables, unrefined carbohydrates accompanied with a higher level of physical activity.
The final literature search resulted in identification of 62 articles depicting dietary changes in 26 European countries. The main characteristics of the selected studies: name of country and first author, year of publication, time period of study, number of participants, age-range of participants, and method of dietary assessment, are presented according to East vs. West European region in Table 1 (Section A and B). Among all European countries, only Croatia and Luxemburg were not included in the review, due to lack of eligible publications.
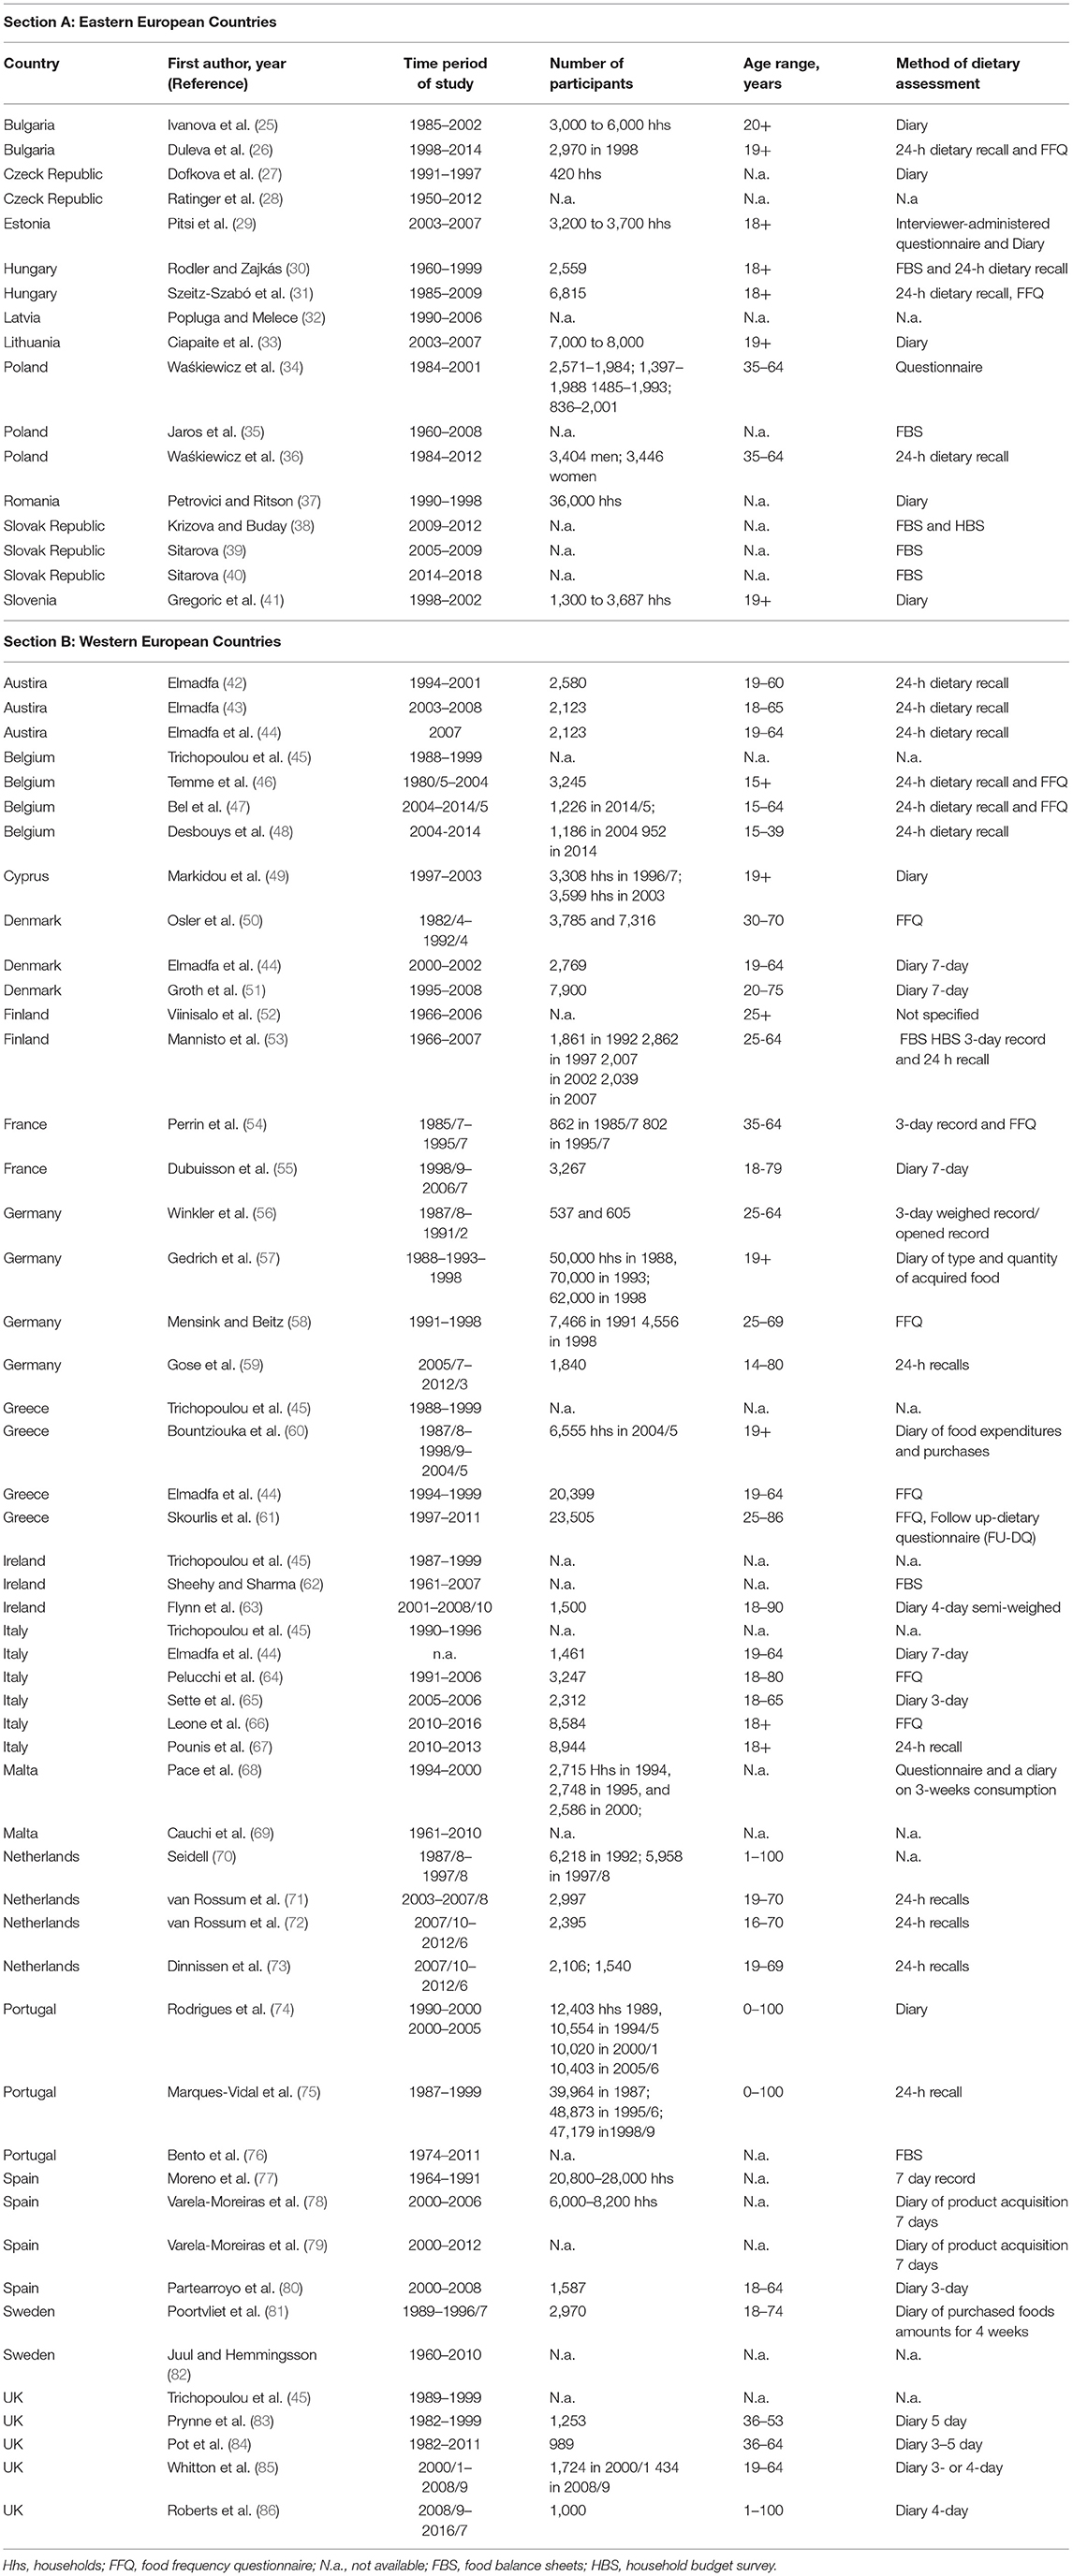
Table 1. Summary of studies included in the review.
Overall, the number of studies conducted in Western European populations was greater, with 45 articles reporting data from 16 Western European countries (Section B of Table 1). For Eastern European countries there were 17 articles reporting data from 10 countries (Section A of Table 1).
Across the different time periods, the last decade (2010–2019) was characterized by a lower number of records as compared to the previous two decades. The evidence was especially scant for Eastern Europe.
Dietary data methodologies used across studies were predominantly based on national household budget survey data, which was the methodology utilized for 9 out of 10 Eastern European countries and for 12 out of 16 Western European countries. The majority of the publications were based on large national representative samples. Food balance sheets or other routinely collected data from official institutions were used if there were no other sources of information for specific countries and time periods. Most of the included studies provided dietary assessment as population averages with a small number of exceptions including Denmark (50), Germany (59), Greece (61), Italy (67) and two studies from UK (83, 84) which provided individual level assessment of dietary intakes.
The majority of studies provided information on selected nutrients, foods and food groups as proxy indicators of the dietary intakes in the studied populations. Among these, we identified saturated fatty acids (SFA), carbohydrates, sugar, fruits and vegetables and fish as the five most commonly assessed dietary indicators with measurements over the studied time periods. Figure 2 provides a summary of the evidence on the changes in consumption trends for these five dietary intake indicators. A more detailed description of results regarding each dietary intake is provided below.
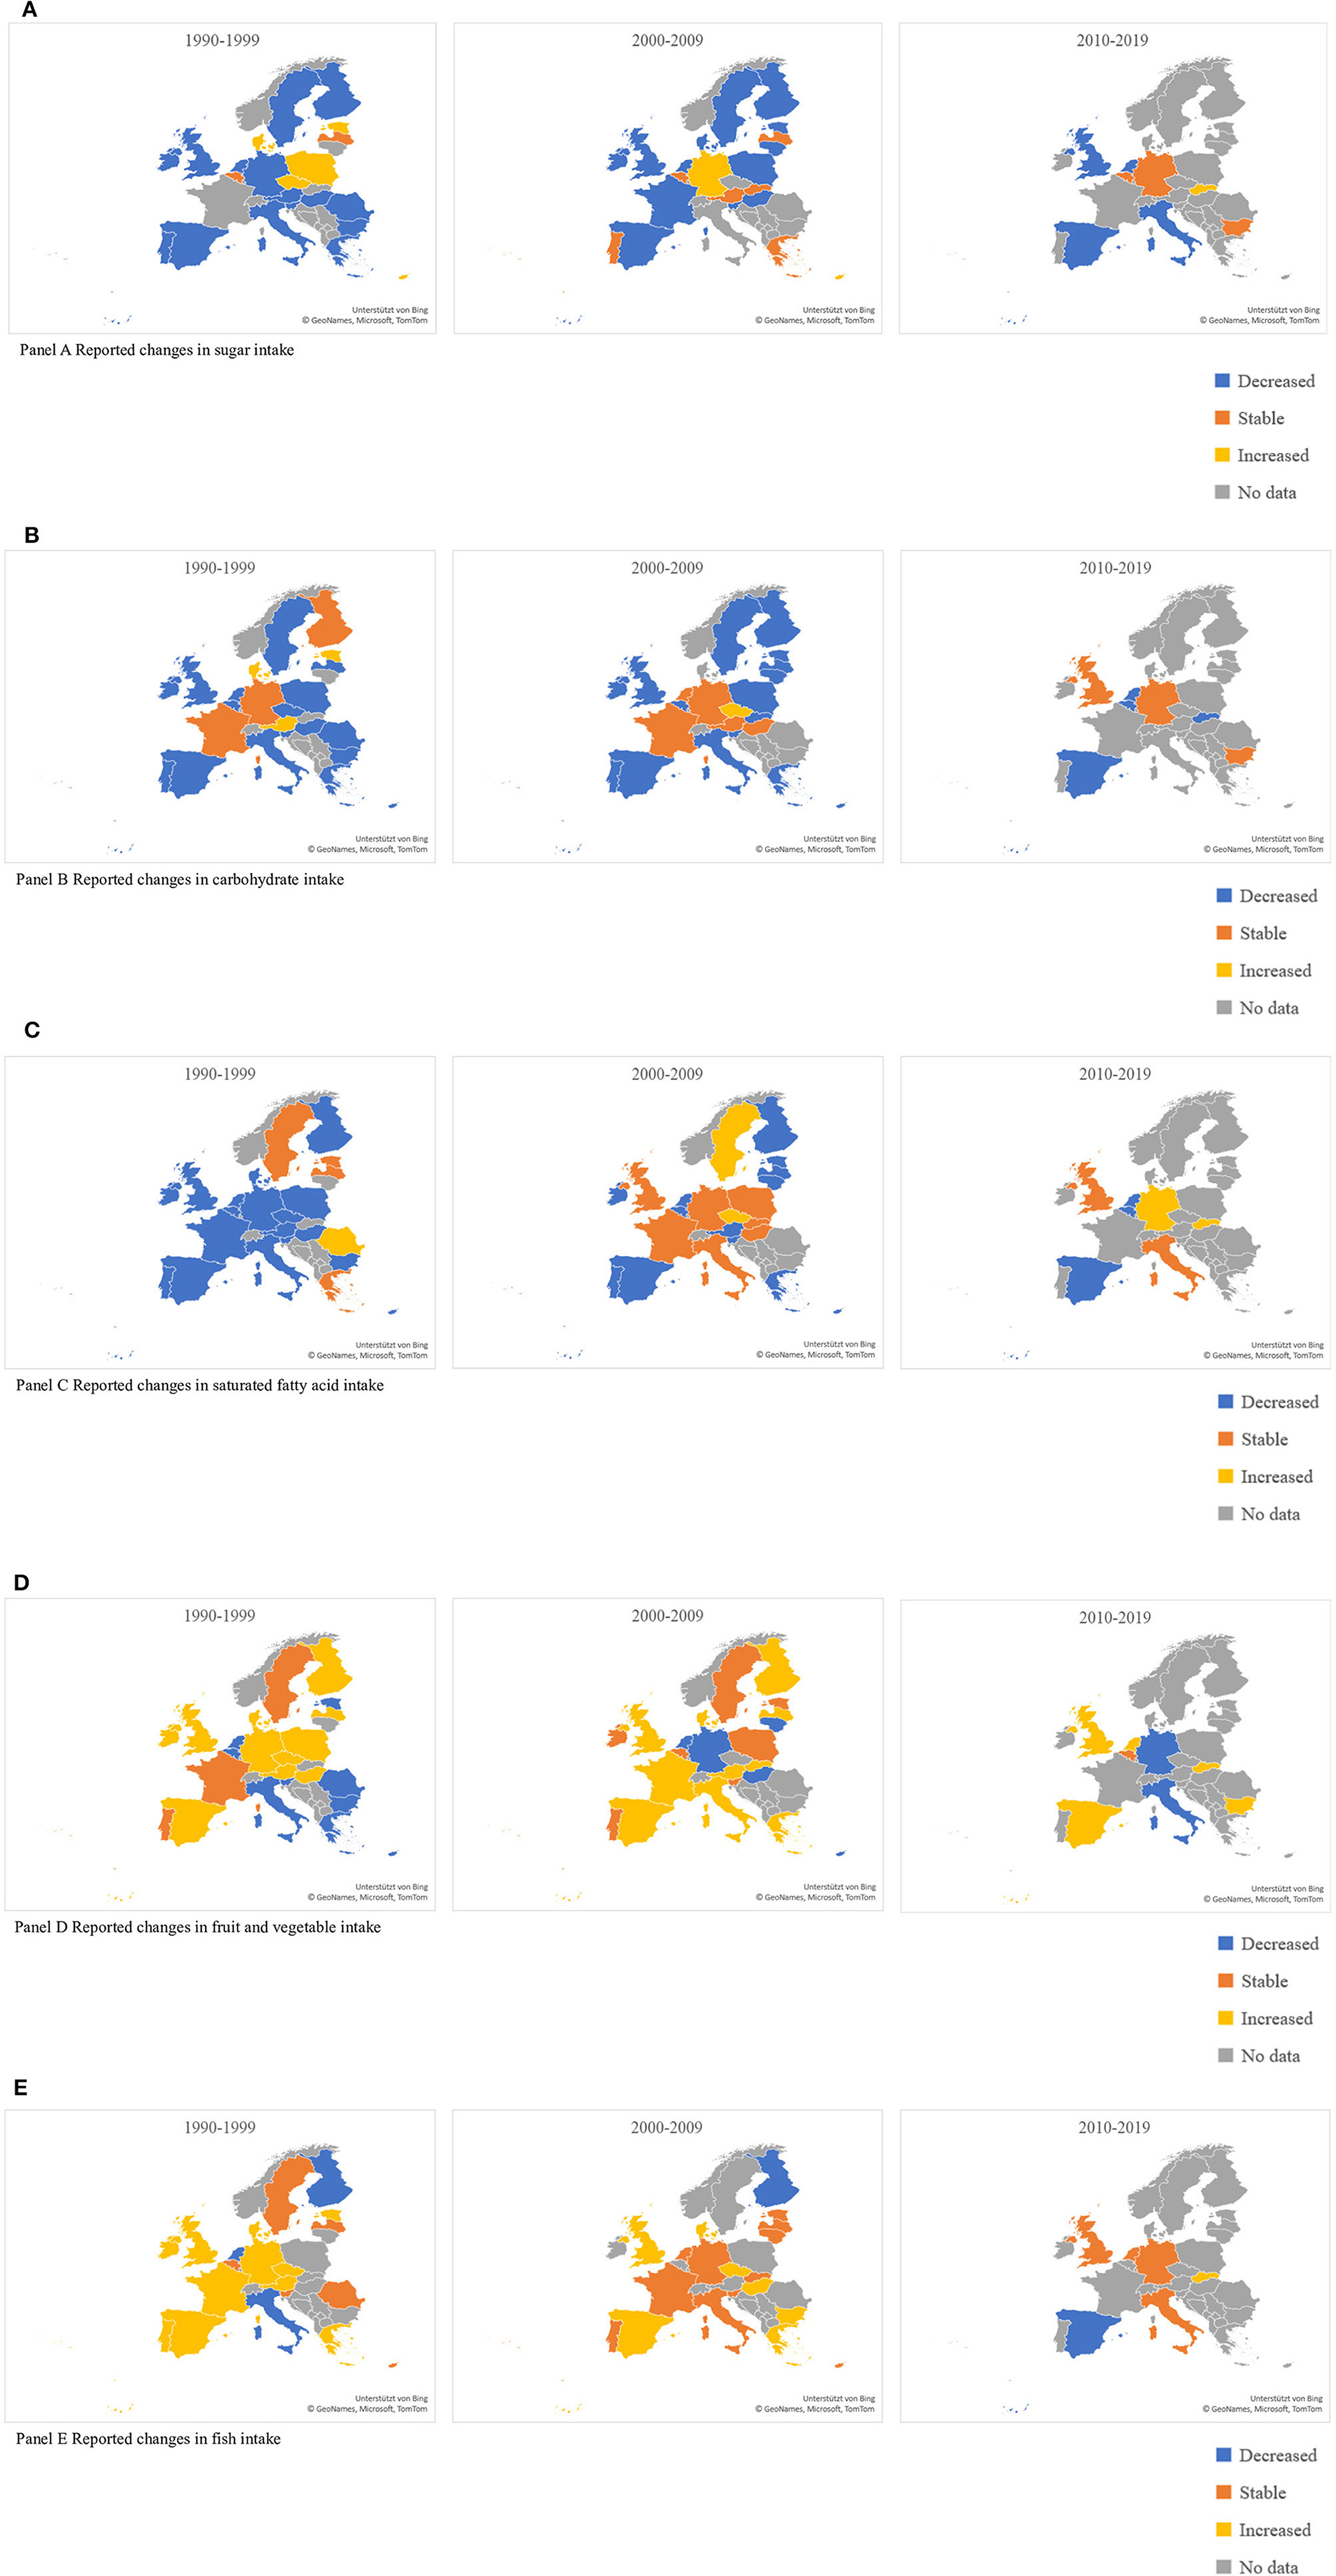
Figure 2. Reported changes in dietary intakes in the European countries (1990–2019), by decade. (A) Changes in sugar intake. Decreased, Stable, Increased, No data. (B) Changes in carbohydrate intake. Decreased, Stable, Increased, No data. (C) Changes in saturated fatty acid intake. Decreased, Stable, Increased, No data. (D) Changes in fruit and vegetable intake. Decreased, Stable, Increased, No data. (E) Changes in fish intake. Decreased, Stable, Increased, No data.
Overall, a trend of reducing the SFA consumption in the period between 1990 and 2009 could be observed in the majority of Western European countries (Figure 2C). Malta and Greece were exceptions, where the SFA consumption seems to have remained stable in the 90's, followed by a decrease in the next decade. In Sweden and Germany, an increase in SFA was observed in the throughout the whole studied period.
Similar trends with a stable decrease in SFA intakes across all decades could be observed in the majority of the Eastern European countries. Among these, the Czech Republic, Slovenia and Romania (for the period 1990–2000) provided an exception with an overall increase in the SFA consumption over the years.
The consumption of carbohydrates was also found to follow a decreasing pattern across all decades in the majority of countries, both in Western and Eastern Europe (Figure 2B). The consumption patterns remained stable in Germany and France, whereas an increasing trend was seen in Austria, Denmark and the Czech Republic.
The consumption of sugar decreased in the majority of the Western European countries (11 out of 16 countries) (Figure 2A). Nevertheless, in some countries, i.e., Cyprus and Malta, there was an increasing trend predominantly in the period between 1990 and 2009.
A decreasing trend of sugar consumption was not so explicit in the Eastern European countries, particularly in the period between 1990 and 2000. However, a tendency of decreasing sugar consumption could be observed for the second decade (2000–2009), except for in Slovakia.
There was no consistent trend in fruit and vegetable consumption across European countries during the first decade (1990–2000), with half of the countries both in Eastern and Western Europe reporting an increase in intakes, with the remaining half reporting either stable or decreased intakes (Figure 2D). During the second decade (2000–2009), the proportion of countries with reported rising intakes of fruits and vegetables increased. The tendency was stronger in Western European countries (9 out of 16 countries) as compared to Eastern European countries (2 out of 7 countries). Notably, decreases in fruit and vegetable consumption could be observed in some of the Mediterranean countries, i.e., Cyprus and Italy.
There was a trend of increasing fish consumption reported in Western European countries in the period between 1990 and 2000 (Figure 2E). However, the tendency seems to have been retained and even reversed for some countries in the following decades. In particular, countries traditionally characterized by high fish consumption, i.e., Finland and some Mediterranean countries, showed a trend toward decreasing intakes in the last decades. Data on fish consumption available for Eastern European countries revealed a stable consumption pattern throughout the three decades. For the Czech Republic, Slovakia, and Estonia, overall increasing consumption patterns were reported.
To allow a comparison of the European transition patterns with global trends to be made, we operationalized the available data on reported dietary intake changes to approximate the nutrition transition patterns according to the pre-defined criteria by Popkin (17). Overall, among the five patterns outlined by the Popkin's nutrition transition model, the European countries could be characterized by experiencing: (a) pattern 4: “the degenerative diseases pattern”, defined as diets high in saturated fat, sugar and refined carbohydrates; and (b) shifts from pattern 4 toward pattern 5: “behavioral change pattern,” defined as diets low in sugar, refined carbohydrates and saturated fat intake and increased fruit, vegetables, and fish intakes.
To depict the shifts between pattern 4 to pattern 5, we evaluated whether three or more of the following dietary changes have been observed in each country: (1) reduced sugar intake; (2) reduced refined carbohydrate intake; (3) reduced saturated fat intake; (4) increased fruit and vegetable intake; (5) increased fish intake. Figure 3 provides an overview of the stage of nutrition transition in the European countries according to studied decades. Overall, 12 of the studied 26 European countries could be classified as experiencing a shift from pattern 4 toward pattern 5 of Popkins' nutrition transition model. In Western Europe, 10 of the 16 assessed countries showed a positive dietary change toward pattern 5. The available evidence suggested that the shift had started in the first decade (1990–1999) for 5 of the countries (Austria, Spain, Portugal, Ireland, and the UK). The following decade, four other Western European countries (Denmark, Finland, France and Malta) moved toward pattern 5. In the last decade (2010–2019) one more country, the Netherlands, followed the path. The scarcity of the available data and the lack of a scale do not allow for reporting on the level of the transition (early/advanced) and what proportion of the population is affected by the positive dietary trends. For Sweden, Germany and Belgium, the data indicated stability. For two other countries, Italy and Cyprus, the data indicated “westernization of diet” with a decrease in fruits and vegetable consumption, increase in sugar and lower consumption of fish.
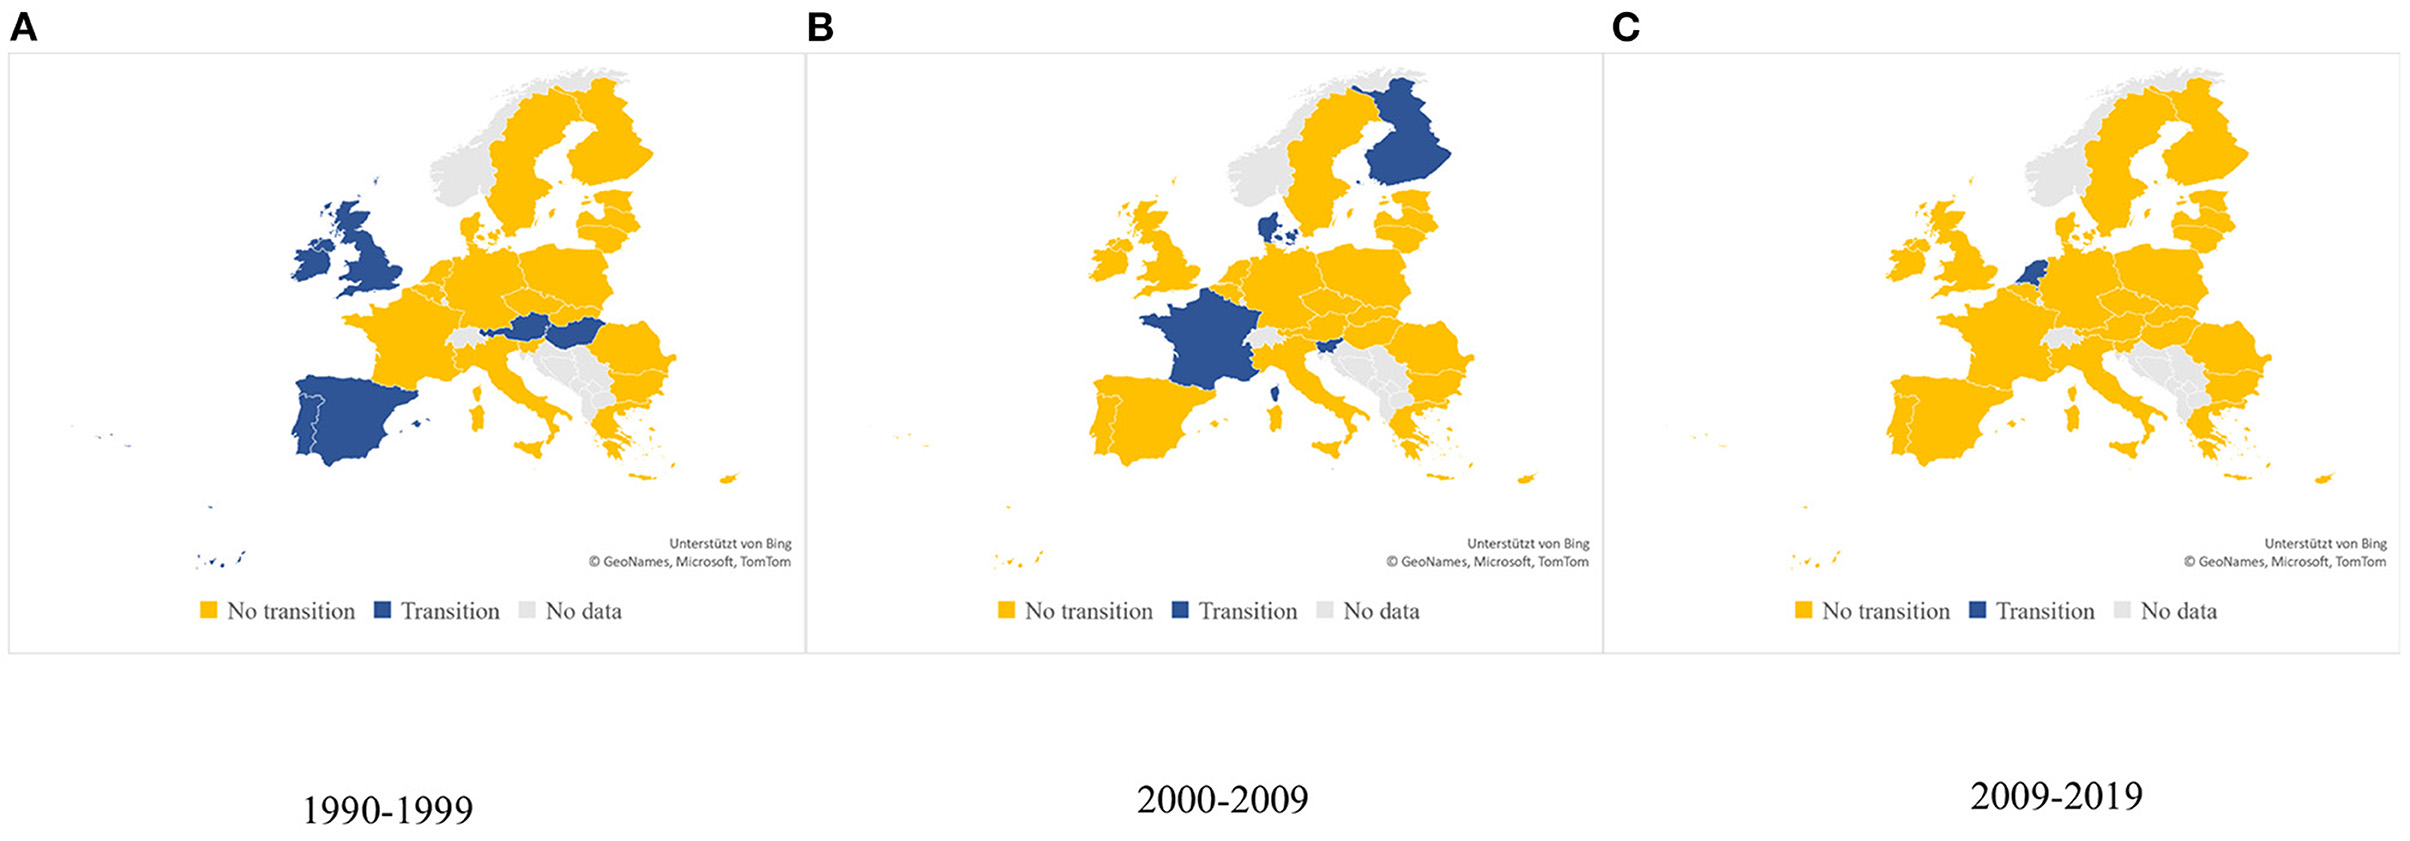
Figure 3. Countries experiencing nutrition transition according to studied decade. (A) 1990–1999; (B) 2000–2009; (C) 2010–2019.
In Eastern Europe, only two countries (Hungary and Slovenia), experienced the positive changes toward pattern 5. For four more countries (Bulgaria, the Czech Republic, Poland, and Latvia) there is some evidence for a beginning transition but not sufficient to be classified as such. For the rest of the countries the data is either lacking or revealing stable, albeit unfavorable trends.
In this narrative review, we provided a summary of published research depicting nutrition transition patterns in Europe over the last three decades (1990–2020) with a focus on comparisons between Eastern and Western European countries. Our literature search resulted in identifying 62 studies eligible for review, among which 17 reported data from Eastern European countries and 45 reported data from Western European countries. To our knowledge, this is the first review that aimed to summarize data on changes in dietary intakes in European populations covering the last three decades characterized by dynamic political, economic and socio-demographic transition between and within European countries. This period has been particularly challenging to Eastern and Central European countries which experienced dramatic societal and political transition after the fall of the Berlin Wall with inevitable consequences to public health.
Our results reveal that there is an overall tendency of increased consumption of healthy foods, i.e., fruits and vegetables and fish, and a decreased consumption of unhealthy nutrients and foods, i.e., SFA and sugar and sugary products. Contrary to the overall transition toward healthier dietary patterns, several Mediterranean countries traditionally characterized by high intakes of fruits and vegetables, showed reversed trends with lowering fruits and vegetable intakes in the recent decades.
Another registered positive trend across most of the European countries was the consistent decline in SFA consumption, starting already before the 1990's (76). It is a main characteristics of the nutrition transition process toward pattern 5 “behavioral change” as defined by Popkin (17). Higher intake of animal and vegetable fats were reported up to the begging of the 90's for the Mediterranean countries, pointed as “westernization of (traditional) diets” (87). However, this last trend typical up to the begging of the 90's reached a peak and was followed by a reverse decrease in SFA consumption in the 90's. The decrease in SFA consumption became also characteristic for some of the Eastern European countries—although for different reasons as compared to the Western countries. The trends for SFA consumption reported here are generally consistent with the estimates by the GBD Study for the same time period (15).
The increases in fruit and vegetables consumption was another positive trend evidenced for half of the European countries. These positive changes are still not overcoming the generally low consumption of fruits and vegetables, for many of the countries. This indicates a need for increasing production and reduction of cross-national availability disparities, through targeted support of countries that lag behind. The estimates of the GBD match closely with our qualitative investigations. The positive trends in fruit and vegetable consumption in Europe have partially been found in the USA where increased consumption of whole fruit, but not of total fruits was reported (88).
The only negative dietary aspect that we describe is the continuous wide scale decrease in complex carbohydrates consumption in all European countries (Western and Eastern) which was discussed also by the GBD study (15). The GBD study depicted specifically the global trend of decreasing whole grain intake occurring also in Europe. This may be partly explained by an overall a decline in the availability of cereals and tubers in Europe until 2011 (e.g., Portugal), as well as by the increasing relative share of meat and dairy products affecting negatively the intake of unrefined and complex carbohydrates. An opposite trend has been observed in the USA where increased consumption of whole grains between 1999–2000 and 2011–2012 has been reported (88).
The trend toward healthier dietary patterns were obvious in Western European countries since the first studied decade (1990–2000), whereas, in Eastern European countries these pro-health nutrition trends have been emerging only in the two more recent decades (2000–2010 and 2010–2020).
The current evidence suggests that there have been positive changes in diet/nutrition in the Western European countries since the 90's that largely coincided with trends observed in Eastern European countries, albeit showing a tendency to be occurring at a later time period. This phenomenon was especially pronounced for changes in sugar consumption, where most of the Western countries experienced declining trends from the beginning of 1990s, whereas in Eastern European countries sugar consumption started to decline after 2000s. These results were similar to those reported in studies in the USA where sugar consumption started to decline from the middle of the 90's mainly as a result of reduced amount of soft drinks consumption (88).
A positive mild increase in fish consumption has been registered among two thirds of the Western European countries in the 90's. Eastern European countries lagged behind with relatively stable low levels of fish consumption between 1990 and 2010. These results are in line with the results from the GBD study (16). These regional differences in trends have occurred in the context of very different fish consumption levels between countries, well below recommended levels in all European countries. The price of fish, especially in the context of the low price of poultry and meat has been pointed as a major barrier for the low fish consumption and stagnating intake trends (89).
The results from the current review should be interpreted with caution taking into account the variety of methodological approaches for dietary intake assessment used in the studies and the lack of studies systematically evaluating the dietary changes over time across various study populations across Europe. For food and macronutrient intake analysis, we utilized mostly data reported from household budget surveys that exist for many, but not all European countries. Most of the surveys have been standardized using same data collection procedures (45).
There is a lot that can be done on both European and national levels to strengthen the observed positive changes where progress has already been made and also to further stimulate the lagging nations. Efforts and resources need to be directed toward data gathering in a systematic comparable way on individual level through regular representative dietary surveys reported in a standardized / unified way. Wide-scale population level primary prevention can be initiated through both nutrition education, designed to facilitate voluntary adoption of nutrition—related behaviors conducive to health and well-being, and through control of consumers' access to highly processed foods rich in sugar, salt, trans and saturated fats. These preventive actions should include policies toward production and equal access to fruits and vegetables, fish and fish products.
In relation to the nutrition transition process throughout the countries of the European union, the limited available evidence suggests that 12 of the 26 six studied countries are advancing toward the last, pattern five of the nutrition transition theory. The process has started with a more than a decade earlier in Western compared to the Eastern European countries. However, we might question whether these too broadly defined patterns, depicting global tendencies developing over large time spans are of practical importance for the discussion of the European situation. The specific (nutritional) situation in Europe is characterized with a huge diversity of populations and dietary patterns requiring more advanced tools/instruments to allow drawing of a more precise yet standardized evaluation of the nutrition dynamics across and within countries. Recently Popkin and Ng (2021) suggested that it is not inevitable for low and middle income countries experiencing transition toward pattern 4 to reach the same high levels of consumption seen in high-income countries, and the associated negative health impacts (90). Europe urgently needs the development of new dietary assessment metrics and standardized instruments to measure dynamic changes in nutrition transition within and across European populations.
This narrative review has several strengths. It adds to the evidence from published studies (13–16) and includes additional sources for the decade 2010–2021. It is the first review that provides a general overview on the recent evidence outlining nutrition transition patterns in Europe based on available reports on changes in dietary intakes over the last 30 years. The selected reports are based on nationally representative data, thereby providing an approximation of the diets in the general population. The review methodology followed a consistent, transparent and precise extraction process. Potential limitations should also be considered. These are mostly related to: (1) lack of studies evaluating dietary changes at an individual level; (2) missing information for some European countries and a general under-representation of Eastern European countries; (3) use of different methodologies for dietary assessment; (4) expected reporting bias from generally more health conscience participants (5) qualitative and somewhat fragmented description of the dietary changes based on limited information for small number of nutrients and foods instead of complex quantitative assessment of whole dietary patterns in European populations and (6) insufficient information from specific population groups, i.e., socially disadvantaged, ethnic minority groups. Therefore, the review may not capture the full dimension of the existing nutrition transition across European countries.
Based on the current review, we observed that European countries seem to have undergone a nutrition transition in the previous three decades, shifting toward healthier dietary behaviors. These processes occurred already in the period 1990–2000 in many Western European, and in the last decades have been also spreading throughout Eastern European countries. Whilst not the predominant outcome, less healthful dietary changes such as moving away from traditional diets i.e., less consumption of fish, were identified in some Nordic and Mediterranean countries. Firm conclusions on trends in dietary changes are hampered by the lack of standardized methodologies depicting changes in dietary intakes over time and the limited coverage of the studied European populations since only those that provided dietary survey data were included in the review. Future studies based on standardized dietary assessment methods and representative for the whole range of populations across Europe are warranted to allow monitoring trends in nutrition transition within and among the European countries.
KA conceived the idea of this review paper. KD, RP, NU, TK, SN, GH, and CE conducted the literature search. KD, RP, NU, and GH performed the extraction of the data. KA, KD, and RP wrote the review. All authors provided critical comments, read, and approved the final version of the manuscript.
This work was partly supported by The German Federal Ministry of Education and Research (BMBF) (Grant No. 01DS19002).
The authors declare that the research was conducted in the absence of any commercial or financial relationships that could be construed as a potential conflict of interest.
All claims expressed in this article are solely those of the authors and do not necessarily represent those of their affiliated organizations, or those of the publisher, the editors and the reviewers. Any product that may be evaluated in this article, or claim that may be made by its manufacturer, is not guaranteed or endorsed by the publisher.
The authors thank Anne Simon (Department Epidemiological Methods and Etiological Research, Leibniz Institute for Prevention Research and Epidemiology -BIPS, Bremen, Germany) for her assistance with the literature search and the preparation of figures included in this manuscript.
1. Marmot M, Bobak M. Social and economic changes and health in Europe East and West. Eur Rev. (2005) 13:15–31. doi: 10.1017/S1062798705000037
2. Mackenbach JP, Valverde JR, Artnik B, Bopp M, Brønnum-Hansen H, Deboosere P, et al. Trends in health inequalities in 27 European countries. Proc Natl Acad Sci USA. (2018) 115:6440–5. doi: 10.1073/pnas.1800028115
3. Mackenbach JP, Karanikolos M, McKee M. The unequal health of Europeans: successes and failures of policies. Lancet. (2013) 381:1125–34. doi: 10.1016/S0140-6736(12)62082-0
4. Aburto JM, van Raalte A. Lifespan dispersion in times of life expectancy fluctuation: the case of central and eastern Europe. Demography. (2018) 55:2071–96. doi: 10.1007/s13524-018-0729-9
5. Karanikolos M, Adany R, McKee M. The epidemiological transition in Eastern and Western Europe: a historic natural experiment. Eur J Public Health. (2017) 27:4–8. doi: 10.1093/eurpub/ckx158
6. Krivonos E, Kuhn L. Trade and dietary diversity in Eastern Europe and Central Asia. Discussion Paper. Halle: Leibniz Institute of Agricultural Development in Transition Economies (IAMO) (2019). p. 182.
7. Popkin BM, Adair LS, Ng SW. Global nutrition transition and the pandemic of obesity in developing countries. Nutr Rev. (2012) 70:3–21. doi: 10.1111/j.1753-4887.2011.00456.x
8. Zatonski W. The East-West Health Gap in Europe-what are the causes? Eur J Public Health. (2007) 17:121. doi: 10.1093/eurpub/ckm006
9. Schultz C. Migration, Health and Cities Migration, Health and Urbanization: Interrelated Challenges. International Organization for Migration (IOM) (2015).
10. Michel JP. Urbanization and ageing health outcomes. J Nutr Health Aging. (2020) 24:463–5. doi: 10.1007/s12603-020-1360-1
11. FAO. The Future of Food and Agriculture: Trends and Challenges. Rome: Food and Agriculture Organization of the United Nations (2017).
12. Grigg D. The European diet: Regional variations in food consumption in the 1980s. Geoforum. (1993) 24:277–89. doi: 10.1016/0016-7185(93)90021-9
13. DataFoodNetworking. The ANEMOS Project: Expansion and Update of Existing Nutrition Monitoring Systems. Hellenic Health Foundation (2007). Available online at: http://www.hhf-greece.gr/media/projects/anemosnewsletterII.pdf
14. Trichopoulou A, Naska A. Special issue - the DAFNE Initiative - Assessment of dietary patterns across Europe using household budget survey data - introduction. Public Health Nutri. (2001) 4:1131–2.
15. Micha R, Khatibzadeh S, Shi P., Fahimi S, Lim S, Andrews K, et al. Global, regional, and national consumption levels of dietary fats and oils in 1990 and 2010: a systematic analysis including 266 country-specific nutrition surveys. BMJ. (2014) 348:g2272. doi: 10.1136/bmj.g2272
16. Micha R, Khatibzadeh S, Shi P, Andrews KG, Engell RE, Mozaffarian D, et al. Global, regional and national consumption of major food groups in 1990 and 2010: a systematic analysis including 266 country-specific nutrition surveys worldwide. BMJ Open. (2015) 5:e008705. doi: 10.1136/bmjopen-2015-008705
17. Popkin BM. Nutritional patterns and transitions. Popul Dev Rev. (1993) 19:138–57. doi: 10.2307/2938388
19. Popkin BM. The nutrition transition: an overview of world patterns of change. Nutr Rev. (2004) 62 S140–3. doi: 10.1111/j.1753-4887.2004.tb00084.x
20. Popkin BM. The nutrition transition in low-income countries: an emerging crisis. Nutr Rev. (1994) 52:285–98. doi: 10.1111/j.1753-4887.1994.tb01460.x
21. Popkin BM. The shift in stages of the nutrition transition in the developing world differs from past experiences!. Public Health Nutr. (2002) 5:205–14. doi: 10.1079/PHN2001295
22. Ferrari R. Writing narrative style literature reviews. Medi Writi. (2015) 24:230–5. doi: 10.1179/2047480615Z.000000000329
23. Baethge C, Goldbeck-Wood S, Mertens S. SANRA-a scale for the quality assessment of narrative review articles. Rese Integrity Peer Revi. (2019) 4:5. doi: 10.1186/s41073-019-0064-8
24. Popkin BM. An overview on the nutrition transition and its health implications: the Bellagio meeting. Public Health Nutr. (2002) 5:93–103. doi: 10.1079/PHN2001280
25. Ivanova L, Dimitrov P, Ovcharova D, Dellava J, Hoffman DJ. Economic transition and household food consumption: a study of Bulgaria from 1985 to 2002. Econ Hum Biol. (2006) 4:383–97. doi: 10.1016/j.ehb.2006.08.001
26. Duleva V, Rangelova R, Petrova S, Dimitrov P. Nutrition for people aged over 19 years in Bulgaria, 2014: energy and macronutrient intake. Bulgarian J Public Health. (2017) 9:34–56.
27. Dofkova M, Kopriva V, Resova D, Rehurkova I, Ruprich J. The development of food consumption in the Czech Republic after 1989. Public Health Nutr. (2001) 4:999–1003. doi: 10.1079/PHN2001169
28. Ratinger T, Herbakova L, Michalek T, Tomka A, Mralkova I, Stikova O. Sustainable food consumption - the case of the Czech republic. Rev Agric Appl Econ. (2014) 17:65–73. doi: 10.22004/ag.econ.196630
29. Pitsi T, Paats M, Tikva P. Trends in Food Availability in Estonia - The ANEMOS Project. (2010). Available online at: https://healthdocbox.com/Weight_Loss/91704040-Trends-in-food-availability-in-estonia-the-anemos-project.html (accessed March 30, 2022).
30. Rodler I, Zajkás G. Hungarian cancer mortality and food availability data in the last four decades of the 20th century. Ann Nutr Metab. (2002) 46:49–56. doi: 10.1159/000057640
31. Szeitz-Szabó M, Biró L, Biró GY. Nutritional and vital statistical features of the Hungarian population: a review about the past 25 years. Acta Alimentaria. (2012) 41:277–91. doi: 10.1556/AAlim.41.2012.2.15
32. Popluga D, Melece L. Trends in food expenditure, consumption and nutrition in Latvia. In: Proceedings of the Latvia University of Agriculture. Riga (2009). p. 43–52.
33. Ciapaite A, Dapkute V, Zemeckis R. Trends in Food Availability in Lithuania - The ANEMOS Project. (2009). Available online at: http://www.hhf-greece.gr/media/projects/National_Report_Lithuania_EN.pdf (accessed March 30, 2022).
34. Waśkiewicz A, Piotrowski W, Sygnowska E, Rywik S, Jasiński B. Did favourable trends in food consumption observed in the 1984-2001 period contribute to the decrease in cardiovascular mortality?. Pol-MONICA Warsaw Project Kardiol Pol. (2006) 64:16–23; discussion 4-5.
35. Jarosz M, Sekuła W, Rychlik E. Trends in dietary patterns, alcohol intake, tobacco smoking, and colorectal cancer in Polish population in 1960-2008. Biomed Res Int. (2013) 2013:183204. doi: 10.1155/2013/183204
36. Waśkiewicz A, Piotrowski W, Szostak-Wegierek D. Relationship between 28-year food consumption trends and the 10-year global risk of death due to cardiovascular diseases in the adult Warsaw population. Kardiol Pol. (2015) 73:650–5. doi: 10.5603/KP.a2015.0070
37. Petrovici D, Ritson C. Food consumption patterns in Romania. Bri Food J. (2000) 102:290–308. doi: 10.1108/00070700010327724
38. Krizova S, Buday S. Socio-economic aspects of food consumption in Slovakia: overview of contemporary issues. J Food NutriRes. (2015) 54:21–30. Available online at: https://www.vup.sk/en/index.php?mainID=2&navID=34&version=2&volume=54&article=1950 (accessed April 07, 2022).
39. Sitarova T. Food Consumption in the Slovak Republic. (2009). Available online at: http://www.slpk.sk/eldo/susr/Spotreba_potravin_v_SR_v_roku_2009.pdf
40. Sitarova T. Food Consumption in the Slovak Republic in 2018. (2019). Available online at: https://bit.ly/3oZhbDl (accessed April 7, 2022).
41. Gregorič M, Adamič M, Remec M, Blenkuš M. Trends in Food Availability in SLOVENIA - The DAFNE V Project. (2008). Available online at: https://webgate.ec.europa.eu/chafea_pdb/assets/files/pdb/2003117/_9_en.pdf.
42. Elmadfa I. Austrian Nutrition Report 2003: Summary. Ann Nutri Metab. (2004) 48:1–22. doi: 10.1159/000082535
43. Elmadfa I. Austrian Nutrition Report 2008. (2009). Available online at: https://scholar.google.com/scholar?hl=en&as_sdt=0%2C5&q=elmadfa+i.+Austrian+Nutrition+Report+2008+&btnG (accessed March 30, 2022).
44. Elmadfa I, Meyer A, Nowak V, Hasenegger V, Putz P, Verstraeten R. European nutrition and health report 2009. Forum Nutr. (2009) 62:1–405. doi: 10.1159/isbn.978-3-8055-9297-0
45. Trichopoulou A, Naska A, Costacou T, DAFNE III Group. Disparities in food habits across Europe. Proc Nutr Soc. (2002) 61:553–8. doi: 10.1079/PNS2002188
46. Temme E, Huybrechts I, Vandevijvere S, De Henauw S, Leveque A, Kornitzer M, et al. Energy and macronutrient intakes in Belgium: results from the first National Food Consumption Survey. Br J Nutr. (2010) 103:1823–9. doi: 10.1017/S0007114510000085
47. Bel S, De Ridder K, Lebacq T, Teppers E, Cuypers K, Tafforeau J. Habitual food consumption of the Belgian population in 2014-2015 and adherence to food-based dietary guidelines. Arch Public Health. (2019) 77:14. doi: 10.1186/s13690-019-0343-3
48. Desbouys LRM, De Ridder K, Pedroni C, Castetbon K. Ten-year changes in diet quality among adolescents and young adults (Food Consumption Survey 2004 and 2014. Belgium). Eur J Nutr. (2021) 60:3225–35. doi: 10.1007/s00394-021-02499-y
49. Markidou E, Onisiforou K, Agrotou A. Trends in Food Availability in CYPRUS - The DAFNE V Project. Available online at: https://webgate.ec.europa.eu/chafea_pdb/assets/files/pdb/2003117/2003117_4_en.pdf2004 (accessed March 30, 2022).
50. Osler M, Heitmann BL, Schroll M. Ten year trends in the dietary habits of Danish men and women. Cohort and cross-sectional data. Eur J Clin Nutr. (1997) 51:535–41. doi: 10.1038/sj.ejcn.1600438
51. Groth MVSM, Matthiessen J, Fagt S, Landvad N, Knudsen VK. Disparities in dietary habits and physical activity in Denmark and trends from 1995 to 2008. Scand J Public Health. (2014) 42:611–20. doi: 10.1177/1403494814547668
52. Viinisalo M, Nikkilä M, Varjonen J. Changes in the Consumption of Foods in Households During the Years 1966–2006. Available online at: https://helda.helsinki.fi/bitstream/handle/10138/152387/Elintarvikkeiden_kulutusmuutokset_kotitalouksissa_vuosina_1966-2006.pdf?sequence=12008 (accessed April 10, 2022).
53. Männistö S, Laatikainen T, Helakorpi S, Valsta LM. Monitoring diet and diet-related chronic disease risk factors in Finland. Public Health Nutr. (2010) 13:907–14. doi: 10.1017/S1368980010001084
54. Perrin AE, Simon C, Hedelin G, Arveiler D, Schaffer P, Schlienger JL. Ten-year trends of dietary intake in a middle-aged French population: relationship with educational level. Eur J Clin Nutr. (2002) 56:393–401. doi: 10.1038/sj.ejcn.1601322
55. Dubuisson C, Lioret S, Touvier M, Dufour A, Calamassi-Tran G, Volatier JL, et al. Trends in food and nutritional intakes of French adults from 1999 to 2007: results from the INCA surveys. Br J Nutr. (2010) 103:1035–48. doi: 10.1017/S0007114509992625
56. Winkler G, Brasche S, Heinrich J. Trends in food intake in adults from the city of Erfurt before and after the German reunification. Ann Nutr Metab. (1997) 41:283–90. doi: 10.1159/000177956
57. Gedrich K, Wagner K, Himmerich S, Karg G. Trends in Food Availability in Germany - The DAFNE IV Project. (2005). Available online at: https://ec.europa.eu/health/ph_projects/2002/monitoring/fp_monitoring_2002_annexe_de_04_en.pdf (accessed April 10, 2022).
58. Mensink GB, Beitz R. Food and nutrient intake in East and West Germany, 8 years after the reunification–The German Nutrition Survey 1998. Eur J Clin Nutr. (2004) 58:1000–10. doi: 10.1038/sj.ejcn.1601923
59. Gose M, Krems C, Heuer T, Hoffmann I. Trends in food consumption and nutrient intake in Germany between 2006 and 2012: results of the German National Nutrition Monitoring (NEMONIT). Br J Nutr. (2016) 115:1498–507. doi: 10.1017/S0007114516000544
60. Bountziouka V, Tsiotas K, Economou H, Naska A, Trichopoulou A. Trends in Food Availability in GREECE - the DAFNE V Project. (2002). Available online at: https://ec.europa.eu/health/ph_projects/2003/action1/docs/greece_en.pdf (accessed April 10, 2022).
61. Skourlis N, Patsis I, Martimianaki G, Peppa E, Trichopoulou A, Katsouyanni K. Changes in the dietary habits of the Greek EPIC cohort participants during a 14-year follow-up period (1997-2011). Nutrients. (2020) 12:2148. doi: 10.3390/nu12072148
62. Sheehy T, Sharma S. The nutrition transition in the Republic of Ireland: trends in energy and nutrient supply from 1961 to 2007 using Food and Agriculture Organization food balance sheets. Br J Nutr. (2011) 106:1078–89. doi: 10.1017/S0007114511001395
63. Flynn A, Walton J, Bannon S. National Adult Nutrition Survey. (2011). Available online at: https://irp-cdn.multiscreensite.com/46a7ad27/files/uploaded/The%20National%20Adult%20Nutrition%20Survey%20Summary%20Report%20March%202011.pdf (accessed April 10, 2022).
64. Pelucchi C, Galeone C, Negri E, La Vecchia C. Trends in adherence to the Mediterranean diet in an Italian population between 1991 and 2006. Eur J Clin Nutr. (2010) 64:1052–6. doi: 10.1038/ejcn.2010.158
65. Sette S, Le Donne C, Piccinelli R, Arcella D, Turrini A, Leclercq C, et al. The third Italian National Food Consumption Survey, INRAN-SCAI 2005-06–part 1: nutrient intakes in Italy. Nutr Metab Cardiovasc Dis. (2011) 21:922–32. doi: 10.1016/j.numecd.2010.03.001
66. Leone A, Battezzati A, De Amicis R, De Carlo G, Bertoli S. Trends of adherence to the mediterranean dietary pattern in Northern Italy from 2010 to 2016. Nutrients. (2017) 9:734. doi: 10.3390/nu9070734
67. Pounis GBA, Ruggiero E, Di Castelnuovo A, Costanzo S, Persichillo M, Bonaccio M, et al. Food group consumption in an Italian population using the updated food classification system FoodEx2: results from the Italian Nutrition & HEalth Survey (INHES) study. Nutr Metab Cardiovasc Dis. (2017) 27:307–28. doi: 10.1016/j.numecd.2017.01.004
68. Pace L, Caruana E, Camilleri N. Trends in Food Availability in MALTA - the DAFNE V Project. (2004). Available online at: https://ec.europa.eu/health/ph_projects/2003/action1/docs/malta_en.pdf (accessed April 10, 2022).
69. Cauchi D, Rutter H, Knai C. An obesogenic island in the Mediterranean: mapping potential drivers of obesity in Malta. Public Health Nutr. (2015) 18:3211–23. doi: 10.1017/S1368980015000476
70. Seidell JC. Significant Trends in Food Consumption in the Netherlands. (2002). Available online at: https://dokumen.tips/documents/enkele-belangrijke-ontwikkelingen-in-de-voedselconsumptie.html (accessed April 10, 2022).
71. van Rossum C, Fransen H, Verkaik-Kloosterman J, Buurma-Rethans E, Ocké M. Dutch National Food Consumption Survey 2007-2010 : Diet of Children and Adults Aged 7 to 69 years. Nederlandse Voedselconsumptiepeiling 2007-2010 : Voeding van Kinderen en Volwassenen van 7 tot 69 Jaar. Rijksinstituut voor Volksgezondheid en Milieu RIVM (2011).
72. van Rossum C, Buurma-Rethans E, Dinnissen C, Beukers M, Brants H, Dekkers A, et al. The Diet of the Dutch : Results of the Dutch National Food Consumption Survey 2012-2016. Rijksinstituut voor Volksgezondheid en Milieu RIVM (2020).
73. Dinnissen CS, Ocké MC, Buurma-Rethans EJM, van Rossum CTM. Dietary changes among adults in the Netherlands in the period 2007-2010 and 2012-2016. Results from two cross-sectional national food consumption surveys. Nutrients. (2021) 13:1520. doi: 10.3390/nu13051520
74. Rodrigues SS, Rowcliffe PJ, de Almeida MD. Trends in Food Availability in Portugal: The ANEMOS Project undefined /Paper/. (2010). Available online at: https://repositorio-aberto.up.pt/bitstream/10216/52965/2/39750.pdf (accessed April 10, 2022).
75. Marques-Vidal P, Ravasco P, Dias CM, Camilo ME. Trends of food intake in Portugal, 1987-1999: results from the National Health Surveys. Eur J Clin Nutr. (2006) 60:1414–22. doi: 10.1038/sj.ejcn.1602472
76. Bento A, Gonçalves C, Cordeiro T, Vaz de Almeida MD. Portugal nutritional transition during the last 4 decades: 1974-2011. Porto Biomed J. (2018) 3:e25. doi: 10.1016/j.pbj.0000000000000025
77. Moreno LA, Sarría A, Popkin BM. The nutrition transition in Spain: a European Mediterranean country. Eur J Clin Nutr. (2002) 56:992–1003. doi: 10.1038/sj.ejcn.1601414
78. Varela-Moreiras G, Avila JM, Cuadrado C, del Pozo S, Ruiz E, Moreiras, et al. Evaluation of food consumption and dietary patterns in Spain by the Food Consumption Survey: updated information. Eur J Clin Nutr. (2010) 64(Suppl. 3):S37–43. doi: 10.1038/ejcn.2010.208
79. Varela-Moreiras G, Ruiz E, Valero T, Avila J, del Pozo S. The Spanish diet: an update. Nutr Hosp. (2013) 28(Suppl. 5):13–20. doi: 10.3305/nh.2013.28.sup5.6914
80. Partearroyo T, Samaniego-Vaesken ML, Ruiz E, Aranceta-Bartrina J, Gil Á, González-Gross M, et al. Current Food Consumption amongst the Spanish ANIBES Study Population. Nutrients. (2019) 11:2663. doi: 10.3390/nu11112663
81. Poortvliet E, Sjöström M, Yngve A. Trends in Food Availability in Sweden - The DAFNE IV Project. (2005). Available online at: https://ec.europa.eu/health/ph_projects/2002/monitoring/fp_monitoring_2002_annexe_sw_04_en.pdf (accessed April 10, 2022).
82. Juul F, Hemmingsson E. Trends in consumption of ultra-processed foods and obesity in Sweden between 1960 and 2010. Public Health Nutr. (2015) 18:3096–107. doi: 10.1017/S1368980015000506
83. Prynne CJ PA, Mishra GD, Greenberg DC, Wadsworth ME. Changes in intake of key nutrients over 17 years during adult life of a British birth cohort. Br J Nutr. (2005) 94:368–76. doi: 10.1079/BJN20041404
84. Pot G Prynne CJ Almoosawi S Kuh D Stephen AM; NSHD scientific and data collection teams. Trends in food consumption over 30 years: evidence from a British birth cohort. Eur J Clin Nutr. (2015) 69:817–23. doi: 10.1038/ejcn.2014.223
85. Whitton C, Nicholson SK, Roberts C, Prynne C, Pot G, Olson A, et al. National Diet and Nutrition Survey: UK food consumption and nutrient intakes from the first year of the rolling programme and comparisons with previous surveys. Br J Nutr. (2011) 106:1899–914. doi: 10.1017/S0007114511002340
86. Roberts C, Steer T, Maplethorpe N, Cox L, Meadows S, Nicholson S, et al. National Diet and Nutrition Survey Years 1 to 9 of the Rolling Programme (2008/2009−2016/2017) Time Trend and Income Analyses. 56. London: Public Health England (2019).
87. Chen Q, Marques-Vidal P. Trends in food availability in Portugal in 1966-2003: comparison with other Mediterranean countries. Eur J Nutr. (2007) 46:418–27. doi: 10.1007/s00394-007-0681-8
88. Rehm C, Peñalvo JL, Afshin A, Mozaffarian D. Dietary intake among US adults, 1999-2012. JAMA. (2016) 315:2542. doi: 10.1001/jama.2016.7491
89. EUMOFA. EU Consumer Habits Regarding Fishery and Aquaculture Products. Annex 1, Mapping and Analysis of Existing Studies on Consumer Habits. (2017). Available online at: https://www.eumofa.eu/documents/20178/84590/Annex+1+-+Mapping+of+studies.pdf.
Keywords: nutrition transition, Europe, East-West gaps, dietary changes, review
Citation: Dokova KG, Pancheva RZ, Usheva NV, Haralanova GA, Nikolova SP, Kostadinova TI, Egea Rodrigues C, Singh J, Illner A-K and Aleksandrova K (2022) Nutrition Transition in Europe: East-West Dimensions in the Last 30 Years—A Narrative Review. Front. Nutr. 9:919112. doi: 10.3389/fnut.2022.919112
Received: 13 April 2022; Accepted: 20 May 2022;
Published: 07 July 2022.
Edited by:
Manfred Eggersdorfer, University of Groningen, NetherlandsReviewed by:
Lalka Rangelova, National Center of Public Health and Analyses (NCPHA), BulgariaCopyright © 2022 Dokova, Pancheva, Usheva, Haralanova, Nikolova, Kostadinova, Egea Rodrigues, Singh, Illner and Aleksandrova. This is an open-access article distributed under the terms of the Creative Commons Attribution License (CC BY). The use, distribution or reproduction in other forums is permitted, provided the original author(s) and the copyright owner(s) are credited and that the original publication in this journal is cited, in accordance with accepted academic practice. No use, distribution or reproduction is permitted which does not comply with these terms.
*Correspondence: Krasimira Aleksandrova, YWxla3NhbmRyb3ZhQGxlaWJuaXotYmlwcy5kZQ==; Klara G. Dokova, a2xhcmFkb2tvdmFAbXUtdmFybmEuYmc=
Disclaimer: All claims expressed in this article are solely those of the authors and do not necessarily represent those of their affiliated organizations, or those of the publisher, the editors and the reviewers. Any product that may be evaluated in this article or claim that may be made by its manufacturer is not guaranteed or endorsed by the publisher.
Research integrity at Frontiers
Learn more about the work of our research integrity team to safeguard the quality of each article we publish.