
95% of researchers rate our articles as excellent or good
Learn more about the work of our research integrity team to safeguard the quality of each article we publish.
Find out more
ORIGINAL RESEARCH article
Front. Nutr. , 25 August 2022
Sec. Nutritional Epidemiology
Volume 9 - 2022 | https://doi.org/10.3389/fnut.2022.888507
This article is part of the Research Topic Body Composition Assessment Techniques in Clinical and Epidemiological Settings: Development, Validation and Use in Dietary Programs, Physical Training and Sports View all 24 articles
 José Ronaldo Ribeiro da Costa1
 Roberto Fernandes da Costa2
 Ciro Alexandre Mercês Goncalves1
 Michelle Vasconcelos de Oliveira Borges1
 Paulo Francisco De Almeida-Neto2*
 Gilmara Gomes De Assis1
 Breno Guilherme De Araujo Tinoco Cabral1
 Paulo Moreira Silva Dantas1
Background: Obesity is a serious disease that burdens public health systems around the world. It is a risk factor for the development of several non-communicable chronic diseases that are related to the amount and distribution of body fat. Body composition assessment using simple and low-cost techniques can help in the early detection of excess fat, allowing for the prevention and treatment of both obesity and associated diseases. Thus, identifying and proposing valid anthropometric indices for this purpose can be a great ally of health programs.
Objective: To verify the validity of the Body Adiposity Index (BAI) in relation to Dual Energy X-Ray Absorptiometry (DXA) for estimating body fat percentage in Brazilian adults, as well as to propose a new mathematical model to estimate the fat-free mass of this population.
Methods: In a cross-sectional study, 424 subjects (of which 220 were women), aged between 20 and 59 years, were evaluated by BAI and DXA, then randomly divided into two groups stratified by sex: the development group (n = 283) and the cross-validation group (n = 141). Statistical analyses to test the validity of BAI as a predictor of fat mass, in addition to proposing a new mathematical model for estimating fat-free mass, using DXA as a reference method. The analysis included paired t-test, stepwise multiple regression, coefficient of concordance correlation, and Bland-Altman plots.
Results: The BAI validity analysis showed a low correlation coefficient of agreement [CCC = 0.626; ρ (precision) = 0.795; Cb(accuracy) = 0.787]; in addition, the mean difference in the Bland-Altman plot was different from zero in the cross-validation group (p < 0.01) and limits of agreement (LOA) ranged between−8.0 and 14.4 kg, indicating a poor agreement between the BAI and the reference method. The new mathematical model for estimating FFM showed a high correlation coefficient of agreement (CCC = 0.952; ρ = 0.953; Cb = 0.999), in addition to acceptable LOA in the Bland-Altman plot (-6.7 and 6.7).
Conclusion: In the studied sample, the BAI showed low validity for estimating body fat, while the new proposed model was found to be a good option to assess the body composition of Brazilian adults.
Obesity is a severe disease overloading public health systems worldwide. It is an important risk factor for developing chronic diseases such as hypertension and diabetes, as well as cardiovascular and cerebrovascular events (1). Such a risk impact on secondary conditions is related to body fat distribution, i.e., an abnormal amount of body fat exerts an independent risk according to morbidity and represents a different impact in relation to other forms of excessive weight (2, 3).
Body composition assessments, i.e., determining the proportions of fat mass and fat-free mass, are an essential factor for prescribing and monitoring dietary and exercise programs, as well as verifying the response to such programs and health treatments (4). The most accurate method for the body composition assessment is the four-compartment model (4C) which is the criterion method for assessing fat mass (FM) and fat-free mass (FFM) at the molecular level, given that the variability of the main FFM components (water, protein, and minerals) is assessed (5). Furthermore, techniques such as magnetic resonance imaging (MRI) and dual-energy X-ray absorptiometry (DXA) rely on high-cost equipment and qualified personnel, so relatively simple and low operating cost techniques such as anthropometry and bioimpedance have been preferred in clinical and field settings (5–7).
Several mathematical models and anthropometric indices have been proposed to estimate different body components and health risk factors, in order to simplify the role of health professionals in clinical practice or field assessments (8–10).
Previously, in a study by Bergman et al. (11), a new anthropometric index for the estimation of body fat mass was presented, called the Body Adiposity Index (BAI). In this study, the BAI was successfully validated using DXA as a reference method, for the determination of body fat percentage (BF%) in a sample of American and Mexican men and women. Subsequently, Barreira et al. (12) tested the BAI in a large sample of 3,851 subjects in Baton Rouge (USA) and concluded that the BAI is not a valid predictor of BF%. Likewise, a study conducted in Brazil (13) also pointed out that the BAI is not an efficient predictor of BF% in young Brazilian athletes of both sexes.
Considering the inconsistent findings regarding the validity of the BAI for determining BF% in different population groups, we hypothesized that the BAI may not be suitable for all populations. We verified the need to test the validity of the BAI to estimate the results obtained by DXA for BF% in different Brazilian subpopulations. Thus, the objective of this study was to verify the validity of the BAI in relation to DXA for estimating BF% in Brazilian adults, as well as to propose a new mathematical model to estimate the fat-free mass of this population.
Four hundred and twenty-four participants (51.9% women, 20–59 years old), from the northeast region of Brazil, who were recruited through dissemination among the participants of university extension projects from the Physical Education Department of the Federal University of Rio Grande do Norte (UFRN) were included in this cross-sectional study.
After their inclusion in the study, the sample was randomly divided into two groups, i.e., the group used for the development of a mathematical model for FFM (n = 283) and the cross-validation group (n = 141). For the sample size calculation, using FFM as a primary outcome, we considered a medium to small effect size (0.10) with six predictors (independent variables), with a type I error of 5% and a power of 95%. Using these parameters, a total of 132 participants was required.
All data collection was conducted in a single visit by each participant to the laboratory to perform anthropometric measurements and DXA assessments, after consenting to the ethical terms approved by the Ethical Committee of the University Hospital Onofre Lopes–HUOL/UFRN–ID CODE: 34804414.7.0000.5292. Individuals with any physical deficiency, prothesis, under specific diets, or reporting diuretic problems or edema were excluded from the sample.
Weight (W) was measured using a Sanny® digital scale (BL200PP, American Medical, São Bernardo do Campo, Brazil), with 0.1 kg precision. Participants were barefoot and wearing light clothes. The height (Ht) was measured using the stadiometer Caprice Sanny® (American Medical do Brasil, São Bernardo do Campo, Brasil) with 0.1 cm precision, and participants were barefoot, in an orthostatic position. Hip circumference (HC) was measured using a Sanny® measuring tape with 0.1 cm precision, at the level of the maximum extension of the buttocks posteriorly in a horizontal plane, as described in the original BAI article (11). Waist circumference (WC) was measured at the midpoint between the iliac crest and the lower border of the last rib, using a Sanny® anthropometric metal tape measure with 0.1 cm precision, with the participants standing and the tape measure over bare skin at the measurement site. The body mass index (BMI) was determined as the body mass (kg)/height2 (m).
The BAI was calculated using the height (Ht) and the hip circumference (HC) in Bergman et al. (11) equation as:
The DXA scan was performed using the Lunar Prodigy, model NRL 41990 (GE Lunar®, Madison, WI, USA) with participants in the supine position, feet attached and stabilized to the stretcher, and hands in pronation. Measurements were performed following the recommendations proposed by Nana et al. (14). The body composition was determined by enCORE software (GE Healthcare®, version 15.0, Madison, WI, USA).
The Kolmogorov-Smirnov test was applied to verify the normal distribution of the data. The descriptive analysis consisted of the mean and standard deviation of all study variables, and the comparisons between groups were performed using Student's t-test for independent samples.
To test the validity of the BAI to estimate BF%, the means of the results obtained by BAI and measured by DXA were compared using the paired t-test. In addition, Pearson's correlation coefficient (r), coefficient of determination (r2), and standard error of the estimate (SEE) were calculated. The approach proposed by Lin (15) was used for the concordance correlation coefficient (CCC) analysis to verify the validity (ρ) and accuracy (Cb) between the estimated and measured BF% values.
The stepwise multiple regression analysis was used to propose the new mathematical model for FFM. The stepwise regression analysis was conducted using FFM obtained by DXA as a dependent variable and age, sex, weight, height, hip circumference, and waist circumference as possible independent variables. During model development, the normality of the residuals and homogeneity of variance were tested. Significance at p < 0.05 was established as the criterion for inclusion of a predictor, whereas removal criteria were set at p > 0.1. If more than one variable remained in the model, and to assess multicollinearity, a variance inflation factor (VIF) and the tolerance (reciprocal of VIF) were calculated for each independent variable, and a VIF < 10 or tolerance higher than 0.1 was considered appropriate (16, 17). To verify the validity of the proposed model, the same approach as described for the BAI was used. For the cross-validation of the new model proposed in this study, a multiple regression analysis was performed. In turn, the new model accuracy was evaluated using pure error (PE), which was calculated as the square root of the mean of the sum of squared differences between the measurement and estimate of FFM (18). The Bland-Altman (19) plots were used to verify bias and concordance between FFM measurement and estimate, in which the limits of agreement (LOA) were defined as the mean of differences ± 1.96 standard deviations, including the analysis of the correlation between the mean and the difference of the methods. Analyses were carried out with the statistical package SPSS v.20.0 (SPSS Inc., IBM Corp., Armonk, New York, NY, United States) and MedCalc version 12.5.0. Statistical significance of p < 0.05 was considered for all tests.
Table 1 describes the physical characteristics and body composition variables for the developmental and cross-validation groups, as well as for the whole sample with no differences observed between the two groups (i.e., developmental and cross-validation) (p > 0.05).
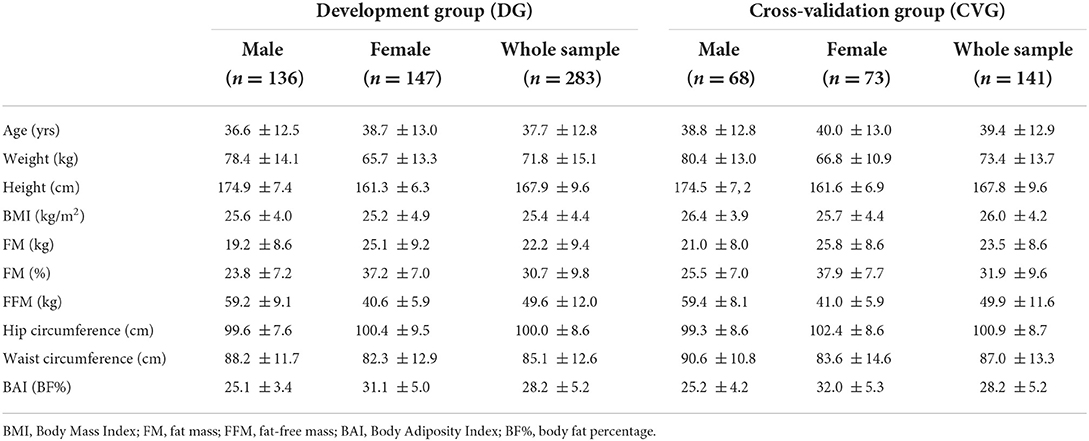
Table 1. Descriptive characteristics and body composition of development and cross-validation groups (mean ± sd).
When testing the validity of the BAI to estimate the body fat percentage, although the correlation with DXA was high (r = 0.795; p < 0.01), it was found that there was a significant difference when the mean results were compared with the measurements obtained by DXA (DXA = 30.7 + 9.8; BAI = 28.2 + 5.2; p < 0.01). The other validity criteria used are presented in Table 2, together with the performance of the cross-validation of the model proposed in this study for the estimation of fat-free mass.
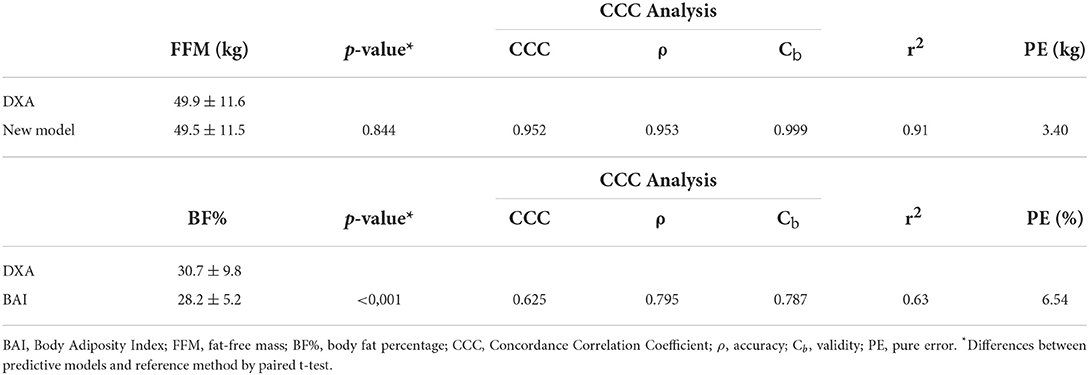
Table 2. Cross-validation of FFM predictive new model, and validation of BAI for BF%.
Table 3 shows the regression model for predicting FFM (kg). The possible independent variables used were: age (years), sex, weight (kg), height (cm), hip circumference (cm), and waist circumference (cm). Only the variables that contributed to the estimates using a backward stepwise approach were used in the model. The performance of the developed model can be observed by the high coefficient of determination (r2 = 0.91) and low standard error of the estimate (SEE = 3.67 kg).
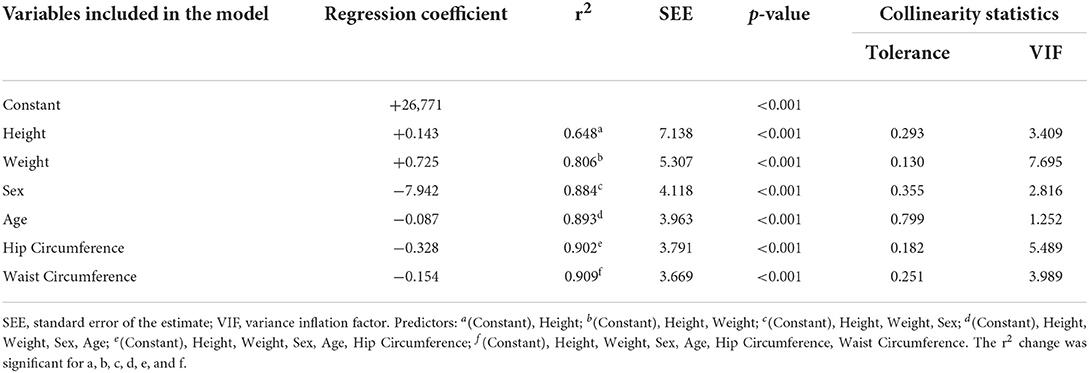
Table 3. Regression model for the prediction of FFM (kg).
The resulting prediction model included is shown below, including FFM (fat-free mass) in kg, height (Ht) in cm, weight (W) in kg, sex (male = 0; female = 1), age in years, hip circumference (HC) in centimeters and waist circumference (WC) in cm:
From the results of FFM, it is possible to calculate FM in kilograms by subtracting FFM from body mass (FM = BM – FFM). Then, it is also possible to calculate body fat percentage by the mathematical expression: BF% = (FM × 100)/BM.
Estimated FFM by the new model developed in this study did not present significant differences in comparison with the value determined by DXA for both the development and cross-validation groups. All parameters used for proposing and validating the model confirmed their validity. Additionally, no association was found between the mean and the difference in the methods (r = 0.08; p = 0.356).
Figure 1 presents the LOA in the cross-validation group for BF% between the standard method (DXA) and the BAI, and the LOA for FFM between DXA and the new model developed in this study.
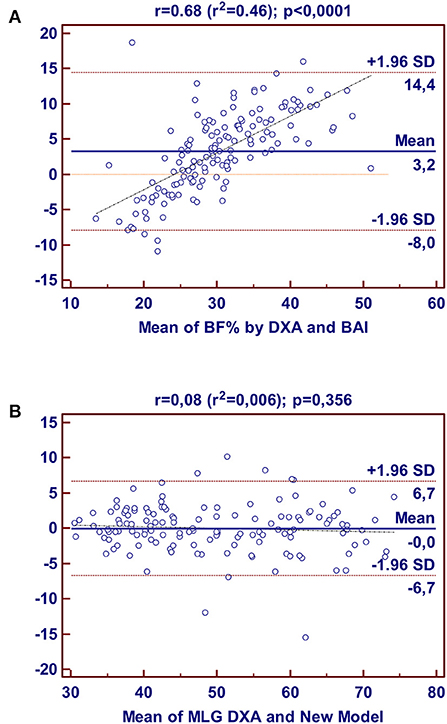
Figure 1. Bland-Altman plots for the concordance limits between values determined by the reference method (DXA) and BAI for BF% (A); and between values determined by the reference method (DXA) and New Model for FFM (B) in Brazilian adults, derived in this study.
The mean difference in the Bland-Altman plot was different from zero in the cross-validation group for BAI (p = 0.006) but was not different from zero for FFM by the new model (p = 0.728). For BAI, the LOA ranged between−8.0 and 14.4 for the body fat percentage, while the LOA ranged between−6.7 and 6.7 kg for fat-free mass, indicating poor agreement between BAI and DXA, but an acceptable agreement between the new model and the reference method.
The objective of the present study was to evaluate the validity of the BAI, using DXA as a reference, to estimate body fat percentage in subjects from the Brazilian population. The results did not confirm the validity of the BAI for estimating body fat in Brazilian adults, which justifies the need to create new mathematical models to estimate the body composition of this population. Thus, we developed and cross-validated a model for estimating fat-free mass through anthropometric measurements, using DXA as a reference method.
The BAI is an alternative DXA-based low-cost method for determining body adiposity with a simplified protocol and acceptable accuracy verified in different populations. However, except for the applicability of BAI for the diagnosis of excessive body fat, there is no consensus in the literature regarding its validity in different populations (7, 20).
The equations for the development of BAI are based on body height and hip circumference since these variables correlate with the BF% verified by DXA. The original study–named BetaGene–used men and women from the adult Mexican-American population of the USA. Different populations show distinct anthropometric characteristics, including body fat distribution (21, 22). Thus, an index based on a certain population may not attend to the specific characteristics of another population. Such conflict in the applicability of BAI has been evidenced by several studies (13, 20, 23–25). These reports consistently show that the BAI does not offer a valid estimation of BF% in subpopulations such as Caucasians, Europeans, adult Americans, female athletes, Brazilian women, and children. In line with the above, the main finding in our study was the poor validity of BAI, in relation to DXA, to estimate BF% in Brazilian adults.
An issue that deserves to be highlighted is that the use of BAI in men and women may have different associations with the body fat values obtained by DXA, which may be related to the distribution of body fat, as it is more concentrated in the gluteal-femoral region in women, in contrast to the abdominal region in men (26), thus interfering with the results of the BAI, which has hip circumference as one of its variables. In this way, perhaps a model that also uses waist circumference would provide better results.
Several studies have shown unsatisfactory results with the use of the BAI. Miazgowski et al. (27) analyzed 234 Caucasian women aged between 20 and 40 years and found a moderate correlation between the BF% values provided by the BAI and DXA. The validity of the BAI was also tested in 106 Asian adults by Lam et al. (24), and their results showed that the values obtained by BAI underestimated the BF% of individuals by an average of 5.77% in relation to DXA. Furthermore, Freedman et al. (28) found that BAI values reported a 75% overestimation in BF% of men and a 70% underestimation in women in a large sample of 1,151 adults of different ethnicities (37% Caucasian, 27% Black, 25% Hispanic, 8% Asian, and 3% others).
Differences in fat distribution in different ethnicities have been previously reported as being associated with environmental and cultural factors, such as nutrition habits and physical activity (21, 22). In this sense, despite the original study's validation of the BAI for the evaluation of BF% in North Americans, it seems that this validation was biased by the ethnicity of the sample, which was mostly Black.
The present study also found that there is a large difference in the limits of agreement between the BAI and DXA, according to the Bland-Altman plot. It was verified that the BAI might underestimate BF% as much as 8.0% or overestimate it up to 14.4% in adult Brazilians, which indicates that the BAI is not an adequate tool for the determination of BF% in healthy adult Brazilians. Convergently, Cerqueira et al. (20) previously detected a tendency for an overestimation when applying the BAI for the determination of BF% in Brazilians with low fat mass, as well as an underestimation in Brazilians with obesity.
Another study carried out in Brazil analyzed the validity of the BAI to estimate the BF% of 144 adults with severe obesity (candidates for bariatric surgery), using air displacement plethysmography (BOD POD®) as the standard technique (29). The authors showed poor validity of the BAI and LOA very close to those of the present study for the percentage of body fat (-7.48 to 14.84). Thus, the authors chose to develop a new mathematical model for the study population.
In this sense, the creation of a mathematical model for estimating body composition in the population of the present study, using simple anthropometric measurements, seems to be a viable way to obtain better results than the BAI. Thus, we developed and tested the validity of several models, and the one that presented the best results of validity and cross-validation was the one that proposed the estimation of fat-free mass and included as dependent variables height, weight, sex, age, hip circumference, and waist circumference, with excellent prediction performance observed by the high coefficient of determination (r2 = 0.91) and low standard error of the estimate (SEE = 3.67 kg).
The low cost and ease of use may explain the number of studies that have been carried out to propose anthropometric mathematical models for estimating body composition in different groups or to validate existing ones (30–35). However, most of these equations were proposed to meet the specificities of the group under study, such as breast-feeding children (30), children (34), adolescent athletes (33), healthy adults (31), or those with chronic diseases (32) and elite athletes (35), among many others, which cannot be generalized to groups other than the population of origin.
Considering that there is no consensus on generalizable anthropometric prediction equations to validly estimate body composition, a comprehensive study was carried out to develop and validate practical anthropometric predictions for lean body mass, fat mass, and percent fat in adults (men, n = 7,531; women, n = 6,534) participating in the National Health and Nutrition Examination Survey 1999-2006 (36). The authors derived several regression models, with different anthropometric measurements, including circumferences and skinfolds, and concluded that a practical equation including age, race, height, weight, and waist circumference had a high predictive ability for lean body mass and fat mass and that the inclusion of other circumferences and skinfold thickness slightly improved the prediction model.
There have been few studies carried out in Brazil with the aim of proposing mathematical models based on circumference measurements to estimate body composition. In the same geographic region of the country where we carried out our study, another study was previously carried out that proposed predictive equations for fat mass and fat-free mass of adolescents aged 10 to 16 years, based on anthropometric measurements, and concluded that the equations developed to estimate fat mass in females and fat-free body mass in all genders had high adjusted coefficients of determination (37).
More recently, in southern Brazil, a study was carried out to propose mathematical models for estimating the percentage of body fat in women aged 18 to 35 years, based on body circumferences (38). However, the authors only used Pearson's correlation coefficient and the paired t-test, in relation to DXA as a reference method, and lacked more robust statistical analyses to validate and carry out the cross-validation of the developed models.
In the same year, a mathematical model was developed to estimate the BF% of Brazilian subjects with severe obesity, and candidates for bariatric surgery, demonstrating high validity and limits of agreement similar to the present study, but this model does not apply to our sample since the anthropometric characteristics of the source population are very different from our sample (29).
This study has several strengths. To our knowledge, this is the first study to develop and cross-validate a predictive equation for FFM by body circumference, using DXA as a reference method, in Brazilian adults in the northeast region. The mathematical model developed in our study showed a high coefficient of determination and good limits of agreement in relation to the reference method, and all the parameters used for the proposition and cross-validation of the model confirmed its validity for the population studied (15, 18, 19, 39), which can be used to monitor changes in FFM resulting from dietary and exercise programs (40).
However, there are limitations to our study that must be addressed. The sample included adults from only one region of the country, and ethnicity was not assessed. Other studies carried out in Brazil for the development of predictive equations by anthropometry (38, 41) also used ethnically mixed samples, miscegenation, and ethnic differences, which suggests the need to validate the equation proposed in the study in other regions of the country and with subjects from different ethnic origins. Another important issue concerns the standard technique used. The 4C model is the most appropriate reference method to assess FM and FFM at the molecular level (5). However, due to the complexity of the technique (42), the use of DXA to derive anthropometric equations has been widely accepted (7, 34, 36, 37). It is noteworthy that the new equations are only useful for Brazilian adults with similar characteristics. In addition, more research should be carried out to test the accuracy of the new model in tracking FFM.
In the studied sample, the BAI showed low validity for estimating body fat, while the new proposed model proved to be a good option to assess the body composition of Brazilian adults. However, we are aware that the validity of the proposed model must be tested in other regions of the country and in other population groups in order to verify its applicability.
The datasets presented in this study can be found in online repositories. The names of the repository/repositories and accession number(s) can be found in the article/supplementary material.
The studies involving human participants were reviewed and approved by Ethical Committee of the University Hospital Onofre Lopes–HUOL/UFRN ID CODE: 34804414.7.0000.5292. The patients/participants provided their written informed consent to participate in this study.
JR: responsible for the concept/design, the data collection, the data analysis/interpretation, and drafting the article. RC: responsible for the interpretation and drafting the article. CG and MO: responsible for data collection, drafting the article, and critical revision of the article. PA-N and GD: responsible for translate to English, drafting the article, and critical revision of the article. BC: responsible for project supervision, data analysis/interpretation, and drafting the article. PD: responsible for the concept/design, project supervision, the data collection, drafting the article, and critical revision of the article.
The authors declare that the research was conducted in the absence of any commercial or financial relationships that could be construed as a potential conflict of interest.
All claims expressed in this article are solely those of the authors and do not necessarily represent those of their affiliated organizations, or those of the publisher, the editors and the reviewers. Any product that may be evaluated in this article, or claim that may be made by its manufacturer, is not guaranteed or endorsed by the publisher.
1. Bastien M, Poirier P, Lemieux I, Després J-P. Overview of epidemiology and contribution of obesity to cardiovascular disease. Prog Cardiovasc Dis. (2014) 56:369–81. doi: 10.1016/j.pcad.2013.10.016
2. Cristóvão MF, Sato APS, Fujimori E. Excesso de peso e obesidade abdominal em mulheres atendidas em Unidade da Estratégia Saúde da Família. Revista da Escola de Enfermagem da USP. (2011) 45:1667–72. doi: 10.1590/S0080-62342011000800005
3. Pinho CPS, Diniz AdS, Arruda IKGd, Batista Filho M, Coelho PC, Sequeira LAdS, et al. Prevalencia y factores asociados a la obesidad abdominal en individuos en una franja de edad de 25 a 59 años del estado de Pernambuco, Brasil. Cad Saúde Pública. (2013) 29:313–24. doi: 10.1590/S0102-311X2013000200018
4. da Costa RF, Masset KVdSB, de Sousa EC, Cabral BGdAT, Dantas PMS. Development and cross-validation of predictive equations of fat-free mass by bioelectrical impedance for Brazilian men aged 20 to 59 years old/Desenvolvimento e validacao cruzada de equacoes preditivas de massa livre de gordura por bioimpedanciometria, para homens brasileiros de 20 a 59 anos de idade. Motricidade. (2018) 14:26–33. doi: 10.6063/motricidade.16232
5. Heymsfield SB, Ebbeling CB, Zheng J, Pietrobelli A, Strauss BJ, Silva AM, et al. Multi-component molecular-level body composition reference methods: evolving concepts and future directions. Obes Rev. (2015) 16:282–94. doi: 10.1111/obr.12261
6. Kuriyan R. Body composition techniques. Indian J Med Res. (2018) 148:648–58. doi: 10.4103/ijmr.IJMR_1777_18
7. de Macêdo Cesário T, de Almeida-Neto PF, de Matos DG, Wells J, Aidar FJ, Costa RF, et al. Body adiposity index to analyze the percentage of fat in young men aged between 7 and 17 years. Am J Hum Biol. (2021) 34:e23599. doi: 10.1002/ajhb.23599
8. Gómez-Ambrosi J, Silva C, Catalán V, Rodríguez A, Galofré JC, Escalada J, et al. Clinical usefulness of a new equation for estimating body fat. Diabetes Care. (2012) 35:383–8. doi: 10.2337/dc11-1334
9. Thomas DM, Bredlau C, Bosy-Westphal A, Mueller M, Shen W, Gallagher D, et al. Relationships between body roundness with body fat and visceral adipose tissue emerging from a new geometrical model. Obesity. (2013) 21:2264–71. doi: 10.1002/oby.20408
10. Woolcott OO, Bergman RN. Relative fat mass (RFM) as a new estimator of whole-body fat percentage– a cross-sectional study in American adult individuals. Sci Rep. (2018) 8:1–11. doi: 10.1038/s41598-018-29362-1
11. Bergman RN, Stefanovski D, Buchanan TA, Sumner AE, Reynolds JC, Sebring NG, et al. A better index of body adiposity. Obesity. (2011) 19:1083–9. doi: 10.1038/oby.2011.38
12. Barreira TV, Harrington DM, Staiano AE, Heymsfield SB, Katzmarzyk PT. Body adiposity index, body mass index, and body fat in white and black adults. JAMA. (2011) 306:828–30. doi: 10.1001/jama.2011.1189
13. de Macêdo Cesário T, de Almeida-Neto PF, de Matos DG, Wells J, Aidar FJ, de Araujo Tinoco Cabral BG. Evaluation of the body adiposity index against dual-energy X-ray absorptiometry for assessing body composition in children and adolescents. Am J Hum Biol. (2021) 33:e23503. doi: 10.1002/ajhb.23503
14. Nana A, Slater GJ, Stewart AD, Burke LM. Methodology review: using dual-energy X-ray absorptiometry (DXA) for the assessment of body composition in athletes and active people. Int J Sport Nutr Exerc Metab. (2015) 25:198–215. doi: 10.1123/ijsnem.2013-0228
15. Lin LI. A concordance correlation coefficient to evaluate reproducibility. Biometrics. (1989) 45:255–68.
16. Guo S, Chumlea WC. Statistical methods for the development and testing of predictive equations. Human Body Composit. (1996) 10:191–202.
17. Ndagire CT, Muyonga JH, Odur B, Nakimbugwe D. Prediction equations for body composition of children and adolescents aged 8-19 years in Uganda using deuterium dilution as the reference technique. Clin Nutr ESPEN. (2018) 28:103–9. doi: 10.1016/j.clnesp.2018.09.004
18. Sun SS, Chumlea WC, Heymsfield SB, Lukaski HC, Schoeller D, Friedl K, et al. Development of bioelectrical impedance analysis prediction equations for body composition with the use of a multicomponent model for use in epidemiologic surveys. Am J Clin Nutr. (2003) 77:331–40. doi: 10.1093/ajcn/77.2.331
19. Bland JM, Altman D. Statistical methods for assessing agreement between two methods of clinical measurement. Lancet. (1986) 327:307–10. doi: 10.1016/S0140-6736(86)90837-8
20. Cerqueira M, Amorim P, Magalhaes F, Castro E, Franco F, Franceschini S, et al. Validity of body adiposity index in predicting body fat in a sample of Brazilian women. Obesity. (2013) 21:E696–E9. doi: 10.1002/oby.20543
21. Heymsfield SB, Peterson CM, Thomas DM, Heo M, Schuna Jr J. Why are there race/ethnic differences in adult body mass index–adiposity relationships? a quantitative critical review. Obes Rev. (2016) 17:262–75. doi: 10.1111/obr.12358
22. Jensen B, Moritoyo T, Kaufer-Horwitz M, Peine S, Norman K, Maisch MJ, et al. Ethnic differences in fat and muscle mass and their implication for interpretation of bioelectrical impedance vector analysis. Appl Physiol Nutr Metab. (2019) 44:619–26. doi: 10.1139/apnm-2018-0276
23. Johnson W, Chumlea WC, Czerwinski SA, Demerath EW. Concordance of the recently published body adiposity index with measured body fat percent in European-American adults. Obesity. (2012) 20:900–3. doi: 10.1038/oby.2011.346
24. Lam BCC, Lim SC, Wong MTK, Shum E, Ho CY, Bosco JIE, et al. A method comparison study to validate a novel parameter of obesity, the body adiposity index, in Chinese subjects. Obesity. (2013) 21:E634–E9. doi: 10.1002/oby.20504
25. Vinknes KJ, Elshorbagy AK, Drevon CA, Gjesdal CG, Tell GS, Nygård O, et al. Evaluation of the body adiposity index in a Caucasian population: the hordaland health study. Am J Epidemiol. (2013) 177:586–92. doi: 10.1093/aje/kws271
26. Chang H, Simonsick EM, Ferrucci L, Cooper JA. Validation study of the body adiposity index as a predictor of percent body fat in older individuals: Findings from the BLSA. J Gerontol A Biol Sci Med Sci. (2014) 69:1069–75. doi: 10.1093/gerona/glt165
27. Miazgowski T, Safranow K, Major-Gołuch A, Krzyzanowska-Swiniarska B. Validation of a new index of body adiposity (BAI) to assess body fat in normal weight premenopausal Caucasian women. e-SPEN J. (2012) 7:e115–e8. doi: 10.1016/j.clnme.2012.02.006
28. Freedman DS, Thornton JC, Pi-Sunyer FX, Heymsfield SB, Wang J, Pierson Jr RN, et al. The body adiposity index (hip circumference÷ height1. 5) is not a more accurate measure of adiposity than is BMI, waist circumference, or hip circumference. Obesity. (2012) 20:2438–44. doi: 10.1038/oby.2012.81
29. Belarmino G, Torrinhas RS, Sala P, Horie LM, Damiani L, Lopes NC, et al. A new anthropometric index for body fat estimation in patients with severe obesity. BMC Obes. (2018) 5:25. doi: 10.1186/s40608-018-0202-8
30. Bandara T, Hettiarachchi M, Liyanage C, Amarasena S, Wong WW. Body composition among Sri Lankan infants by 18O dilution method and the validity of anthropometric equations to predict body fat against 18O dilution. BMC Pediatr. (2015) 15:52. doi: 10.1186/s12887-015-0371-2
31. Cicone ZS, Nickerson BS, Choi Y-J, Holmes CJ, Hornikel B, Fedewa MV, et al. Generalized equations for predicting percent body fat from anthropometric measures using a criterion five-compartment model. Med Sci Sports Exerc. (2021) 53:2675–82. doi: 10.1249/MSS.0000000000002754
32. Diniz KGD, Vieira DA, Colosimo EA, Coelho MPP, Bering T, Teixeira R, et al. Derivation and validation of a simple anthropometric equation to predict fat-free mass in patients with chronic hepatitis C. Clin Nutr. (2021) 40:1281–8. doi: 10.1016/j.clnu.2020.08.011
33. Gomez-Campos R, Santi-Maria T, Arruda M, Maldonado T, Albernaz A, Schiavo M, et al. Fat-free mass and bone mineral density of young soccer players: proposal of equations based on anthropometric variables. Front Psychol. (2019) 10:522. doi: 10.3389/fpsyg.2019.00522
34. Salazar G, Leyton B, Aguirre C, Anziani A, Weisstaub G, Corvalán C. Anthropometric and bioimpedance equations for fat and fat-free mass in Chilean children 7-9 years of age. Br J Nutr. (2021) 126:37–42. doi: 10.1017/S0007114520003906
35. Sesbreno E, Slater G, Mountjoy M, Galloway SDR. Development of an anthropometric prediction model for fat-free mass and muscle mass in elite athletes. Int J Sport Nutr Exerc Metab. (2020) 30:174–81. doi: 10.1123/ijsnem.2019-0232
36. Lee DH, Keum N, Hu FB, Orav EJ, Rimm EB, Sun Q, et al. Development and validation of anthropometric prediction equations for lean body mass, fat mass and percent fat in adults using the National Health and Nutrition Examination Survey (NHANES) 1999–2006. Br J Nutr. (2017) 118:858–66. doi: 10.1017/S0007114517002665
37. Lyra CO, Lima SCVC, Lima KC, Arrais RF, Pedrosa LFC. Prediction equations for fat and fat-free body mass in adolescents, based on body circumferences. Ann Hum Biol. (2012) 39:275–80. doi: 10.3109/03014460.2012.685106
38. Salamunes ACC, Stadnik AMW, Neves EB. Estimation of female body fat percentage based on body circumferences. Revista Brasileira de Medicina do Esporte. (2018) 24:97–101. doi: 10.1590/1517-869220182402181175
39. Lohman T, Milliken LA, Medicine ACoS. ACSM's Body Composition Assessment: Human Kinetics (2019).
40. Costa RF, Silva AM, Cabral BGdAT, Dantas PMS. Development and cross-validation of predictive equations for fat-free mass and lean soft tissue mass by bioelectrical impedance in Brazilian women. Eur J Clin Nutr. (2022) 76:288–96. doi: 10.1038/s41430-021-00946-x
41. Hoffman DJ, Toro-Ramos T, Sawaya AL, Roberts SB, Rondo P. Estimating total body fat using a skinfold prediction equation in Brazilian children. Ann Hum Biol. (2012) 39:156–60. doi: 10.3109/03014460.2012.660989
Keywords: obesity, physical evaluation, body composition, Body Adiposity Index, fat percentual, body fat percentage, fat-free mass
Citation: Ribeiro da Costa JR, Costa RF, Goncalves CAM, de Oliveira Borges MV, Almeida-Neto PFD, De Assis GG, Cabral BGDAT and Dantas PMS (2022) The Body Adiposity Index is not applicable to the Brazilian adult population. Front. Nutr. 9:888507. doi: 10.3389/fnut.2022.888507
Received: 02 March 2022; Accepted: 24 June 2022;
Published: 25 August 2022.
Edited by:
Diego Augusto Santos Silva, Federal University of Santa Catarina, BrazilReviewed by:
Leigh C. Ward, The University of Queensland, AustraliaCopyright © 2022 Ribeiro da Costa, Costa, Goncalves, de Oliveira Borges, Almeida-Neto, De Assis, Cabral and Dantas. This is an open-access article distributed under the terms of the Creative Commons Attribution License (CC BY). The use, distribution or reproduction in other forums is permitted, provided the original author(s) and the copyright owner(s) are credited and that the original publication in this journal is cited, in accordance with accepted academic practice. No use, distribution or reproduction is permitted which does not comply with these terms.
*Correspondence: Paulo Francisco De Almeida-Neto, cGF1bG8yMjA5MTFAaG90bWFpbC5jb20=
Disclaimer: All claims expressed in this article are solely those of the authors and do not necessarily represent those of their affiliated organizations, or those of the publisher, the editors and the reviewers. Any product that may be evaluated in this article or claim that may be made by its manufacturer is not guaranteed or endorsed by the publisher.
Research integrity at Frontiers
Learn more about the work of our research integrity team to safeguard the quality of each article we publish.