 Heyu Wang
 Yu Tong1
 Hui Li
 Wei Wu
95% of researchers rate our articles as excellent or good
Learn more about the work of our research integrity team to safeguard the quality of each article we publish.
Find out more
ORIGINAL RESEARCH article
Front. Nutr. , 25 April 2022
Sec. Food Chemistry
Volume 9 - 2022 | https://doi.org/10.3389/fnut.2022.865077
This article is part of the Research Topic Recent Advances in Recognition of Bioactive Phytonutrients for Specific Targets in Plant Foods View all 11 articles
Objective: Ginseng berry (GB) was the mature fruit of medicinal and edible herb, Panax ginseng C.A. Meyer, with significant hypoglycemic effect. Ginsenoside was the main hypoglycemic active component of GB. Evaluating and screening the effective components of GB was of great significance to further develop its hypoglycemic effect.
Methods: The polar fractions of ginseng berry extract (GBE) were separated by a solvent extraction, and identified by ultra-high performance liquid chromatography–high-resolution mass spectrometry (UHPLC–MS). The insulin resistance model of HepG2 cells was established, and the hypoglycemic active fraction in GBE polar fractions were screened in vitro. Rat model of type 2 diabetes mellitus (T2DM) was established to verify the hypoglycemic effect of the GBE active fraction. The metabolomic study based on UHPLC–MS was used to analyze the differential metabolites in the serum of T2DM rats after 30 days of intervention with hypoglycemic active GBE fraction. The kyoto encyclopedia of genes and genomes (KEGG) metabolic pathway enrichment analysis was used to study the main metabolic pathways involved in the regulation of hypoglycemic active parts of GBE.
Results: It was found that GBE-5 fraction had better hypoglycemic activity than other GBE polar fractions in vitro cell hypoglycemic activity screening experiment. After 30 days of treatment, the fasting blood glucose value of T2DM rats decreased significantly by 34.75%, indicating that it had significant hypoglycemic effect. Eighteen differential metabolites enriched in KEGG metabolic pathway were screened and identified in the rat serum from T2DM vs. GBE-5 group, and the metabolic pathways mainly involved in regulation include arachidonic acid (AA) metabolism, linoleic acid (LA) metabolism, unsaturated fatty acid biosynthesis, and ferroptosis.
Conclusions: The hypoglycemic effect of GBE-5 fraction was better than that of total ginsenoside of GB. The AA metabolism, LA metabolism, unsaturated fatty acid biosynthesis, and ferroptosis were the potential metabolic pathways for GBE-5 fraction to exert hypoglycemic regulation.
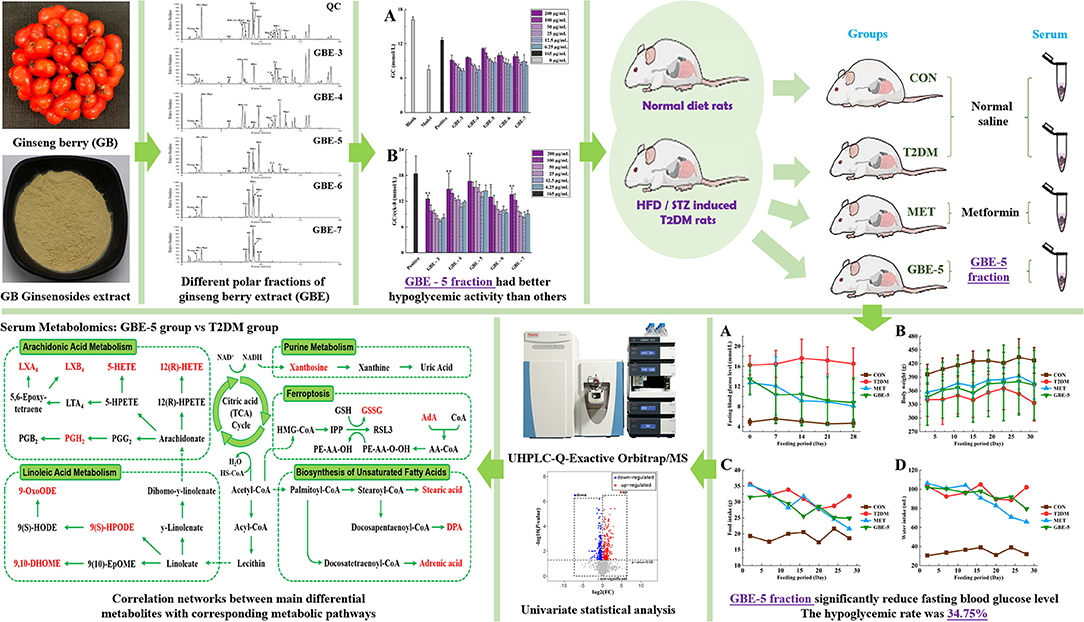
Graphical Abstract. The main experimental process of this study.
Ginseng (Panax ginseng C.A. Meyer), a perennial herb in the genus Panax of the Araliaceae family, has been used as herbal medicine, functional food, or dietary supplement in Asian countries for thousands of years, which was the globally top-selling herbal product (1). As a natural plant-based supplement, ginseng has gradually developed many ginseng-based foods, such as ginseng beverage, ginseng tea, ginseng sugar, and ginseng honey tablets (2). Ginseng berry (GB) was the mature fruit of P. ginseng, which could be harvested from the year of fourth of the ginseng planting (3). The main active component of GB were ginsenosides, which had anti-cancer, anti-oxidant, anti-inflammatory, immune modulation, hypoglycemic, and anti-diabetic effects (4–10). The content of ginsenosides in GB was more abundant than that in ginseng root (3); therefore, it has shown a stronger effect in anti-diabetic (2), which has been developed as a clinical drug for treatment and improvement of type 2 diabetes mellitus (T2DM) and its complications, such as Zhenyuan capsule, the main ingredient was GB total ginsenosides extract, had good hypoglycemic and hypolipidemic effects (11).
The research showed that the content of ginsenoside in GB was 4–10 times that of ginseng root (12), and the content of ginsenoside Re was 7–30 times that of ginseng root (13). It was reported that the content of ginsenoside Re in GB accounts for 85% of the total ginsenosides (11), which meant that ginsenoside Re may be the main active component of GB. In previous studies, the hypoglycemic activity of total ginsenosides extract of GB was verified (7), it was found that GB could significantly reduce the fasting blood glucose in T2DM rats, and the hypoglycemic rate was 27.35%. Further research on ginsenoside Re found that although Re was the main component of GB, its hypoglycemic rate was lower than GB, which was 21.97% (14), indicated that the hypoglycemic effect of GBE was not caused by a single component, but by multiple active components acting on multiple targets so as to play the role of reducing blood glucose. In general, the latest research on the hypoglycemic effects of ginseng and American ginseng mainly focused on total saponins (7, 15) or single ginsenoside (14, 16, 17), while there were few studies on hypoglycemic combination components. Among the reported hypoglycemic mechanisms of ginseng, relevant studies mainly focused on the level of cell signal transduction pathway, while there were few studies based on the mechanism of metabolic pathway. Therefore, it was necessary to screen the pharmacodynamic material basis of hypoglycemic effect in GB in order to further develop and utilize its excellent hypoglycemic activity.
Type 2 diabetes mellitus was mainly caused by insulin resistance or insufficient insulin secretion (18), ginsenosides could promote insulin secretion, increased insulin sensitivity, and reduced blood glucose concentration, but will not increase the risk of hypoglycemia (19). In the study of diabetes, the T2DM rats induced by high-fat and high-sucrose (HFD) diet combined with streptozotocin (STZ) was usually used as experimental animal models in vivo, and the STZ destroyed rat islet β-cell to simulate the state of insufficient insulin secretion (20, 21). It was stated that HepG2 was a popular hepatic cell line, its surface contained high-affinity insulin receptor, which could meet the requirements of typical insulin receptor (22), and in vitro, the HepG2 human hepatoma cells were usually used to establish insulin resistance model to simulate insulin resistance in the patients with diabetics. There were three main modeling methods of HepG2 cell insulin resistance model, high-glucose induced cell insulin resistance model, high-concentration insulin induced cell insulin resistance model, and fatty acid (palmitic acid) induced cell insulin resistance model (23). In recent years, scholars often use fatty acid method for relevant experimental research (24), and compared with other modeling methods, it has more reliable characteristics.
In this study, cell model activity screening combined with metabolomics was used to explore the active components of GB total ginsenosides, which had good hypoglycemic activity. As shown in Graphical Abstract, the polar segmentation of the total ginsenosides GBE was separated by organic solvent extraction, and the insulin resistance model of HepG2 cells was established, and the hypoglycemic active fraction of GBE was screened in vitro, then the hypoglycemic activity was verified by T2DM rat model. The univariate statistical analysis based on UHPLC–MS was used to screen the differential metabolites in rat serum after 30 days of intervention. Combined with the enrichment analysis of KEGG metabolic pathway, the potential targets of hypoglycemic active fraction of GBE were explored.
The P. ginseng berry was purchased from Ji-An (Jilin, China) in June 2019, the botanical identification was undertaken by Professor L. Jiao, and the voucher specimen (No. 20190002) was kept at the Jilin Ginseng Academy, Changchun University of Chinese Medicine, China. Ginseng berry total ginsenosides extract was prepared according to the literature method (7). Also, HepG2 human hepatoma cell line was purchased from Shanghai Institute of Biochemistry and Cell Biology, Chinese Academy of Sciences (Shanghai, China).
Petroleum ether, ethyl ether, ethyl acetate–ethyl ether and n-butanol were purchased from Beijing chemical works (AR, Beijing, China). Sodium hydroxide (NaOH) was purchased from Tianjin Xintong Chemical Co., Ltd (AR, Tianjin, China). Streptozotocin was purchased from Sigma chemical Co. (St. Louis, MO, USA). Citric acid and sodium citrate were purchased from Beijing Taibo Chemical Co., Ltd. (Beijing, China). Noto-ginsenoside R1, Ginsenoside Rg1, Re, Rf, Rb1, Rc, Rb2, Rb3, Rd, F2, Rg3 (purity ≥ 98%) were purchased from the National Institutes for Food and Drug Control (Beijing, China). The UHPLC-grade acetonitrile and formic acid were purchased from Fisher Scientific (Waltham, MA, USA). Ultrapure water was filtered using a Milli-Q device (Millipore, Milford, MA, USA). Cell Counting Kit-8 (CCK-8) was purchased from Dojindo Chemical Co. (Dojindo, Kumamoto, Japan). Bovine serum albumin (BSA) was purchased from Shanghai Yuan-ye Bio-Technology Co., Ltd (Shanghai, China). Glucose assay kit were obtained from Nanjing Jiancheng Biotech. Co., Ltd. (Nanjing, China).
Weighed 30 g of total ginsenoside from ginseng berry extract (GBE), added 300 ml of distilled water and dissolved in 60°C water bath, placed it in 1,000 ml separatory funnel, and added different organic reagents to extract it in turn. First, petroleum ether was added and extracted for 3 times, 300 ml each time, after combination, ginseng berry extraction I (GBE-1) was obtained. Added ethyl ether solution, extracted 3 times, with the volume of 300 ml each time, and combined to obtain ginseng berry extraction II (GBE-2). Added ethyl acetate–ethyl ether (3:2, v/v) solvent and extracted for 3 times. The addition volumes were 300, 200, and 150 ml, respectively. The extraction of ginseng berry extraction III (GBE-3) was obtained by merging the extraction layers. Added ethyl acetate-n-butanol (4:1, v/v) solvent for extraction for 3 times, and the added volumes were 300, 200, and 150, respectively. After merging extraction layers, the extraction of ginseng berry extraction IV (GBE-4) was obtained. Add ethyl acetate-n-butanol (10:9, v/v) solvent, extracted for 3 times, with the volume of 300, 200, and 150 ml, respectively, and combined to obtain the extraction of ginseng berry extraction V (GBE-5). Also, N-butanol was added for extraction for 3 times, and each time, the volume was the same as that of the remaining aqueous solution. After the combination, the extraction of ginseng berry extraction VI (GBE-6) was obtained. Finally, the GBE-6 fraction was back extracted with distilled water for 3 times, and the amount of each time was 1/2 of the volume of n-butanol. After converged, the ginseng berry stripping VII (GBE-7) was obtained. Weighed 6 parts of GBE, extracted 6 times in parallel with the above method, concentrated each extraction layer under reduced pressure, and froze dry to obtain the corresponding polar fractions; GBE-1 and GBE-2 fractions were liposoluble constituents, which were not used in subsequent experiments.
The HepG2 cells were cultured in RPMI 1640 completed medium (SH30809-01, Hyclone, Logan, UT, USA), containing 10% fetal bovine serum (FBS, Gibco, Grand Island, NY, USA) and 1% penicillin-streptomycin (BBI life Sciences, Shanghai, China) in a 5% CO2 humidified atmosphere at 37°C. Took the cells in logarithmic growth period for the experiment.
The HepG2 cells (5 × 10⁴ cells·ml−1) were seeded in 96-well cell culture plates,100 μl per hole, and cultured in 5% CO2 incubator at 37°C for 24 h. Then they are divided into 3 groups: Blank group, control group (CON group), and experimental groups. The blank group had only completed medium without cells and drugs, the CON group was normal cultured cells by completed medium without drugs, and experimental groups were normal cultured cells added with GB extraction fractions GBE-3, GBE-4, GBE-5, GBE−6, and GBE-7, respectively, which also dissolved in the completed medium. The concentrations of each fraction were 1,000, 500, 250, 125, 62.5, and 36.25 μg·ml−1, respectively. All groups and fractions set six multiple holes with 100 μl per hole. All complete medium contained 0.1% dimethyl sulfoxide (DMSO). Then cultured for 24 h, and the medium was sucked out, add another 100 μl basal-medium as well as 10 μl CCK-8 solution to each hole, incubated for another 2 h, and then determined the absorbance value at 450 nm.
The insulin resistance model of HepG2 cells was established by palmitic acid (PA, Solarbio, Beijing, China). A 100 mmol·L−1 palmitic acid (PA) solution was prepared with absolute ethanol; 0.1 mol L−1 NaOH solution and 10% BSA solution were prepared with ultrapure water. Mixed the PA solution with NaOH solution (1:1 v/v) by water bath at 70°C for 30 min, the mixed solution was then mixed with 10% BSA solution (1:19 v/v), vortex for 30 s, and water bath at 55°C for 15 min to prepare PA working fluid (2.5 mmol·L−1). Diluted the PA working fluid with complete medium at the concentrations of 1, 0.75, 0.5, and 0.25 mmol·L−1, respectively, and filtered. HepG2 cells (5 × 10⁴ cells·ml−1, dissolved in completed medium) were seeded in 96-well microtiter plates, and set up the following three groups: Blank group (only complete medium), normal group (cells with complete medium), and model group, respectively. The model group was added with concentrations of 1, 0.75, 0.5, and 0.25 mmol·L−1 PA working fluid, respectively. Also, six multiple holes were set with 100 μl per hole in every groups. After incubation at 37°C for 24 h, sucked out the culture-medium of each group, washed it with phosphate buffered saline (PBS, Gibco, Carlsbad, CA, USA) for 3 times, and added 100 μl basal-medium in each group, continued to cultivate for 24 h; then detected the glucose content in the medium, and calculated the glucose consumption (GC) of cells in each group.
The HepG2 cells (5 × 10⁴ cells·ml−1) were seeded on 96-well cell culture plates with 100 μl per hole. Set up a blank group (only blank group had no cells), a normal group, a model group, a positive group, and an experimental group, with six multiple holes in each group. Discarded the original medium, continued to add complete medium to the blank group and normal group, and add 0.25 mmol·L−1 PA working fluid to the model group, positive group, and experimental group, 100 μl per hole in each group. Then, cells were incubated for 24 h to establish the insulin resistance model of HepG2 cells. After the experimental model was established, the medium of each group was sucked out and washed with PBS for 3 times. Then the blank group, normal group, and model group were added with complete medium which had no drugs. The positive group was added with 165 μg·ml−1 concentration of metformin which dissolved in complete medium. The experimental group was added with complete medium containing the GB extracted fractions GBE-3, GBE-4, GBE-5, GBE−6, and GBE-7, the concentrations of each extracted fraction were 200, 100, 50, 25, 12.5, and 6.25 μg·ml−1, respectively. Every medium contained 0.1% DMSO. Each group was incubated for another 24 h, then the medium was discarded, washed with PBS for 3 times, add 100 μl basal-medium in each group, incubated again in 5% CO2 incubator at 37°C for 24 h. Then the glucose content in each group were measured. Cell GC = Glucose content of blank group – Glucose content of corresponding group.
After the glucose content of each group was detected, 10 μl CCK-8 reagent was added to each well of 96-well cell culture plates, which was then cultured for 2 h, and the absorbance value at 450 nm was measured to calculate the cell survival rate. The cell survival rate = [(A – C) /(B – C)] × 100%, where A was the absorbance value of the experimental group, B was the absorbance value of the normal group, and C was the absorbance value of the blank group.
A 7-week-old adult male Wistar rats (weighing 190 ± 10 g) were supplied by the Experimental Animal Center of Jilin University (Changchun, Jilin, China). All rat experimental procedures were performed in accordance with the Regulations for the Administration of Affairs Concerning Experimental Animals approved by the State Council of People's Republic of China. Rats were raised in a standard SPF barrier environment. The conditions were constant temperature of 23 ± 2°C, relative humidity of 40–80%, alternating day and night light cycle of 6:00 a.m. to 6:00 p.m., and the rats were free to eat and drink. After 7 days of environmental adaptation, 8 rats were randomly selected as the CON group, which was fed with ordinary diet during the whole experiment. The other rats were fed with HFD, which were consisting of 10.0% lard, 20.0% sucrose, 2.5% cholesterol, 1.0% sodium cholate, and 66.5% pulverized standard rat pellet (7). After 8 weeks of HFD feeding, the rats were intraperitoneally injected with freshly prepared STZ (40 mg·kg−1 b.w.) dissolved in citric acid buffer (0.1 mol·L−1, pH 4.3–4.5). The rats in CON group were only injected with citric acid buffer. After 7 days, fasting blood glucose was measured after fasting for 12 h. The blood glucose value ≥7.8 mmol L−1, accompanied by symptom of polyuria and polydipsia, was regarded as successfully established T2DM rats. Also, 24 T2DM rats were randomly divided into three groups (n = 8), including GBE-5 group, which was fed HFD diet, and intragastrically administered with 200 mg·kg−1 (b.w.) ginseng berry GBE-5 fraction dissolved in saline once daily. The metformin (MET) group was fed with HFD diet, and intragastrically administered metformin dissolved in saline once daily, with a therapeutic dose of 100 mg · kg−1 (b. w.). The T2DM group was fed with HFD diet and intragastrically administered with saline once daily. The CON group was fed with normal diet and intragastrically administered with saline once daily. The blood glucose value of rats after fasting for 12 h was measured every 7 days; the body weight (b.w.), food consumption, and water consumption within 24 h were measured every 4 days.
After 30 days of continuous intervention, the rats fasted for 12 h, and were anesthetized by intraperitoneal injection of 10% chloral hydrate (3 ml/kg b. w.) for 15 min, and blood was collected from the abdominal aorta of the rats. After the plasma was left at room temperature for 60 min, centrifuged at 3,000g and 4°C for 15 min, it was immediately put into liquid nitrogen and finally stored in the refrigerator at −80°C. The serum samples were thawed at 4°C before analysis, and 250 μl of serum mixed with 750 μl chromatographic methanol (1:3 v/v, 4°C), vortex for 30 s, and then centrifuged at 12,000 rpm for 15 min at 4°C. Take the supernatant, blow dry with nitrogen, add 1.0 l of ultrapure water for re-dissolution (4°C), vortex for 15 s, centrifuged again at 12,000 rpm for 15 min at 4°C, and the supernatant was filtered through 0.22 μm membrane filter before UHPLC–MS detection.
An analysis was performed using UHPLC-ESI-Q-Exactive Orbitrap/MS system. The UHPLC was equipped with UltiMate 3000 system (Thermo Fisher Scientific, Dionex, Sunnyvale, CA, USA) coupled with Golden C18 column (2.1 × 50 mm, 1.9 μm, Thermo Fisher Scientific, San Jose, CA, USA) maintained at 35°C. The automatic sampler and sample chamber temperature was 4°C, sample injection volume was 2.0 μl, the flow rate was 0.3 ml/min, the mobile phase A was 0.1% formic acid in water, and phase B was 100% acetonitrile. The chromatographic conditions of rat serum were: 0–1 min, 3% phase B, 1–16 min, 3–70% phase B, 16–18 min, 70% phase B, 18–25 min, 70–90% phase B, 25–26 min, 90–100% phase B, 26–30 min, 100% phase B. The chromatographic conditions of GBE fractions were: 0–20 min, 25–65% phase B, 20–25 min, 65–100% phase B, 25–30 min, 100% phase B.
The MS detection was performed on Q-Exactive orbitrap MS (Thermo Fisher Scientific, USA), for which the source parameters were set as follows: Sweep gas flow was 0.175 Mpa, sheath gas flow was 6.125 Mpa, and auxiliary gas flow was 2.625 Mpa. The capillary temperature was 320°C, the capillary voltage was 3.5 kV, and the auxiliary gas heater temperature was 350°C. The electrospray ionization source in both positive (ESI+, pos) and negative (ESI–, neg) ion modes was used, and the scanning range were m/z 66.7 ~ 1,000 (rat serum) and m/z 133.4 ~ 2,000 (GBE fractions). The scan mode was Full MS with dd-MS2, Top N = 8, of which the resolution was 17,500 (date dependent-MS2) and 70,000 (Full MS), respectively, and the collision energy was 10, 20, and 40%, when it was dd-MS2 mode. The instrument was able to meet the quality accuracy of pos/neg and MS/MS2 cycling. Our selected acquisition mode improved the efficiency of acquisition, and also met the requirements of the established secondary MS2 identification efficiency. The data were recorded and analyzed using the Xcalibur software (Version 2.2.42, Thermo Fisher Scientific, USA).
To test the stability and reproducibility of the system, quality control (QC) samples of rat serum and GBE fractions were prepared, respectively. Took a small part of the same volume from all samples, mixed it and treated it according to the treatment method of corresponding samples to obtain QC samples of rat serum and GBE fractions, respectively. Before the experiment, QC samples were tested 6 times to balance the UHPLC–MS analysis system, and then QC samples and blank samples (75% acetonitrile in water) were tested once between every 6 samples in the sample detection sequence.
The raw data of rat serum was obtained from DionexTM, ChromeleonTM 6.8, and Thermo Xcalibur, which was then imported into Progenesis QI v 2.3 software (Newcastle, UK) and used for deconvolution, calibrate the retention time (RT), peak alignment, and normalization. Combined the positive and negative ion data into a data matrix and saved as Excel file, which was then imported to the R programming language software (Ropls package v3.6.2) for the principal components analysis (PCA), and observed the overall distribution of each sample and the stability of the UHPLC–MS analysis process. Univariate statistical analysis was carried out by Stats software package, and ggplot2 package was used to get the volcano plot, which could visualize the p-value and the fold change (FC) value. Metabolite meeting p < 0.05 as well as FC ≥ 1.5 or FC ≤ 0.67 was usually considered to be differential metabolites.
Metabolomics databases such as human metabolome database (HMDB) (http://www.hmdb.ca/), Lipidmaps v2.3 (http://www.lipidmaps.org), and METLIN (https://metlin.scripps.edu/) were screened and identified the matched metabolites, when the product ion mass spectra and MS/MS fragment ion suited with the structural information in the databases. The KEGG (https://www.kegg.jp/) database was used for metabolic pathway enrichment analysis of potential differential metabolites.
In order to verify the stability and reliability of the UHPLC-MS and acquired data, PCA analysis was carried out on GBE fractions and its QC samples. As shown in Figure 1A, it could be observed that QC samples showed a good aggregation state in the PCA score plot and approached the coordinate origin, indicating that the experimental condition was in a stable state during the data collection.
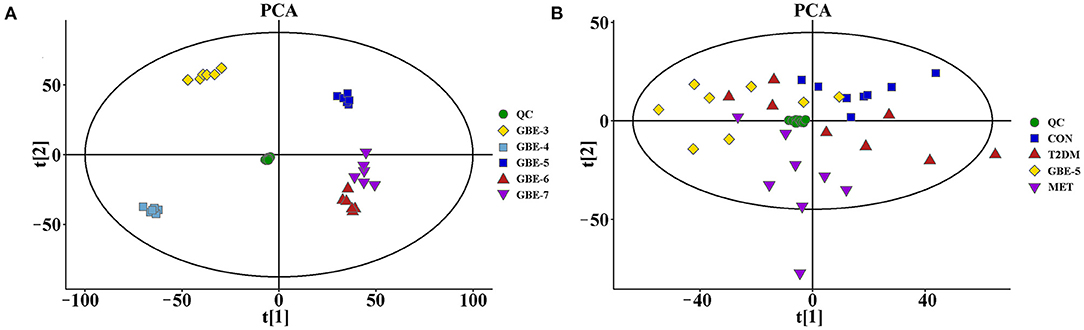
Figure 1. The principal component analysis (PCA) score plots of GBE fractions (A) and rat serum samples (B).
The total ion chromatograms (TIC) of the GBE fractions obtained by UHPLC–MS were shown in Figure 2, in which both were in negative ion mode (ESI-), and the ion peaks in the spectrum were well separated, indicating that the corresponding chromatographic and MS conditions were suitable for samples determination. As the polarity of the seven reagents (or mixed reagents) used in the extraction segmentation process increased in turn, the polarity was petroleum ether < ethyl ether < ethyl acetate–ethyl ether (3:2, v/v) < ethyl acetate-n-butanol (4:1, v/v) < ethyl acetate-n-butanol (10:9, v/v) < n-butanol < distilled water, respectively. Therefore, the polarity of the corresponding extraction fractions GBE-1 to GBE-7 also increased in turn, which could be seen from the TIC that the RT (min) of the active components in GBE-3 to GBE-7 fraction gradually moved to the left (GBE-1 and 2 fractions were discarded), indicating that the polarity of the main active components of each fraction gradually increased, suggesting that the solvent extraction method could segmented the GBE well. Weighed 30 g of GBE, respectively; prepared the extract fractions in parallel for 6 times; and dried them to constant weight. The final average weight of each fraction was 0.51 ± 0.03 g for GBE-3, 6.05 ± 0.08 g for GBE-4, 12.31 ± 0.18 g for GBE-5, 5.76 ± 0.16 g for GBE-6, and 1.37 ± 0.09 g for GBE-7 fraction, respectively. It could be seen that the main active components of GBE were concentrated in GBE-4 to GBE-6 fractions. The main component of GBE-4 was 20(S)-protopanaxatriol, while the main component of GBE-5 and GBE-6 was 20(S)-protopanaxadiol. The result was expressed as mean ± SD.
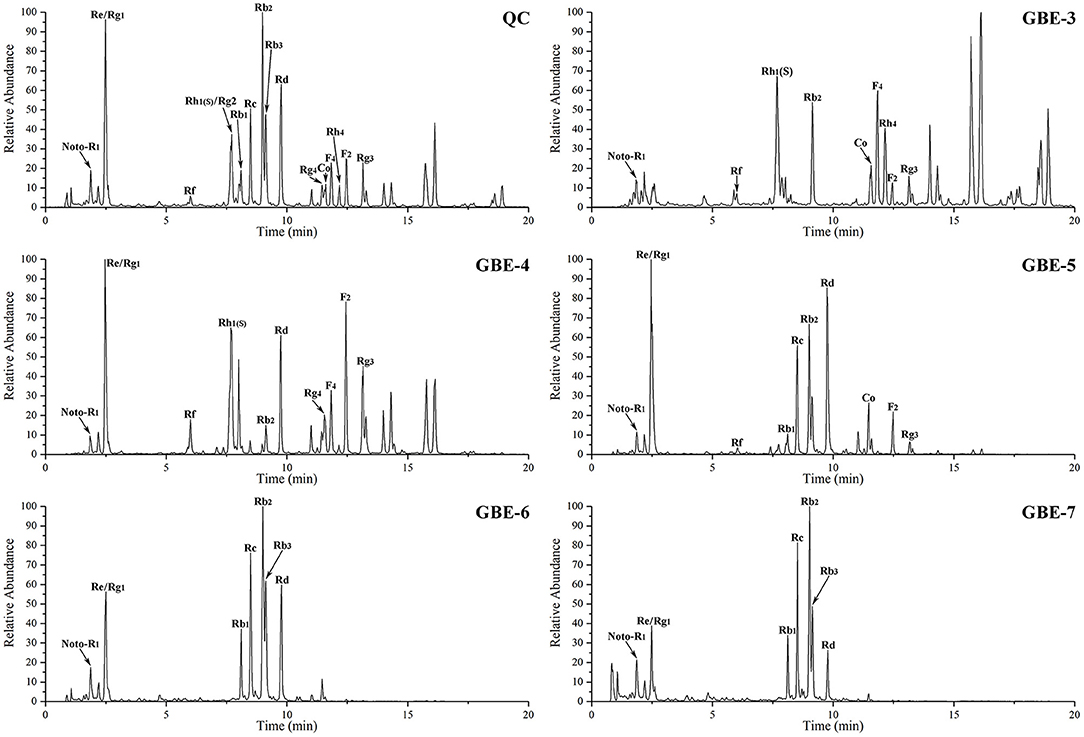
Figure 2. The UHPLC–MS TIC of GBE fraction.
The effect of GBE concentration on HepG2 cell proliferation was investigated, it was found that when the drug concentration was ≥ 250 μmol·L−1, the cell survival rate of the experimental group was generally less than 50%. Therefore, the administration concentration of cells should be less than 250 μmol·L−1. Since six different administration concentrations were set for each fraction of GBE, the final concentrations were set as 200, 100, 50, 25, 12.5, and 6.25 μmol·L−1.
The HepG2 insulin resistance model was established by PA. It was found that when the concentrations of PA were 1, 0.75, 0.5, and 0.25 mmol·L−1, the GC of each model group was significantly lower than that of the normal group (p < 0.01), indicating that the HepG2 insulin resistance model was successfully established by PA at each concentration, which was shown in Table 1. Considering the effect of PA concentration on HepG2 cell survival, the smallest PA concentration (0.25 mmol·L−1) was selected for modeling, which was also consistent with that reported in the literature (23, 24).
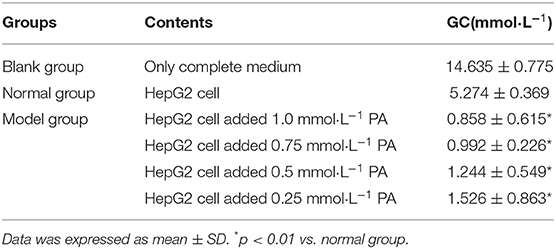
Table 1. The effects of four concentrations of PA on glucose consumption of HepG2 cells.
The screening results of hypoglycemic activity of GBE fractions were shown in Table 2. It was found that the GC of the cells in the model group was significantly lower than that in the normal group (p < 0.01), indicating that the model of insulin resistance of HepG2 cells was successfully established. The GC of GBE fractions in the experimental group were significantly higher than (p < 0.05) or very significantly higher than (p < 0.01) the model group, suggesting that the drug intervention could improve the GC of HepG2 cell insulin resistance model. The cell GC of the blank group, model group, positive group, and experimental group was shown in Figure 3A. The ratio of GC to cell survival rate (CCK-8) was calculated to eliminate the influence of the number of cells in the group on the GC of each group. The calculation results were shown in Figure 3B. It was found that GBE-5 fraction has better hypoglycemic activity than other extraction fractions, but the hypoglycemic effect was worse than that of the positive group (p > 0.05). The main components of GBE-5 fraction were putatively identified by the accurate mass measurement and MS2 fragment ions obtained by UHPLC–MS, as well as the database searching. The molecular MS error of all identified metabolites was less than 10 ppm. The compounds of GBE-5 were final identified by comparing the RT, accurate mass, and MS/MS spectra of authentic standards. The analyzed data were shown in Table 3.

Table 2. The effect of GBE fractions on GC of insulin resistant HepG2 cells.
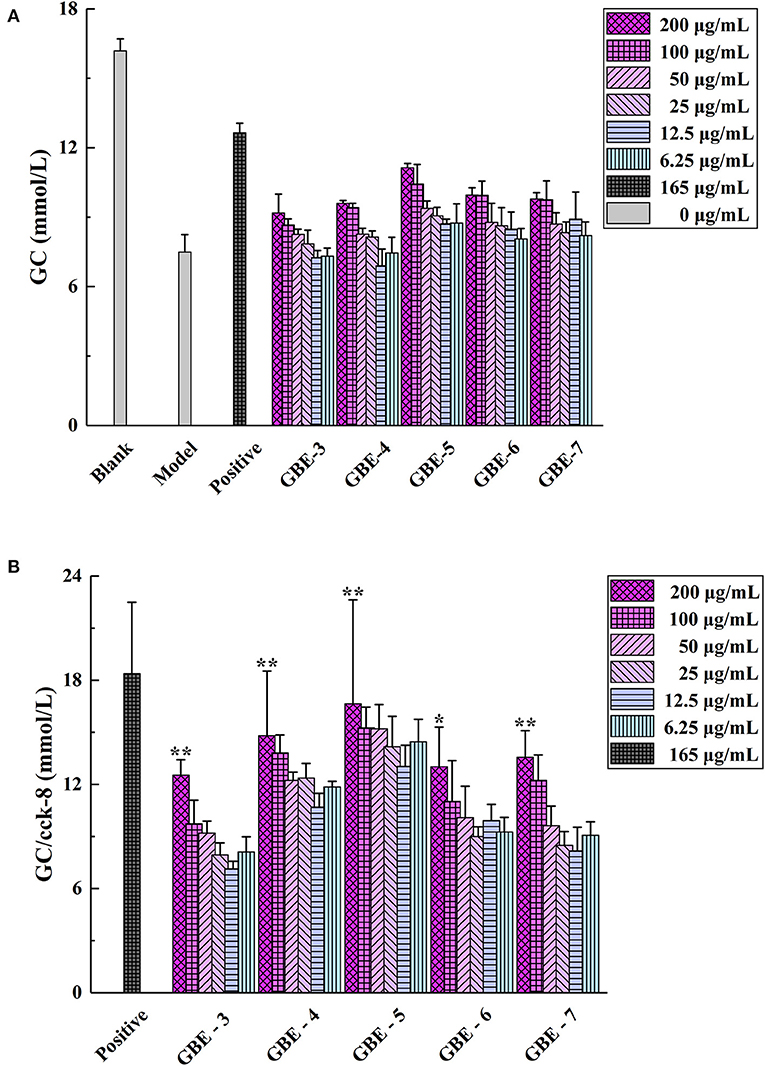
Figure 3. (A) Cell GC and (B) GC/Cell survival rate (CCK-8). *p < 0.05 vs. model group, ** p < 0.01 vs. model group.
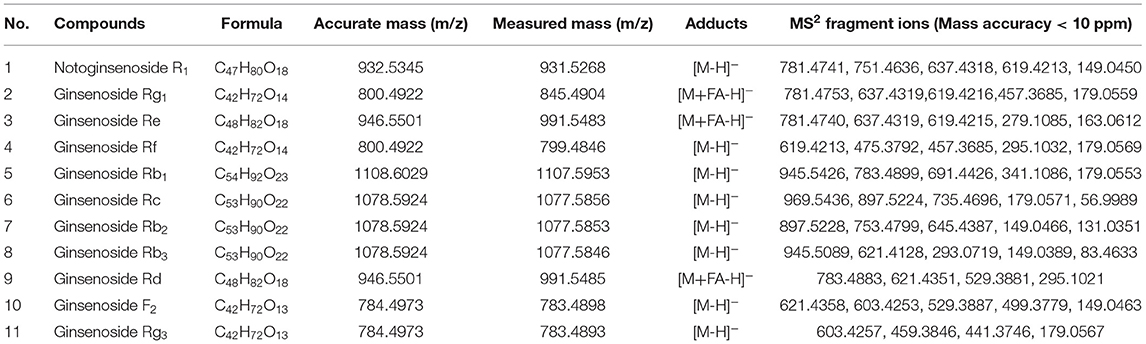
Table 3. Identification of compounds in GBE-5 fraction from ginseng berry total ginsenosides.
A rat model of T2DM induced by HFD and STZ was used to study the hypoglycemic effect of GBE-5 fraction. At the end of the 30-days experiment, it was found that GBE-5 fraction could significantly reduce the fasting blood glucose level in T2DM rats, and decreased from 13.44 ± 2.99 mmol·L−1 to 8.77 ± 4.91 mmol·L−1 (p < 0.05), as shown in Figure 4, food and water intake decreased in MET group and GBE-5 group, and there was no significant difference in body weight among the groups (p > 0.05). In the previous studies, it was found that total ginsenosides of GB could reduce the fasting blood glucose of rats by 27.35% (7). On the premise of the same drug dosage and treatment time, the fasting blood glucose of GBE-5 fraction which derived from GB total ginsenosides decreased significantly by 34.75% after 30 days of intervention in T2DM rats, indicating that the hypoglycemic effect of GBE-5 fraction was better than that of total ginsenosides of GB.
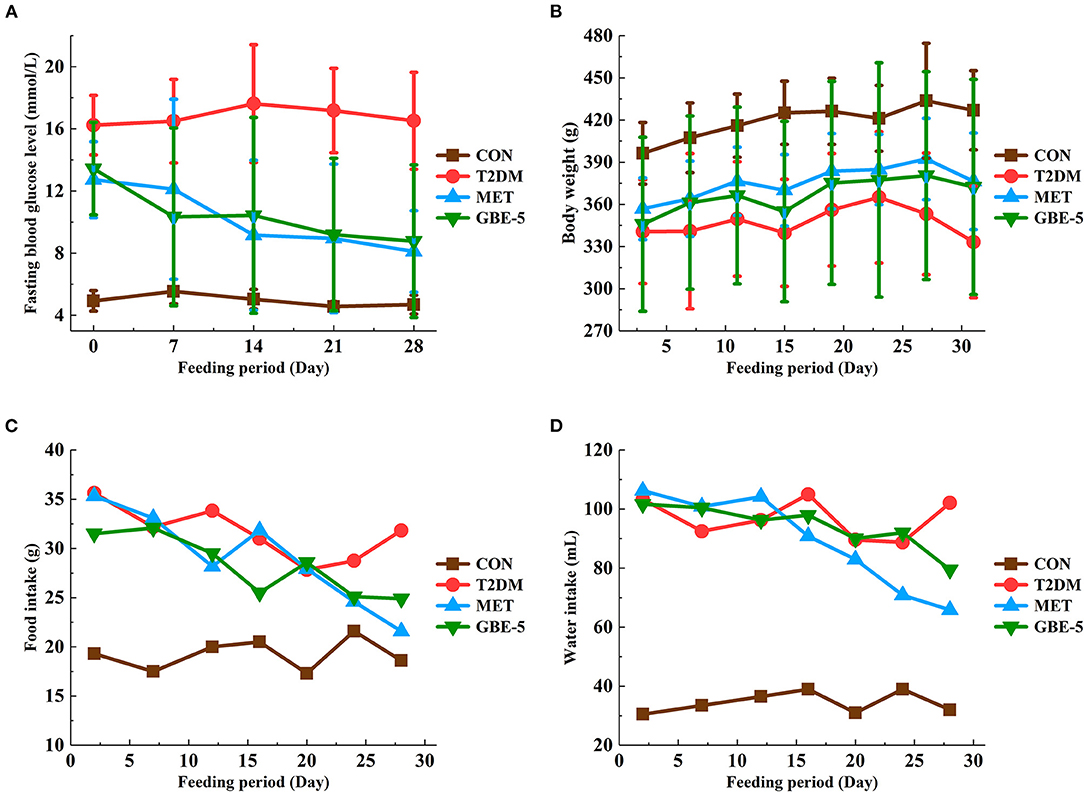
Figure 4. The effect of GBE-5 fraction on the fasting blood glucose level (A), body weight (B), food (C), and water (D) intake in T2DM rats.
The positive and negative TIC of rat serum samples collected by UHPLC–MS was shown in Figure 5, in which A was CON group, B was T2DM group, C was MET group, and D was GBE-5 group. The ion peaks in the spectrum were well separated, indicating that the UHPLC–MS conditions in this experiment were suitable for sample determination.
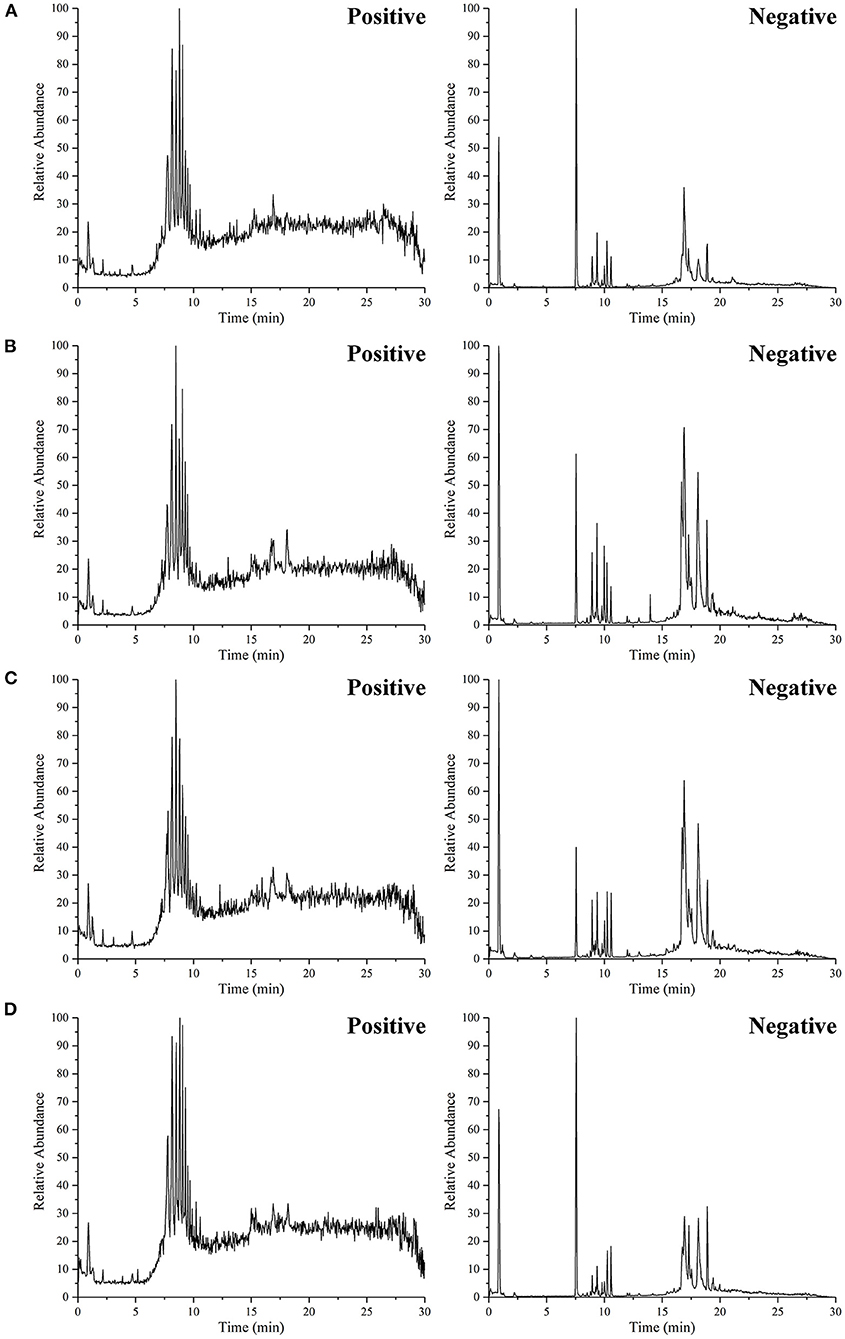
Figure 5. The representative UHPLC–MS TIC of serum from the CON group (A), T2DM group (B), MET group (C), and GBE-5 fraction group (D); the TIC on the left side was positive modes and the right side was negative modes, respectively.
The rat serum and its QC samples were analyzed by PCA, as shown in Figure 1B, the QC samples showed a good aggregation state and closed to the coordinate origin, indicating that the acquisition instrument was in a stable state during data collection. Univariate statistical analysis based on UHPLC–MS data was used to screen the differential metabolites in rat serum after the 30-days intervention of GBE-5 fraction. Univariate analysis often used the FC value to represent the regulation multiple of metabolites between the two comparison groups. It was generally considered that compounds with FC value ≥ 1.5 or ≤ 0.67 and p < 0.05 were the differential metabolites between groups, which could be visualized by volcano plot, as shown in Figure 6, the red dots represented the significantly up-regulated differential metabolites (log2FC > 0, p < 0.05), the blue dots represented the significantly down-regulated differential metabolites (log2FC <0, p < 0.05), and the gray dots represented the metabolites with no significant regulation (p > 0.05).
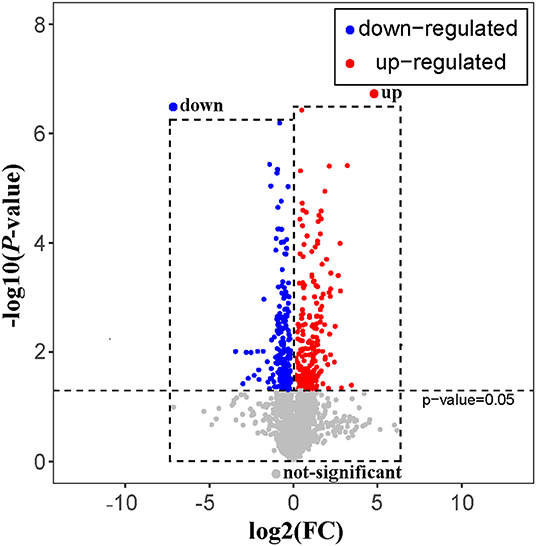
Figure 6. The volcano plot of T2DM vs. GBE-5 fraction group.
The RT, accurate mass spectra and MS/MS spectra of the differential compounds screened by univariate statistical analysis were imported into the metabolomics database, the data information of the standard in the database was compared, the mass error of all metabolites was less than 10 ppm, so the compounds were qualitatively identified. There were 66 compounds screened as differential metabolites in the GBE-5 vs. T2DM group. Then the KEGG online database was used to pathway enrichment analysis, a total of 18 differential metabolites could be enriched in the KEGG metabolic pathway. The differential metabolites information and metabolic pathway enrichment results were shown in Tables 4, 5, respectively. It was found that the four main metabolic pathways involved in regulation maybe the potential regulatory mechanism for the anti-diabetic effect of the GBE-5 fraction. Among them, five differential metabolites: 12(R)-HETE, 5-HETE, Lipoxin A4, Lipoxin B4, and PGH2 were involved in AA metabolism, three differential metabolites: 9(S)-HPODE, 9,10-DHOME, and 9-OxoODE were involved in linoleic acid (LA) metabolism, three differential metabolites: Adrenic acid (AdA), docosapentaenoic acid (DPA), and stearic acid were involved in the biosynthesis of unsaturated fatty acids, and two differential metabolites: Oxidized glutathione (GSSG) and AdA were involved in ferroptosis. These metabolic pathways were all widely linked to T2DM, and the correlation networks of differential metabolites mentioned discussed was shown in Figure 7.
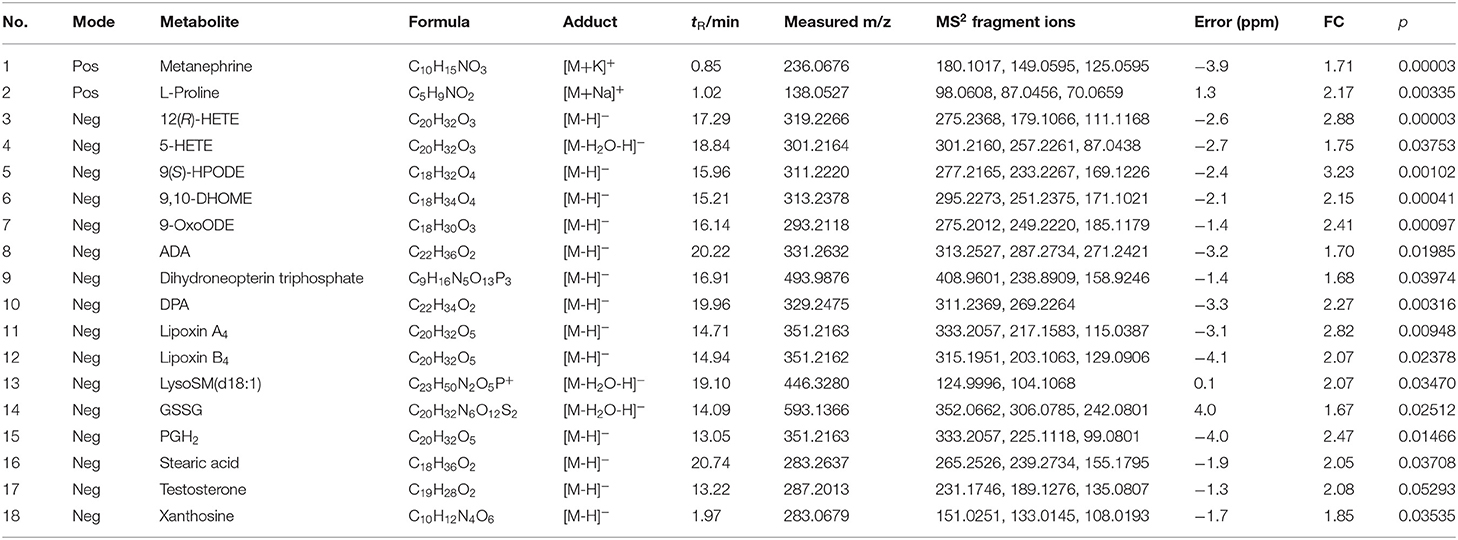
Table 4. The identification results of differential metabolites in T2DM vs. GBE-5 fraction group in serum.
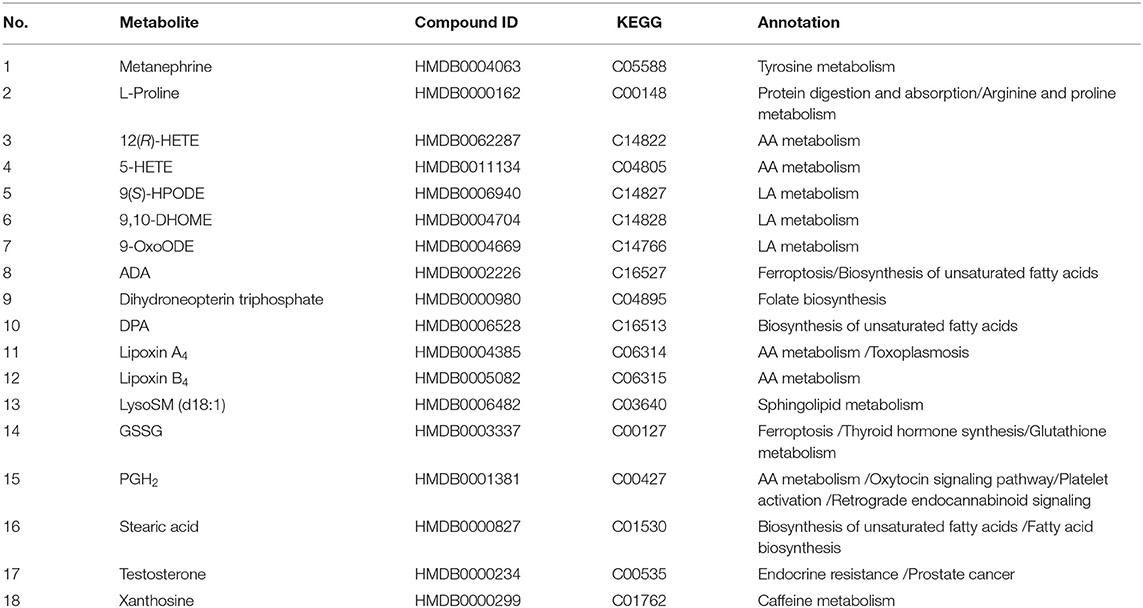
Table 5. Enriched KEGG pathway of differential metabolites in T2DM vs. GBE-5 fraction group.
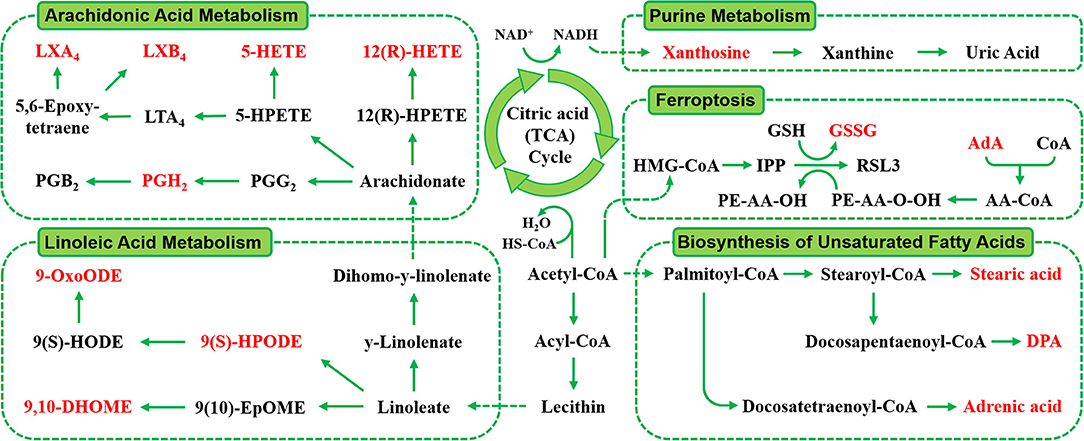
Figure 7. The correlation networks between main differential metabolites with corresponding metabolic pathways.
The metabolism of AA, LA, and biosynthesis of unsaturated fatty acids belongs to lipid metabolism. The LA was a kind of unsaturated fatty acids, due to the substantial increase in vegetable oils consumption, the intake of LA also increased greatly, and dietary fatty acids were responsible for the development and occurrence of many chronic diseases, such as obesity and diabetes (25). The LA was the direct precursor of AA) the conversion efficiency of LA into AA in human body was low, they were linked through metabolism. It was reported that AA and LA could be used as predictive markers for gestational diabetes mellitus (26), AA and its derivatives played a key role in the occurrence and development of obesity and T2DM, and played a diverse and partly contrasting roles in the pathogenesis of T2DM. Therefore, the study of AA as well as LA metabolism may help to identify novel targets for the treatment of T2DM and its associated complications (27).
Wang et al. (28) used proteomics to study the differential abundant proteins associated with diabetes in hamster liver. Combined with enrichment analysis of KEGG pathway, found that AA metabolism, LA metabolism, and bile acid (BA) metabolism in diabetic hamsters were affected. Our previous study had also found that GB exerted anti-diabetic effect by regulating AA and BA metabolism (7). However, in this study, the GBE-5 fraction was not involved in the regulation of BA metabolism pathway, which suggested that the screened GBE-5 fraction may not contained all of the GB active substances with anti-diabetic activity. Although the in vivo hypoglycemic activity experimental result of GBE-5 showed that its hypoglycemic effect was better than GB and other GBE fractions, the segmentation of GB by polar extraction method had its limitations, which cannot effectively collect all the pharmacodynamic material bases in GB. In the next experiment, the combination could be carried out according to the actual content of several main ginsenosides in GB, and then a hypoglycemic drug composed of ginsenoside monomer compounds could be found through in vitro hypoglycemic activity screening and in vivo hypoglycemic activity verification, which had more efficient hypoglycemic activity and could be used to replace the original total ginsenoside extract. It was conducive to drug quality control as well as modern development of hypoglycemic effect of GB.
Ferroptosis was a new programmed cell death mode, which different from apoptosis and autophagy. Its main mechanism was that under the action of divalent iron or lipoxygenase, unsaturated fatty acids on cell membrane produce lipid peroxidation, and then induced cell death (29). It was reported that pancreatic iron deposition will occur during the development of T2DM, which will lead to pancreatic β-cells dysfunction and death. The inhibition of pancreatic iron deposition and pancreatic β-cells ferroptosis had a beneficial regulatory effect on T2DM, indicating that ferroptosis was closely related to the occurrence and development of T2DM, and its internal relationship with T2DM was worthy of further study (30).
In the present study, the total ginsenosides extract of GB was extracted by organic solvent extraction, and 5 extraction fractions of GB with different polarity were obtained. The insulin resistance model of HepG2 cells was established, and the hypoglycemic active fraction of five extracted fractions were screened in vitro. It was found that GBE-5 fraction had better hypoglycemic activity than other fractions, which was the hypoglycemic active fraction of GBE. The main components of GBE-5 fraction were found to be ginsenoside Rg1, Re, Rc, Rd, Rb1, Rb2, Rb3, and Rg3. The T2DM rat model induced by HFD/STZ was established, and the hypoglycemic activity of ginsenoside GBE-5 was evaluated. It was found that ginsenoside GBE-5 had significant hypoglycemic activity, the fasting blood glucose decreased from 13.44 ± 2.99 mmol·L−1 to 8.77 ± 4.91 mmol·L−1 (p < 0.05), and the blood glucose decreased significantly by 34.75%, the hypoglycemic effect was better than the total ginsenosides extract of GB (the hypoglycemic rate was 27.35 %). Univariate statistical analysis based on UHPLC–MS was used to screen the metabolites with different contents in the serum of rats after 30 days of intervention. Combined with the enrichment analysis of KEGG metabolic pathway, 18 differential metabolites that could be enriched into KEGG metabolic pathway were screened and identified in serum of T2DM vs. GBE-5 group. The metabolic pathways involved in regulation mainly include AA metabolism, LA metabolism, biosynthesis of unsaturated fatty acids and ferroptosis, which were potential targets for hypoglycemic activity of GBE-5 fraction of GB. In this study, the GBE-5 active fraction and its main hypoglycemic mechanism were studied, which will lay a foundation for the further development and utilization of P. ginseng berry as health functional food or dietary supplement.
The original contributions presented in the study are included in the article/supplementary material, further inquiries can be directed to the corresponding author/s.
The animal study was reviewed and approved by the Institutional Animal Care and Use Committee (IACUC) of the Changchun University of Chinese Medicine with the permit code CPCCUCM IACUC 2019-009.
This study was designed by WW and HW. The sample collection, detection, and data curation were done by HW, YT, and AW. The data analysis and interpretation were exercised by WW, HW, and YL. The software, supervision, and validation were dealt by HW, HL, LJ, and BL. The writing of original draft was carried out by HW. Writing-review and editing and final approval of the published version were done by WW. All authors read and approved the final manuscript.
This research work was supported by Jilin Scientific and Technological Development Program (No. 20200301049RQ) and National College Students Innovation and Entrepreneurship Training Program (202110199015).
The authors declare that the research was conducted in the absence of any commercial or financial relationships that could be construed as a potential conflict of interest.
All claims expressed in this article are solely those of the authors and do not necessarily represent those of their affiliated organizations, or those of the publisher, the editors and the reviewers. Any product that may be evaluated in this article, or claim that may be made by its manufacturer, is not guaranteed or endorsed by the publisher.
1. Ichim MC, Boer HJD. A review of authenticity and authentication of commercial ginseng herbal medicines and food supplements. Front Pharmacol. (2021) 11:612071. doi: 10.3389/fphar.2020.612071
2. Guo M, Shao S, Wang D, Zhao D, Wang M. Recent progress in polysaccharides from Panaxginseng C. A Meyer Food Funct. (2021) 12:494–518. doi: 10.1039/D0FO01896A
3. Byun J, Kim SK, Ban JY. Anti-inflammatory and anti-oxidant effects of Korean ginseng berry extract in LPS-Activated RA W2647 macrophages. Am J Chin Med. (2021) 49:719–35. doi: 10.1142/S0192415X21500336
4. Wang CZ, Hou L, Wan JY, Yao H, Yuan J, Zeng J, et al. Ginseng berry polysaccharides on inflammation-associated colon cancer: inhibiting T-cell differentiation, promoting apoptosis, and enhancing the effects of 5-fluorouracil. J Ginseng Res. (2020) 44:282–90. doi: 10.1016/j.jgr.2018.12.010
5. Lee MY, Seo HS, Singh D, Lee SJ, Lee CH. Unraveling dynamic metabolomes underlying different maturation stages of berries harvested from Panax ginseng. J Ginseng Res. (2020) 44:413–23. doi: 10.1016/j.jgr.2019.02.002
6. Wang CZ, Wan C, Luo Y, Zhang CF, Zhang QH, Chen L, et al. Ginseng berry concentrate prevents colon cancer via cell cycle, apoptosis regulation, and inflammation-linked Th17 cell differentiation. J Physiol Pharmacol. (2021) 72:225–37. doi: 10.26402/jpp.2021.2.08
7. Wang H, Huang R, Li H, Jiao L, Liu S, Wu W. Serum metabolomic analysis of the anti-diabetic effect of Ginseng berry in type II diabetic rats based on ultra high-performance liquid chromatography-high resolution mass spectrometry. J Pharm Biomed Anal. (2021) 196:113897. doi: 10.1016/j.jpba.2021.113897
8. Choi SR, Lee MY, Reddy CK, Lee SJ, Lee CH. Evaluation of metabolite profiles of ginseng berry pomace obtained after different pressure treatments and their correlation with the antioxidant activity. Molecules. (2021) 26:284. doi: 10.3390/molecules26020284
9. Xu XY Yi ES, Kang CH, Liu Y, Lee YG, Choi HS, et al. Whitening and inhibiting NF-kB-mediated inflammation properties of the biotransformed green ginseng berry of new cultivar K[[sb]]1[[/s]], ginsenoside Rg2 enriched, on B16 and LPS-stimulated RAW2647 cells. J Ginseng Res. (2021) 45:631–41. doi: 10.1016/j.jgr.2021.02.007
10. Nam JH, Choi J, Monmai C, Rod IW, Jang AY, You S, et al. Immune-enhancing effects of crude polysaccharides from Korean ginseng berries on spleens of mice with cyclophosphamide-induced immunosuppression. J Microbiol Biotechnol. (2021) 32. doi: 10.4014/jmb.2110.10021
11. Qiao Y, Zhang J, Liu Y, Liang Z, Wang Y, Zheng W, et al. Efficacy and safety of zhenyuan capsule for coronary heart disease with abnormal glucose and lipid metabolism: study protocol for a randomized, double-blind, parallel-controlled, multicenter clinical trial. Evid Based Complement Alternat Med. (2018) 1716430. doi: 10.1155/2018/1716430
12. Park JE, Kim H, Kim J, Choi SJ, Ham J, Nho CW, et al. A comparative study of ginseng berry production in a vertical farm and an open field. Ind Crop Prod. (2019) 140:111612. doi: 10.1016/j.indcrop.2019.111612
13. Joo KM, Lee JH, Jeon HY, Park CW, Hong DK, Jeong HJ, et al. Pharmacokinetic study of ginsenoside Re with pure ginsenoside Re and ginseng berry extracts in mouse using ultra performance liquid chromatography/mass spectrometric method. J Pharmaceut Biomed. (2010) 51:278–83. doi: 10.1016/j.jpba.2009.08.013
14. Wang H, Teng Y, Li S, Li Y, Li H, Jiao L, et al. UHPLC-MS-based serum and urine metabolomics reveals the anti-diabetic mechanism of ginsenoside re in type 2 diabetic rats. Molecules. (2021) 26:6657. doi: 10.3390/molecules26216657
15. Liu Z, Qu CY, Li LX, Wang YF, Li W, Wang CZ, et al. Hypoglycemic and hypolipidemic effects of malonyl ginsenosides from american ginseng (Panax quinquefolius L) on type 2 diabetic mice ACS. Omega. (2021) 6:33652–64. doi: 10.1021/acsomega.1c04656
16. Zhu Y, Yang H, Deng J, Fan D. Ginsenoside Rg5 Improves Insulin Resistance and Mitochondrial Biogenesis of Liver via Regulation of the Sirt1/PGC-1α Signaling Pathway in db/db Mice. J Agric Food Chem. (2021) 69:8428–39. doi: 10.1021/acs.jafc.1c02476
17. Wei Y, Yang H, Zhu C, Deng J, Fan D. Ginsenoside Rg5 relieves type 2 diabetes by improving hepatic insulin resistance in db/db mice. J Funct Foods. (2020) 71:104014. doi: 10.1016/j.jff.2020.104014
18. Park SY, Gautier JF, Chon S. Assessment of insulin secretion and insulin resistance in human. Diabetes Metab J. (2021) 45:641–54. doi: 10.4093/dmj.2021.0220
19. Jovanovski E, Duvnjal LS, Komishon A, Yeung FRA, Sievenpiper JL, Zurbau A, et al. Effect of coadministration of enriched Korean Red Ginseng (Panaxginseng) and American ginseng (Panax quinquefolius L) on cardio metabolic outcomes in type-2 diabetes: A randomized controlled trial. J Ginseng Res. (2021) 45:546–54. doi: 10.1016/j.jgr.2019.11.005
20. Pandey S, Dvorakova MC. Future perspective of diabetic animal models. Endocr Metab Immune Disord Drug Targets. (2020) 20:25–38. doi: 10.2174/1871530319666190626143832
21. Noshahr ZS, Salmani H, Rad AK, Sahebkar A. Animal models of diabetes-associated renal injury. J Diabetes Res. (2020) 9416419. doi: 10.1155/2020/9416419
22. Arzumanian VA, Kiseleva OI, Poverennaya EV. The curious case of the HepG2 cell line: 40 years of expertise. Int J Mol Sci. (2021) 22:13135. doi: 10.3390/ijms222313135
23. Zhao H, Shu L, Huang W, Song G, Ma H. Resveratrol affects hepatic gluconeogenesis via histone deacetylase 4. Diabetes Metab Syndr Obes. (2019) 12:401–11. doi: 10.2147/DMSO.S198830
24. Malik SA, Acharya JD, Mehendale NK, Kamat SS, Ghaskadbi SS. Pterostilbene reverses palmitic acid mediated insulin resistance in HepG2 cells by reducing oxidative stress and triglyceride accumulation. Free Radic Res. (2019) 53:815–27. doi: 10.1080/10715762.2019.1635252
25. Burns JL, Nakamura MT, Ma DWL. Differentiating the biological effects of linoleic acid from arachidonic acid in health and disease. Prostag Leukotr Ess. (2018) 135:1–4. doi: 10.1016/j.plefa.2018.05.004
26. Szczuko M, Kikut J, Komorniak N, Bilicki J, Celewicz Z, Zietek M. The role of arachidonic and linoleic acid derivatives in pathological pregnancies and the human reproduction process. Int J Mol Sci. (2020) 21:9628. doi: 10.3390/ijms21249628
27. Sonnweber T, Pizzini A, Nairz M, Weiss G, Tancevski I. Arachidonic acid metabolites in cardiovascular and metabolic diseases. Int J Mol Sci. (2018) 19:3285. doi: 10.3390/ijms19113285
28. Wang W, Shi Z, Zhang R, Yu J, Wang C, Hou J, et al. Liver proteomics analysis reveals abnormal metabolism of bile acid and arachidonic acid in Chinese hamsters with type 2 diabetes mellitus. J Proteomics. (2021) 239:104186. doi: 10.1016/j.jprot.2021.104186
29. Hirschhorn T, Stockwell BR. The development of the concept of ferroptosis. Free Radic Biol Med. (2019) 133:130–43. doi: 10.1016/j.freeradbiomed.2018.09.043
Keywords: ginseng berry, ginsenoside, UHPLC-MS, metabolomics, type 2 diabetes mellitus
Citation: Wang H, Tong Y, Wang A, Li Y, Lu B, Li H, Jiao L and Wu W (2022) Evaluation and Screening of Hypoglycemic Activity of Total Ginsenosides GBE-5 Fraction From Panax Ginseng Berry Based on UHPLC–MS Metabolomics. Front. Nutr. 9:865077. doi: 10.3389/fnut.2022.865077
Received: 29 January 2022; Accepted: 16 March 2022;
Published: 25 April 2022.
Edited by:
Mingquan Guo, Wuhan Botanical Garden (CAS), ChinaReviewed by:
Jian-Lin Wu, Macau University of Science and Technology, Hong Kong SAR, ChinaCopyright © 2022 Wang, Tong, Wang, Li, Lu, Li, Jiao and Wu. This is an open-access article distributed under the terms of the Creative Commons Attribution License (CC BY). The use, distribution or reproduction in other forums is permitted, provided the original author(s) and the copyright owner(s) are credited and that the original publication in this journal is cited, in accordance with accepted academic practice. No use, distribution or reproduction is permitted which does not comply with these terms.
*Correspondence: Wei Wu, d2Vpd3VfY2N1Y21AMTI2LmNvbQ==
Disclaimer: All claims expressed in this article are solely those of the authors and do not necessarily represent those of their affiliated organizations, or those of the publisher, the editors and the reviewers. Any product that may be evaluated in this article or claim that may be made by its manufacturer is not guaranteed or endorsed by the publisher.
Research integrity at Frontiers
Learn more about the work of our research integrity team to safeguard the quality of each article we publish.