 Jing Hong
 Qi-Qi Huang2
 Ze-Ru Xu
 Hong Zhu
- 1Department of Endocrinology, The First Affiliated Hospital of Wenzhou Medical University, Wenzhou, China
- 2Department of Nutrition, The First Affiliated Hospital of Wenzhou Medical University, Wenzhou, China
Introduction: Malnutrition has been associated with mortality in various diseases. This retrospective cohort study aimed to investigate the relationship between three nutritional indices and all-cause mortality in patients with diabetic foot ulcers (DFUs).
Materials and Methods: A total of 771 patients diagnosed with DFUs in the First Affiliated Hospital of Wenzhou Medical University from 2015 to 2019 were included in this retrospective cohort study. Patients were classified as high nutritional risk groups or low nutritional risk groups according to the optimal cut-off values of the geriatric nutritional risk index (GNRI), prognostic nutritional index (PNI), and controlling nutritional status (CONUT), respectively. The associations of three nutritional indices with all-cause mortality were evaluated by multivariable Cox regression analyses.
Results: Log-rank tests indicated that patients with high nutritional risk had lower overall survival rates (all p < 0.001). The multivariable Cox regression revealed that low GNRI (adjusted HR 2.01, 95% CI: 1.37–2.96, P < 0.001), low PNI (adjusted HR 2.04, 95% CI: 1.29–3.23, P = 0.002) and high CONUT (adjusted HRs 1.54, 95% CI: 1.07–2.23, P = 0.021) were independently associated with high all-cause mortality. In subgroup analyses, only GNRI predicted higher all-cause mortality in patients with severe DFUs, while all of the three indices persisted as independent prognostic factors in patients with no severe DFUs.
Discussion: The present study demonstrated that three nutritional indices were effective predictors of all-cause mortality in patients with DFUs. Routine screening for malnutrition using any of the three nutritional indices might be a simple and effective way to identify high-risk patients with DFUs. GNRI can be used as an independent prognostic indicator in patients with severe DFUs.
Introduction
Patients with diabetic foot ulcers (DFUs) are considered to be with an excess risk of all-cause mortality (1), facing a 5-year mortality as high as 30.5% which is comparable to cancer (2). Additionally, the mortality of patients with DFUs is more than 2-folds higher than patients with diabetes but without DFUs (3). The excess all-cause mortality in patients with DFUs cannot fully be explained by traditional cardiovascular risk factors (4). The importance of other factors, such as nutritional status, needs to be further elucidated.
Patients with DFUs, especially those with Wagner grade 4 and 5, were more vulnerable to malnutrition compared to patients without DFUs (5). Malnutrition was found to be associated with higher complications, longer hospital stays, and increased mortality in hospitalized patients (6). Malnutrition is often ignored but modifiable. Identifying patients at risk of malnutrition is important. They might benefit from clinical nutritional interventions. Then improve their outcomes and prolong life (7). There are many screening tools for malnutrition, among them, the geriatric nutritional risk index (GNRI) (8), the prognostic nutritional index (PNI) (9), and the controlling nutritional status (CONUT) index (10) are relatively simple, convenient, effective and practical. They can be calculated from inexpensive and easily-obtained parameters: albumin (ALB), total cholesterol (TC), lymphocyte count, height, and weight.
Literature concerning the association of nutritional index with the prognosis of DFUs is sparse (11). Therefore, in this study, we aimed to explore the role of GNRI, PNI, and CONUT in predicting the risk of all-cause mortality in patients with DFUs.
Materials and Methods
Study Population
This retrospective cohort study enrolled 900 participants who were diagnosed with type 2 diabetes mellitus and DFUs according to the 2015 Diabetic Foot diagnostic criteria (12) in the First Affiliated Hospital of Wenzhou Medical University from 2015 to 2019. The exclusion criteria included lymphocytic leukemia, terminal malignancies, and hyperthyroidism, and those with missing data of ALB, total cholesterol TC, height, and weight. Finally, 771 patients were included in the study.
The study protocol was approved by the ethics committee of the First Affiliated Hospital of Wenzhou Medical University. The informed consent was exempted, due to the retrospective nature of the study.
Data Collection and Grouping
The baseline data including demographic characteristics, anthropometric parameters, diabetes duration, hypertension, history of smoking, alcohol use and laboratory parameters including ALB, HbA1c, hemoglobin (Hb), creatinine, TC, triglyceride (TG), high-density lipoprotein cholesterol (HDL-C), and low-density lipoprotein cholesterol (LDL-C) were retrospectively extracted from individual medical records. For patients with multiple hospitalizations for DFUs, we only included the data of the first hospitalization. The endpoint for this study was all-cause mortality. Data regarding deaths were obtained in medical records or by telephone follow-up. Body mass index (BMI) was calculated as weight divided by height squared (kg/m2). Calculation of estimated glomerular filtration rate (eGFR), definition and grouping of smoking, alcohol use, and severe DFUs were as same as our previous study (13).
Assessment of Nutritional Status
GNRI was calculated using formula as follows: GNRI = 1.489 × ALB (g/L) +41.7 × [weight (kg)/ideal body weight (kg)]. The ideal body weight was calculated as follows: for men: H −100–[(H−150)/4], for women: H −100–[(H−150)/2.5], where H indicates height (cm) (8). PNI was calculated using formula as follows: PNI = ALB (g/L) + 0.005 × lymphocyte count (/mm3) (9). CONUT was determined based on lymphocyte count, TC, and ALB as previously described (14).
Statistical Analysis
The data are presented as mean ± standard deviation for normally distributed variables, while median and interquartile range for skewed variables, or n (%) for categorical variables. Differences were compared using student's t-test (normally distributed variables), Mann-Whitney U test (skewed variables) or Chi-squared test (categorical variables). Pearson (normally distributed variables), or spearman (skewed variables) correlation was used to assess the correlations between nutritional indices. The optimal cut-off values of nutritional indices for all-cause mortality were evaluated by the receiver operating characteristic (ROC) curves. The diagnostic performances of the optimal cut-off values were assessed using sensitivity, specificity, positive predictive value (PPV), negative predictive value (NPV), and accuracy. Kaplan-Meier survival curves and log-rank tests were used to compare the differences in overall survival (OS). The relationship between nutritional indices and all-cause mortality was analyzed by Cox proportional hazards regression. Variables with P < 0.1 in the unadjusted Cox regression analysis were included in the multivariable Cox regression analyses. BMI, ALB were excluded in the analyses of GNRI. Lymphocyte count and ALB were excluded in the analyses of PNI and CONUT, because they were used in the calculation of these nutritional indices. P values <0.05 were considered statistically significant for all tests. The statistical analyses were performed using SPSS (IBM, IL, USA) version 22. The pairwise comparison of ROC curves was performed using MedCalc version 20.019 (MedCalc Software Ltd, Ostend, Belgium).
Results
Analyses of Three Nutritional Indices
The correlation coefficients were 0.75 between GNRI and PNI, −0.61 between GNRI and CONUT, −0.82 between PNI and CONUT, respectively (all P < 0.001). According to ROC analyses, patients with GNRI <93.1, PNI <43.6, and CONUT >4.5 were defined as high nutritional risk groups, others as low nutritional risk groups. There were 202 (26.2%) patients identified as at high risk of malnutrition by all three nutritional indices (Supplementary Figure 1) and 511 (66.3%) patients identified as at high risk of malnutrition by at least one of the nutritional indices. The area under ROC curve (AUC) of GNRI was 0.630, 95% CI: 0.595–0.664, the AUC of PNI was 0.635, 95% CI: 0.600–0.669, the AUC of CONUT was 0.614, 95% CI: 0.578–0.648 (Figure 1). The sensitivity, specificity, PPV, NPV, and accuracy of the cut-off values of nutritional indices are shown in Supplementary Table 1. Comparative analysis of ROC curves did not find significant differences among AUC values of three indices (all p > 0.05).
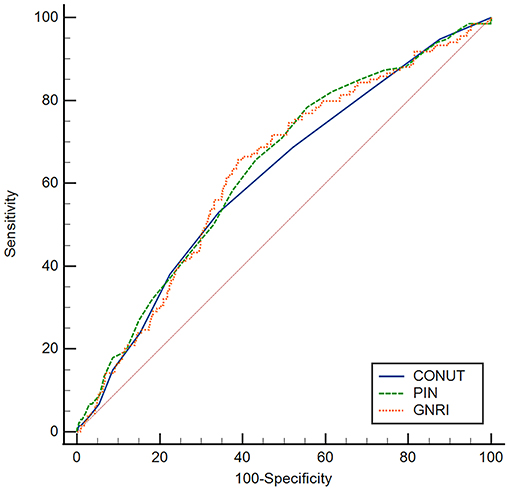
Figure 1. ROC curves of GNRI, PNI, and CONUT for predicting the all-cause mortality. The optimal cut-off values of GNRI, PNI, and CONUT were 93.1, 43.6, and 4.5, respectively. The AUC of GNRI was 0.630, 95% CI: 0.595–0.664, the AUC of PNI was 0.635, 95% CI: 0.600–0.669, the AUC of CONUT was 0.614, 95% CI: 0.578–0.648. ROC, receiver operating characteristic; AUC, area under ROC curve, GNRI, geriatric nutritional risk index; PNI, prognostic nutritional index; CONUT, controlling nutritional status.
Clinical Characteristics of the Study Population
Of the 771 patients included in the study, the BMI were 23.5 (21.6–25.9) (kg/m2), 84 (10.9%) were obese (BMI ≥28 kg/m2), 134 (17.4%) died during follow up. The clinical characteristics of patients classified as high nutritional risk groups and low nutritional risk groups based on the optimal cut-off values of GNRI, PNI, and CONUT are shown in Tables 1–3. Patients with high nutritional risk measured by any of the three nutritional indices had lower BMI, ALB, Lymphocyte, Hb, TC, TG, HDL-C, and LDL-C, longer diabetes duration, higher prevalence of severe DFUs, lower GNRI and PNI, higher CONUT than those with low nutritional risk. Furthermore, patients with high nutritional risk measured by GNRI had lower weight and higher HbA1c. Patients with high nutritional risk measured by PNI had longer diabetes duration and higher HbA1c, and were more likely to be men. Patients with high nutritional risk measured by CONUT had higher height, lower DBP, and were also more likely to be men (all P < 0.05).
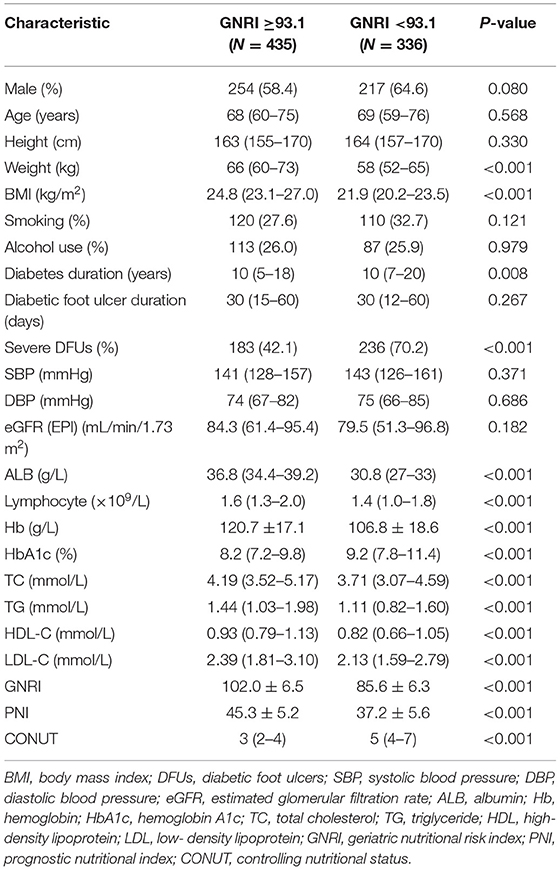
Table 1. Baseline characteristics of participants with low and high nutritional risk according to GNRI.
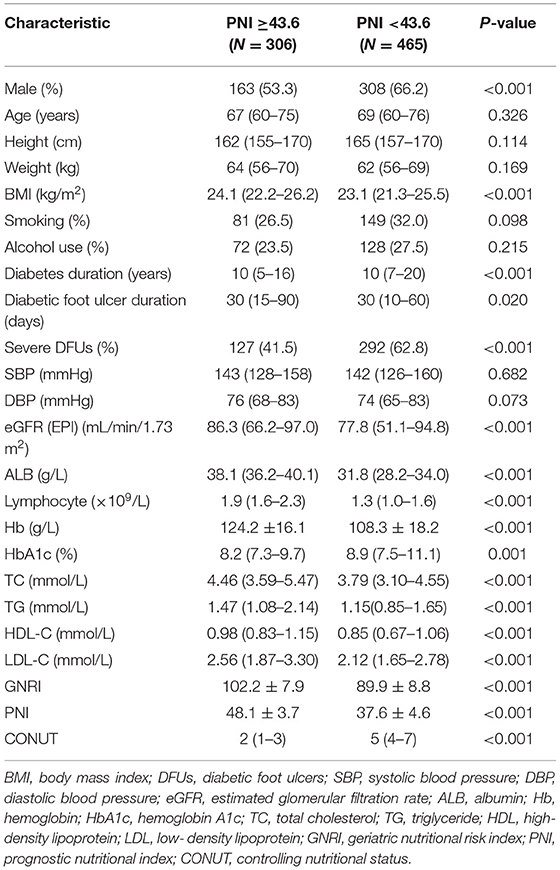
Table 2. Baseline characteristics of participants with low and high nutritional risk according to PNI.
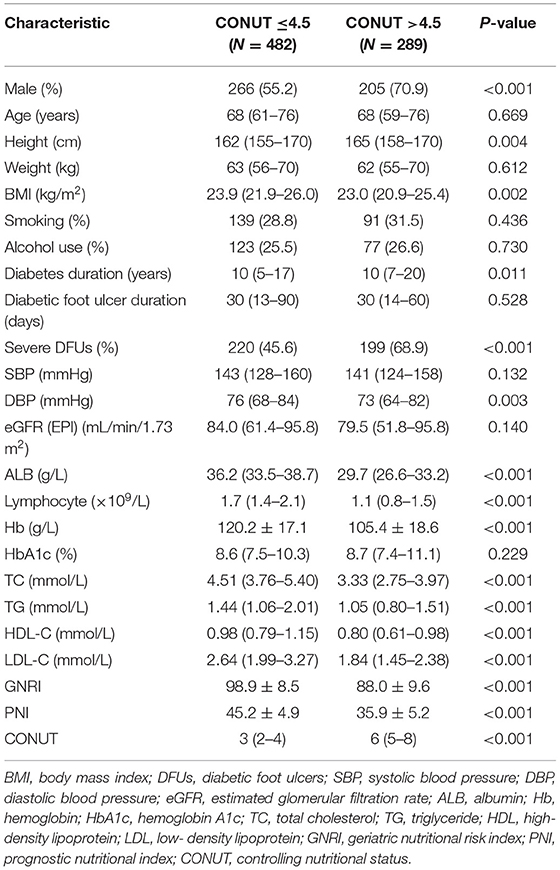
Table 3. Baseline characteristics of participants with low and high nutritional risk according to CONUT.
Patients with severe DFUs (Wagner grade score ≥3) had a higher prevalence of high nutritional risk than those with no severe DFUs (Supplementary Table 2) (all P < 0.001).
Kaplan-Meier Curves for OS
Log-rank tests of the Kaplan Meier curves indicated that patients with high nutritional risk measured by the three nutritional indices had lower OS rates compared to those with low nutritional risk (Figure 2) (all P < 0.001). The overall cumulative survival rates at 1, 3, and 5 years are shown in Supplementary Table 3.
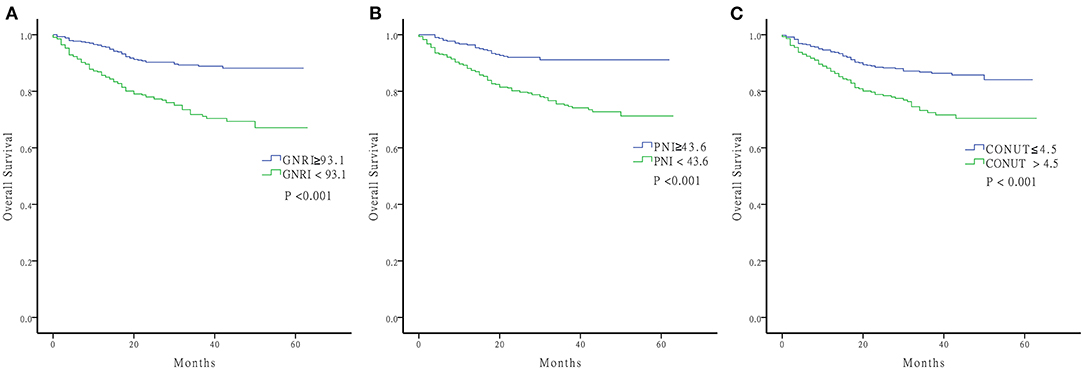
Figure 2. Kaplan-Meier curve of OS. (A) GNRI ≥93.1 and GNRI <93.1 (B) PNI ≥43.6 and PNI <43.6 (C) CONUT ≤ 4.5 and CONUT >4.5 OS, Overall Survival; GNRI, geriatric nutritional risk index; PNI, prognostic nutritional index; CONUT, controlling nutritional status.
Unadjusted and Multivariate Cox Regression Analyses for All-Cause Mortality
The unadjusted and multivariable-adjusted Cox regression analyses were performed to evaluate the relationship between three nutritional indices and all-cause mortality (Table 4). In addition to GNRI, PNI, and CONUT, the unadjusted Cox regression analyses also found that age, weight, BMI, SBP, severe DFUs, ALB, lymphocyte, Hb, and eGFR were significantly associated with all-cause mortality (Supplementary Table 4). The multivariable Cox regression revealed that low GNRI (adjusted HR 2.01, 95% CI: 1.37–2.96, P < 0.001), low PNI (adjusted HR 2.04, 95% CI: 1.29–3.23, P = 0.002), and high CONUT (adjusted HRs 1.54, 95% CI: 1.07–2.23, P = 0.021) were independently associated with high all-cause mortality. In subgroup analyses, according to the severity of DFUs, the observed associations among three nutritional indices and all-cause mortality remained significant in patients with no severe DFUs. However, in patients with severe DFUs, only the association between low GNRI and high all-cause mortality remained significant after adjusting for confounding factors.
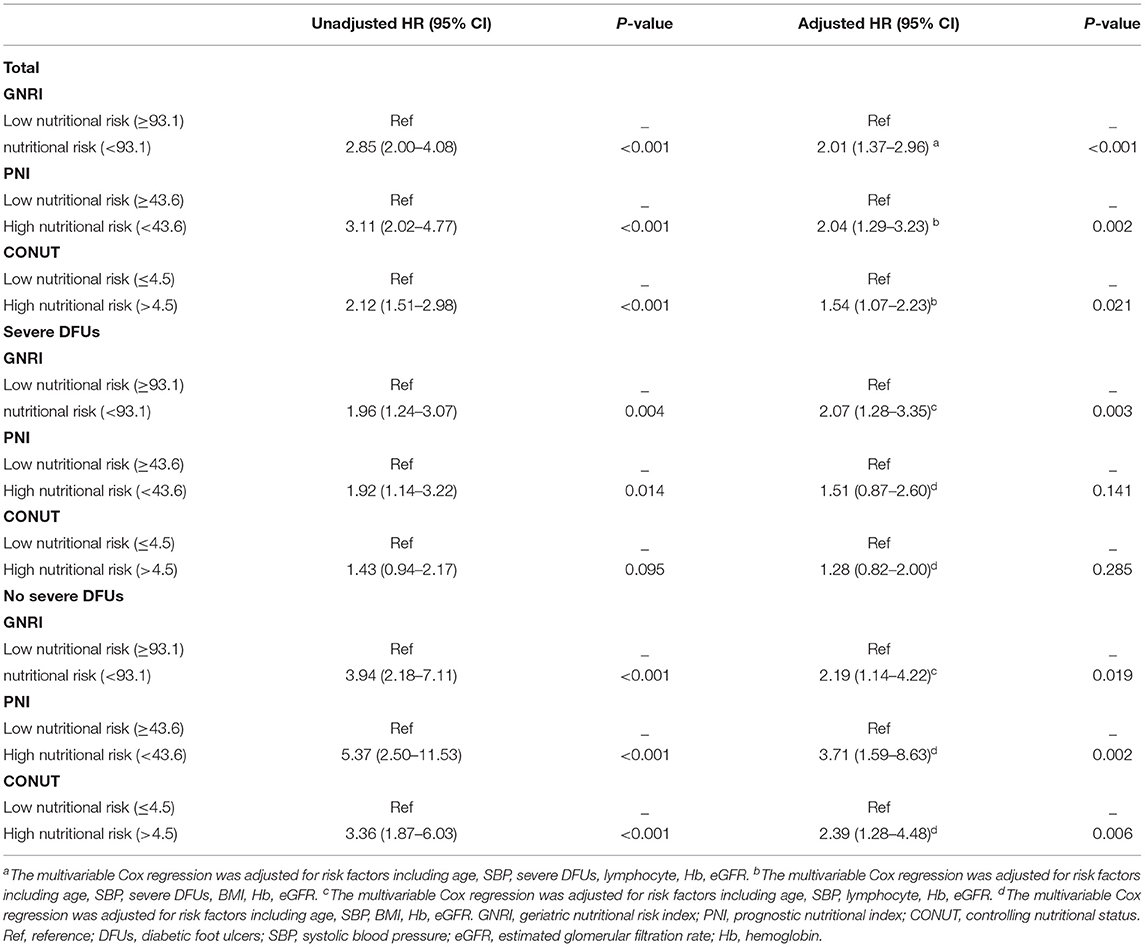
Table 4. Unadjusted and multivariate Cox regression analyses for all-cause mortality.
Discussion
To the best of our knowledge, the present study is the first study to investigate the predictive value of three nutritional indices concurrently in patients with DFUs. The present study suggested that patients with high nutritional risk defined by any of three objective nutritional indices, GNRI, PNI, and CONUT, had lower OS rates. Low GNRI, low PNI, and high CONUT were independently associated with high all-cause mortality, even after adjusting for confounding variables by multivariate Cox regression analysis. No significant difference was found among the predictive capability of GNRI, PNI, and CONUT by comparative analysis of ROC curves in total population with DFUs. In subgroup analyses, low GNRI, but not low PNI or high CONUT, predicted higher all-cause mortality in patients with severe DFUs, while all of the three indices persisted as independent prognostic factors in patients with no severe DFUs.
There is no generally accepted set of criteria for malnutrition, and the prevalence of malnutrition varies depending on the nutritional screening methods. Although significant correlations were found among GNRI, PNI, and CONUT, different parameters in each index might influence the prevalence of malnutrition. A total of 511 (66.3%) patients were identified as with high nutritional risk by at least one of the nutritional indices, indicating that malnutrition was a common occurrence in patients with DFUs. There were many potential contributing factors to the risk of malnutrition among patients with DFUs. The main reasons for developing malnutrition included decreased nutritional intake, increased energy and protein requirements, increased losses and inflammation (15). Response to trauma or infection related to DFUs might alter metabolism, appetite, and absorption, leading to insufficient intake. Drug-related side effects, such as antibiotics and painkillers, may also cause anorexia (15). Moreover, reduced mobility in patients with DFUs may cause severe catabolism then reduce muscle protein synthesis (16). Furthermore, patients with DFUs were accompanied by a sustained inflammatory state (17), which could contribute to hypoalbuminemia by increasing capillary permeability and promoting protein degradation (18).
Previous studies reported that nutritional screening tools, such as subjective global assessment, mini nutritional assessment, Haute Autorité de Santé criteria, and GNRI could identify DFUs at risk of malnutrition (5, 11, 19, 20). However, only one study with a small sample size demonstrated that malnutrition determined by GNRI was associated with all-cause mortality in patients undergoing amputations due to DFUs (11). The present study demonstrated the prognostic value of three objective nutritional indices, GNRI, PNI, and CONUT, in a relatively large cohort of patients with DFUs.
Nutritional status has been reported to be an important predicted indicator of mortality in various diseases (7, 21–23). Long-term chronic disease, including diabetes, results in malnutrition, which may exacerbate the disease and contribute to an unfavorable prognosis (24). The parameters in each index might also explain the associations of nutritional indices with all-cause mortality. Albumin was the common component of three nutritional indices. Albumin reflected nutritional status and systemic inflammation (18). Hypoalbuminemia was associated with mortality in patients regardless of the implicated disease, even in a healthy population (25). Lymphocytes reflected the immune regulatory response (26). Lymphocyte count and leukocyte ratios that mainly included lymphocyte were predictors of mortality in patients with type 2 diabetes and DFUs (26, 27). Lower BMI was found to be associated with mortality in patients with diabetes and DFUs in recent studies (28, 29), which was consistent with our finding: BMI was negatively associated with all-cause mortality in the unadjusted Cox regression analyses. Patients with type 2 diabetes are usually overweight or obese. However, the median BMI of patients in the study was 23.5 (kg/m2), which was relativity lower than the mean BMI (around 25 kg/m2) of patients with type 2 diabetes in China (30). 10.9% of patients in this study were obese (BMI ≥28 kg/m2), which were lower than that (16.4% for obesity) of general populations in China (31). The above findings suggested that the prevalence of malnutrition was higher among patients with type 2 diabetes and DFUs than those with type 2 diabetes but without DFUs, and the general population.
Since most malnutrition can be caused due to diseases and the risk of malnutrition increases with the severity of disease (15), subgroup analyses were performed according to the severity of DFUs. In subgroup analyses, nutritional status affected all-cause mortality more strongly in patients with no severe DFUs than those with severe DFUs. This discrepancy might be due to the differences in patients' characteristics. In this study, patients with severe DFUs had a higher prevalence of high nutritional risk measured by any of the three nutritional indices, and vice versa. However, the underlying mechanism by which mortality of severe DFUs was less affected by nutritional status, needs to be clarified by further studies. GNRI was the only independent prognostic factor in patients with severe DFUs. GNRI included ALB, height, and weight. PNI included ALB and lymphocyte count. CONUT was similar to the PNI, except for an additional parameter: TC. However, TC was not associated with mortality in unadjusted Cox regression analyses. GNRI contained both anthropometric factors and serum factors, while CONUT and PNI contained only serum factors. Therefore, GNRI was considered to be a better nutritional screening tool than PNI and CONUT because it was multidimensional (7).
This study has two strengths. First, the sample size of this study is relatively large. Second, the nutritional indices used in this study were objective and simple. There were many screening tools for malnutrition indices, such as subjective global assessment, which is a multidimensional screening tool. It subjectively classified patients based on medical history and physical examination, and has no numerical scoring system (5, 32). Subjective global assessment is not objective, therefore, it is not suitable for intervention and follow-up studies (32). Subjective global assessment requires detailed training of medical staff and cooperation of patients, whereas the three indices in this study can be conveniently used in a clinical setting. This study also has several limitations. First, this is a single center study. Therefore, the results may not be applicable to general patients with DFUs. Second, we only evaluated the nutritional indices at baseline, without dynamic observation of indices during follow-up. Third, our analysis is limited to all-cause mortality, not disease-specific mortality. Fourth, another limitation is the lack of sufficient information on concomitant cardiovascular diseases. The present findings need to be confirmed by further well-designed studies in different settings and cohorts with a dynamic observation of nutritional indices.
In conclusion, the present study demonstrated that malnutrition was common in patients with DFUs. Three objective and simple nutritional indices, namely GNRI, PNI, and CONUT were powerful predictors of mortality in patients with DFUs. Routine screening for malnutrition using any of the three nutritional indices might be a simple and effective way to identify high-risk patients with DFUs. GNRI can be used as an independent prognostic indicator in patients with severe DFUs. Early nutritional interventions might help to improve the prognosis of patients with high nutritional risk, which needs to be clarified by further studies.
Data Availability Statement
The raw data supporting the conclusions of this article will be made available by the authors, without undue reservation.
Ethics Statement
The studies involving human participants were reviewed and approved by the Ethics Committee of the First Affiliated Hospital of Wenzhou Medical University. Written informed consent for participation was not required for this study in accordance with the national legislation and the institutional requirements.
Author Contributions
JH, HZ, and Q-QH: study concept and design. F-FJ and Z-RX: acquisition of data. JH and W-YL: analysis and interpretation of data. JH: drafting of the manuscript. W-YL, Q-QH, XH, F-XS, and HZ: critical revision of the manuscript for important intellectual content. All authors read and approved the final manuscript.
Funding
This work was supported by the National Natural Science Foundation of China (81900737), the Basic Scientific Research Program of Wenzhou Medical University, China (KYYW202015).
Conflict of Interest
The authors declare that the research was conducted in the absence of any commercial or financial relationships that could be construed as a potential conflict of interest.
Publisher's Note
All claims expressed in this article are solely those of the authors and do not necessarily represent those of their affiliated organizations, or those of the publisher, the editors and the reviewers. Any product that may be evaluated in this article, or claim that may be made by its manufacturer, is not guaranteed or endorsed by the publisher.
Acknowledgments
The authors like to acknowledge all the patients who participated in the study.
Supplementary Material
The Supplementary Material for this article can be found online at: https://www.frontiersin.org/articles/10.3389/fnut.2022.851274/full#supplementary-material
Supplementary Figure 1. Patients [n (%)] defined as high nutritional risk (GNRI <93.1, PNI <43.6 or CONUT >4.5) were shown inside the circle, and patients [n (%)] defined as low nutritional risk were shown outside the circle. GNRI, geriatric nutritional risk index; PNI, prognostic nutritional index; CONUT, controlling nutritional status.
Supplementary Table 1. Diagnostic performances of optimal cut-off values of nutritional indices.
Supplementary Table 2. Prevalence of high nutritional risk according to the severity of DFUs.
Supplementary Table 3. Cumulative overall survival of participants categorized by GNRI, PNI, and CONUT.
Supplementary Table 4. Unadjusted Cox regression analyses for all-cause mortality.
Abbreviations
ALB, albumin; AUC, area under ROC curve; BMI, body mass index; CONUT, controlling nutritional status; DBP, diastolic blood pressure; DFUs, diabetic foot ulcers; eGFR, estimated glomerular filtration rate; GNRI, geriatric nutritional risk index; HbA1c, hemoglobin A1c; Hb, hemoglobin; HDL, high-density lipoprotein; LDL, low-density lipoprotein; NPV, negative predictive value; OS, overall survival; PNI, prognostic nutritional index; PPV, positive predictive value; Ref, reference; ROC, receiver operating characteristic; SBP, systolic blood pressure; TC, total cholesterol; TG, triglyceride.
References
1. Brownrigg JR, Davey J, Holt PJ, Davis WA, Thompson MM, Ray KK, et al. The association of ulceration of the foot with cardiovascular and all-cause mortality in patients with diabetes: a meta-analysis. Diabetologia. (2012) 55:2906–12. doi: 10.1007/s00125-012-2673-3
2. Armstrong DG, Swerdlow MA, Armstrong AA, Conte MS, Padula WV, Bus SA. Five year mortality and direct costs of care for people with diabetic foot complications are comparable to cancer. J Foot Ankle Res. (2020) 13:16. doi: 10.1186/s13047-020-00383-2
3. Boyko EJ, Ahroni JH, Smith DG, Davignon D. Increased mortality associated with diabetic foot ulcer. Diabetic Med. (1996) 13:967–72. doi: 10.1002/(sici)1096-9136(199611)13:11<967::Aid-dia266>3.0.Co;2-k
4. Fagher K, Löndahl M. The impact of metabolic control and QTc prolongation on all-cause mortality in patients with type 2 diabetes and foot ulcers. Diabetologia. (2013) 56:1140–7. doi: 10.1007/s00125-013-2860-x
5. Zhang SS, Tang ZY, Fang P, Qian HJ, Xu L, Ning G. Nutritional status deteriorates as the severity of diabetic foot ulcers increases and independently associates with prognosis. Exp Therap Med. (2013) 5:215–22. doi: 10.3892/etm.2012.780
6. Correia MI, Waitzberg DL. The impact of malnutrition on morbidity, mortality, length of hospital stay and costs evaluated through a multivariate model analysis. Clin Nutr. (2003) 22:235–9. doi: 10.1016/s0261-5614(02)00215-7
7. Sze S, Pellicori P, Kazmi S, Rigby A, Cleland JGF, Wong K, et al. Prevalence and prognostic significance of malnutrition using 3 scoring systems among outpatients with heart failure: a comparison with body mass index. JACC Heart Fail. (2018) 6:476–86. doi: 10.1016/j.jchf.2018.02.018
8. Bouillanne O, Morineau G, Dupont C, Coulombel I, Vincent JP, Nicolis I, et al. Geriatric nutritional risk index: a new index for evaluating at-risk elderly medical patients. Am J Clin Nutr. (2005) 82:777–83. doi: 10.1093/ajcn/82.4.777
9. Buzby GP, Mullen JL, Matthews DC, Hobbs CL, Rosato EF. Prognostic nutritional index in gastrointestinal surgery. Am J Surgery. (1980) 139:160–7. doi: 10.1016/0002-9610(80)90246-9
10. Ignacio de Ulíbarri J, González-Madroño A, de Villar NG, González P, González B, Mancha A, et al. CONUT: a tool for controlling nutritional status. First validation in a hospital population. Nutr Hospit. (2005) 20:38–45. Available online at: http://www.redalyc.org/articulo.oa?id=309225534003
11. Xie Y, Zhang H, Ye T, Ge S, Zhuo R, Zhu H. The geriatric nutritional risk index independently predicts mortality in diabetic foot ulcers patients undergoing amputations. J Diabetes Res. (2017) 2017:5797194. doi: 10.1155/2017/5797194
12. Lipsky BA, Aragón-Sánchez J, Diggle M, Embil J, Kono S, Lavery L, et al. IWGDF guidance on the diagnosis and management of foot infections in persons with diabetes. Diabetes Metabolism Res Rev. (2016) 32(Suppl. 1):45–74. doi: 10.1002/dmrr.2699
13. Hong J, Liu WY, Hu X, Jiang FF, Xu ZR, Li F, et al. Association between heart rate-corrected QT interval and severe peripheral arterial disease in patients with type 2 diabetes and foot ulcers. Endocrine Connect. (2021) 10:845–51. doi: 10.1530/ec-21-0140
14. Kuroda D, Sawayama H, Kurashige J, Iwatsuki M, Eto T, Tokunaga R, et al. Controlling nutritional status (CONUT) score is a prognostic marker for gastric cancer patients after curative resection. Gastric Cancer. (2018) 21:204–12. doi: 10.1007/s10120-017-0744-3
15. Norman K, Pichard C, Lochs H, Pirlich M. Prognostic impact of disease-related malnutrition. Clin Nutr. (2008) 27:5–15. doi: 10.1016/j.clnu.2007.10.007
16. Paddon-Jones D, Sheffield-Moore M, Cree MG, Hewlings SJ, Aarsland A, Wolfe RR, et al. Atrophy and impaired muscle protein synthesis during prolonged inactivity and stress. J Clin Endocrinol Metabolism. (2006) 91:4836–41. doi: 10.1210/jc.2006-0651
17. den Dekker A, Davis FM, Kunkel SL, Gallagher KA. Targeting epigenetic mechanisms in diabetic wound healing. Transl Res. (2019) 204:39–50. doi: 10.1016/j.trsl.2018.10.001
18. Soeters PB, Wolfe RR, Shenkin A. Hypoalbuminemia: pathogenesis and clinical significance. JPEN. (2019) 43:181–93. doi: 10.1002/jpen.1451
19. Gau BR, Chen HY, Hung SY, Yang HM, Yeh JT, Huang CH, et al. The impact of nutritional status on treatment outcomes of patients with limb-threatening diabetic foot ulcers. J Diabetes Compl. (2016) 30:138–42. doi: 10.1016/j.jdiacomp.2015.09.011
20. Rouland A, Fourmont C, Sberna AL, Aho Glele LS, Mouillot T, Simoneau I, et al. Malnutrition in type 2 diabetic patients does not affect healing of foot ulcers. Acta Diabetol. (2019) 56:171–6. doi: 10.1007/s00592-018-1233-9
21. Yuan K, Zhu S, Wang H, Chen J, Zhang X, Xu P, et al. Association between malnutrition and long-term mortality in older adults with ischemic stroke. Clin Nutr. (2021) 40:2535–42. doi: 10.1016/j.clnu.2021.04.018
22. Yoon JP, Nam JS, Abidin M, Kim SO, Lee EH, Choi IC, et al. Comparison of preoperative nutritional indexes for outcomes after primary esophageal surgery for esophageal squamous cell carcinoma. Nutrients. (2021) 13:4086. doi: 10.3390/nu13114086
23. Matsukawa T, Suto K, Kanaya M, Izumiyama K, Minauchi K, Yoshida S, et al. Validation and comparison of prognostic values of GNRI, PNI, and CONUT in newly diagnosed diffuse large B cell lymphoma. Ann Hematol. (2020) 99:2859–68. doi: 10.1007/s00277-020-04262-5
24. Saintrain MVL, Sandrin R, Bezerra CB, Lima AOP, Nobre MA, Braga DRA. Nutritional assessment of older adults with diabetes mellitus. Diabetes Res Clin Practice. (2019) 155:107819. doi: 10.1016/j.diabres.2019.107819
25. Franch-Arcas G. The meaning of hypoalbuminaemia in clinical practice. Clin Nutr. (2001) 20:265–9. doi: 10.1054/clnu.2001.0438
26. Cardoso CRL, Leite NC, Salles GF. Importance of hematological parameters for micro- and macrovascular outcomes in patients with type 2 diabetes: the Rio de Janeiro type 2 diabetes cohort study. Cardiovasc Diabetol. (2021) 20:133. doi: 10.1186/s12933-021-01324-4
27. Chen W, Chen K, Xu Z, Hu Y, Liu Y, Liu W, et al. Neutrophil-to-Lymphocyte ratio and platelet-to-lymphocyte ratio predict mortality in patients with diabetic foot ulcers undergoing amputations. Diabetes Metabolic Syndrome Obesity. (2021) 14:821–9. doi: 10.2147/dmso.S284583
28. Gazzaruso C, Gallotti P, Pujia A, Montalcini T, Giustina A, Coppola A. Predictors of healing, ulcer recurrence and persistence, amputation and mortality in type 2 diabetic patients with diabetic foot: a 10-year retrospective cohort study. Endocrine. (2021) 71:59–68. doi: 10.1007/s12020-020-02431-0
29. Chamberlain RC, Fleetwood K, Wild SH, Colhoun HM, Lindsay RS, Petrie JR, et al. Foot ulcer and risk of lower limb amputation or death in people with diabetes: a national population-based retrospective cohort study. Diabetes Care. (2022) 45:83–91. doi: 10.2337/dc21-1596
30. Ma RCW. Epidemiology of diabetes and diabetic complications in China. Diabetologia. (2018) 61:1249–60. doi: 10.1007/s00125-018-4557-7
31. Pan XF, Wang L, Pan A. Epidemiology and determinants of obesity in China. Lancet Diabetes Endocrinol. (2021) 9:373–92. doi: 10.1016/s2213-8587(21)00045-0
Keywords: diabetes mellitus, foot ulcer, malnutrition, mortality, nutrition assessment
Citation: Hong J, Huang Q-Q, Liu W-Y, Hu X, Jiang F-F, Xu Z-R, Shen F-X and Zhu H (2022) Three Nutritional Indices Are Effective Predictors of Mortality in Patients With Type 2 Diabetes and Foot Ulcers. Front. Nutr. 9:851274. doi: 10.3389/fnut.2022.851274
Received: 09 January 2022; Accepted: 15 February 2022;
Published: 15 March 2022.
Edited by:
Yoshitaka Hashimoto, Kyoto Prefectural University of Medicine, JapanReviewed by:
Firdaus Hayati, Universiti Malaysia Sabah, MalaysiaCarmine Gazzaruso, University of Milan, Italy
Copyright © 2022 Hong, Huang, Liu, Hu, Jiang, Xu, Shen and Zhu. This is an open-access article distributed under the terms of the Creative Commons Attribution License (CC BY). The use, distribution or reproduction in other forums is permitted, provided the original author(s) and the copyright owner(s) are credited and that the original publication in this journal is cited, in accordance with accepted academic practice. No use, distribution or reproduction is permitted which does not comply with these terms.
*Correspondence: Hong Zhu, emh1aG9uZ0B3bXUuZWR1LmNu