
95% of researchers rate our articles as excellent or good
Learn more about the work of our research integrity team to safeguard the quality of each article we publish.
Find out more
ORIGINAL RESEARCH article
Front. Nutr. , 28 April 2022
Sec. Nutrition and Microbes
Volume 9 - 2022 | https://doi.org/10.3389/fnut.2022.842686
 Xuelei Zhang1,2
 Baoyang Xu2
 Zhenping Hou1Chunlin Xie2Yaorong Niu2
 Qiuzhong Dai1
 Xianghua Yan2*
 Duanqin Wu1*
Given the antibacterial effects of ε-polylysine acting on cell membranes, and that glycerol phospholipids are important components of the cell membrane, we hypothesized that ε-polylysine may regulate glycerophospholipid metabolism by modifying the gut microbiota. To test this hypothesis, we treated post-weaning C57 mice with different levels of ε-polylysine (0, 300, 600, and 1,200 ppm) in their basic diet. The growth performance and morphology of intestine were then determined. Modification of the gut microbiota and their function were analyzed using 16S rDNA sequencing. Metabolite identification was performed using the LC-MS method. The results showed that body weight decreased with an increasing supplemental level of ε-polylysine from 5 to 7 weeks (P < 0.05), but no significant difference was observed after 8 weeks (P > 0.05). Supplementation with 1,200 ppm ε-polylysine changed the morphology of the jejunum and ileum, increased the villus length, decreased the crypt depth of the jejunum, and decreased the villus length and crypt depth of the ileum (P < 0.05). ε-Polylysine shifted the intestine microbiota by changing alpha diversity (Chao 1, observed species, Shannon, and Simpson indices) and varied at different times. ε-polylysine decreased Firmicutes and increased Bacteroidetes at 4 week, but increased Firmicutes and decreased Bacteroidetes at 10 week. ε-Polylysine regulated genera associated with lipid metabolism such as Parabacteroides, Odoribacter, Akkermansia, Alistipes, Lachnospiraceae UCG-001, Collinsella, Ruminococcaceae, and Intestinimonas. During the adult period, the genera Alistipes, Lachnospiraceae UCG-001, and Streptomyces were positively associated with PC, PE, LysoPC, LysoPE, 1-Arachidonoylglycerophosphoinositol and OHOHA-PS (R > 0.6, P < 0.001), but changes in Blautia, Christensenellaceae R-7 group, Odoribacter, Allobaculum, Ruminococcaceae UCG-004, Ruminococcaceae UCG-005, and Lachnospiraceae UCG-010 were negatively correlated with glycerophospholipid metabolites (R < −0.6, P < 0.001). The abundance of glycerophospholipid metabolites, including PC, PE, lysoPC, and lysoPE, were decreased by ε-polylysine. Furthermore, ε-polylysine reduced the incidence of the genera including Ruminococcus, Prevotella, Prevotellaceae, Butyricimonas, and Escherichia-Shigella and reduced the abundance of Faecalibaculum, Christensenellaceae R-7 group, Coriobacteriaceae UCG-002. In conclusion, ε-polylysine modified gut microbiota composition and function while also restraining pathogenic bacteria. The glycerophospholipid metabolism pathway and associated metabolites may be regulated by intestinal bacteria.
It is important to understand the relationship between the gut microbial ecosystem and host lipid homeostasis. The gut microbiota significantly influences the body’s lipidome (1). Host lipid homeostasis and the gut microbial ecosystem are closely associated with metabolic diseases (2). Phospholipids are important components of all cellular and subcellular membranes (3), and are involved in the pathogenesis of several diseases, including type 2 diabetes, tuberculosis (4), fatty liver disease (5), and schizophrenia-related behaviors (6). Glycerophospholipids includes phosphatidylcholine (PC) and phosphatidylethanolamine (PE), which are components of plasma lipoproteins that transport neutral lipids (3). Different types of phospholipids have unique physiological functions. PC is the major membrane-forming phospholipid in eukaryotes (7). In the livers of PC-treated rats, PC restored intestinal barrier function and reduced endotoxemia, demonstrating its hepatoprotective properties (8). The gut microbiota can detect free cholesterol and elevate levels of PC and PE in specific pathogen-free and germ-free mice (9). Microbes can significantly alter glycerophospholipid acyl chain profiles and enhance the levels of glycerophospholipid precursors (10).
ε-Polylysine, a homopolymer, composed of 25–35 mono-lysine, which connected by amide linkages between ε-amino and α-carboxyl groups (11). Interestingly, ε-polylysine exhibits a broad spectrum of bacteriostatic properties that affect gram-positive bacteria, such as Listeria monocytogenes, Escherichia coli O157:H7, Salmonella typhimurium, Staphylococcus aureus, and Bacillus subtilis (12–15). The bacteriostatic properties of ε-polylysine was in a highly polymerized multivalent cationic state, and its antibacterial activity mechanism stems from the fact that the surface of bacteria is an anion that provides potential sites for electrostatic binding of ε-polylysine cationic surfactants (16, 17). Supplementing mice diets with antimicrobial ε-polylysine altered the gut microbial community in mice and their respective predicted functions, suggesting that the microbiome is dynamic, resilient, and adapts to microbially active dietary components (18). In our previous study based on pigs, we found that ε-polylysine may regulate the gut microbiota and its function, as it influences the utilization of lipids and metabolizable energy (19). Furthermore, ε-polylysine decreased serum and liver lipid content, and enhanced the activity of two key enzymes named hepatic acetyl-coenzyme A carboxylase and glucose-6-phosphate dehydrogenase, which involved in fatty acid biosynthesis in rats (20). ε-polylysine also inhibits pancreatic lipid activity in rats by suppressing dietary fat absorption from the small intestine (21).
Owing to the effect of ε-polylysine on microorganisms and phospholipid metabolism, we aimed to establish a comprehensive overview of microbial colonization affecting plasma glycerophospholipid metabolism in C57 mice. In this study, we performed 16S rDNA analysis and metabolome analysis to systematically investigate the influence of the food additive ε-polylysine on the intestinal microflora and glycerophospholipid metabolism in C57 mice. We aimed to provide important data for the development and application of food additives to improve the safety of human food products.
Our animal experimental procedures were approved by the Institute of Bast Fiber Crops, CAAS (Changsha, China), and Huazhong Agricultural University (Wuhan, China). All experiments in this study were conducted with the Scientific Ethics Committee of the Huazhong Agricultural University in strict accordance (approval number: HZAUMO-2019-059). Three-week-old post-weaning specific pathogen-free C57 Black mice (n = 80, body weight 9.35 ± 1.13 g) were randomly assigned to four groups, each containing 20 male mice. Each group was fed the same diet (AIN-76A) supplemented with 0, 300, 600, and 1,200 ppm ε-polylysine. C57 mice were maintained under 12:12 h light/dark conditions at Huazhong Agricultural University with free access to feed and water. Body weights were measured at the beginning of the experimental period, and then once per week. Fecal samples (n = 12 each group) were collected at weeks four, six, and ten. At the end of the experiment (after about 10 weeks), the mice were anesthetized and sacrificed, and intestine and plasma samples (n = 20 each group) were harvested.
The morphology of the intestine was determined using hematoxylin and eosin. One centimeter of the small intestine and large intestine, as well as the middle position of each bowel segment, were rinsed in PBS, fixed in formalin overnight at 4°C, and embedded in paraffin. Intestinal sections were stained with H&E. Villus height and crypt depth of the small intestine were measured using Image-Pro Plus 6.0 software (Media Cybernetics, Inc., Rockville, MD, United States).
Qubit dsDNA Assay Kit (Cat. No. Q328520, Life Technologies, Carlsbad, CA, United States) was used to extract DNA according to the manufacturer’s instructions. The diluted DNA (1 ng/μL) was used as a template for polymerase chain reaction (PCR) amplification of bacterial 16S rDNA genes. For bacterial diversity analysis, the V3–V4 variable regions of 16S rDNA genes were amplified using the universal primers 343F (5′-TACGGRAGGCAGCAG-3′) and 798R (5′-AGGGTATCTAATCCT-3′) (22). The final amplicon was quantified using the Qubit dsDNA Assay Kit (Life Technologies, Q328520, Grand Island, CA, United States). Equal amounts of purified amplicons were pooled for sequencing on the Illumina MiSeq platform.
Clustering to generate OTUs using Vsearch software (23) with a 97% similarity cutoff. The representative reads of each OTU were selected using the QIIME package (version 1.8.0). All representative reads were annotated and blasted against the Silva database Version 123 (or Greengens) using the RDP classifier (24) with a confidence threshold of 70%.
The abundance of each OTU was normalized relative to the sample with the fewest sequences. Alpha diversity was used to analyze the complexity of species in fecal sample by applying the Chao1, observed species, Shannon, and Simpson indices. Beta diversity was used to evaluate the complexity of species and was calculated using PCoA. Both Alpha and Beta diversity were used in the QIIME software (version 1.8.0). The different phyla and genera of 16S rDNA were analyzed using the Kruskal-Wallis test. P < 0.01 was considered highly significant, and P < 0.05, was considered significant. We confirmed that all species were differentially abundant by LEfSe analysis. Heatmap diagrams and other plots were created in the R environment (v3.1.2). Functional profiles of the gut microbiota were analyzed using PICRUSt (25). OTUs were normalized, and the gene categories were at level 2 of the KEGG orthology groups (26).
Plasma samples (100 μL) were added into 10 μL internal standard (2-chloro-l-phenylalanine in methanol, 0.3 mg/mL) dissolved in methanol, and vortexed for 10 s. Then, the mixtures were vortexed for 1 min with 300 μL mixture of methanol and acetonitrile (2/1, v/v). All samples were ultrasonicated at 25–28°C for 10 min and stored at −20°C for 30 min. The extract was centrifuged at 13,000 rpm at 4°C for 15 min. The supernatant (300 mL) was dried in a freeze-concentration centrifugal dryer. A mixture of 400 μL methanol and water (1/4, vol/vol) was added to each sample, then vortexed for 30 s, and placed at 4°C for 2 min. Samples were centrifuged at 13,000 rpm at 4°C for 5 min. The supernatant (150 μL) from each tube was collected using crystal syringes, filtered through 0.22 μm microfilters and transferred to LC vials. The vials were stored at −80°C until LC -MS analysis. The analysis instrument of metabolic profiling was the AB ExionLc system (AB SCIEX, Framingham, MA, United States) coupled with an AB SCIEX Triple TOF 6600 System (AB SCIEX, Framingham, MA, United States). An ACQUITY UPLC BEH C18 column (1.7 μm, 2.1 × 100 mm) were employed in both positive and negative modes. The binary gradient elution system consisted of (A) water (containing 0.1% formic acid, v/v) and (B) acetonitrile (containing 0.1% formic acid, v/v) and separation was achieved using the following gradient: 0 min, 95% A, 5% B; 2 min, 80% A, 20% B; 4 min, 75% A, 25% B; 9 min, 40% A, 60% B; 14 min, 100% B; 16 min, 100% B; 16.1 min, 95% A, 5% B and 18.1 min, 95% A, 5% B. The flow rate was 0.4 mL/min and column temperature was 45°C. All the samples were kept at 4°C during the analysis. Data acquisition was performed in full scan mode (m/z ranges from 70 to 1,000) combined with IDA mode. Parameters of mass spectrometry were as follows: ion source temperature, 550°C (+) and 550°C (−); ion spray voltage, 5,500 V (+) and 4,500 V (−); curtain gas of 35 PSI; declustering potential, 80 V (+) and −80 V (−); collision energy, 10 eV (+) and −10 eV (−); and interface heater temperature, 550°C (+) and 550°C (−). For IDA analysis, range of m/z was set as 50–1,000, the collision energy was 30 eV.
The acquired LC-MS raw data were analyzed using Progenesis QI software (Waters Corporation, Milford, CT, United States). Metabolites were identified using Progenesis QI (Waters Corporation, Milford, CT, United States) data processing software, based on public databases such as http://www.hmdb.ca/, http://www.lipidmaps.org/, and self-built databases. PCA and OPLS-DA were carried out to visualize the metabolic alterations. Hotelling’s T2 region, shown as an ellipse in the score plots of the models, defined the 95% confidence interval of the modeled variation. Variable importance in the projection (VIP) ranks the overall contribution of each variable to the OPLS-DA model, and variables with VIP > 1 were considered relevant for group discrimination. The differential metabolites were selected on the basis of the combination of a statistically significant threshold of variable influence on projection (VIP) values obtained from the OPLS-DA model and p values from a two-tailed Student’s t-test on the normalized peak areas, where metabolites with VIP values larger than 1.0, and p values less than 0.05, were considered as differential metabolites (27).
Spearman’s rank correlation coefficient analysis was performed to examine the possible connection between the composition of intestinal microflora at the genus level and plasma metabolites in C57 mice.
The effects of dietary supplementation with ε-polylysine on body weight were shown in Table 1. At the beginning of the experiment, there were no significant differences in body weight (P > 0.05), while the weights in the control group and 300 ppm group were significantly higher than those in the 1,200 ppm group from 5 to 7 weeks (P < 0.05). After 8 week, the weight of mice did not differ between the four groups (P > 0.05), but the trend of weight decreased with increasing ε-polylysine supplementation. As shown in Table 2, there was no significant difference in villus length and crypt depth in the duodenum (P > 0.05). The villus length in the 1,200 ppm group was significantly higher than that in the other groups (P < 0.05), but the crypt depth in the 300 and 1,200 ppm groups were significantly lower than that in the control group (P < 0.05). The villus length in the 1,200 ppm group was significantly lower than that in 600 ppm group, and crypt depth in the 1,200 ppm group was significantly lower than that in the control group (P < 0.05). Compared with the control group, damage to the jejunum epithelium was observed in the 1,200 ppm group (Figure 1).
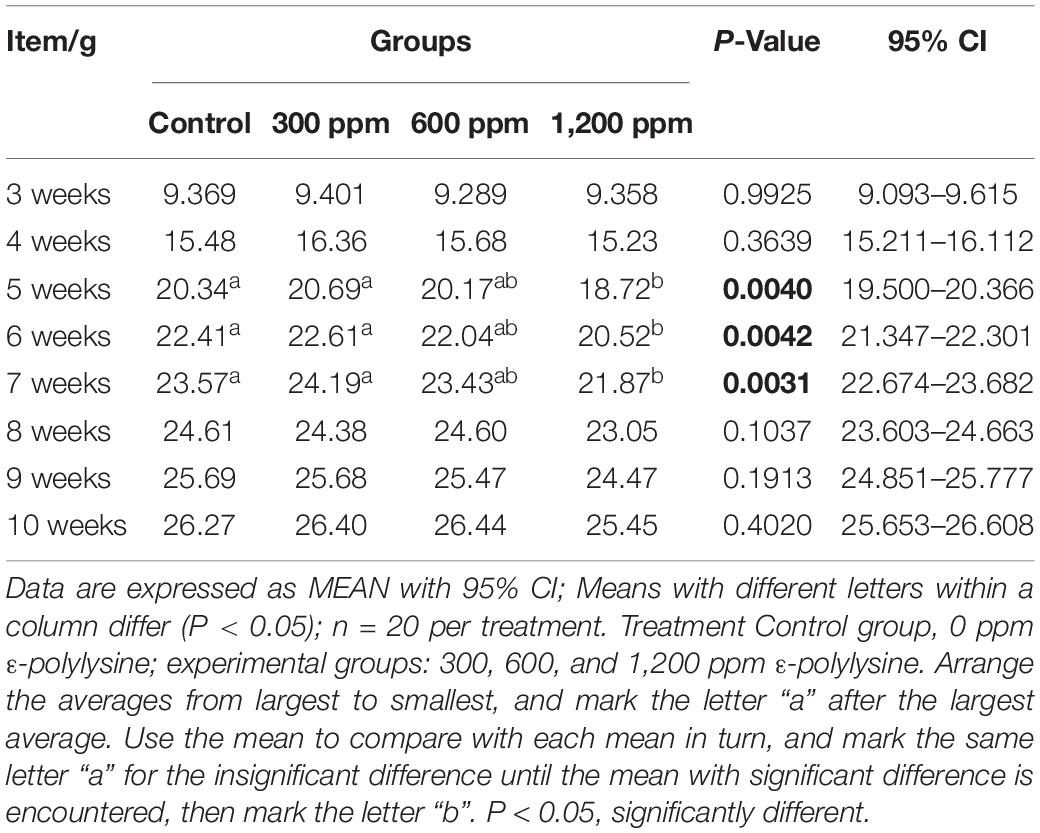
Table 1. The changes of C57 mice weight during the experimental period.
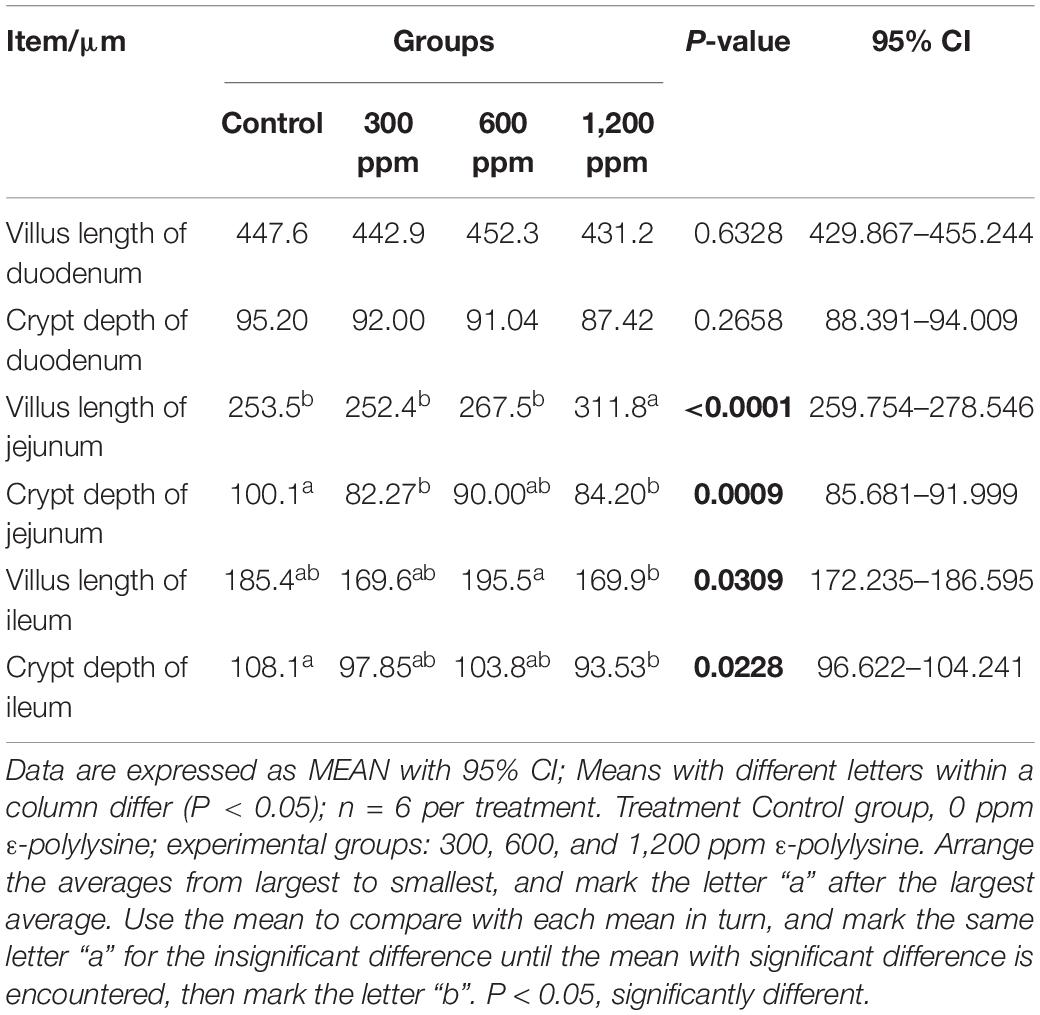
Table 2. The villus length and crypt depth of small intestine.
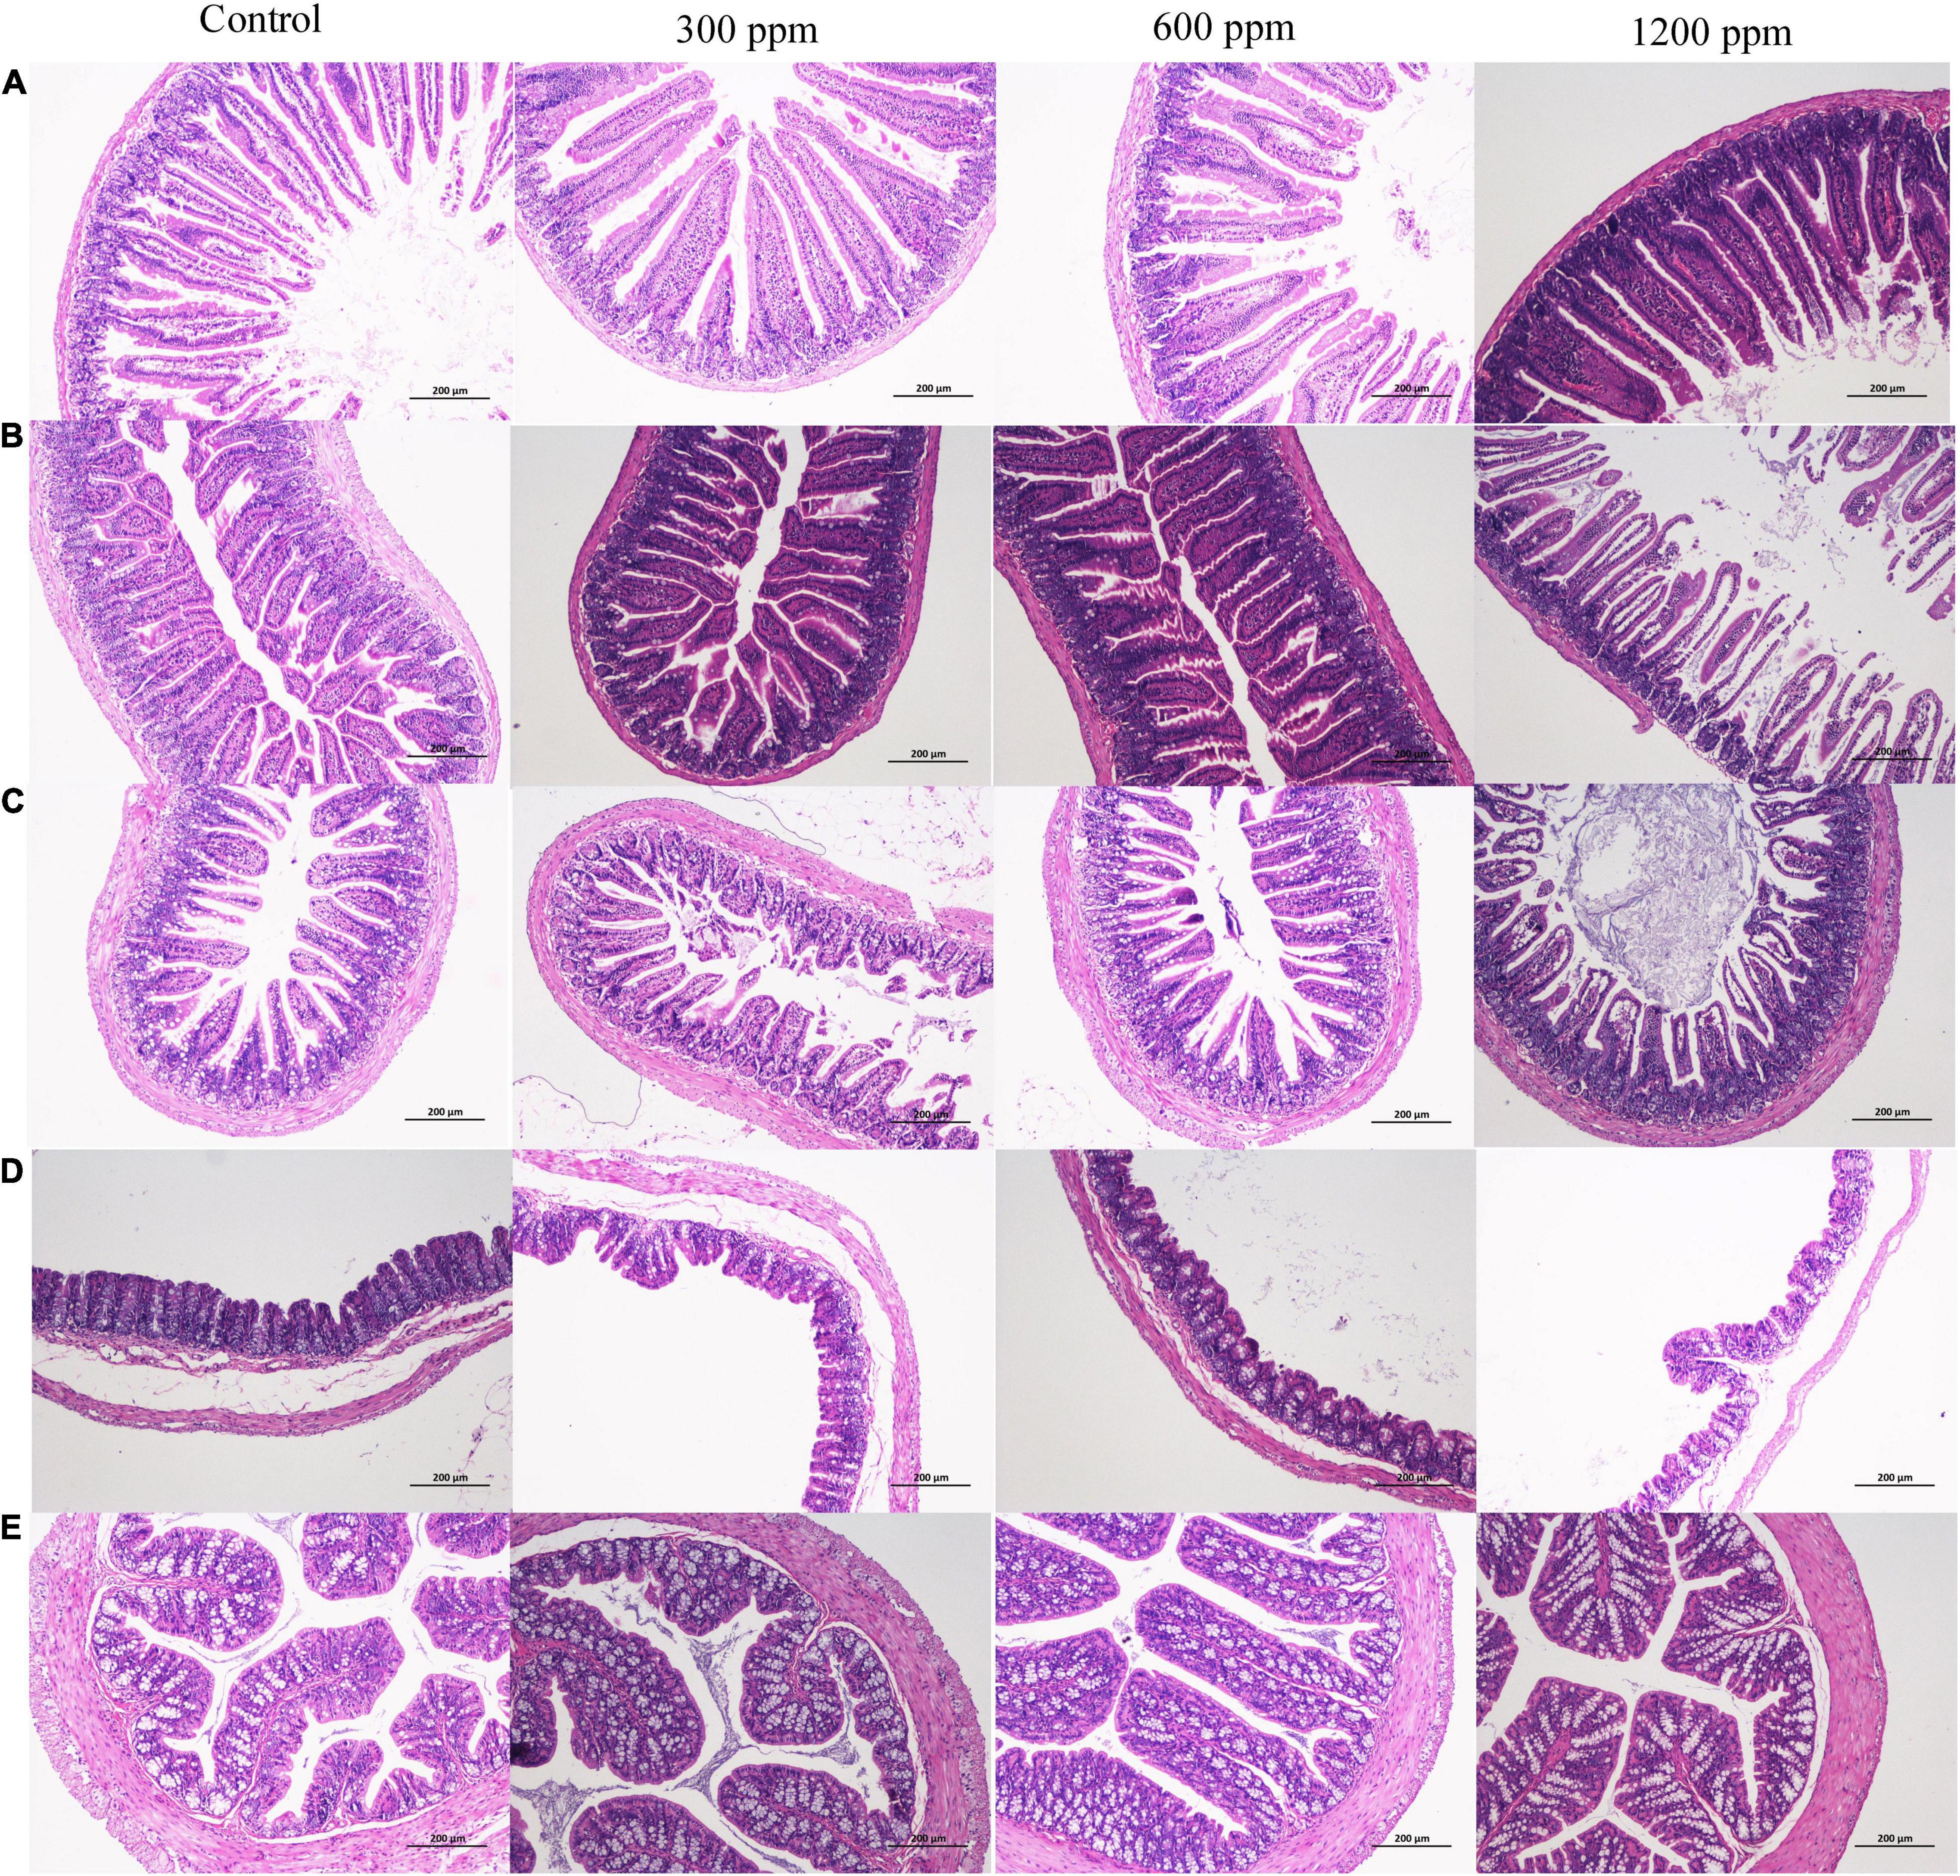
Figure 1. Microscopic observation of intestine. (A) H&E (100×) staining of crypts and villi on duodenum between four groups; (B) H&E (100×) staining of crypts and villi on jejunum between four groups; (C) H&E (100×) staining of crypts and villi on ileum between four groups; (D) H&E (100×) staining of crypts and villi on cecum between four groups; (E) H&E (100×) staining of crypts and villi on colon between four groups.
Among the bioinformatic analyses, a total of 77,742, 77,686, 77,120, and 75,051 valid tags were obtained for the four groups, accounting for 90.62% (control group), 91.40% (300 ppm group), 91.93% (600 ppm group), and 91.22% (1200 ppm group) of raw sequences, respectively (Supplementary Data 1). Taxonomic analysis revealed a total of 17 bacterial phyla, 35 classes, 93 orders, 149 families, 319 genera, and 88 species. As shown in Figures 2A–D, there were no significant differences in the alpha diversity indices (Chao1, observed species, and Shannon indices) among the four groups (P > 0.05), but 600 ppm group had a lower Simpson index than the control group and 300 ppm group (P < 0.05), while the Simpson index at 300 ppm was significantly different from that in the 1,200 ppm group (P < 0.05; Figure 2D). The microbial community structure of all samples (beta diversity) was visualized using PCoA (Figure 2E). The two factors (PC1 and PC2) accounted for 8.08 and 6.36% of the sample variation, respectively. The PCoA based on the bacterial OTUs showed that the samples clustered together, which indicated a shift in the gut bacterial community among the four groups (Figure 2E). Our results showed that the abundance of phylum Bacteroidetes was significantly increased by ε-polylysine, and the abundance of phylum Firmicutes was significantly decreased (P < 0.05), which was a domain phylum in all samples (Figures 2F,G and Supplementary Data 2). The abundance of Proteobacteria and Verrucomicrobia was higher in the ε-polylysine groups than in the control group (P < 0.05; Figure 2G). A total of 96 different genera were identified by Wilcoxon text analysis (Supplementary Data 3). The LEfSe analysis revealed that the genera had effects among the four groups (Figure 2H). Ten genera were more abundant in the ε-polylysine group, including Faecalibaculum, Ileibacterium, Parabacteroides, Odoribacter, Bifidobacterium, Alistipes, Coriobacteriaceae UCG-002, Family XIII AD3011 group, Akkermansia, and Prevotellaceae UCG-001.
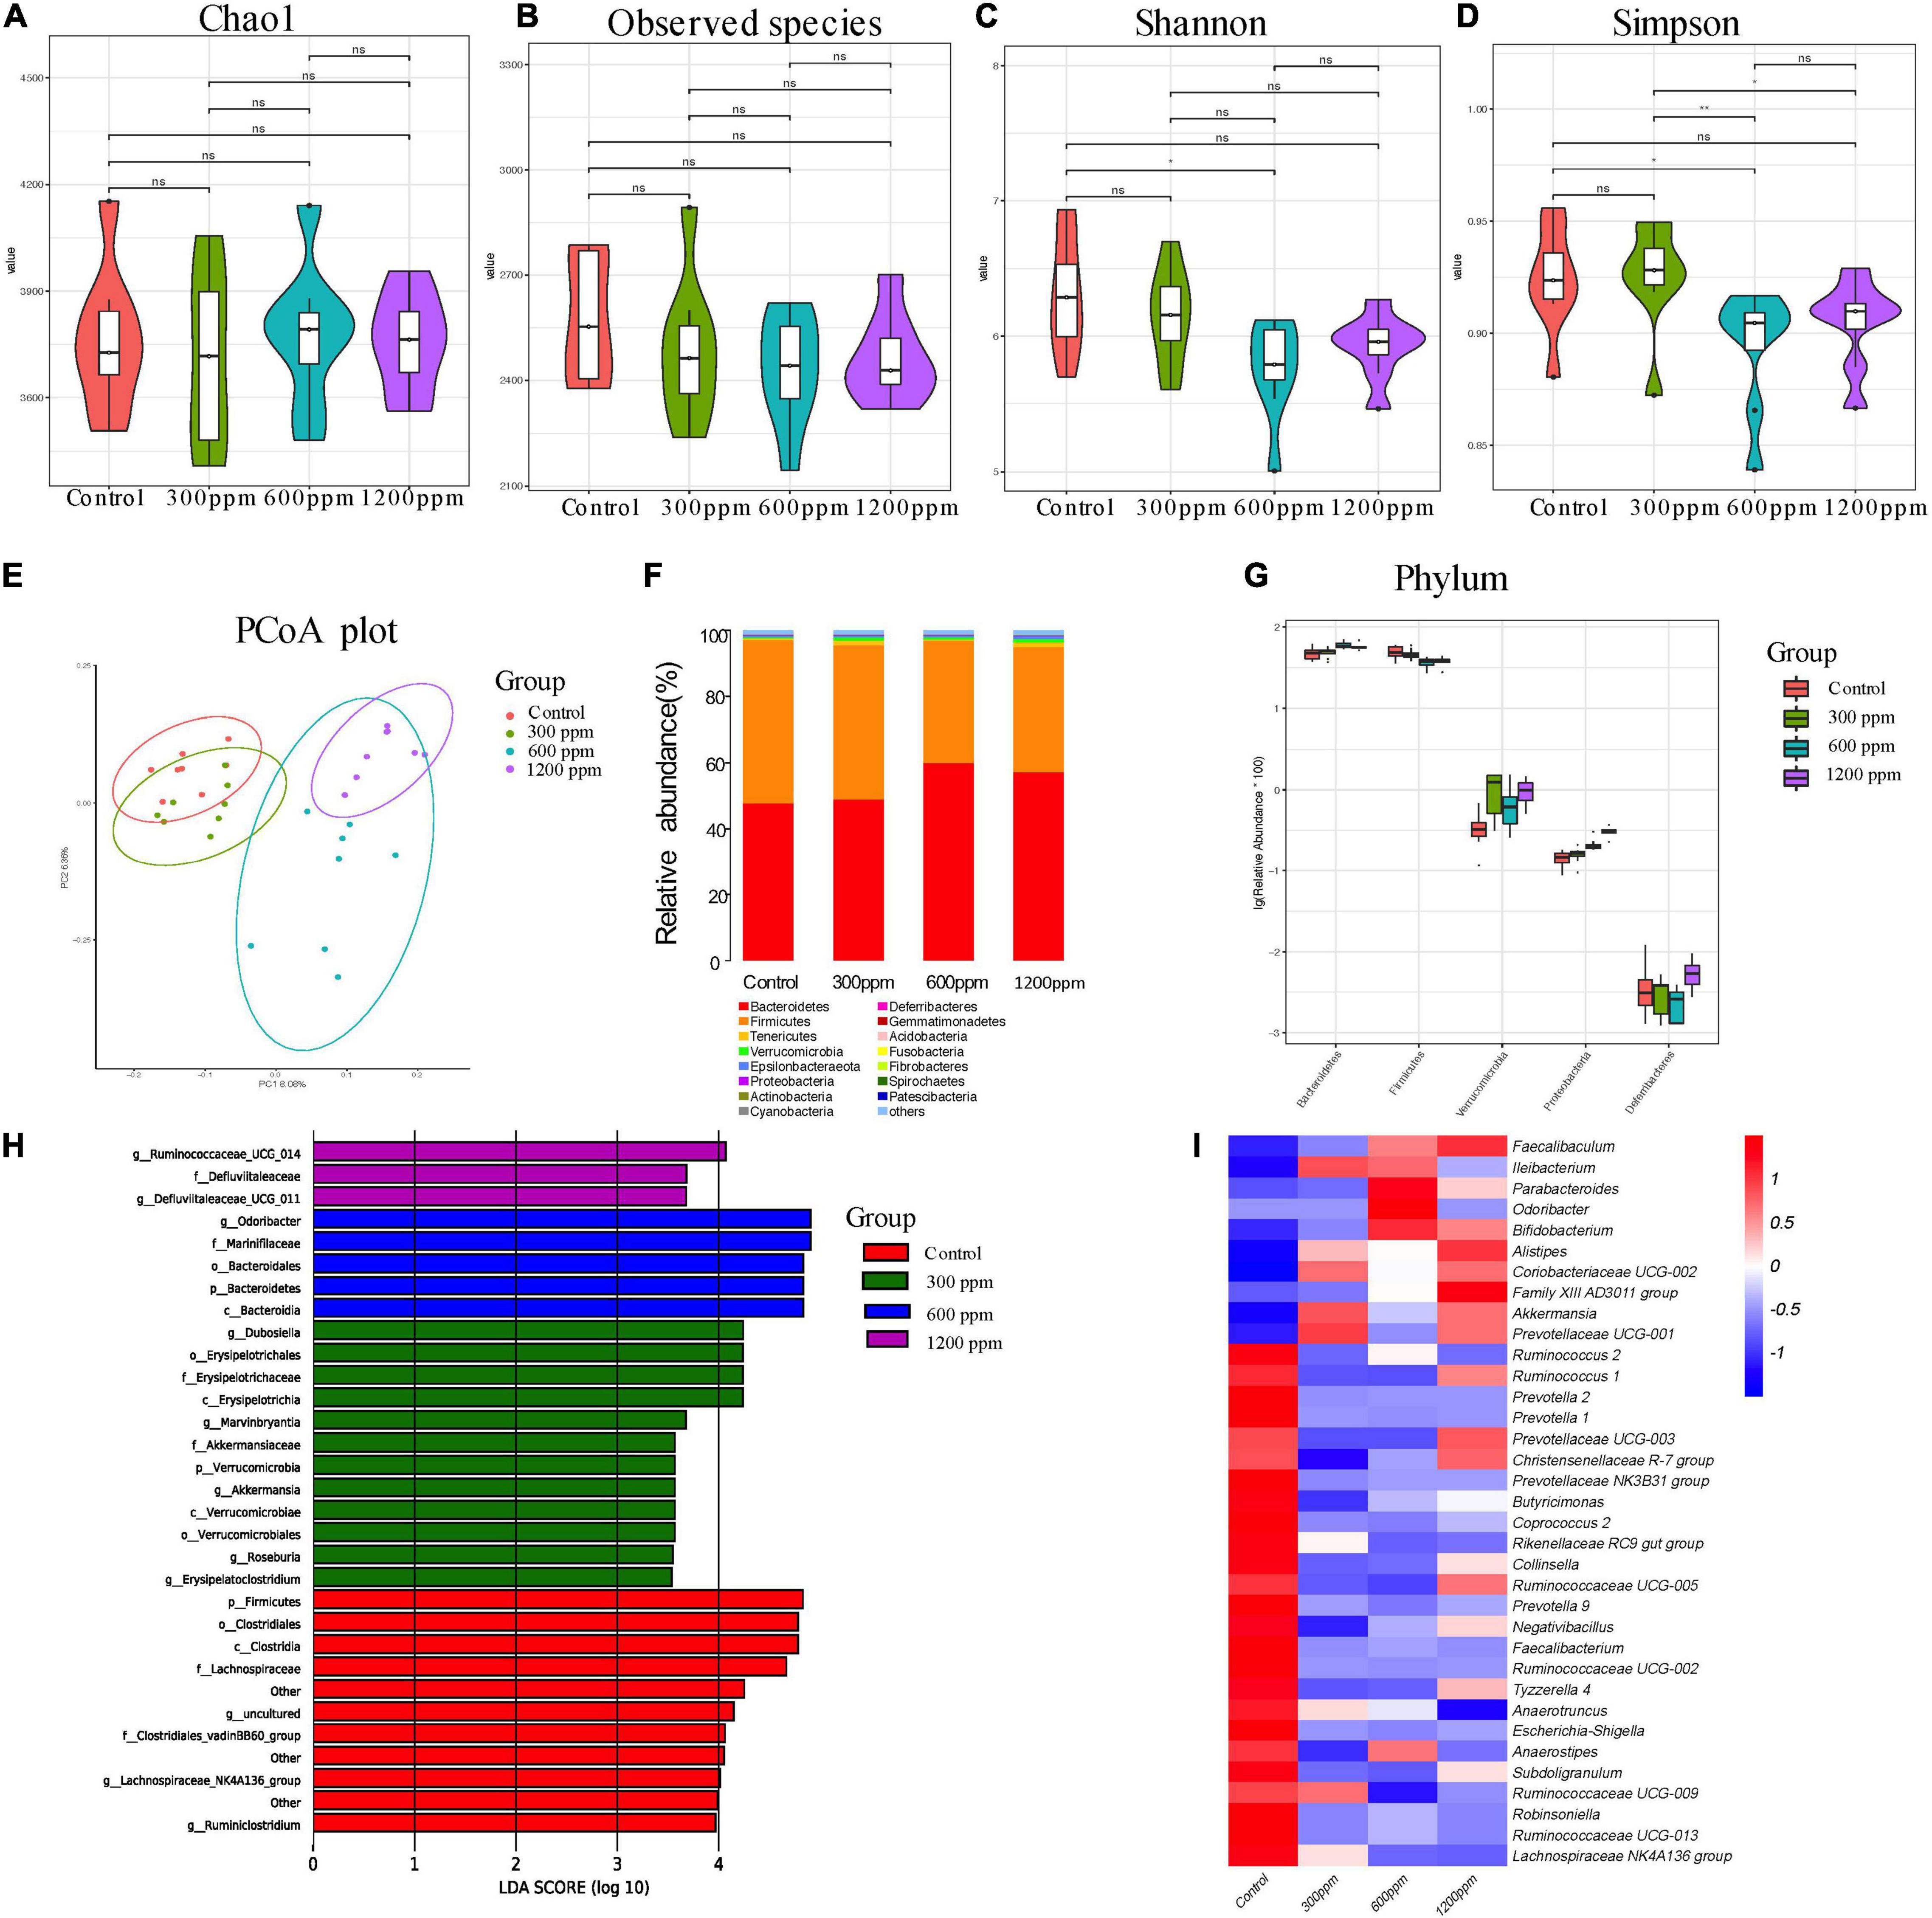
Figure 2. Shifts in the fecal bacterial composition of C57 mice at 4 weeks. (A) Bacterial alpha diversity determined by Chao1 index. (B) Bacterial alpha diversity determined by Observed species index. (C) Bacterial alpha diversity determined by Shannon index. (D) Bacterial alpha diversity determined by Simpson index. (E) PCoA was performed at the operational taxonomic unit (OTU) level based on Bray–Curtis metrics for all samples at different time. (F) Comparison of the relative abundance of top 15 phyla. (G) The different phylum compositions of the experimental group. (H) LefSe results from the fecal microbiota indicating genera significantly associated with the control and ε-polylysine groups samples. (I) Heat map and hierarchical clustering of differentially abundant gut bacterial at genus level.
The others were more abundant in the control group, including Ruminococcus, Prevotella, Prevotellaceae UCG-003, Christensenellaceae R-7 group, Prevotellaceae NK3B31 group, Butyricimonas, Coprococcus 2, Rikenellaceae RC9 gut group, Collinsella, Ruminococcaceae, Negativibacillus, Faecalibacterium, Tyzzerella 4, Anaerotruncus, Escherichia-Shigella, Anaerostipes, Subdoligranulum, Robinsoniella, and Lachnospiraceae NK4A136 group (Figure 2I and Supplementary Data 3).
For the four groups, 76,009, 78,823, 78,996, and 77,816 valid tags were obtained, which accounted for 92.03, 91.92, 91.70, and 92.30% of the raw sequences, respectively (Supplementary Data 1). We examined the taxonomic composition of the fecal microbiota in 6 week-C57 mice, a total of 17 bacterial phyla, 37 classes, 104 orders, 183 families, 381 genera, and 99 species. The Chao1 index in 300 ppm group was significantly higher than that in the other groups (P < 0.05). The observed species index was significantly higher than that in the control group and the 1,200 ppm group (P < 0.05; Figures 3A–D). In the PCoA analysis, PC1 accounted for 7.82% and PC2 accounted for 6.96% (Figure 3E). Bacteroidetes and Firmicutes were the domain phyla, which is the same to 4 weeks (Figure 3F). There were seven different phyla among the four groups (Figure 3G and Supplementary Data 4). The abundance of the phyla Gemmatimonadetes, Proteobacteria, and Fibrobacteres was up-regulated by ε-polylysine. After Wilcoxon text analysis, we identified 140 different genera (Supplementary Data 5). In the control group, the genera Clostridium sensu strcto 1, Ruminococcus 1, Marvinbryantia, Lactobacillus, and Parabacteroides played an important role in LEfSe analysis. The genera Ruminococcaceae UCG 014, Odoribacter, and Intestinimonas affected the ε-polylysine groups (Figure 3H). Ten genera were upregulated, including Collinsella, Faecalibacterium, Ruminococcaceae, Butyricicoccus, Lachnospiraceae UCG-001, Intestinimonas, and Actinobacillus, while the other 13 genera were down-regulated, including Ileibacterium, Coriobacteriaceae UCG-002, Ruminococcus 1, Christensenellaceae R-7 group, Faecalibaculum, Bifidobacterium, Roseburia, Rikenellaceae RC9 gut group, Marvinbryantia, Alistipes, Parabacteroides, Lactobacillus, and Tyzzerella 4 (Figure 3I and Supplementary Data 5).
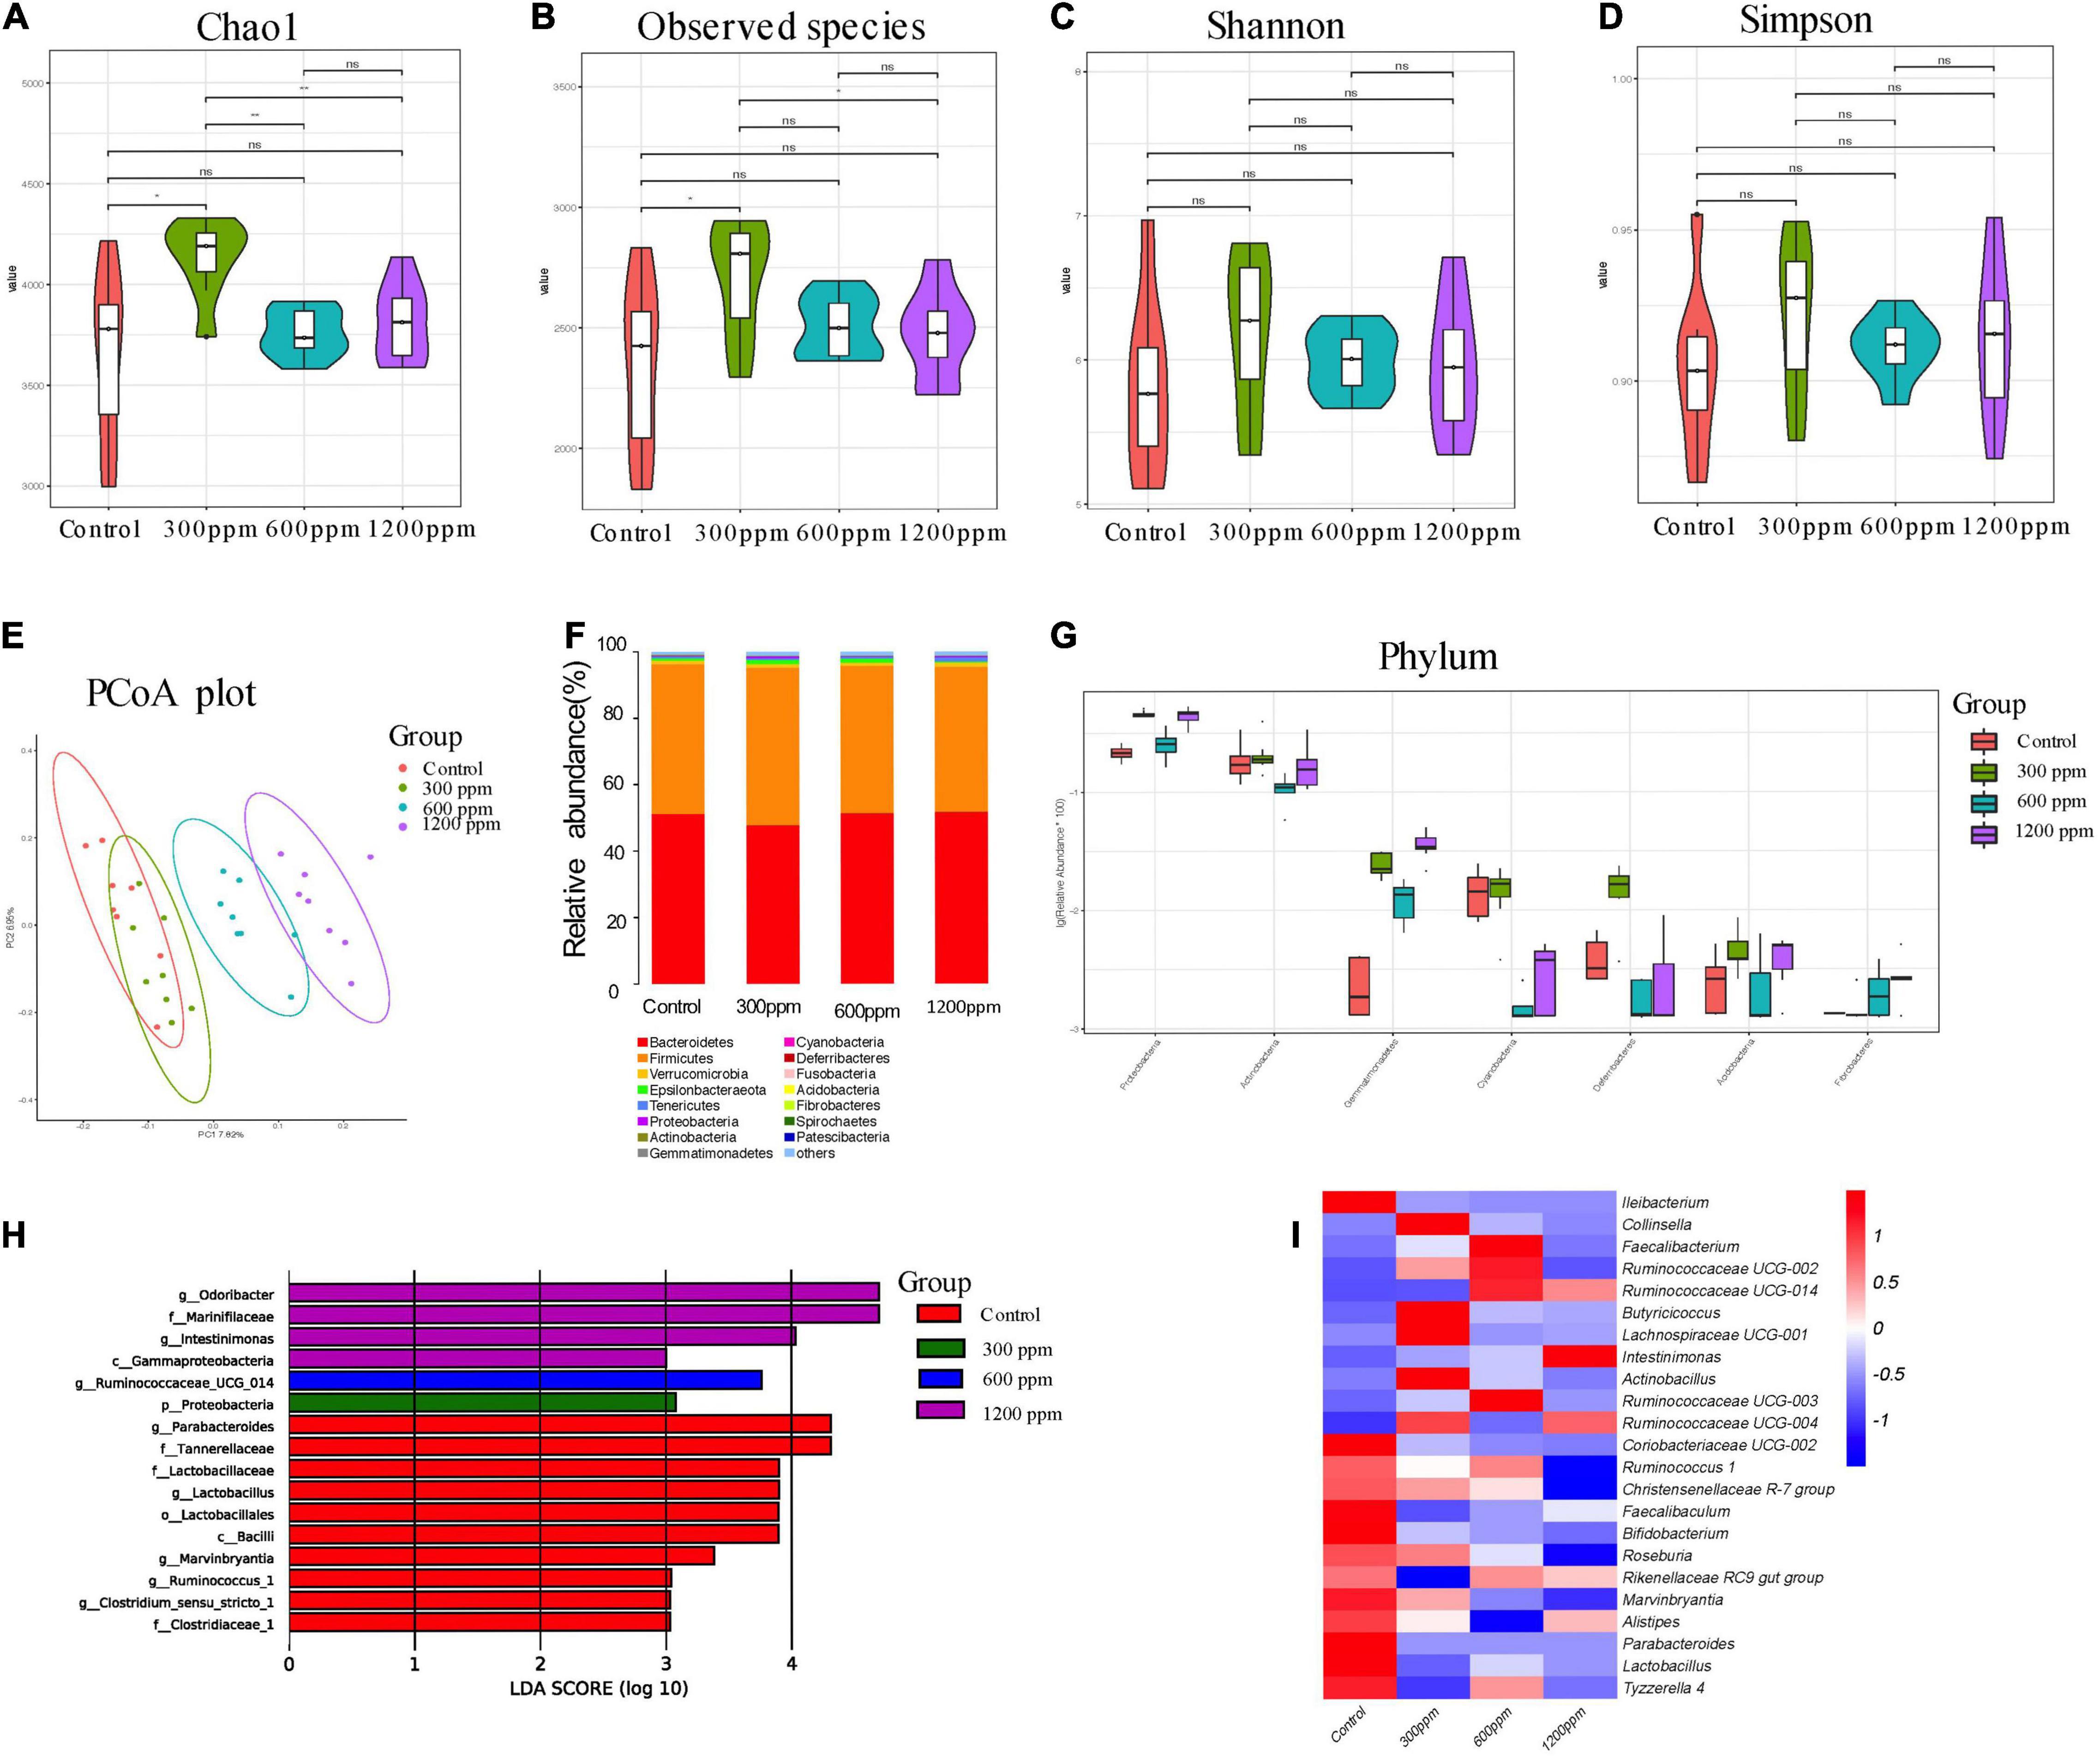
Figure 3. Shifts in the fecal bacterial composition of C57 mice at 6 weeks. (A) Bacterial alpha diversity determined by Chao1 index. (B) Bacterial alpha diversity determined by Observed species index. (C) Bacterial alpha diversity determined by Shannon index. (D) Bacterial alpha diversity determined by Simpson index. (E) PCoA was performed at the operational taxonomic unit (OTU) level based on Bray–Curtis metrics for all samples at different time. (F) Comparison of the relative abundance of top 15 phyla. (G) The different phylum compositions of the experimental group. (H) LefSe results from the fecal microbiota indicating genera significantly associated with the control and ε-polylysine group samples. (I) Heat map and hierarchical clustering of differentially abundant gut bacterial at genus level.
We found 59,729, 67,909, 70,719, and 74,870 valid tags for the four groups, which accounted for 79.89, 89.97, 84.83, and 87.36% of raw sequences, respectively (Supplementary Data 1). Taxonomic analysis revealed a total of 23 phyla, 54 classes, 132 orders, 225 families, 417 genera, and 127 species. As shown in Figure 4, the alpha diversity, including Chao1 index, observed species index, Shannon index, and Simpson index did not differ between the groups (Figures 4A–D). The PC1 accounted for 20.81% and PC2 accounted for 7.72%, as observed using PCoA analysis (Figure 4E). The abundance of the phylum Bacteroidetes was significantly decreased by ε-polylysine, and the abundance of phylum Firmicutes was significantly increased by ε-polylysine (P < 0.05), which was opposite to those at 4 weeks (Figure 4F). In addition, we identified six different phyla among the groups, and the abundance of Proteobacteria, Bacteroidetes, and Patescibacteria were down-regulated by ε-polylysine (Figure 4G and Supplementary Data 6). Sixty-four different genera were identified by Wilcoxon text analysis (Supplementary Data 7). After LEfSe analysis, the genera Alistipes, Parabacteroides, and Edaphobacter played an important role in the control group, and the genus Lachnospiraceae NK4B4 group had an effect in 300 ppm group (Figure 4H). In addition, the Rikenellaceae RC9 gut group and Intestinimonas had effects at 600 ppm, and the genera Odoribacter, Blautia, Ruminococcaceae UCG-014, and Holdemania had effects in the 1,200 ppm group (Figure 4H). Furthermore, the results showed several upregulated genera, including Allobaculum, Prevotellaceae UCG-003, Prevotella 1, Lachnospiraceae UCG-010, Parasutterella, Ruminococcus 1, Ruminococcaceae, Christensenellaceae R-7 group, Holdemania, Anaerostipes, Odoribacter, Lachnospiraceae NK4B4 group, Intestinimonas and Blautia, and six down-regulated genera, including Ileibacterium, Ruminococcus 2, Lachnospiraceae UCG-001, Alistipes, Parabacteroides, and Streptomyces (Figure 4I and Supplementary Data 7). We investigated the functional profiles of microbiota by PICRUSt analysis, the relative abundances of genes involved in the metabolism of lipids, carbohydrates, glycans, energy, amino acids, other amino acids, cofactors and vitamins, terpenoids and polyketides, and nucleotides (Figure 4J and Supplementary Data 8). Additionally, the results showed increases in the proportions of genera involved in genetic information processing and cellular processes (Supplementary Data 8).
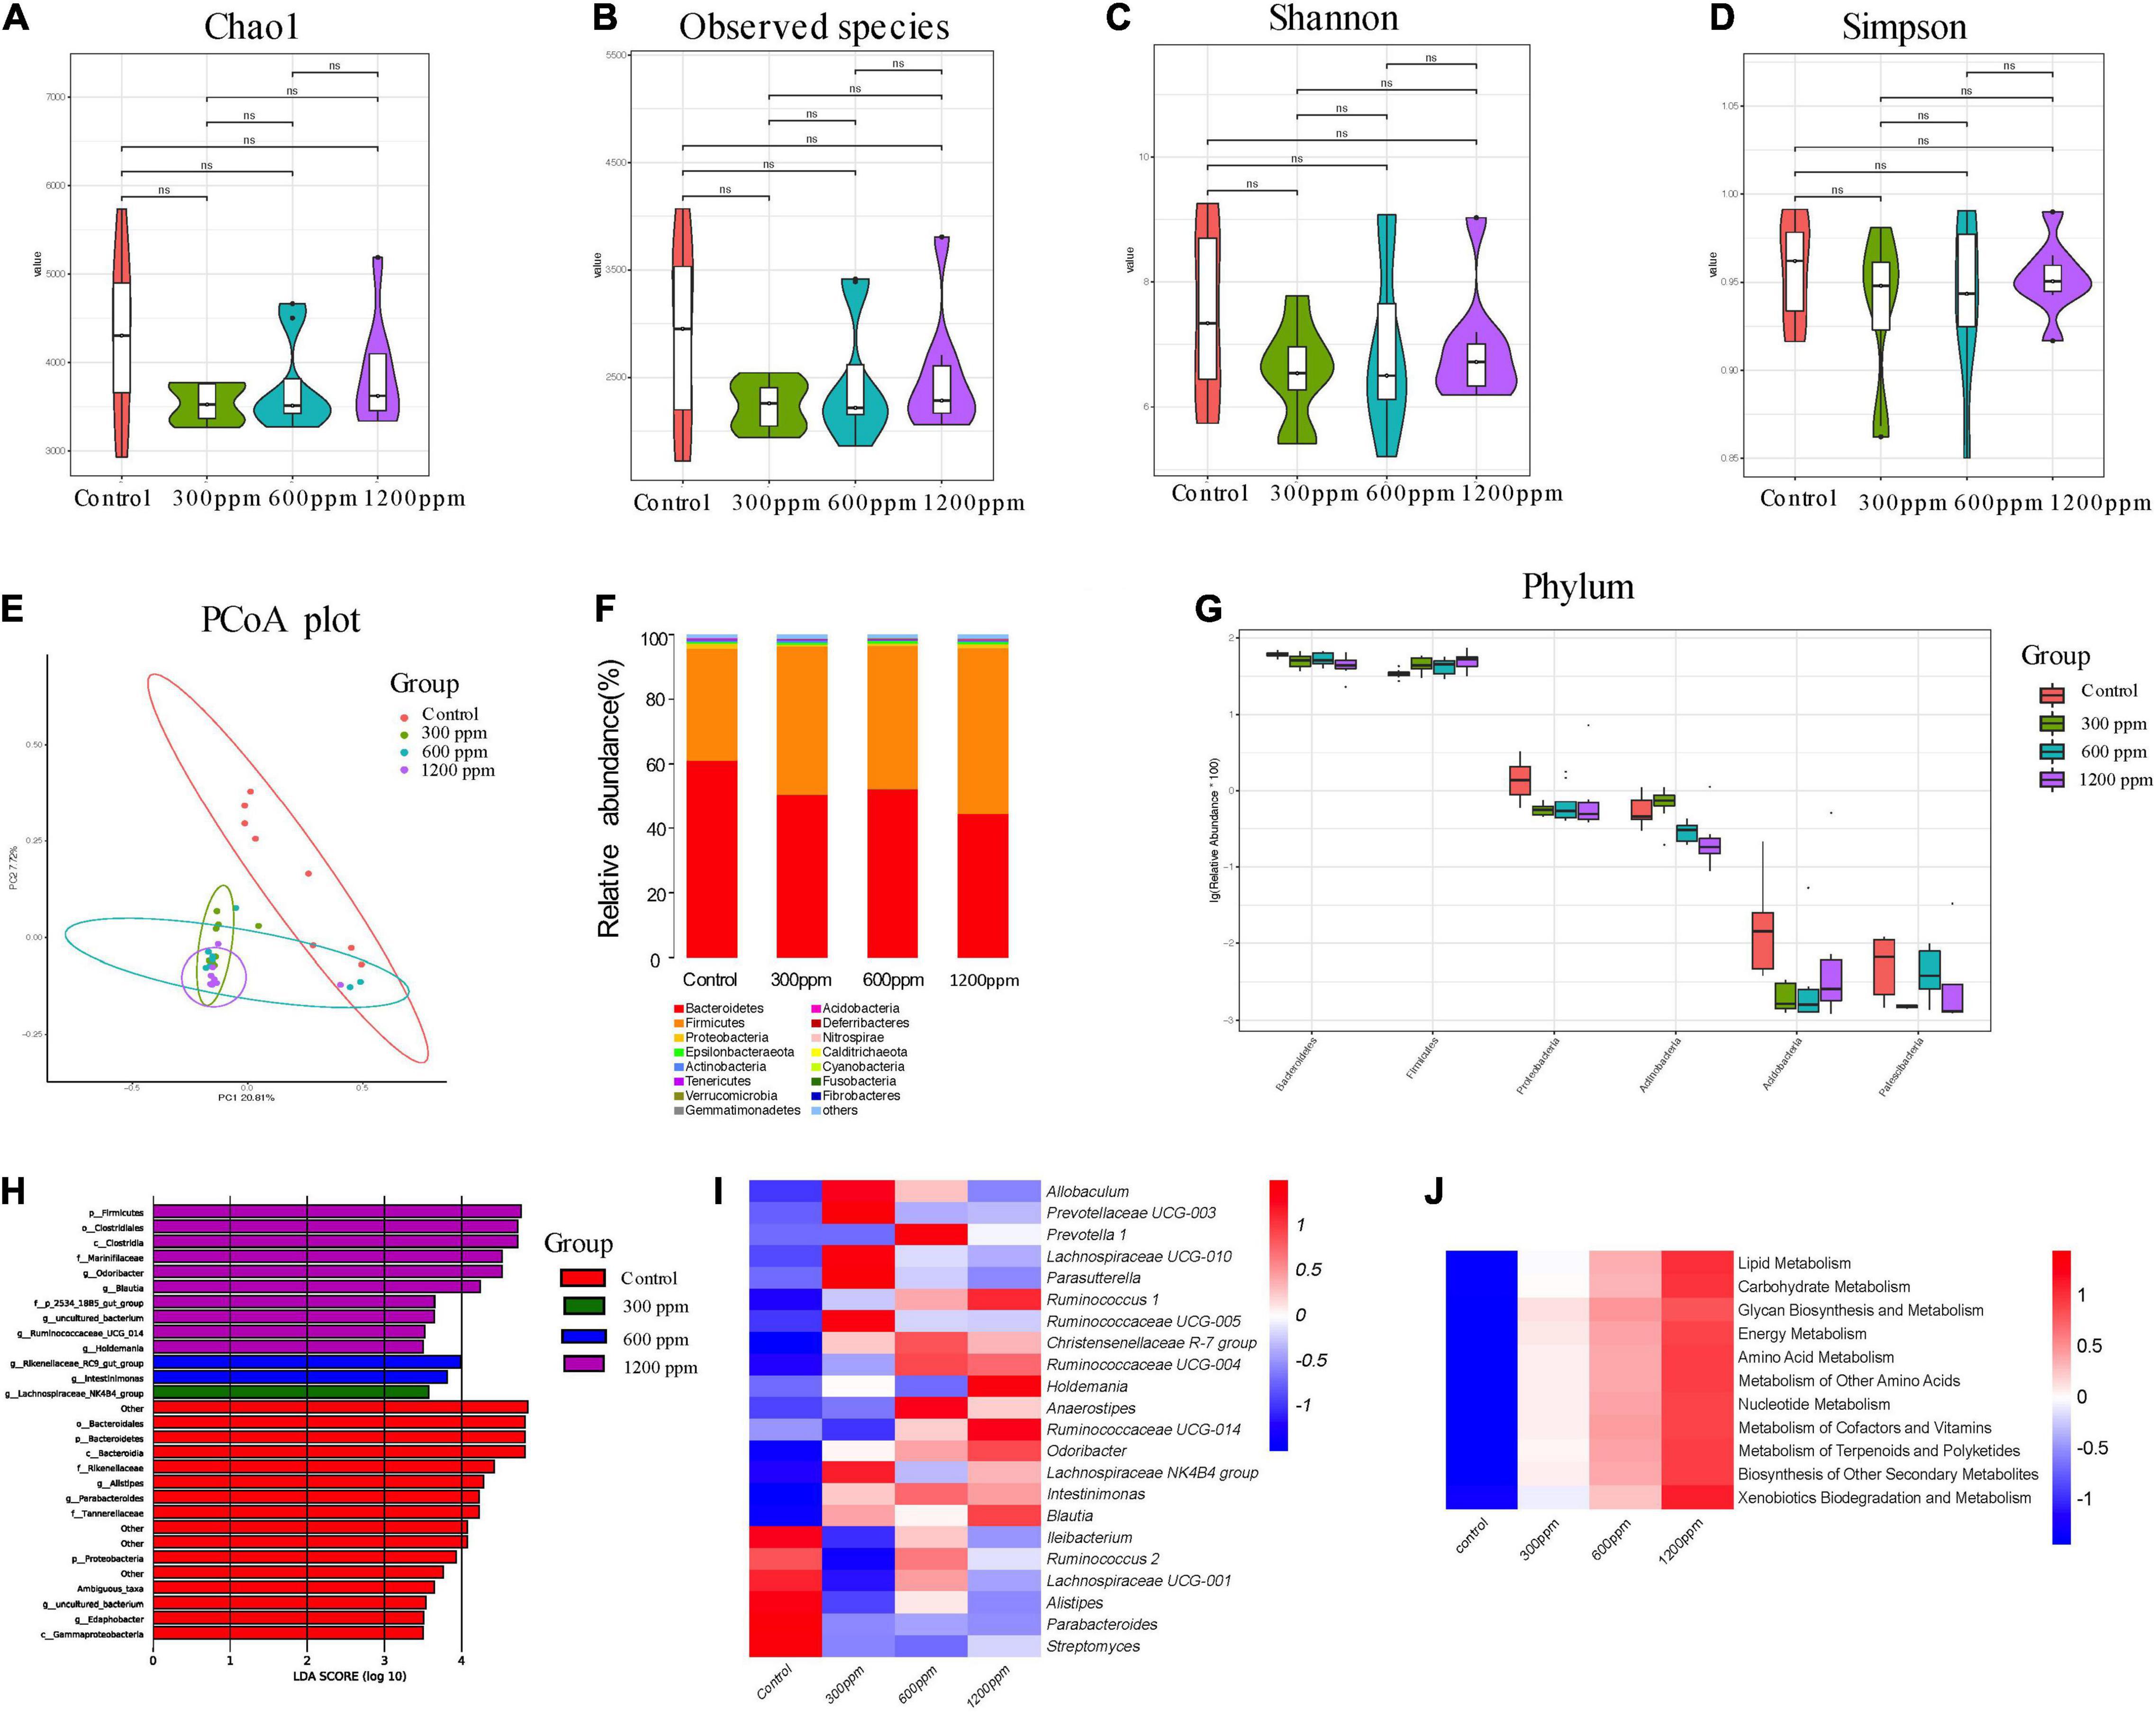
Figure 4. Shifts in the fecal bacterial composition of C57 mice at 10 weeks. (A) Bacterial alpha diversity determined by Chao1 index. (B) Bacterial alpha diversity determined by Observed species index. (C) Bacterial alpha diversity determined by Shannon index. (D) Bacterial alpha diversity determined by Simpson index. (E) PCoA was performed at the operational taxonomic unit (OTU) level based on Bray–Curtis metrics for all samples at different time. (F) Comparison of the relative abundance of top 15 phyla. (G) The different phylum compositions of the experimental group. (H) LefSe results from the fecal microbiota indicating genera significantly associated with the control and ε-polylysine group samples. (I) Heat map and hierarchical clustering of differentially abundant gut bacterial at genus level. (J) Heat map of KEGG pathway by PICRUSt analysis.
The metabolomics data of the plasma were shown in Figure 5. In 300 ppm group compared with the control group, PC1 accounted for 17% and PC2 accounted for 12.2% (Figure 5A). The PC1 accounted for 20.5% and the PC2 accounted for 12.2%, between 600 ppm and the control group (Figure 5C). PC1 accounted for 23.4%, and PC2 accounted for 14.4% compared to the 1,200 ppm group compared to the control group (Figure 5E). The results of orthogonal partial least-squares discriminant analysis (OPLS-DA) of the liver between the ε-polylysine groups and the control group were presented in Figures 5B,D,F. The abundance of glycerophospholipids was the highest among all the lipid subclasses (Figure 5G). The abundance of organooxygen compounds, fatty acids, and polyketide subclasses were increased by ε-polylysine, but other metabolites such as sphingolipids and glycerophospholipids were decreased by ε-polylysine (Figure 5G). We further examined the taxonomic composition of the glycerophospholipid metabolites and found that PC, PE, and LysoPC were domain metabolites among all groups. The abundance of PC, PE, lysoPC, LysoPE, 1-Arachidonoylglycerophosphoinositol, 1-(2-methoxy-eicosanyl)-sn-glycero-3-phosphoethanolamine, and OHOHA-PS were decreased by ε-polylysine (Figure 5H and Supplementary Data 9). The PC/PE radio of control group and ε-polylysine had no significant changes (Figure 5I). The different metabolites detail was shown in the Figure 6. Plasma metabolites were annotated and were highly enriched in the pathways belonging to “glycerophospholipids metabolism” and “biosynthesis of unsaturated fatty acids” compared to the control groups (Figures 5J–L).
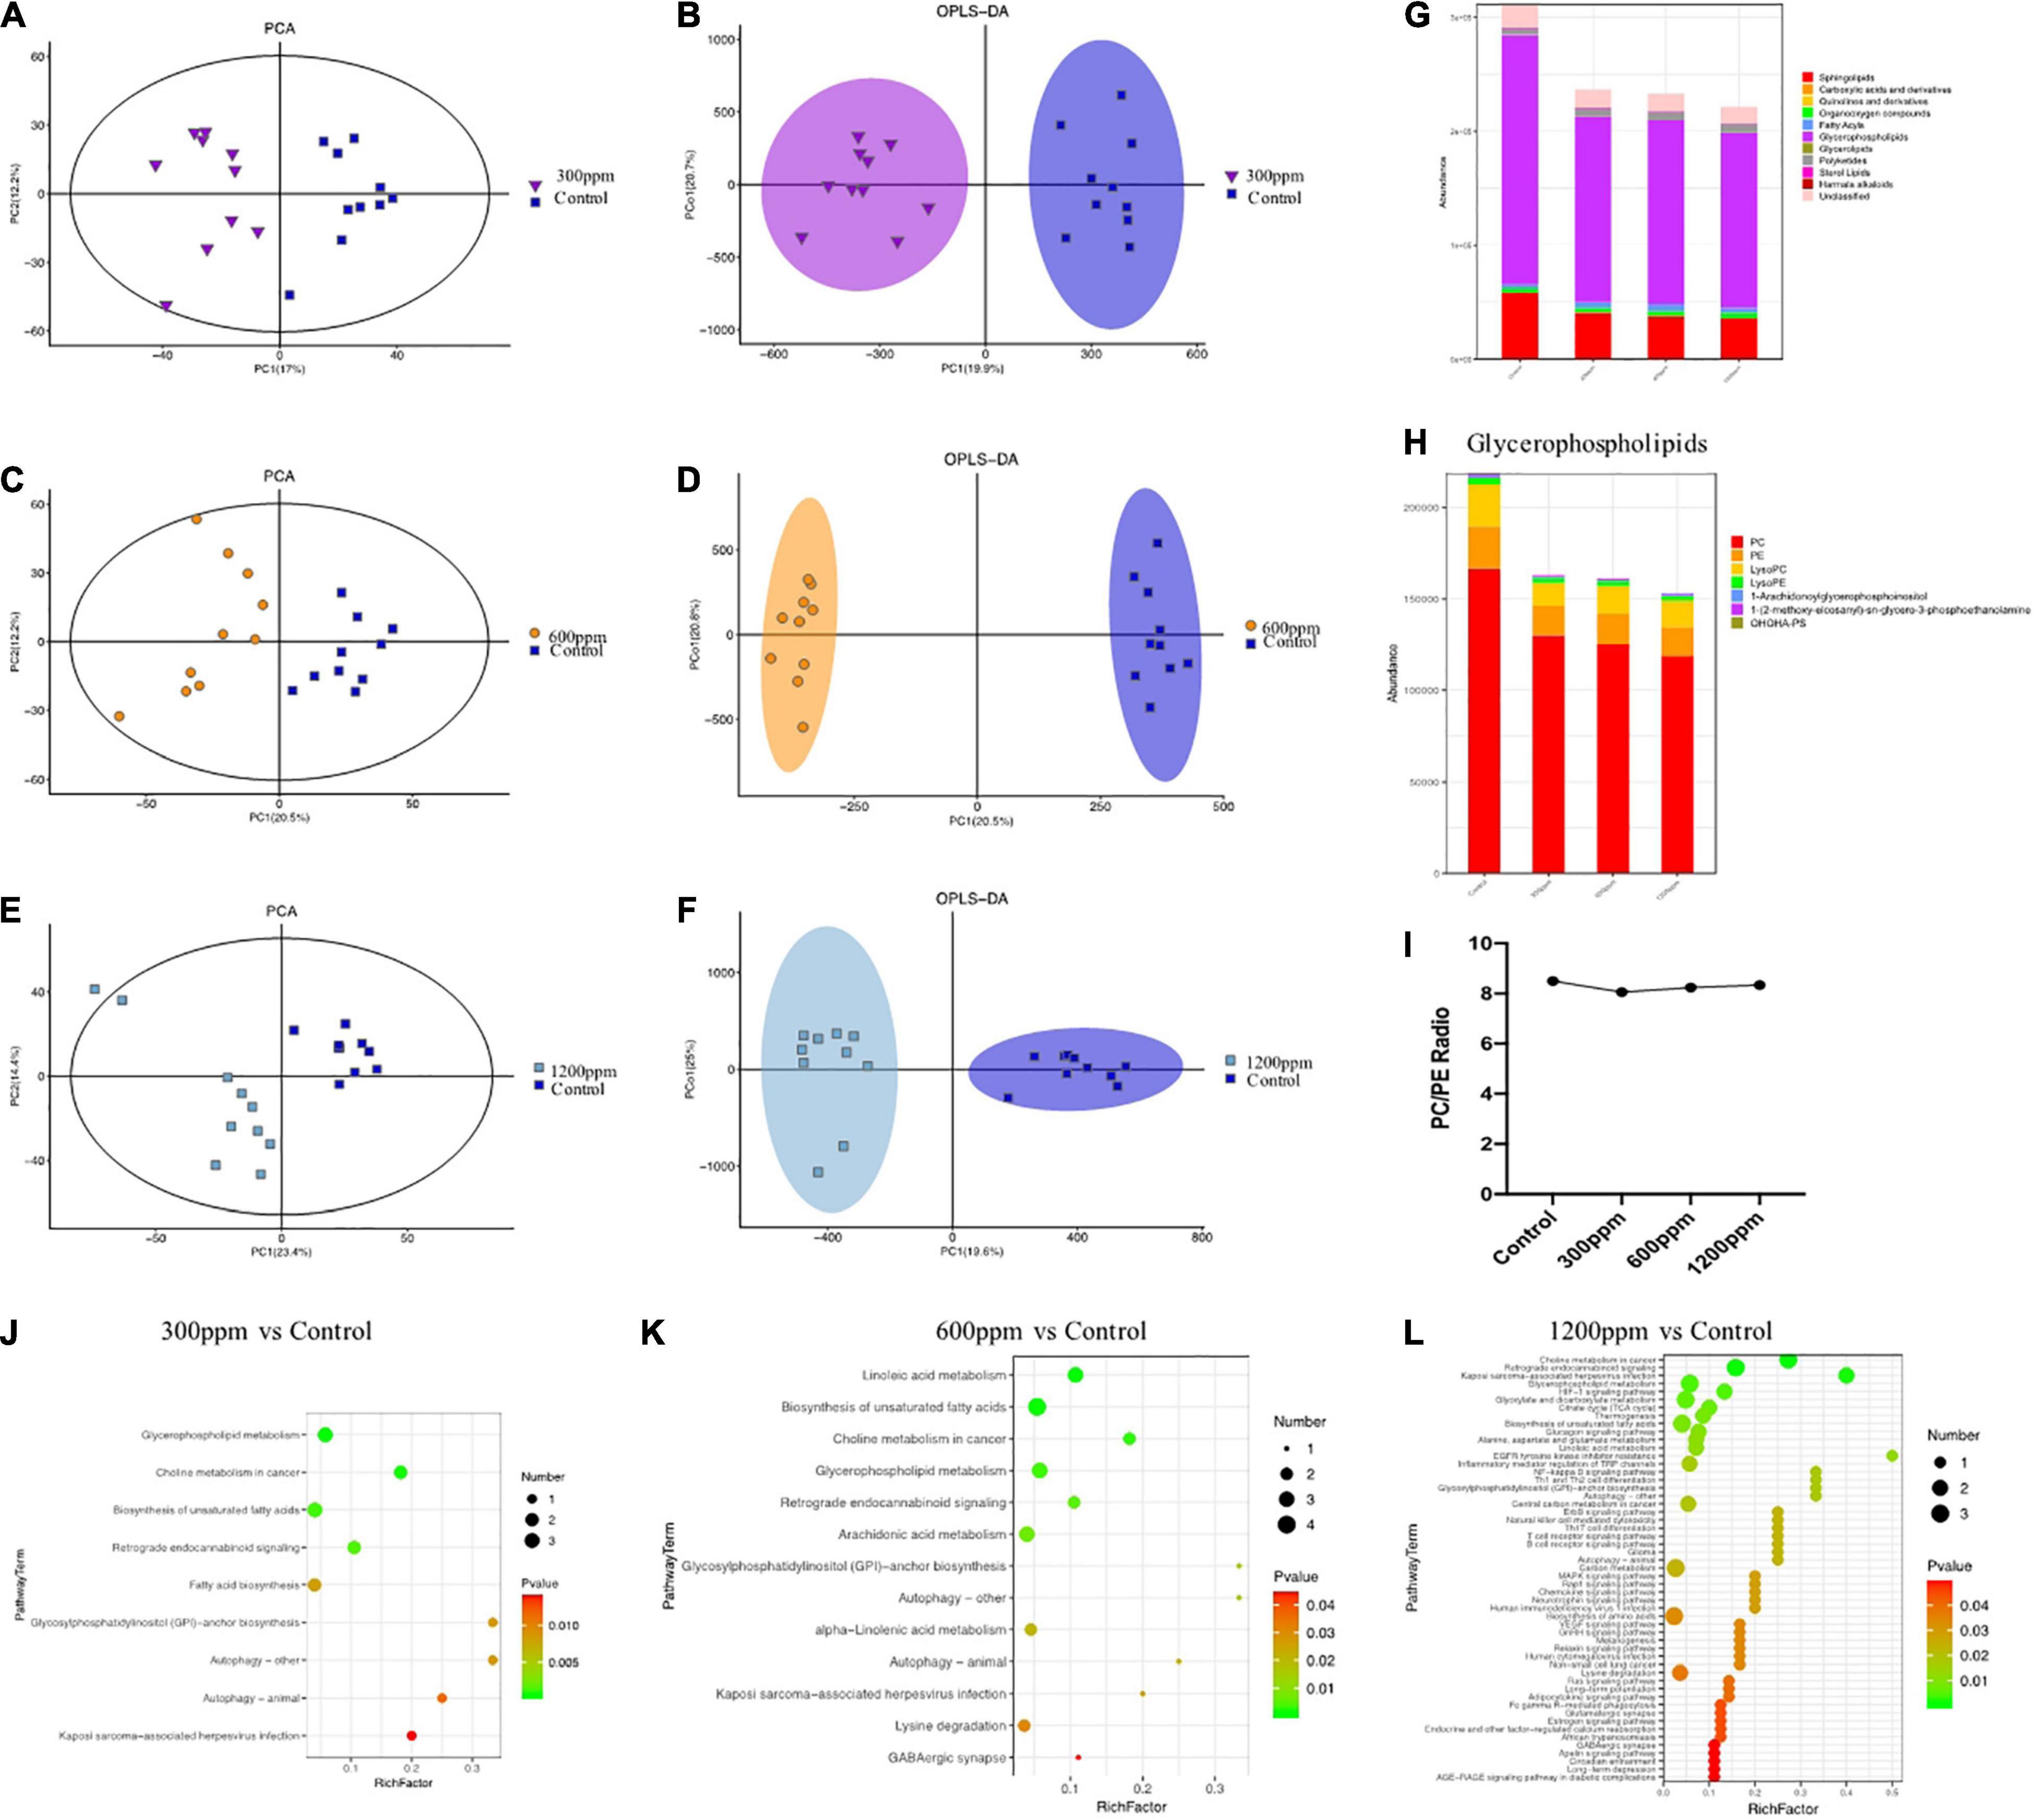
Figure 5. Metabolic patterns in the experiment groups. (A) PCA analysis between control group and 300 ppm group. (B) Clustering analysis of OPLS-DA in the control group and 300 ppm group. (C) PCA analysis between control group and 600 ppm group. (D) Clustering analysis of OPLS-DA in the control group and 600 ppm group. (E) PCA analysis between control group and 600 ppm group. (F) Clustering analysis of OPLS-DA in the control group and 600 ppm group. (G) Comparison of the abundance of major metabolite classifications. (H) Comparison of the abundance of Glycerophospholipids. (I) PC/PE radio. (J) The pathways in the control group and 300 ppm group. (K) The pathways in the control group and 600 ppm group. (L) The pathways in the control group and 1,200 ppm group.
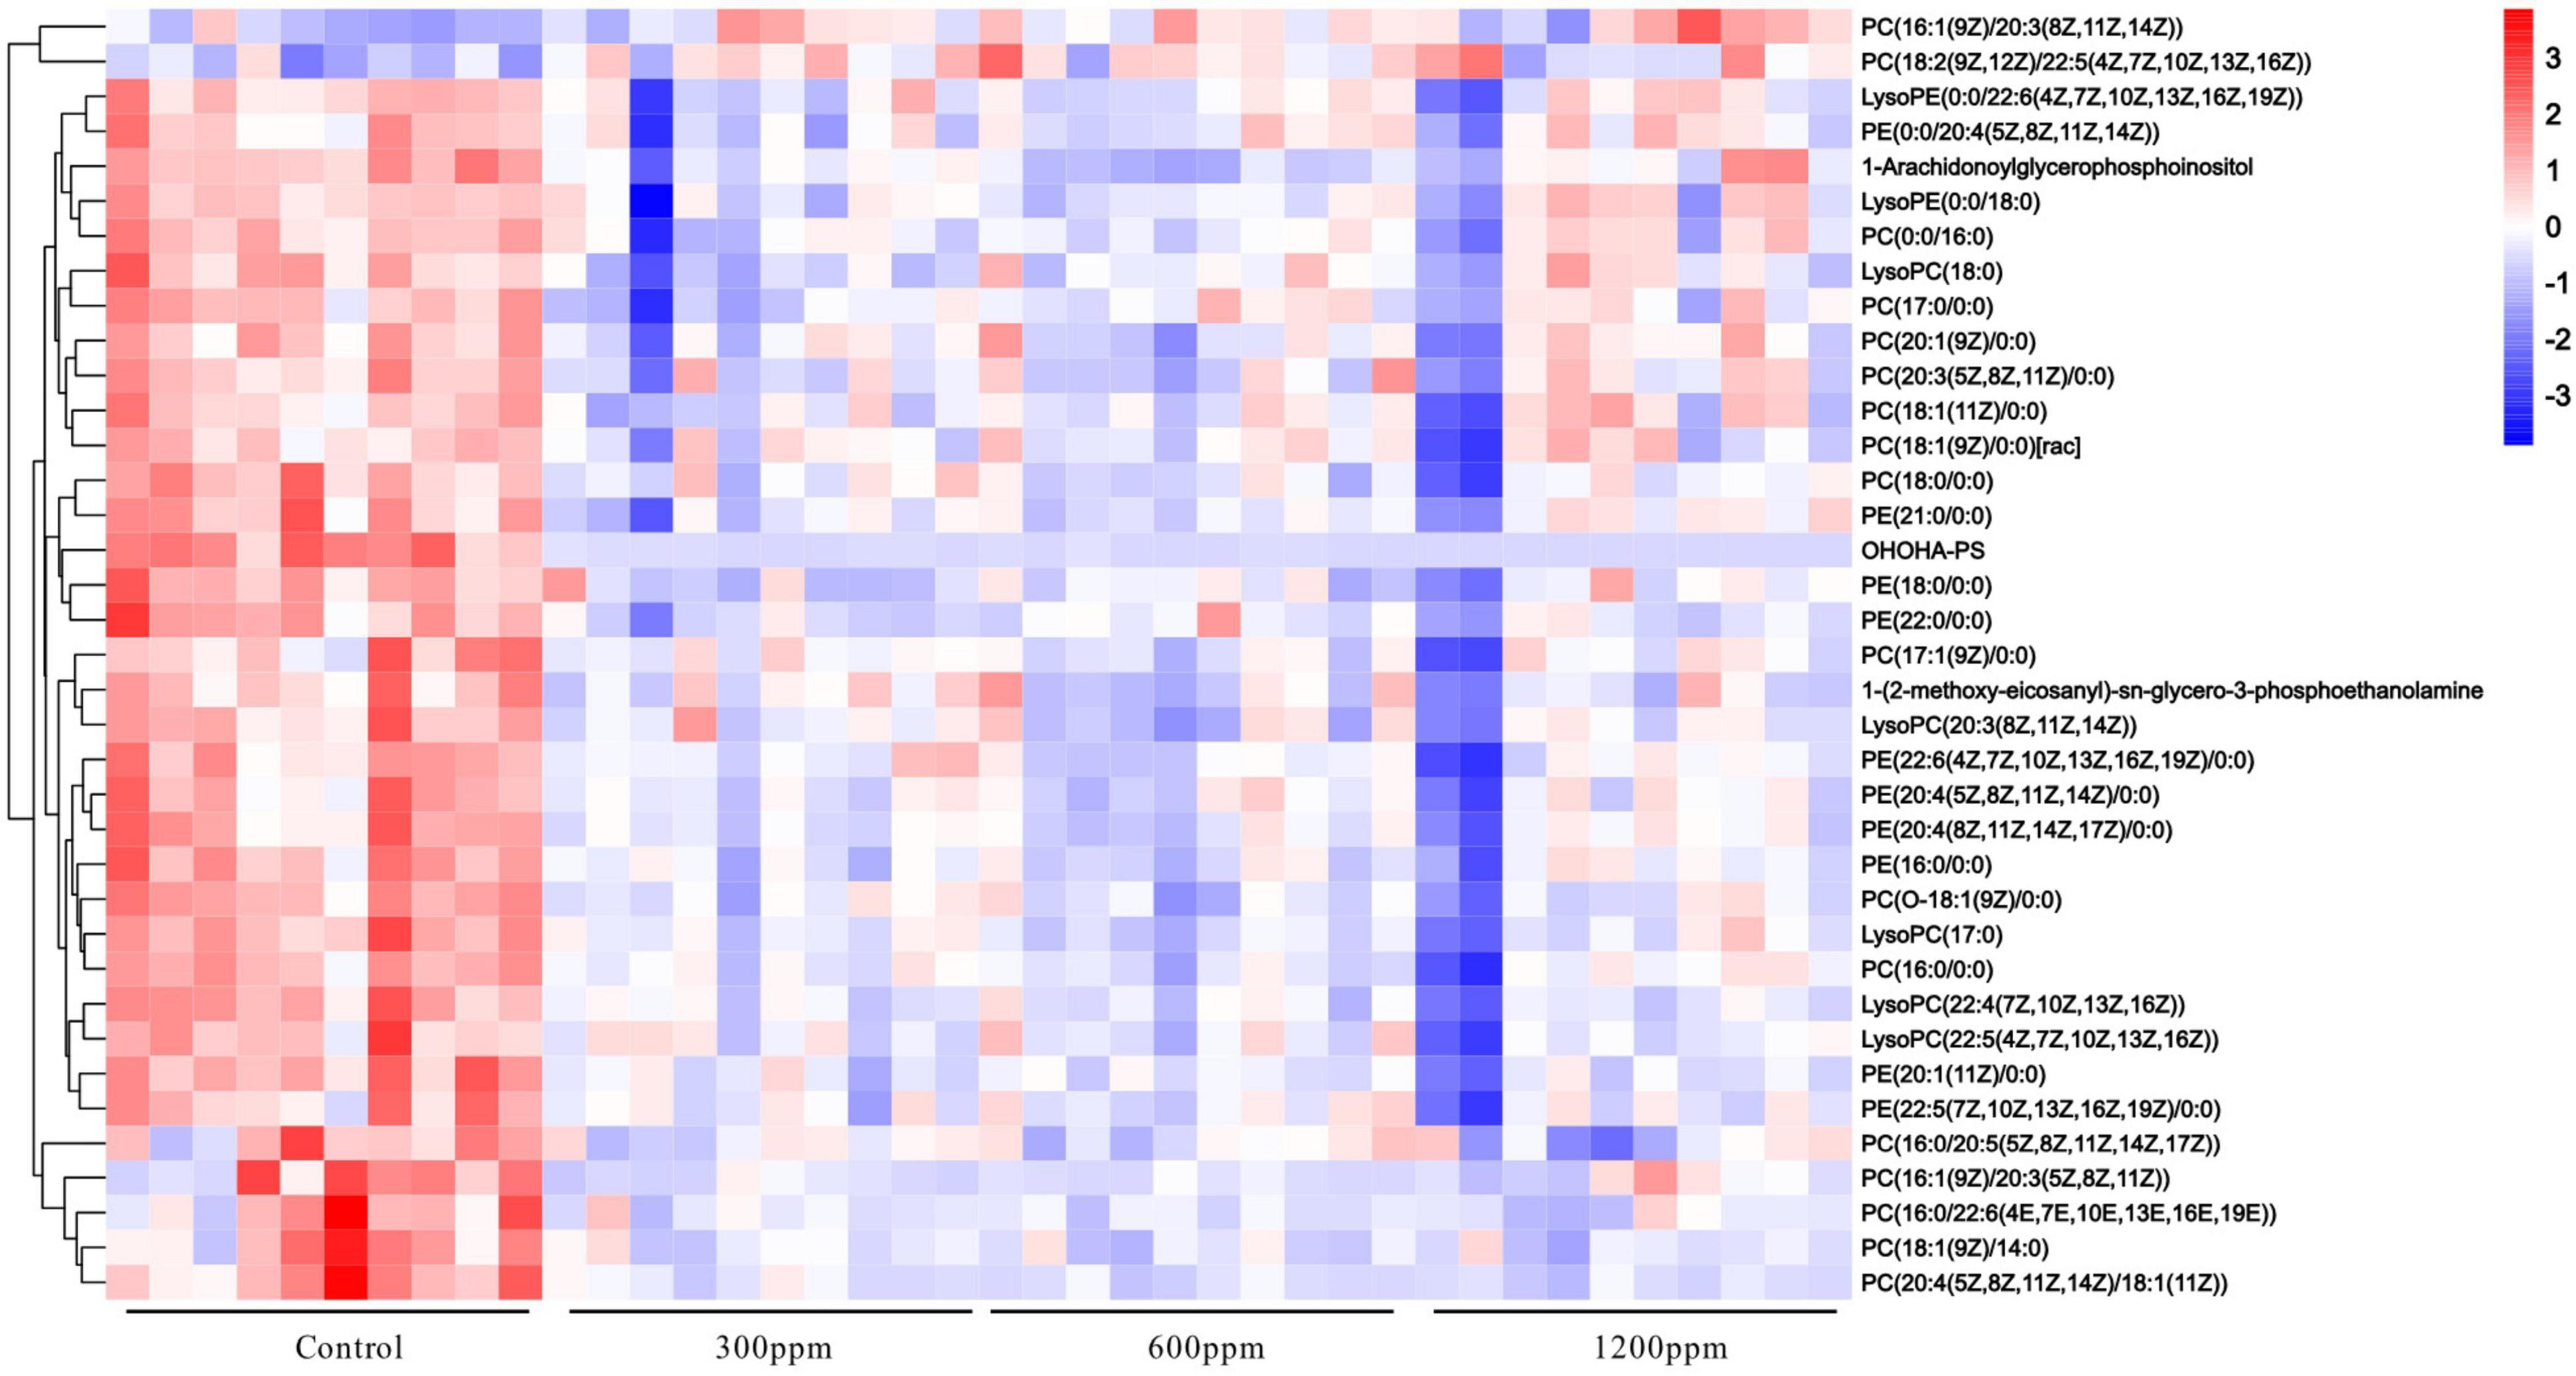
Figure 6. The heatmap of different metabolites.
We explored the association between fecal microbiota and the different metabolites shared by the plasma. Spearman correlation analysis showed that the metabolites containing PC(18:0/0:0), PC(0:0/16:0), PC[O-18:1(9Z)/0:0], PC[20:1(9Z)/0:0], LysoPC(18:0), and LysoPC[22:4(7Z,10Z,13Z,16Z)] were positively correlated with Alistipes (R > 0.6, P < 0.001), and PC(18:0/0:0), PC(17:0/0:0), LysoPC(18:0) were positively associated with Lachnospiraceae UCG-001 (R > 0.6, P < 0.001). In addition, PC[20:3(5Z,8Z,11Z)/0:0] was positively correlated with Streptomyces (R > 0.6, P < 0.001). The metabolites PC(18:0/0:0), PC(16:0/0:0), PC(0:0/16:0), PC[20:3(5Z,8Z,11Z)/0:0], PC(17:0/0:0), PC[O-18:1(9Z)/0:0], PC[20:1(9Z)/0:0], PC[20:4(5Z,8Z,11Z,14Z)/18:1(11Z)], LysoPC(18:0), LysoPC[20:3(8Z,11Z,14Z)], lysoPC [22:4(7Z,10Z,13Z,16Z)], and lysoPC (17:0) were negatively associated with Christensenellaceae R-7 group and Allobaculum, respectively (R < −0.6, P < 0.001). The metabolite PC(18:0/0:0), PC[O-18:1(9Z)/0:0], PC[20:1(9Z)/0:0], and LysoPC(18:0) were negatively correlated with changes in Blautia (R < −0.6, P < 0.001), and PC(16:0/0:0), PC[20:4(5Z,8Z,11Z,14Z)/18:1(11Z)], LysoPC(17:0), and LysoPC[22:4(7Z,10Z,13Z,16Z)] were negatively correlated with Ruminococcaceae UCG-004 (R < −0.6, P < 0.001). PC(O-18:1(9Z)/0:0), LysoPC(17:0), and LysoPC[22:4(7Z,10Z,13Z,16Z)] were negatively associated with changes in Odoribacter (R < −0.6, P < 0.001; Figure 7 and Supplementary Data 10).
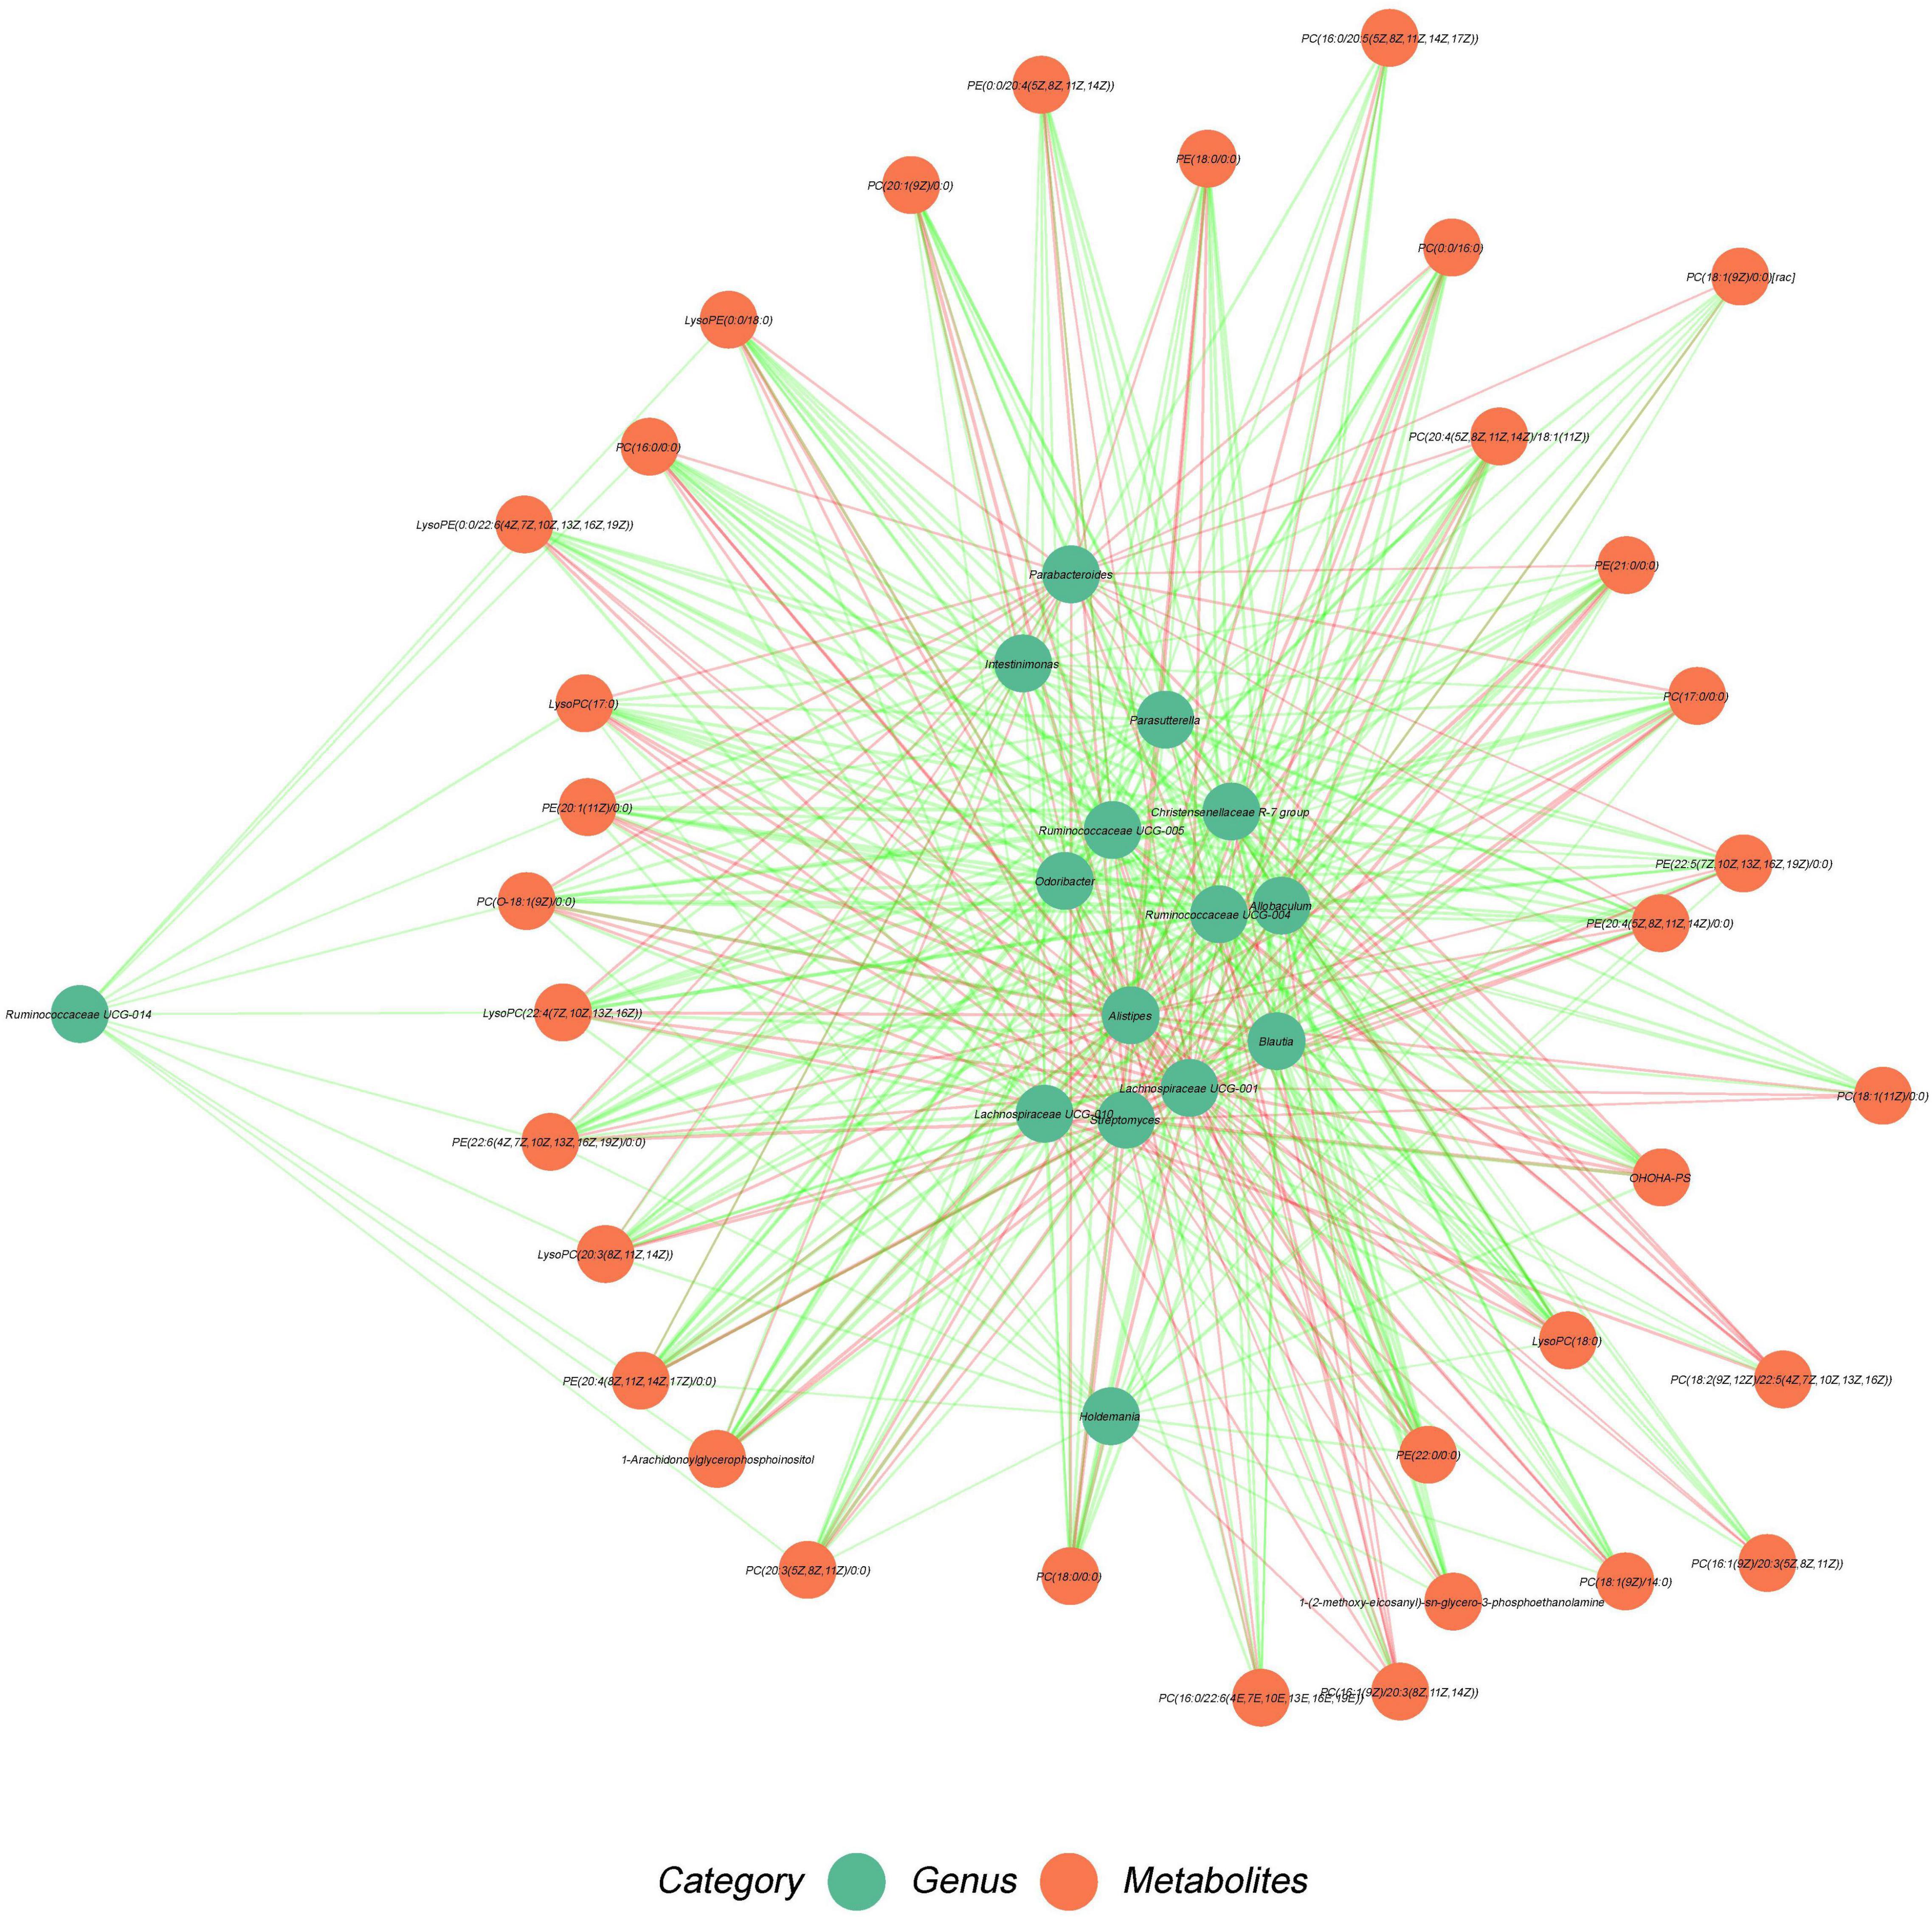
Figure 7. Association of fecal microbiome with liver metabolites. Green nodes represent metabolites and red nodes represent microbial genera. Red edges indicate positive correlations between metabolites and microbial genera. Spearman’s rank correlation coefficient > 0.5, P < 0.05. Green edges indicate negative correlation between metabolites and microbial genera. Spearman’s rank correlation coefficient < –0.5, P < 0.05.
The metabolites PE[20:4(5Z,8Z,11Z,14Z)/0:0], PE[20:4(8Z,11Z,14Z,17Z)/0:0], PE(22:0/0:0), and PE[22:6(4Z,7Z,10Z,13Z,16Z,19Z)/0:0] were positively associated with changes in Streptomyces (R > 0.6, P < 0.001). PE(21:0/0:0) was positively associated with changes in Alistipes and Lachnospiraceae UCG-001 (R > 0.6, P < 0.001). PE[20:1(11Z)/0:0] was positively correlated with that of Alistipes (R > 0.6, P < 0.001). However, the genera Christensenellaceae R-7 and Allobaculum were negatively correlated with PE[20:4(5Z,8Z,11Z,14Z)/0:0], PE[22:6(4Z,7Z,10Z,13Z,16Z,19Z)/0:0], PE(18:0/0:0), PE(21:0/0:0), LysoPE[0:0/22:6(4Z,7Z,10Z,13Z,16Z,19Z)], PE[20:4(8Z,11Z,14Z,17Z)/0:0], PE(22:0/0:0), and PE(20:1(11Z)/0:0) (R < −0.6, P < 0.001). The change in Blautia was negatively associated with PE(18:0/0:0) and PE(21:0/0:0) (R < −0.6, P < 0.001), and the change in Ruminococcaceae was negatively correlated with PE(21:0/0:0), PE(22:0/0:0), and PE[20:1(11Z)/0:0] (R < −0.6, P < 0.001). Moreover, the metabolites containing PE[22:6(4Z,7Z,10Z,13Z,16Z,19Z)/0:0] and PE[20:4(8Z,11Z,14Z,17Z)/0:0] were negatively associated with Odoribacter, Parasutterella, and Lachnospiraceae UCG-010 (R < −0.6, P < 0.001). PE(21:0/0:0) and LysoPE[0:0/22:6(4Z,7Z,10Z,13Z,16Z,19Z)] were correlated with changes in Lachnospiraceae UCG-010 (R < −0.6, P < 0.001). LysoPE(0:0/18:0) was negatively associated with Allobaculum (R < −0.6, P < 0.001), and LysoPE[0:0/22:6(4Z,7Z,10Z,13Z,16Z,19Z)] was negatively correlated with Parasutterella (R < −0.6, P < 0.001; Figure 6 and Supplementary Data 10).
Furthermore, 1-Arachidonoylglycerophosphoinositol was positively correlated with Alistipes and Streptomyces (R > 0.6, P < 0.001), but negatively correlated with Christensenellaceae R-7 group, Ruminococcaceae UCG-004, and Allobaculum (R < −0.6, P < 0.001). OHOHA-PS was positively associated with Alistipes, Lachnospiraceae UCG-001, and Streptomyces (R > 0.6, P < 0.001), whereas OHOHA-PS was negatively associated with Odoribacter, Ruminococcaceae UCG-005, Christensenellaceae R-7 group, Ruminococcaceae UCG-004, Allobaculum, and Lachnospiraceae UCG-010 (R < −0.6, P < 0.001). 1-(2-methoxy-eicosanyl)-sn-glycero-3-phosphoethanolamine was negatively correlated with changes in the Christensenellaceae R-7 group (R < −0.6, P < 0.001). Other low correlation results (R > −0.6 or R < 0.6) were shown in Figure 6 and Supplementary Data 10.
To test our hypothesis that the modification of plasma metabolites by ε-polylysine was related to the gut microbiota, we conducted breeding experiments on C57 mice. Weight loss was observed during the growth period, upon treatment with ε-polylysine, which may be attributable to the effects of lysine decomposition from ε-polylysine on animal metabolism rarely (28). Combined with ε-polylysine changes in the intestinal morphology of mice, which may be due to the influence of gut microbiota by ε-polylysine, or the regulation of glycerophospholipid metabolism to affect intestinal epithelial cells. Therefore, we investigated the regulatory effects of ε-polylysine on the intestinal microbiota and metabolites. ε-Polylysine changed the gut microbiota structure in this study, similar to a previous study (18, 19). The abundance of Firmicutes and Bacteroidetes were the predominant phyla in the gut microbiota during the experimental period, which was consistent with previous research results (29–31). Some symbiotic Actinobacterial species are probiotics, which can control bacterial diseases in livestock, poultry, and aquaculture by converting the feed stuffs into microbial biomass and fermentation end products for animal hosts (32). Actinobacteria may produce vitamin B12 (33) and some water-soluble vitamins (32). Phylum Actinobacteria played a role in gastrointestinal and systemic diseases and showed potential therapeutic effects (34). In this study, the abundance of the phylum Actinobacteria increased as the mice grew, while the abundance of Proteobacteria was increased at 4 and 6 weeks and decreased at 10 weeks, which resulted in the establishment of a mutualistic relationship with the host, and the abundance of Proteobacteria was increased in intestinal diseases and identified as a possible microbial signature of disease (35).
ε-Polylysine improved the relative abundance of beneficial bacteria and immunity in mice. At 4 weeks, ε-polylysine enhanced the abundance of probiotics such as Faecalibaculum (36), Bifidobacterium (37), and Coriobacteriaceae UCG-002 (38). The relative abundance of Faecalibacterium, Butyricicoccus, and Lachnospiraceae NK4B4 group were increased, but that of Coriobacteriaceae UCG-002, Faecalibaculum, and Bifidobacterium were decreased, indicating that the beneficial bacteria had complex regulation by ε-polylysine during the middle growing and adult periods of mice. Furthermore, ε-polylysine inhibited the abundance of potential biomarkers associated with diseases, including Ruminococcus, Prevotella 2 (39), Prevotellaceae, Prevotellaceae NK3B31 group, Butyricimonas (40), Coprococcus 2 (41), Tyzzerella 4 (42), Escherichia-Shigella (43), and Subdoligranulum (44). In addition, ε-polylysine decreased the abundance of the genus Robinsoniella separated from feces from premature infants (45), indicating that ε-polylysine may be a potential food additive for baby food. Moreover, ε-polylysine played an important role in the production of short-chain fatty acids (SCFAs), and high levels of SCFAs could inhibit inflammation, which was associated with an increased abundance of the genera Ruminococcaceae (46), Collinsella (47), Blautia, Allobaculum, Alistipes, Prevotella, Bacterioides, and Butyricimonas (48–50).
Importantly, ε-polylysine regulated lipid metabolism and reduced the likelihood of obesity and obesity-related diseases, which had important implications for animal health by regulating the relevant intestinal flora in C57 mice. During the post-weaning period of C57 mice, ε-polylysine restrained the abundance of the genera Rikenellaceae RC9 gut group and Ruminococcaceae, both of which were increased in obesity induced by a high-fat diet in rats, which indicated that ε-polylysine might regulate lipid metabolism and reduce the risk of obesity (50, 51). In addition, ε-polylysine downregulated the obesity-regulating genera Collinsella, Negativibacillus, and Anaerotruncus as well (52, 53). On the other hand, the abundance of Parabacteroides (54), Odoribacter (55), and Alistipes (56) were increased by ε-polylysine, a genus that played a positive regulatory role in lipid metabolism, and its content was negatively correlated with obesity and other diseases associated with fat metabolism. Akkermansia muciniphila can reduce the levels of relevant blood markers of inflammation and improve metabolic parameters (57, 58). In our study, the abundance of genus Akkermansia was increased by ε-polylysine, which showed a positive association with host metabolic health. The abundance of the genera Akkermansia, Oscillibacter, Intestinimonas, and Alistipes was significantly reduced in human fat (59), which contradicts the results of our study demonstrate. At 6 weeks, the middle growing period, the genera Intestinimonas, Collinsella, Ruminococcaceae, and Lachnospiraceae UCG-001 (60–62) were upregulated, which might be associated with weight loss from 5 to 7 weeks, and could also maintain the gut health of mice. In addition, ε-polylysine decreased the abundance of Parabacteroides, Alistipes, Rikenellaceae RC9 gut group, Lactobacillus, Roseburia, and Marvinbryantia. These results showed that lipid metabolism was regulated much more than in the post-weaning period, by ε-polylysine. In the adult period of mice, the genera Allobaculum, Lachnospiraceae UCG-010 (57), Parasutterella (63), Ruminococcaceae, Odoribacter, Blautia, Holdemania (64), and Intestinimonas were induced by ε-polylysine, which positively correlated with lipid metabolism. However, ε-polylysine reduced the genera Lachnospiraceae UCG-001, Alistipes, and Parabacteroides. The intestinal microbiota structure grew richer and more complex with age. Due to the regulation of ε-polylysine on gut microbiota, we evaluated further combinations of plasma metabolomics and correlation analyses.
PC and PE are the most abundant phospholipids in mammalian cell membranes, of which small alterations may have a large effect on parameters associated with metabolic syndrome, such as lipid profile, obesity, insulin resistance (65). Furthermore, the changes in PC and/or PE content in various tissues are associated with metabolic disorders disease like atherosclerosis, steatohepatitis, non-alcoholic fatty liver disease (66–68). Through statistical analysis, we found that levels of phospholipids: PCs, lysoPCs, PEs, LysoPEs, 1-Arachidonoylglycerophosphoinositol, 1-(2-methoxy-eicosanyl)-sn-glycero-3-phosphoethanolamine, and OHOHA-PS were decreased, whereas only those of PC[18:2(9Z,12Z)/22:5(4Z,7Z,10Z,13Z,16Z)] and PC[16:1(9Z)/20:3(8Z,11Z,14Z)] were increased, suggesting that phospholipid metabolism was affected by ε-polylysine, which corresponded to the upregulation of lipid metabolism predicted by PICRUSt of intestinal microbiota. It is well known that PCs are supplied by diet or synthesized in the liver via the Pemt pathway. PE converted to PC via sequential methylation reactions in the Pemt pathway (65). In this study, the level of PCs, PEs, and its decomposition products LysoPCs, LysoPEs of total glycerophospholipid were deduced compared ε-polylysine groups to control group, which was in accordance with changes in the Pemt pathway. Furthermore, changes in PC/PE radio were more concerned than changes in absolute concentrations of PC and PE. The cellular PC/PE molar ratio affects energy metabolism, and the importance of phospholipid metabolism in regulating lipid, lipoprotein, and whole-body energy metabolism (65). When he Lpcyt1a–/– mice fed with a high-fat diet, the PC levels and PC/PE radio decreased, and eventually LPcyt1a–/– mice developed non-alcoholic fatty liver disease (NAFLD). In LPcyt1a–/– and Pemt–/– mouse models, the severity of NAFLD was inversely correlated with the hepatic PC/PE ratio (69, 70). Interesting, the PC and PE level decreased and the PC/PE radio was minimally affected by ε-polylysine in our study, which showed ε-polylysine as a food addictive had no negatively effects on the lipid metabolism.
The presence of gut microbes significantly elevated PC levels in the colon and significantly decreased PE levels in the ileum from GF and SPF mice (71). Moreover, fuzhuan brick tea ameliorated high-fat-diet-induced abnormal glycerophospholipid metabolism by increasing serum levels of PCs, LysoPCs, and PC/PE radio, which in a gut microbiota dependent manner (72). In the study of tumor, the gene Alistipes interfered glycerophospholipid metabolism, and it was negatively correlated with the level of PE and PC (73), which was contrary to our experimental results. The direct correlation study between gut microbes and metabolites in the glycerophospholipid metabolic pathway is rare, and indirect correlation studies have shown an important role in nutritional metabolic syndrome or health diseases (9, 74). This experiment required further research and verification on the correspond metabolism mechanism of glycerophospholipid with the microbiota directly.
In conclusion, the abundance of glycerophospholipid metabolites, including PC, PE, lysoPC, and lysoPE, was decreased by ε-polylysine. the genera Alistipes, Lachnospiraceae UCG-001, and Streptomyces were positively associated with PC, PE, LysoPC, LysoPE, 1-Arachidonoylglycerophosphoinositol and OHOHA-PS, but changes in Blautia, Christensenellaceae R-7 group, Odoribacter, Allobaculum, Ruminococcaceae UCG-004, Ruminococcaceae UCG-005, and Lachnospiraceae UCG-010 were negatively correlated with glycerophospholipid metabolites. The findings of our study demonstrated that ε-polylysine affected phospholipid metabolism, which was related to the effects of gut microbiota on C57 mice.
The original contributions presented in the study are publicly available. This data can be found here: https://www.ncbi.nlm.nih.gov/bioproject/, PRJNA752496. https://www.ebi.ac.uk/metabolights/, MTBLS4270.
The animal study was reviewed and approved by Scientific Ethics Committee of Huazhong Agricultural University (approval number: HZAUMO-2019-059).
DW, XY, QD, and XZ designed the research. XZ, ZH, CX, and YN conducted the research. XZ and BX analyzed the data. XZ wrote the manuscript. All authors read and approved the final version of the manuscript.
This project was supported by Central Public-Interest Scientific Institution Research Fund (1610242021001).
The authors declare that the research was conducted in the absence of any commercial or financial relationships that could be construed as a potential conflict of interest.
All claims expressed in this article are solely those of the authors and do not necessarily represent those of their affiliated organizations, or those of the publisher, the editors and the reviewers. Any product that may be evaluated in this article, or claim that may be made by its manufacturer, is not guaranteed or endorsed by the publisher.
We thank all present and past members of the Wu Laboratory and Yan Laboratory who contributed comments and ideas.
The Supplementary Material for this article can be found online at: https://www.frontiersin.org/articles/10.3389/fnut.2022.842686/full#supplementary-material
1. Zheng P, Wu J, Zhang H, Perry SW, Yin B, Tan X, et al. The gut microbiome modulates gut-brain axis glycerophospholipid metabolism in a region-specific manner in a nonhuman primate model of depression. Mol Psychiat. (2020) 26:1–13. doi: 10.1038/s41380-020-0744-2
2. Kindt A, Liebisch G, Clavel T, Haller D, Hörmannsperger G, Yoon H, et al. The gut microbiota promotes hepatic fatty acid desaturation and elongation in mice. Nat Commun. (2018) 9:1–15. doi: 10.1038/s41467-018-05767-4
3. Li J, Wang X, Zhang T, Wang C, Huang Z, Luo X, et al. A review on phospholipids and their main applications in drug delivery systems. Asian J Pharmaceut Sci. (2015) 10:81–98. doi: 10.1016/j.ajps.2014.09.004
4. Lopez-Hernandez Y, Lara-Ramirez EE, Salgado-Bustamante M, Lopez JA, Oropeza-Valdez JJ, Jaime-Sanchez E, et al. Glycerophospholipid metabolism alterations in patients with type 2 diabetes mellitus and tuberculosis comorbidity. Arch Med Res. (2019) 50:71–8. doi: 10.1016/j.arcmed.2019.05.006
5. Gundermann KJ, Gundermann S, Drozdzik M, Mohan Prasad VG. Essential phospholipids in fatty liver: a scientific update. Clin Exp Gastroenterol. (2016) 9:105–17. doi: 10.2147/CEG.S96362
6. Liang W, Huang Y, Tan X, Wu J, Duan J, Zhang H, et al. Alterations of glycerophospholipid and fatty acyl metabolism in multiple brain regions of schizophrenia microbiota recipient mice. Neuropsychiatr Dis Treat. (2019) 15:3219–29. doi: 10.2147/NDT.S225982
7. Geiger O, Lopez-Lara IM, Sohlenkamp C. Phosphatidylcholine biosynthesis and function in bacteria. Biochim Biophys Acta. (2013) 1831:503–13. doi: 10.1016/j.bbalip.2012.08.009
8. Chen M, Huang H, Zhou P, Zhang J, Dai Y, Yang D, et al. Oral phosphatidylcholine improves intestinal barrier function in drug-induced liver injury in rats. Gastroenterol Res Pract. (2019) 2019:8723460. doi: 10.1155/2019/8723460
9. Liebisch G, Plagge J, Horing M, Seeliger C, Ecker J. The effect of gut microbiota on the intestinal lipidome of mice. Int J Med Microbiol. (2021) 311:151488.
10. Kindt A, Liebisch G, Clavel T, Haller D, Hormannsperger G, Yoon H, et al. The gut microbiota promotes hepatic fatty acid desaturation and elongation in mice. Nat Commun. (2018) 9:3760. doi: 10.1038/s41467-018-05767-4
11. Dodd A, Swanevelder D, Zhou N, Brady D, Hallsworth JE, Rumbold K. Streptomyces albulus yields epsilon-poly-L-lysine and other products from salt-contaminated glycerol waste. J Ind Microbiol Biotechnol. (2018) 45:1083–90. doi: 10.1007/s10295-018-2082-9
12. Geornaras I, Yoon Y, Belk K, Smith G, Sofos J. Antimicrobial activity of ε-polylysine against Escherichia coli O157: H7, Salmonella typhimurium, and Listeria monocytogenes in various food extracts. J Food Sci. (2007) 72:M330–4.
13. Shiru Jia BF, Dai Y, Wang G, Peng P, Jia Y. Fractionation and characterization of ε-Poly-L-lysine from Streptomyces albulus CGMCC 1986. Food Sci Biotechnol. (2010) 19:361–6. doi: 10.1007/s10068-010-0051-9
14. Lin L, Gu Y, Li C, Vittayapadung S, Cui H. Antibacterial mechanism of ε -Poly-lysine against Listeria monocytogenes and its application on cheese. Food Control. (2018) 91:76–84. doi: 10.1016/j.foodcont.2018.03.025
15. Zhou C, Li P, Qi X, Sharif ARM, Poon YF, Cao Y, et al. A photopolymerized antimicrobial hydrogel coating derived from epsilon-poly-L-lysine. Biomaterials. (2011) 32:2704–12. doi: 10.1016/j.biomaterials.2010.12.040
16. Tan Z, Shi Y, Xing B, Hou Y, Cui J, Jia S. The antimicrobial effects and mechanism of ε-poly-lysine against Staphylococcus aureus. Bioresour Bioproc. (2019) 6:8. doi: 10.1186/s40643-019-0246-8
17. Shima S, Matsuoka H, Iwamoto T, Sakai H. Antimicrobial action of ε-poly-L-lysine. J Antibiot. (1984) 37:1449–55. doi: 10.7164/antibiotics.37.1449
18. You X, Einson JE, Lopez-Pena CL, Song M, Xiao H, McClements DJ, et al. Food-grade cationic antimicrobial epsilon-polylysine transiently alters the gut microbial community and predicted metagenome function in CD-1 mice. NPJ Sci Food. (2017) 1:8. doi: 10.1038/s41538-017-0006-0
19. Zhang X, Hou Z, Xu B, Xie C, Wang Z, Yu X, et al. Dietary supplementation of epsilon-polylysine beneficially affects ileal microbiota structure and function in ningxiang pigs. Front Microbiol. (2020) 11:544097. doi: 10.3389/fmicb.2020.544097
20. Hosomi R, Yamamoto D, Otsuka R, Nishiyama T, Yoshida M, Fukunaga K. Dietary varepsilon-polylysine decreased serum and liver lipid contents by enhancing fecal lipid excretion irrespective of increased hepatic fatty acid biosynthesis-related enzymes activities in rats. Prev Nutr Food Sci. (2015) 20:43–51. doi: 10.3746/pnf.2015.20.1.43
21. Yasuhiro Kido SH, Murao M, Horio Y, Miyazaki T. ε-Polylysine inhibits pancreatic lipase activity and suppressespostprandial hypertriacylglyceridemia in rats. Nutrient Metabol. (2003) 233:1887–91. doi: 10.1093/jn/133.6.1887
22. Nossa CW, Oberdorf WE, Yang L, Aas JA, Paster BJ, DeSantis TZ, et al. Design of 16S rRNA gene primers for 454 pyrosequencing of the human foregut microbiome. World J Gastroenterol WJG. (2010) 16:4135. doi: 10.3748/wjg.v16.i33.4135
23. Rognes T, Flouri T, Nichols B, Quince C, Mahé F. VSEARCH: a versatile open source tool for metagenomics. PeerJ. (2016) 4:e2584. doi: 10.7717/peerj.2584
24. Wang Q, Garrity GM, Tiedje JM, Cole JR. Naive Bayesian classifier for rapid assignment of rRNA sequences into the new bacterial taxonomy. Appl Environ Microbiol. (2007) 73:5261–7. doi: 10.1128/AEM.00062-07
25. Langille MG, Zaneveld J, Caporaso JG, McDonald D, Knights D, Reyes JA, et al. Predictive functional profiling of microbial communities using 16S rRNA marker gene sequences. Nat Biotechnol. (2013) 31:814–21. doi: 10.1038/nbt.2676
26. Kanehisa M, Goto S, Sato Y, Furumichi M, Tanabe M. KEGG for integration and interpretation of large-scale molecular data sets. Nucleic Acids Res. (2012) 40:D109–14. doi: 10.1093/nar/gkr988
27. Liu T, Zhang X. Transcriptome and metabolomic analyses reveal regulatory networks and key genes controlling maize stomatal development in response to blue light. Int J Mol Sci. (2021) 22:5393. doi: 10.3390/ijms22105393
28. Titlow WB, Lee CH, Ryou C. Characterization of toxicological properties of L-lysine polymers in CD-1 mice. J Microbiol Biotechnol. (2013) 23:1015–22. doi: 10.4014/jmb.1302.02055
29. Mao B, Li D, Ai C, Zhao J, Zhang H, Chen W. Lactulose differently modulates the composition of luminal and mucosal microbiota in C57BL/6J mice. J Agricult Food Chem. (2016) 64:6240–7. doi: 10.1021/acs.jafc.6b02305
30. Chae JP, Pajarillo EA, Oh JK, Kim H, Kang DK. Revealing the combined effects of lactulose and probiotic enterococci on the swine faecal microbiota using 454 pyrosequencing. Microb Biotechnol. (2016) 9:486–95. doi: 10.1111/1751-7915.12370
31. Parkar SG, Trower TM, Stevenson DE. Fecal microbial metabolism of polyphenols and its effects on human gut microbiota. Anaerobe. (2013) 23:12–9. doi: 10.1016/j.anaerobe.2013.07.009
32. Ranjani A, Dhanasekaran D, Gopinath PM. An introduction to actinobacteria. In: Dhanasekaran D, Jiang Y editors. Actinobacteria - Basics and Biotechnological Applications. London: InTechOpen (2016).
34. Binda C, Lopetuso LR, Rizzatti G, Gibiino G, Gasbarrini A. Actinobacteria: a relevant minority for the maintenance of gut homeostasis. Digest Liver Dis. (2018) 50:421–8. doi: 10.1016/j.dld.2018.02.012
35. Rizzatti G, Lopetuso LR, Gibiino G, Binda C, Gasbarrini A. Proteobacteria: a common factor in human diseases. Biomed Res Int. (2017) 2017:9351507. doi: 10.1155/2017/9351507
36. Zagato E, Pozzi C, Bertocchi A, Schioppa T, Saccheri F, Guglietta S, et al. Endogenous murine microbiota member Faecalibaculum rodentium and its human homologue protect from intestinal tumour growth. Nat Microbiol. (2020) 5:511–24. doi: 10.1038/s41564-019-0649-5
37. Picard C, Fioramonti J, Francois A, Robinson T, Neant F, Matuchansky C. bifidobacteria as probiotic agents–physiological effects and clinical benefits. Aliment Pharmacol Therapeut. (2005) 22:495–512. doi: 10.1111/j.1365-2036.2005.02615.x
38. Gao X, Du L, Randell E, Zhang H, Li K, Li D. Effect of different phosphatidylcholines on high fat diet-induced insulin resistance in mice. Food Funct. (2021) 12:1516–28. doi: 10.1039/d0fo02632h
39. Tett A, Pasolli E, Masetti G, Ercolini D, Segata N. Prevotella diversity, niches and interactions with the human host. Nat Rev Microbiol. (2021) 2021:1–15. doi: 10.1038/s41579-021-00559-y
40. Enemchukwu C, Ben-Faras H, Gialanella P, Szymczak W, Nosanchuk J, Madaline T. Butyricimonas virosa bacteraemia and bowel disease: case report and review. New Microbes New Infect. (2016) 13:34–6. doi: 10.1016/j.nmni.2016.05.004
41. Pedersen KB, Pulliam CF, Patel A, Del Piero F, Watanabe TT, Wankhade UD, et al. Liver tumorigenesis is promoted by a high saturated fat diet specifically in male mice and is associated with hepatic expression of the proto-oncogene Agap2 and enrichment of the intestinal microbiome with Coprococcus. Carcinogenesis. (2019) 40:349–59. doi: 10.1093/carcin/bgy141
42. Ascher S, Reinhardt C. The gut microbiota: an emerging risk factor for cardiovascular and cerebrovascular disease. Eur J Immunol. (2018) 48:564–75. doi: 10.1002/eji.201646879
43. Thorkildsen LT, Nwosu FC, Avershina E, Ricanek P, Perminow G, Brackmann S, et al. Dominant fecal microbiota in newly diagnosed untreated inflammatory bowel disease patients. Gastroenterol Res Pract. (2013) 2013:636785. doi: 10.1155/2013/636785
44. Lloyd-Price J, Arze C, Ananthakrishnan AN, Schirmer M, Avila-Pacheco J, Poon TW, et al. Multi-omics of the gut microbial ecosystem in inflammatory bowel diseases. Nature. (2019) 569:655–62. doi: 10.1038/s41586-019-1237-9
45. Ferraris L, Aires J, Butel M-J. Isolation of Robinsoniella peoriensis from the feces of premature neonates. Anaerobe. (2012) 18:172–3. doi: 10.1016/j.anaerobe.2011.11.007
46. Astbury S, Atallah E, Vijay A, Aithal GP, Grove JI, Valdes AM. Lower gut microbiome diversity and higher abundance of proinflammatory genus Collinsella are associated with biopsy-proven nonalcoholic steatohepatitis. Gut Microbes. (2020) 11:569–80. doi: 10.1080/19490976.2019.1681861
47. Qin P, Zou Y, Dai Y, Luo G, Zhang X, Xiao L. Characterization a novel butyric acid-producing bacterium Collinsella aerofaciens subsp. shenzhenensis subsp. nov. Microorganisms. (2019) 7:78. doi: 10.3390/microorganisms7030078
48. Zhang W, Xu J-H, Yu T, Chen Q-K. Effects of berberine and metformin on intestinal inflammation and gut microbiome composition in db/db mice. Biomed Pharmacother. (2019) 118:109131. doi: 10.1016/j.biopha.2019.109131
49. Huang A, Cai R, Wang Q, Shi L, Li C, Yan H. Dynamic change of gut microbiota during porcine epidemic diarrhea virus infection in suckling piglets. Front Microbiol. (2019) 10:322. doi: 10.3389/fmicb.2019.00322
50. Zhang L, Shi M, Ji J, Hu X, Chen F. Gut microbiota determines the prevention effects of Luffa cylindrica (L.) Roem supplementation against obesity and associated metabolic disorders induced by high-fat diet. Faseb J. (2019) 33:10339–52. doi: 10.1096/fj.201900488R
51. Sun L, Jia H, Li J, Yu M, Yang Y, Tian D, et al. Cecal gut microbiota and metabolites might contribute to the severity of acute myocardial ischemia by impacting the intestinal permeability, oxidative stress, and energy metabolism. Front Microbiol. (2019) 10:1745. doi: 10.3389/fmicb.2019.01745
52. Gomez-Arango LF, Barrett HL, Wilkinson SA, Callaway LK, McIntyre HD, Morrison M, et al. Low dietary fiber intake increases Collinsella abundance in the gut microbiota of overweight and obese pregnant women. Gut Microbes. (2018) 9:189–201. doi: 10.1080/19490976.2017.1406584
53. Togo A, Diop A, Dubourg G, Khelaifia S, Richez M, Armstrong N, et al. Anaerotruncus massiliensis sp. nov., a succinate-producing bacterium isolated from human stool from an obese patient after bariatric surgery. New Microbes New Infect. (2019) 29:100508. doi: 10.1016/j.nmni.2019.01.004
54. Wang K, Liao M, Zhou N, Bao L, Ma K, Zheng Z, et al. Parabacteroides distasonis alleviates obesity and metabolic dysfunctions via production of succinate and secondary bile acids. Cell Rep. (2019) 26:222.–235. doi: 10.1016/j.celrep.2018.12.028
55. Aasmets O, Lüll K, Lang JM, Pan C, Kuusisto J, Fischer K, et al. Machine learning reveals time-varying microbial predictors with complex effects on glucose regulation. Biorxiv. [Preprint]. (2020). doi: 10.1128/mSystems.01191-20
56. Walker A, Pfitzner B, Harir M, Schaubeck M, Calasan J, Heinzmann SS, et al. Sulfonolipids as novel metabolite markers of Alistipes and Odoribacter affected by high-fat diets. Sci Rep. (2017) 7:1–10. doi: 10.1038/s41598-017-10369-z
57. Zhang Q, Xiao X, Li M, Yu M, Ping F, Zheng J, et al. Vildagliptin increases butyrate-producing bacteria in the gut of diabetic rats. PLoS One. (2017) 12:e0184735. doi: 10.1371/journal.pone.0184735
58. Plovier H, Everard A, Druart C, Depommier C, Van Hul M, Geurts L, et al. A purified membrane protein from Akkermansia muciniphila or the pasteurized bacterium improves metabolism in obese and diabetic mice. Nat Med. (2017) 23:107–13. doi: 10.1038/nm.4236
59. Thingholm LB, Rühlemann MC, Koch M, Fuqua B, Laucke G, Boehm R, et al. Obese individuals with and without type 2 diabetes show different gut microbial functional capacity and composition. Cell Host Microbe. (2019) 26:252.–264. doi: 10.1016/j.chom.2019.07.004
60. Biddle A, Stewart L, Blanchard J, Leschine S. Untangling the genetic basis of fibrolytic specialization by Lachnospiraceae and Ruminococcaceae in diverse gut communities. Diversity. (2013) 5:627–40. doi: 10.3390/d5030627
61. Meehan CJ, Beiko RG. A phylogenomic view of ecological specialization in the Lachnospiraceae, a family of digestive tract-associated bacteria. Genome Biol Evolut. (2014) 6:703–13. doi: 10.1093/gbe/evu050
62. Vacca M, Celano G, Calabrese F, Portincasa P, Gobbetti M, De Angelis M. The controversial role of human gut Lachnospiraceae. Microorganisms. (2020) 8:573. doi: 10.3390/microorganisms8040573
63. Ju T, Kong JY, Stothard P, Willing BP. Defining the role of Parasutterella, a previously uncharacterized member of the core gut microbiota. ISME J. (2019) 13:1520–34. doi: 10.1038/s41396-019-0364-5
64. Zhao T, Zhan L, Zhou W, Chen W, Luo J, Zhang L, et al. The effects of Erchen decoction on gut microbiota and lipid metabolism disorders in zucker diabetic fatty rats. Front Pharmacol. (2021) 12:1912. doi: 10.3389/fphar.2021.647529
65. van der Veen JN, Kennelly JP, Wan S, Vance JE, Vance DE, Jacobs RL. The critical role of phosphatidylcholine and phosphatidylethanolamine metabolism in health and disease. Biochim Biophys Acta Biomembr. (2017) 1859:1558–72. doi: 10.1016/j.bbamem.2017.04.006
66. Zhao Y, Su B, Jacobs RL, Kennedy B, Francis GA, Waddington E, et al. Lack of phosphatidylethanolamine N-methyltransferase alters plasma VLDL phospholipids and attenuates atherosclerosis in mice. Arterioscler Thromb Vascul Biol. (2009) 29:1349–55. doi: 10.1161/ATVBAHA.109.188672
67. Li Z, Agellon LB, Allen TM, Umeda M, Jewell L, Mason A, et al. The ratio of phosphatidylcholine to phosphatidylethanolamine influences membrane integrity and steatohepatitis. Cell Metabol. (2006) 3:321–31. doi: 10.1016/j.cmet.2006.03.007
68. Puri P, Baillie RA, Wiest MM, Mirshahi F, Choudhury J, Cheung O, et al. A lipidomic analysis of nonalcoholic fatty liver disease. Hepatology. (2007) 46:1081–90.
69. Ling J, Chaba T, Zhu LF, Jacobs RL, Vance DE. Hepatic ratio of phosphatidylcholine to phosphatidylethanolamine predicts survival after partial hepatectomy in mice. Hepatology. (2012) 55:1094–102. doi: 10.1002/hep.24782
70. Niebergall LJ, Jacobs RL, Chaba T, Vance DE. Phosphatidylcholine protects against steatosis in mice but not non-alcoholic steatohepatitis. Biochim Biophys Acta. (2011) 1811:1177–85. doi: 10.1016/j.bbalip.2011.06.021
71. Liebisch G, Plagge J, Höring M, Seeliger C, Ecker J. The effect of gut microbiota on the intestinal lipidome of mice. Int J Med Microbiol. (2021) 311:151488. doi: 10.1016/j.ijmm.2021.151488
72. Liu D, Wang J, Zeng H, Zhou F, Wen B, Zhang X, et al. The metabolic regulation of Fuzhuan brick tea in high-fat diet-induced obese mice and the potential contribution of gut microbiota. Food Funct. (2022) 13:356–74. doi: 10.1039/d1fo02181h
73. Chen M-H, Zhou J, Wu C-Y, Zhang W, Long F, Zhou S-S, et al. Gut microbiota influenced the xenograft MC38 tumor growth potentially through interfering host lipid and amino acid metabolisms, basing on the integrated analysis of microbiome and metabolomics. J Chromatogr B. (2022) 2022:123136. doi: 10.1016/j.jchromb.2022.123136
Keywords: ε-polylysine, glycerophospholipid metabolism, gut microbiota, growth performance, C57 mice
Citation: Zhang X, Xu B, Hou Z, Xie C, Niu Y, Dai Q, Yan X and Wu D (2022) Dietary ε-Polylysine Affects on Gut Microbiota and Plasma Metabolites Profiling in Mice. Front. Nutr. 9:842686. doi: 10.3389/fnut.2022.842686
Received: 07 January 2022; Accepted: 08 March 2022;
Published: 28 April 2022.
Edited by:
Carlos Gómez-Gallego, University of Eastern Finland, FinlandReviewed by:
Iman Zarei, University of Eastern Finland, FinlandCopyright © 2022 Zhang, Xu, Hou, Xie, Niu, Dai, Yan and Wu. This is an open-access article distributed under the terms of the Creative Commons Attribution License (CC BY). The use, distribution or reproduction in other forums is permitted, provided the original author(s) and the copyright owner(s) are credited and that the original publication in this journal is cited, in accordance with accepted academic practice. No use, distribution or reproduction is permitted which does not comply with these terms.
*Correspondence: Xianghua Yan, eGh5YW5AbWFpbC5oemF1LmVkdS5jbg==; Duanqin Wu, d3VkdWFucWluQGNhYXMuY24=
Disclaimer: All claims expressed in this article are solely those of the authors and do not necessarily represent those of their affiliated organizations, or those of the publisher, the editors and the reviewers. Any product that may be evaluated in this article or claim that may be made by its manufacturer is not guaranteed or endorsed by the publisher.
Research integrity at Frontiers
Learn more about the work of our research integrity team to safeguard the quality of each article we publish.