 Huijing He1
 Li Pan1Xiaolan Ren2Dingming Wang3Jianwei Du4Ze Cui5Jingbo Zhao6Hailing Wang7Xianghua Wang8Feng Liu9Lize Pa10Xia Peng11Chengdong Yu1
 Ye Wang1
 Guangliang Shan1*
- 1Department of Epidemiology and Statistics, Institute of Basic Medical Sciences, Chinese Academy of Medical Sciences and School of Basic Medicine, Peking Union Medical College, Beijing, China
- 2Department of Chronic and Noncommunicable Disease Prevention and Control, Gansu Provincial Center for Disease Control and Prevention, Lanzhou, China
- 3Department of Chronic and Noncommunicable Disease Prevention and Control, Guizhou Provincial Center for Disease Control and Prevention, Guiyang, China
- 4Department of Chronic and Noncommunicable Disease Prevention and Control, Hainan Provincial Center for Disease Control and Prevention, Haikou, China
- 5Department of Chronic and Noncommunicable Disease Prevention and Control, Hebei Provincial Center for Disease Control and Prevention, Shijiazhuang, China
- 6Department of Epidemiology and Statistics, School of Public Health, Harbin Medical University, Harbin, China
- 7Department of Chronic and Noncommunicable Disease Prevention and Control, Inner Mongolia Autonomous Region Center for Disease Control and Prevention, Hohhot, China
- 8Integrated Office, Institute of Biomedical Engineering, Chinese Academy of Medical Sciences, Peking Union Medical College, Tianjin, China
- 9Department of Chronic and Noncommunicable Disease Prevention and Control, Shaanxi Provincial Center for Disease Control and Prevention, Xi'an, China
- 10Department of Chronic and Noncommunicable Disease Prevention and Control, Xinjiang Uyghur Autonomous Region Center for Disease Control and Prevention, Urumqi, China
- 11Department of Chronic and Noncommunicable Disease Prevention and Control, Yunnan Provincial Center for Disease Control and Prevention, Kunming, China
Alcohol intake and excess adiposity are associated with serum uric acid (SUA), but their interaction effect on hyperuricemia (HUA) remains unclear. Using data from the China National Health Survey (CNHS) (2012–2017), we analyzed the additive interaction of beer, spirits intake, excess adiposity [measured by body mass index (BMI), body fat percentage (BFP), and visceral fat index (VFI)] with HUA among male participants aged 20–80 from mainland China. The relative excess risk due to interaction (RERI), the attributable proportion due to interaction (AP), and the synergy index (SI) were calculated to assess the interaction effect on the additive scale. Both RERI and AP larger than 0 and SI larger than 1 indicate a positive additive interaction. Among 12,592 male participants, the mean SUA level was 367.1 ± 85.5 μmol/L and 24.1% were HUA. Overweight/obese men who were presently drinking spirits had an odds ratio (OR) of 3.20 (95%CI: 2.71–3.79) than the never drink group, with RERI, AP, and SI of 0.45 (95%CI: 0.08–0.81), 0.14 (95%CI: 0.03–0.25), and 1.25 (95%CI: 1.02–1.54), respectively. However, although combined exposures on beer intake and excess adiposity had the highest OR compared with no beer intake and nonobese participants, there was no additive interaction, with RERI, AP, and SI in the overweight/obesity and the beer intake group of 0.58 (−0.41–1.57), 0.17 (−0.08–0.41), and 1.30 (0.85–1.97), respectively. Other excess adiposity indexes revealed similar estimates. Our findings suggested that the exposures of both excess adiposity and alcohol drink could result in an additive interaction effect on HUA: the combined risk of excess adiposity with spirits intake but not with beer was greater than the sum of the effects among Chinese male adults.
Introduction
Hyperuricemia (HUA) is a causal component necessary for the development of gout (1) and is associated with multiple cardiometabolic diseases (1, 2). The prevalence of HUA in the US population was over 21% based on the data from the US National Health and Nutrition Examination Survey (NHANES) 2007–2008 (3). The data from the China National Health Survey (CNHS) showed that the prevalence of HUA was as high as 25.1% in men and 15.9% in women in mainland China (4).
Body composition and alcohol intake are known determinants of the serum uric acid (SUA) level (5–8). Based on NHANES-III, body mass index (BMI) and alcohol use could be used to individually account for a notable proportion of HUA cases (5). Our previous work revealed that, in men, the prevalence of overweight/obesity and current alcohol drinking was high, that is, over 40 and 65%, respectively. The proportions of HUA cases that could be attributed to overweight/obesity and alcohol consumption were 20.6 and 12.8%, respectively (4). It is well known that excess adiposity and alcohol consumption are the most essential modifiable risk factors for cardiometabolic diseases, and previous studies have explored their interaction role toward metabolic health (9, 10). However, whether the combined effect of hazardous alcohol use and excess adiposity increase the risk of HUA beyond the sum of their individual effects, i.e., their interaction effect on HUA, is still unclear. Shiraishi and Une explored the interaction of obesity and drinking on HUA in Japanese male office workers (7), but they did not distinguish the alcohol beverage kinds. Previous studies have shown that beer and spirits intake, but not wine, was associated with the SUA level (8, 11, 12). Furthermore, for assessing the public health importance, measuring interaction on the additive scale has been acknowledged as the most appropriate method in the epidemiological community. The additive scale indicates whether the effect of a risk factor would be greater in one subpopulation than in another and is thus useful in targeting intervention to certain subgroups if resources are limited (13). However, most studies estimating the risk difference are often reported using odds ratios (ORs) given that logistic regression is used for covariate adjustment and then the interaction is often not reported on the additive scale (7). The measurement of interaction on the additive scale (14), such as the relative excess risk due to interaction (RERI), the attributable proportion due to interaction (AP), and synergy index (SI) can be used to assess whether there is a synergism between excess body fat and alcohol use. As previous studies have indicated the causal effect of excess body fat and alcohol use on HUA (6, 15), RERI > 0 can imply such synergism (16). AP was intended to capture the proportion of the disease in the doubly exposed group that is due to the interaction between the two exposures (17).
Our previous work indicated that over 65% of men were obese, whereas 32% were women due to their much less alcohol drinking behaviors as well as lower alcohol intake dose than men (4). The combined effect of excess adiposity and alcohol consumption, thereby, may be more essential for the male population from the public health prospective. Therefore, using data from the CNHS, we aimed to estimate the joint effect of excess adiposity and different kinds of alcohol use on HUA among male adults in mainland China.
Methods
Study Population
Using a multistage, stratified sampling method, from 2012 to 2017, the CNHS selected a representative sample of the Chinese population in mainland China. More details are available from our previous publication (18). In brief, the CNHS collected data on demographic and socioeconomic information, lifestyle factors, anthropometric measures, laboratory tests, and clinical profiles from 11 provinces in mainland China. Only individuals aged 20–80 and who was lived in a local residence for at least 1 year were eligible to participate. Pregnant women, soldiers on active service, severe mental disease patients, or disabled people were excluded. Our analysis was limited to male adults who underwent biochemical tests and physical examination.
The study has been carried out in accordance with the Declaration of Helsinki. Ethical approval was obtained from the Bioethical Committee of the Institute of Basic Medical Sciences, Chinese Academy of Medical Sciences (No. 029-2013). All participants provided written informed consent before the survey.
SUA Measurement and Definition of HUA
Venous blood samples were drawn after an overnight fast. Separated plasma or serum was frozen in aliquots and stored at −80°C until thawed for the first time for the analyses. The SUA level was measured by oxidization with the specific enzyme uricase on a Chemistry Analyzer (ROCHE Cobas8000C701, USA). HUA was defined as SUA > 420 μmol/L (7 mg/dl) based on the Guideline for primary care of gout and HUA in China (version 2019) (19).
Assessment of Excess Adiposity and Alcohol Use
Height was measured to the nearest 0.1 cm using a fixed stadiometer. Weight, body fat percentage (BFP), and visceral fat index (VFI) were measured by using a body composition analyzer (TANITA BC-420, Japan), with the accuracy on a decimal level. BMI was calculated in kg/m2.
Based on the World Health Organization (WHO)'s definition of overweight and obesity, underweight was defined as BMI <18.5 kg/m2, normal weight was BMI ≥18.5 kg/m2 but <25 kg/m2, overweight was BMI ≥ 25 kg/m2 but <30 kg/m2, and obesity was BMI ≥ 30 kg/m2(20).
Information on alcohol use was collected by a self-report questionnaire interview. Alcohol use status was classified into three groups: never drinking, quit drinking, and current drinking. Current drinking was defined as the consumption of at least 30 g of alcohol and lasted for at least 6 months. In this study, participants who were drinking or quit drinking <6 months were classified into the “alcohol drinking in the past 1 year” group. Alcohol risk level was classified into three groups based on the WHO's guideline: low (1–40 g/day), medium (41–60 g/day), and high (>60 g/day) (21). We also collected information on the self-report consumption of beer, spirits, and wine through interview. We did not consider wine drinking in the final analyses due to its low consumption.
Measurement of Other Covariates
Demographic and socioeconomic factors (age, living in urban or rural areas, education level, and personal annual income) were collected by a face-to-face standardized questionnaire interview. Education levels were grouped into three categories: illiterate or elementary school, high school, and college or over. Personal annual income was classified into four groups: <10,000, 10,000–29,999, 30,000–49,999, and not <50,000 CHY/year (1 CHY = 0.16 USD). Current tobacco use was defined as smoking at least one cigarette per day for at least 6 months. Former tobacco use was defined as having quit tobacco use for more than 6 months preceding the survey (18). The estimated glomerular filtration rate (eGFR, ml/min per 1.73 m2) was calculated according to the Modification of Diet in Renal Disease equation for Chinese (c-MDRD) (22). The formula for eGFR calculation is:
Scr is serum creatinine in mg/dl.
Statistical Analyses
The final analytical samples were restricted to subjects without missing value of major factors of interest (age, alcohol drinking, and SUA level) and eGFR ≥ 60 ml/min per 1.73 m2 (to exclude possible kidney disorders (23)), no self-report of gout, or the use of diuretic medication. The original data of CNHS contain 53,895 participants with a multiethnic background. After excluding minority ethnic population (n = 21,588), missing values on SUA (n = 2,608), people did not live in the current residence (n = 55), eGFR <60 ml/min per 1.73 m2 (n = 506), female (n = 19,045), missing values on alcohol drinking (n = 109), the final sample included 12,592 participants.
Continuous variables were presented as means with SDs (if Gaussian distribution satisfied) or median with interquartile range (IQR), and categorical data as frequencies and percentages (%). The risk factors of interest were categorized as follows: BMI (≤ 25, 25–29, ≥30), BFP (≤ 25%, >25%), VFI (<15, ≥15), spirits intake level (classified into four groups, never, low, moderate, and high based on the conversion of daily alcohol intake and the same with the overall alcohol risk assessment), beer intake level (never, low: no more than 20 bottles 1 year, moderate: no more than 40 bottles 1 year, and high: more than 40 bottles 1 year).
RERI, AP, and SI were used to assess the additive interaction.
Relative excess risk due to interaction is defined as
where RRab is the relative risk (RR) in the group with exposures a and b (1 = exposed, 0 = unexposed) as compared with the doubly unexposed group. A RERI equals 0 implying no additive interaction and >0 indicates a positive interaction (24). In this study, RR is replaced with OR yielded by the logistic regression model.
The attributable proportion due to interaction is defined as
The synergy index is defined as
If the 95% CIs of AP and SI did not include 0 and 1, respectively, then the additive interaction is presented. RERI, AP, and SI were estimated using the regression coefficients and a covariance matrix obtained from the logistic regression models (25, 26). The delta method was used to calculate the 95% CIs of RERI, AP, and SI (25, 27). For a sufficient power of joint effect estimation and ease of interpretation, alcohol use, and excess adiposity, were subsequently dichotomously grouped in the additive interaction analyses.
Comparisons of prevalence among groups were adjusted for potential confounders using logistic regression models (28). Multilevel linear regression models were used to obtain estimates between risk factors of interest and the SUA level. Survey logistic regression models were used to estimate the effect of excess adiposity and alcohol use on HUA.
We used SAS software version 9.4 to perform all the analyses. All P-values were two-sided, and α = 0.05.
Results
Subject Characteristics
A total of 12,592 male adults were included in the final sample. The mean age of the study population was 49.0 ± 13.5 years. Most participants were from urban areas (62.45%), had a high school educational level (51.45%), and had a moderate personal annual income (10,000–49,999 CHY, 62.89%). The mean SUA level was 367.1 ± 85.5 μmol/L and 24.1% were HUA. The prevalence and distribution of risk factor categories are presented in Table 1.
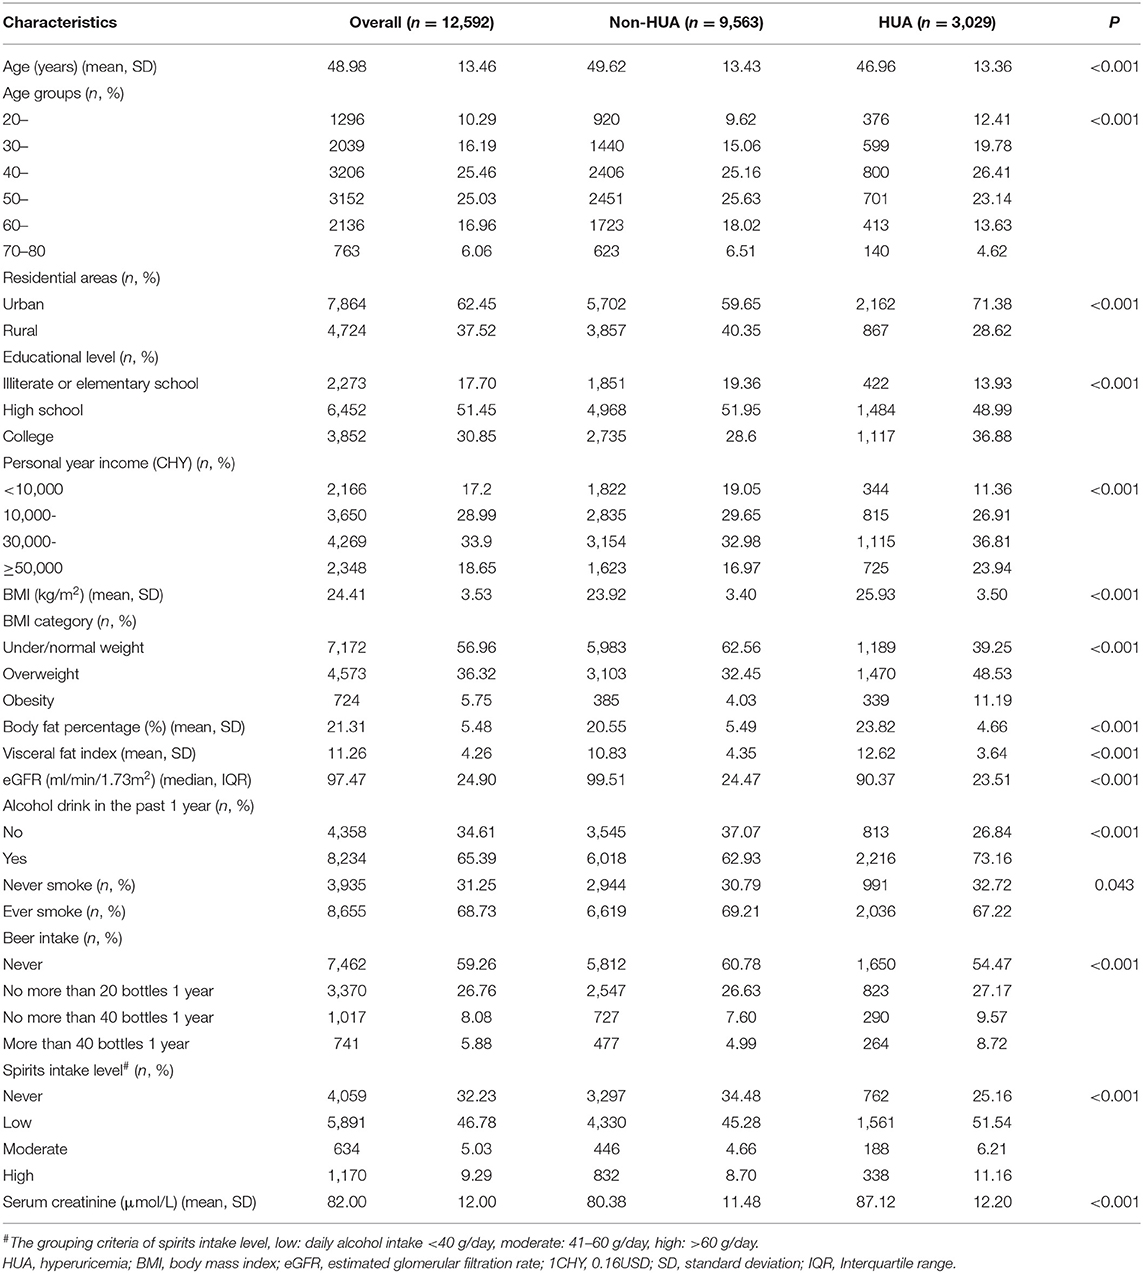
Table 1. Sociodemographic and health characteristics of male participants in mainland China.
Effect of Body Composition and Alcohol Use on SUA and HUA
The SUA level adjusted for covariates among body composition and alcohol use groups is shown in Table 2.
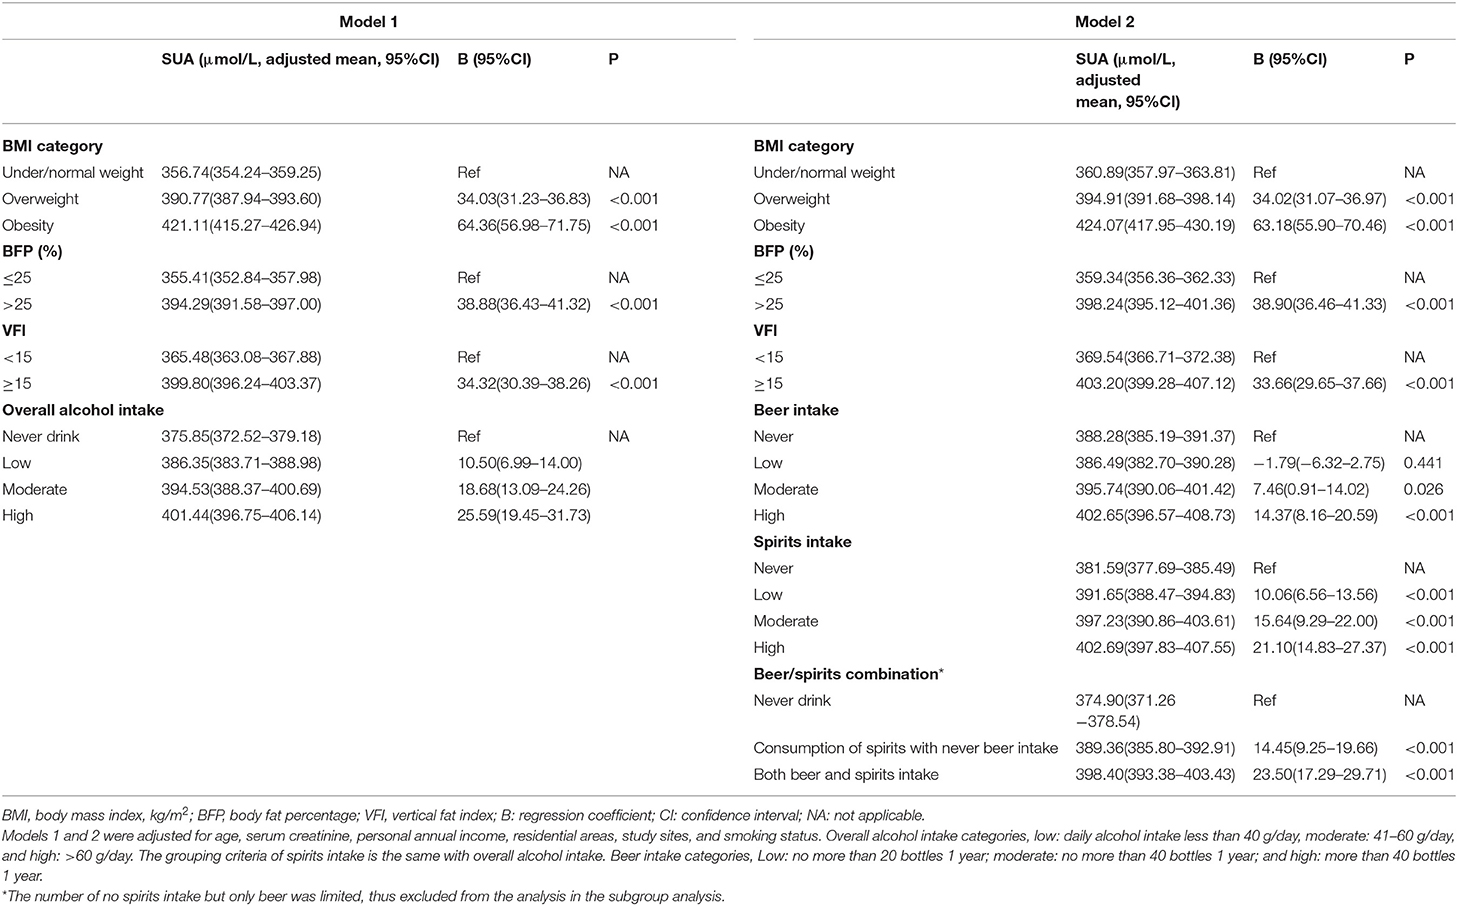
Table 2. Adjusted serum uric acid (SUA) levels in stratified groups and the effect of excess adiposity, beer, and spirits intake on SUA (n = 12,592).
From never drinking to high alcohol consumption, the SUA levels increased positively (p < 0.001). Similar results were observed when distinguishing alcohol use into beer and spirits intake (p < 0.001). The high alcohol intake group had an average higher SUA level of 25.6 μmol/L than the never drink group. This effect was stronger in spirits intake, with an average higher SUA of 21.1 μmol/L than the never drink group (as reference), compared with 14.4 μmol/L in beer intake.
Excess adiposity was also positively associated with the SUA level. With elevated body fat distribution, the SUA level increased correspondingly. Compared with the nonobese group (under/normal weight), individuals with overweight and obesity had 34.03 and 64.36 μmol/L higher SUA levels, respectively (Model 1, Table 2). Likewise, subjects with higher BFP or VFI also had higher SUA levels (Table 2).
The prevalence of hyperuricemia among risk factor groups is shown in Figure 1. In general, the prevalence of HUA increased with the elevated body fat distribution measured by BMI, BFP, and VFI. Obese people who consumed beer more than 40 bottles 1 year had an HUA prevalence of 50.1% (95%CI: 34.7–65.5%), in comparison with the lowest HUA prevalence of 15.2% (95%CI: 13.9–16.5%) in people who never drink and were nonobese (p < 0.001). Other combinations of adiposity and alcohol intake had similar trends (Figure 1).
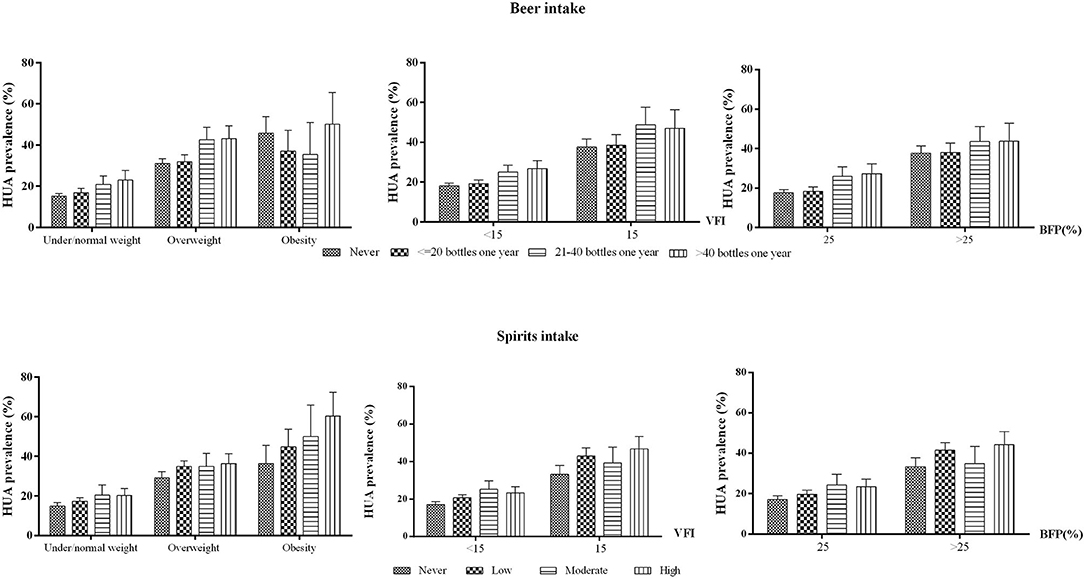
Figure 1. HUA prevalence in different excess adiposity and alcohol intake groups among men aged 20–80 in mainland China. HUA, hyperuricemia. BFP, body fat percentage. VFI, visceral fat index. Note: The prevalence was adjusted for age, residential areas, and study sites.
All excess adiposity indexes were found to be positively associated with the odds of HUA (Table 3), with p-values for trends <0.001. Either beer or spirits intake was associated with increased odds of HUA, and there were dose-response relationships between consumption levels and the risk of HUA (p < 0.001).
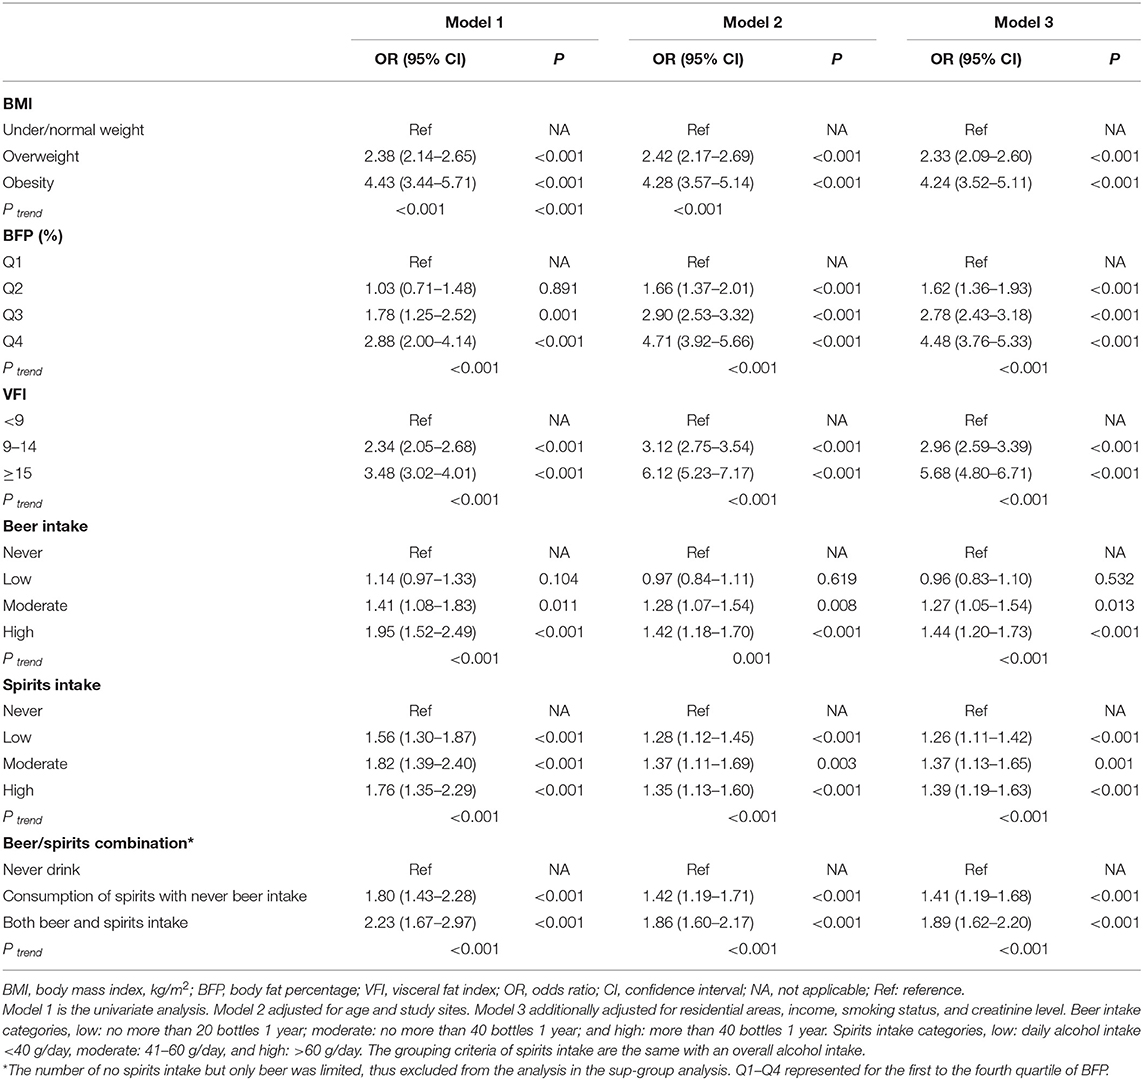
Table 3. The effect of excess adiposity and alcohol use on hyperuricemia (HUA) among male participants (n = 12,592).
The Joint Effect of Excess Adiposity and Alcohol Use on HUA
We demonstrated the prevalence of HUA and estimated the ORs for each risk factor and its combinations (Table 4). After the estimation of the joint effect of overall alcohol use with adiposity on HUA, we found that current drinking in the obese population (BMI > 25, BFP > 25, or VFI > 15) had the highest HUA prevalence and the highest ORs. Positive RERI, AP, and SI were observed among all the three adiposity indexes. For obese men who were presently drinking alcohol, the RERI was 0.65 (95%CI: 0.35–0.94), with an SI of 1.37 (95%CI: 1.12–1.67), indicating that the integration of alcohol use and overweight/obesity had a greater health effect than the sum of the independent effect of the two factors. By calculating AP, we could know that 19% (95%CI: 10–29%) of the combined risk of overweight/obesity and alcohol use were due to an additive interaction. Similar demonstrations could be drawn using BFP and VFI adiposity indexes. Interestingly, VFI seemed to have a greater additive interaction than the other two adiposity indexes, based on the larger values of its RERI, AP, and SI.
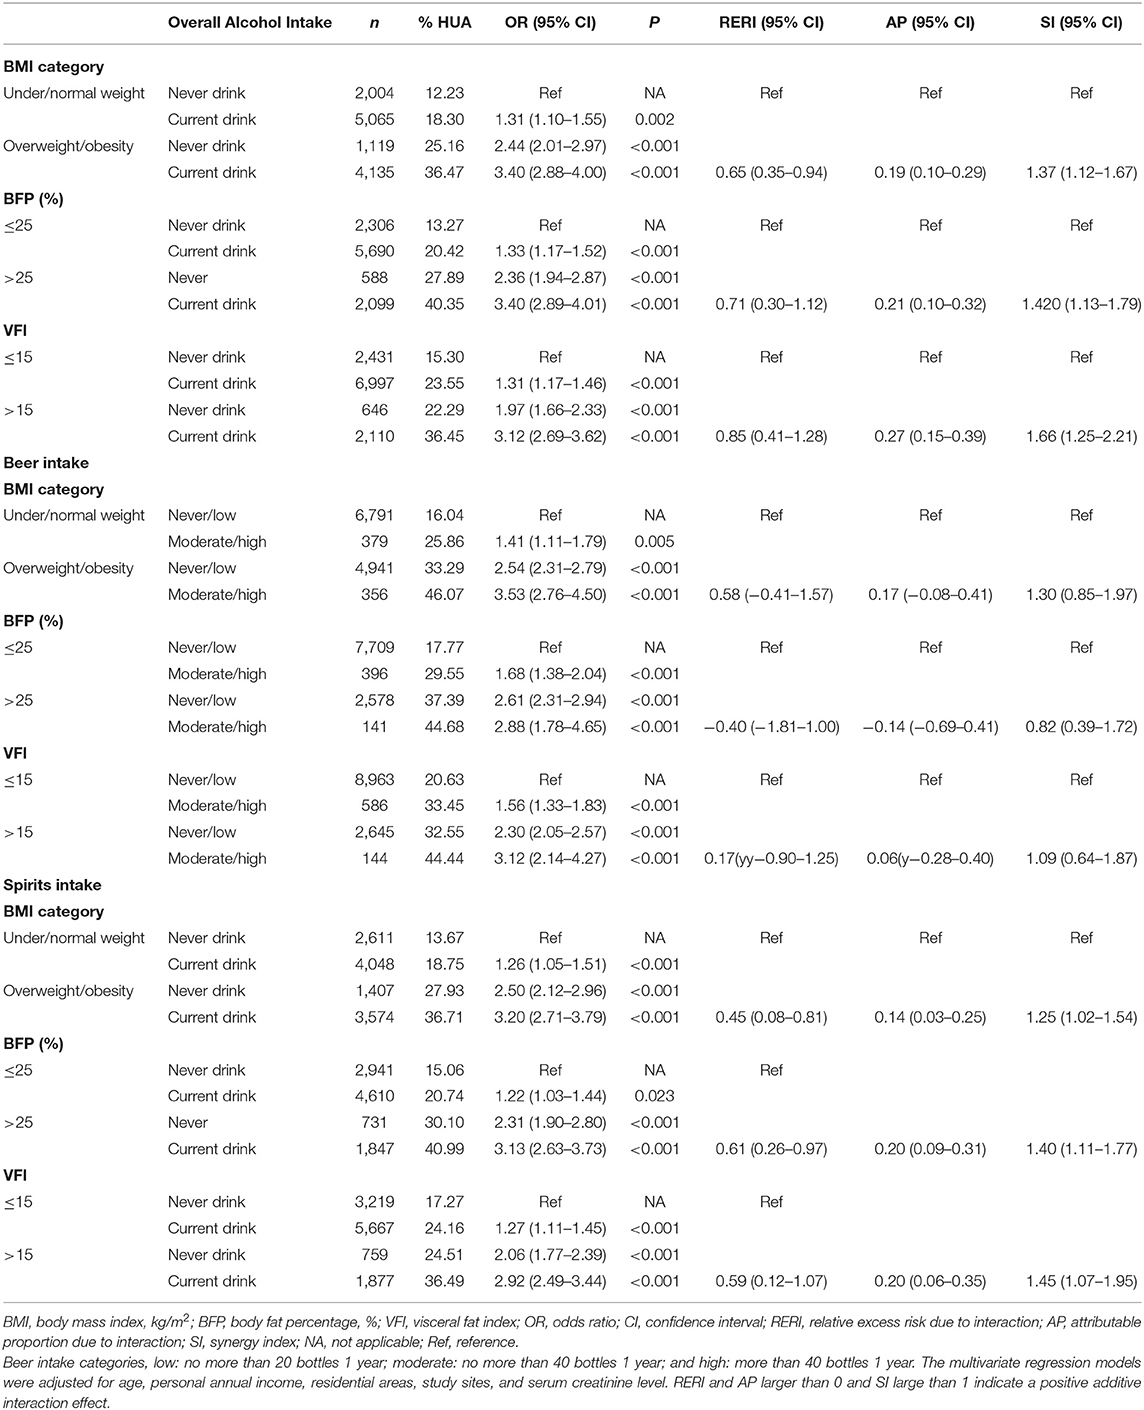
Table 4. The effect of excess adiposity and alcohol intake and their additive interaction on HUA among men aged 20–80 in mainland China.
We distinguished alcohol use into beer and spirits to see if there was a difference between alcohol beverage kinds in the interaction estimates. The results showed that, although people who were obese with a moderate/high intake of beer had the highest OR than the reference group, there was no additive interaction (Table 4). On the contrary, spirits intake had both independent and additive interaction effects. Obese people who were presently drinking spirits had an OR of 3.20 (the never drink group as a reference), and the RERI was larger than 0, 0.45 with 95% CI of 0.08–0.81, the SI was 1.25 (95%CI: 1.02–1.54). Around 14% (3–25%) of the combined risk can be attributed to the additive interaction. The results were found to be consistent among different adiposity indexes.
Discussion
To the best of our knowledge, this is the first study aimed to understand an additive interaction effect between alcohol use and excess adiposity on HUA. Using data from the CNHS, we demonstrated that body composition and alcohol use had an additive interaction effect on HUA, after adjusting for potential confounders. Furthermore, spirits intake, but not beer, had an interaction on the additive scale with adiposity in the study population.
The relationship between adiposity and SUA has been well-explored. In a large survey of 310,577 Japanese middle-aged adults, obese participants were found to have a 1.33–3.76-fold higher risk of HUA in comparison with their nonobese counterparts (29). Other cross-sectional studies also indicated positive associations between BMI and HUA (30, 31). BMI has been acknowledged to have a causal and independent effect on elevating the SUA level (5, 30, 32). However, BMI does not differentiate fat-free mass from adipose tissue (33) and may have a low sensitivity for predicting BFP (34). Therefore, we used the two other adiposity indexes, BFP and VFI, as alternative indicators of excess adiposity. In a Chinese hypertension registry study, BFP was found to be positively associated with an increased risk of HUA among hypertensive patients (35). BFP was also found to be associated with cardiometabolic disorders in a variety of populations (36, 37). Excess body fat increases morbidity, with excess visceral fat being an important factor that triggers pathologies among cardiometabolic risk factors (38–41). Yamada et al. reported that visceral adiposity was independently associated with HUA in a Japanese population (42). The mechanisms underlying the relationship between visceral adiposity and HUA are not fully understood. The cause of HUA is known to be an overproduction or a reduction in renal or extrarenal excretion of uric acid. Thus, the possible mechanism may be the reduction of renal excretion of SUA due to hyperinsulinemia through adiposity (42, 43).
The measure of BMI could give both healthcare providers and patients quick feedback on the risk estimation due to its low cost, simple operation, and availability. BFP and VFI measurements enable the assessment of fat mass and its distribution. The use of different excess adiposity indexes in our study allows for more comprehensive perspectives on the exploration of HUA risk factors.
Another well-established modifiable risk factor of HUA is alcohol intake. For two prospective cohort studies in Japanese men, alcohol intake was found to be associated with the incidence of HUA (44, 45). Data from NHANES-III also indicated that alcohol beverage consumption is associated with elevated SUA and HUA (5), and beer conferred a larger increase than liquor, whereas wine drinking did not increase SUA (12). Similarly, in two cross-sectional surveys of Caucasian adults, and in the CARDIA cohort among US young adults with a 20-year follow-up, the consumption of beer and spirits, but not wine, was related with elevated SUA (11, 46). Our study also implied that the intake of beer and spirits was associated with elevated SUA and HUA.
A few previous studies explored HUA risk factors, including both alcohol use and obesity, but a few investigated their interaction effect. In a Japanese population, on the multiplicative scale, no interaction effect on HUA was observed (7). Interaction on the additive scale is more likely to reflect the biological interaction, and interaction measurement between excess adiposity and alcohol use enables the estimation of an excess risk due to both exposures. Our study revealed that both exposures of excess adiposity and alcohol drink had an additive interaction effect on the odds of HUA, which indicated an excess risk than the sum of the two risk factors. Public health intervention strategies and resource location should be paid more attention toward the population with both exposures. Furthermore, when we distinguished alcohol beverages into spirits and beer, the results showed that an additive interaction was mainly attributed to spirits intake but not beer. One possible reason, which is also one of the limitations of the study, is that there was a limited sample size in the subgroup of beer intake. For instance, never or low consumption of beer accounted for over 80% of the study population, whereas over 60% of participants had an average alcohol intake level of at least 40 g/day in the past 1 year. In a different perspective, given that there was limited research focusing on an additive interaction between excess adiposity and beer intake, further investigation is needed to fully understand the mechanism.
There are several limitations to this study. First, conclusions on causal relationships cannot be drawn due to the nature of a cross-sectional design. Second, we did not collect information on genetic and dietary factors, and other unmeasured confounders may exist. Nonetheless, evidence suggested that diet and other modifiable risk factors, such as exercise, influenced the risk of HUA and gout through modifying BMI (47), thus making it non-reasonable to adjust dietary factors as confounders in the multivariate analysis based on Rothman's recommendation (14). Third, we did not collect information on urate lowering drug use, thus possibly leading to a nondifferential measurement error, and biased our estimates toward the null, resulting in a more conservative assessment. Moreover, the prevalence of HUA and health profiles on adiposity and alcohol intake may vary during the survey year, thus inducing a misclassification bias. Nevertheless, as our main purpose is to estimate an interaction effect of adiposity and alcohol intake on HUA, not the prevalence of these factors, the study conclusion may not be substantially influenced.
The strengths of this study are the analyses conducted within a large, ethnically homogeneous sample. A rigid design and the use of standardized measurement throughout the survey place it particularly well for the estimation of an additive interaction effect among areas. Moreover, we use the three indexes, namely BMI, BFP, and VFI, to measure excess adiposity, thus making a more comprehensive exploration of health estimates. Distinguishing different alcoholic beverages allow for more precise evidence of health risk estimates. Taken together, our findings embolden the effect of modifiable risk factors, i.e., excess adiposity and alcohol use, on elevated SUA, particularly in the way of indicating a joint effect of the two important lifestyle factors on a biological interactive perspective.
In summary, excess adiposity and alcohol use were found to be positively associated with the prevalence of HUA and SUA levels. Overweight/obesity, high BFP, and high VFI were all found to have an interaction effect with spirits intake, but not beer, on HUA on the additive scale. These findings further strengthen public health recommendations to identify high priority populations and initiate more targeted health interventions.
Data Availability Statement
The original contributions presented in the study are included in the article/supplementary material, further inquiries can be directed to the corresponding author.
Ethics Statement
The studies involving human participants were reviewed and approved by the Bioethical Committee of Institute of Basic Medical Sciences, Chinese Academy of Medical Sciences. The participants provided their written informed consent to participate in this study.
Author Contributions
HH and GS: conceptualization, data curation, and funding acquisition. HH: methodology, software, and formal analysis and writing—original draft preparation. HH, GS, and LPan: validation, project administration, and supervision. LPan, XR, DW, JD, ZC, HW, XW, FL, LPa, XP, YW, CY, GS, and HH: investigation. GS, HH, XR, DW, JD, ZC, HW, XW, FL, LPa, XP, YW, and CY: resources. GS: writing—review and editing. HH, YW, and CY: visualization. All authors read and approved the final manuscript.
Funding
This work was funded by the National Key R&D Program of China (Grant No. 2016YFC0900600/2016YFC0900601), the Key Basic Research Program of the Ministry of Science and Technology of China (Grant No. 2013FY114100), the National Natural Science Foundation of China (Grant No. 82003531), and Science & Technology Fundamental Resources Investigation Program (Grant No. 2017FY101100/2017FY101101).
Conflict of Interest
The authors declare that the research was conducted in the absence of any commercial or financial relationships that could be construed as a potential conflict of interest.
Publisher's Note
All claims expressed in this article are solely those of the authors and do not necessarily represent those of their affiliated organizations, or those of the publisher, the editors and the reviewers. Any product that may be evaluated in this article, or claim that may be made by its manufacturer, is not guaranteed or endorsed by the publisher.
Acknowledgments
We appreciate all CNHS participants and gratefully acknowledge that all staff members from the 10 provinces have given their considerable time and energy to this survey. We also thank Guangjin Zhu and Ling Zhang for their professional advice and efforts in the fieldwork.
References
1. de Oliveira EP, Burini RC. High plasma uric acid concentration:causes and consequences. Dlabetol Metab Syndr. (2012) 4:12. doi: 10.1186/1758-5996-4-12
2. Zhang S, Wang Y, Cheng J, Huangfu N, Zhao R, Xu Z, et al. Hyperuricemia and Cardiovascular Disease. Curr Pharm Des. (2019) 25:700–9. doi: 10.2174/1381612825666190408122557
3. Zhu Y, Pandya BJ, Choi HK. Prevalence of gout and hyperuricemia in the US general population: the National Health and Nutrition Examination Survey 2007-2008. Arthritis Rheum. (2011) 63:3136–41. doi: 10.1002/art.30520
4. He H, Pan L, Ren X, Wang D, Du J, Cui Z, et al. The effect of body weight and alcohol consumption on hyperuricemia and their attributable population fractions: a National health survey in China. Obes Facts. (2021) online ahead of print. doi: 10.1159/000521163
5. Choi HK, McCormick N, Lu N, Rai SK, Yokose C, Zhang Y Population impact attributable to modifiable risk factors for hyperuricemia. Arthritis Rheumatol. (2019) 72:157–65. doi: 10.1002/art.41067
6. Lyngdoh T, Vuistiner P, Marques-Vidal P, Rousson V, Waeber G, Vollenweider P, et al. Serum uric acid and adiposity:deciphering causality using a bidirectional Mendelian randomization approach. PLoS ONE. (2012) 7:e39321. doi: 10.1371/journal.pone.0039321
7. Shiraishi H, Une H. The effect of the interaction between obesity and drinking on hyperuricemia in Japanese male office workers. J Epidemiol. (2009) 19:12–6. doi: 10.2188/jea.JE20080016
8. Silva MTD, Diniz MDFH, Coelho CG, Vidigal PG, Telles RW, Barreto Barreto SM Intake of selected foods and beverages and serum uric acid levels in adults: ELSA-Brasil. (2008-2010). Public Health Nutr. (2020) 23:506–14. doi: 10.1017/S1368980019002490
9. Aberg F, Farkkila M, Mannisto V. Interaction between alcohol use and metabolic risk factors for liver disease: a critical review of epidemiological studies. Alcohol Clin Exp Res. (2020) 44:384–403. doi: 10.1111/acer.14271
10. Chen D, Luo W, Guo Z, Wu M, Zhou Z. The impact of interaction between alcohol consumption and obesity on incident hypertension. Zhonghua Yu Fang Yi Xue Za Zhi. (2015) 49:728–32.
11. Zykova SN, Storhaug HM, Toft I, Chadban SJ, Jenssen TG, White White SL Cross-sectional analysis of nutrition and serum uric acid in two Caucasian cohorts: the AusDiab Study and the Tromso study. Nutr J. (2015) 14:49. doi: 10.1186/s12937-015-0032-1
12. Choi HK, Curhan G. Beer, liquor, and wine consumption and serum uric acid level: the Third National Health and Nutrition Examination Survey. Arthritis Rheum. (2004) 51:1023–9. doi: 10.1002/art.20821
13. Knol MJ, VanderWeele TJ. Recommendations for presenting analyses of effect modification and interaction. Int J Epidemiol. (2012) 41:514–20. doi: 10.1093/ije/dyr218
15. Jee YH, Jung KJ, Park YB, Spiller W, Jee SH. Causal effect of alcohol consumption on hyperuricemia using a Mendelian randomization design. Int J Rheum Dis. (2019) 22:1912–9. doi: 10.1111/1756-185X.13668
16. Vander Weele TJ, Robins JM. The identification of synergism in the sufficient-component-cause framework. Epidemiology. (2007) 18:329–39. doi: 10.1097/01.ede.0000260218.66432.88
17. VanderWeele TJ. Reconsidering the denominator of the attributable proportion for interaction. Eur J Epidemiol. (2013) 28:779–84. doi: 10.1007/s10654-013-9843-6
18. He H, Pan L, Pa L, Cui Z, Ren X, Wang D, et al. Data resource profile: the China National Health Survey. (CNHS). Int J Epidemiol. (2018) 47:1734–35f. doi: 10.1093/ije/dyy151
19. Zeng X, Zou H, Zhang Y, Zhu X, Dai L Qing Y, et al. Guideline for primary care of gout and hyperuricemia: practice version. (2019). Chin J Gen Pract. (2019) 19:486–94. doi: 10.3760/cma.j.cn114798-20200328-00382
20. WHO Obesity Overweight. Available from:www.who.int/news-room/fact-sheets/detail/obesity-and-overweight (cited Sep 12, 2021).
21. WHO International Guide for Monitoring Alcohol Consumption Related Harm. Available from: https://apps.who.int/iris/bitstream/handle/10665/66529/WHO_MSD_MSB_00.4.pdf;sequence=1 (cited May 18, 2021).
22. Ma YC, Zuo L, Chen JH, Luo Q, Yu XQ, Li Y, et al. Modified glomerular filtration rate estimating equation for Chinese patients with chronic kidney disease. J Am Soc Nephrol. (2006) 17:2937–44. doi: 10.1681/ASN.2006040368
23. Goicoechea M, de Vinuesa SG, Verdalles U, Ruiz-Caro C, Ampuero J, Rincon A, et al. Effect of allopurinol in chronic kidney disease progression and cardiovascular risk. Clin J Am Soc Nephrol. (2010) 5:1388–93. doi: 10.2215/CJN.01580210
24. Correia K, Williams PL. Estimating the relative excess risk due to interaction in clustered-data settings. Am J Epidemiol. (2018) 187:2470–80. doi: 10.1093/aje/kwy154
25. Andersson T, Alfredsson L, Kallberg H, Zdravkovic S, Ahlbom A. Calculating measures of biological interaction. Eur J Epidemiol. (2005) 20:575–9. doi: 10.1007/s10654-005-7835-x
26. Yu C, Zhao H, Pan L, Zhang J, Wang X, Chang L, et al. The Additive Interaction between Body Mass Index and Hypertension Family History in Han and Yugur: the China National Health Survey (CNHS). Int J Hypertens. (2019) 2019:8268573. doi: 10.1155/2019/8268573
27. Hosmer DW, Lemeshow S. CI estimation of interaction. Epidemiology. (1992) 3:452–6. doi: 10.1097/00001648-199209000-00012
28. Roalfe AK, Holder RL, Wilson S. Standardisation of rates using logistic regression: a comparison with the direct method. BMC Health Serv Res. (2008) 8:275. doi: 10.1186/1472-6963-8-275
29. Shirasawa T, Ochiai H, Yoshimoto T, Nagahama S, Watanabe A, Yoshida R, et al. Cross-sectional study of associations between normal body weight with central obesity and hyperuricemia in Japan. BMC Endocr Disord. (2020) 20:2. doi: 10.1186/s12902-019-0481-1
30. Yu J, Sun H, Zhu J, Wei X, Shi H, Shen B, et al. Asymptomatic hyperuricemia and metabolically unhealthy obesity: a cross-sectional analysis in the Tianning Cohort. Diabetes Metab Syndr Obes. (2021) 14:1367–74. doi: 10.2147/DMSO.S301363
31. Wu J, Qiu L, Cheng X, Xu T, Wu W, Zeng X, et al. Hyperuricemia and clustering of cardiovascular risk factors in the Chinese adult population. Sci Rep. (2017) 7:5456. doi: 10.1038/s41598-017-05751-w
32. Palmer TM, Nordestgaard BG, Benn M, Tybjaerg-Hansen A, Davey Smith G, Lawlor DA, et al. Association of plasma uric acid with ischaemic heart disease and blood pressure: mendelian randomisation analysis of two large cohorts. BMJ. (2013) 347:f4262. doi: 10.1136/bmj.f4262
33. Martinez KE, Tucker LA, Bailey BW, Le Cheminant JD. Expanded Normal Weight Obesity and Insulin Resistance in US Adults of the National Health and Nutrition Examination Survey. J Diabetes Res. (2017) 2017:9502643. doi: 10.1155/2017/9502643
34. Okorodudu D, Jumean M, Montori V, Romero-Corral A, Somers V, Erwin P, et al. Diagnostic performance of body mass index to identify obesity as defined by body adiposity:a systematic review and meta-analysis. Int J Obesity. (2010) 34:791–9. doi: 10.1038/ijo.2010.5
35. Xiong Y, Wangsheng F, Wang S, Zhou W, Huang X, Bao H, et al. Positive association between body fat percentage and hyperuricemia in patients with hypertension: the China H-type hypertension registry study. Nutr Metab Cardiovasc Dis. (2021) S0939-4753:00323–00329
36. Zhang Z, Deng J, He L, Ling W, Su Y, Chen Y, et al. Comparison of various anthropometric and body fat indices in identifying cardiometabolic disturbances in Chinese men and women. PLoS ONE. (2013) 8:e70893. doi: 10.1371/journal.pone.0070893
37. Liu X, Zhao Y, Li Q, Dang S, Yan H Equation-derived body fat percentage indicates metabolic abnormalities among normal-weight adults in a rural Chinese population. Am J Hum Biol. (2017) 29:e22964. doi: 10.1002/ajhb.22964
38. López-Hernández L, Pérez-Ros P, Fargueta M, Elvira L, López-Soler J, Pablos A. Identifying predictors of the visceral fat index in the obese and overweight population to manage obesity: a randomized intervention study. Obes Facts. (2020) 13:403–14. doi: 10.1159/000507960
39. Després J, Lemieux I. Abdominal obesity and metabolic syndrome. Nature. (2006) 444:881–7. doi: 10.1038/nature05488
40. Patel P, Abate N. Body fat distribution and insulin resistance. Nutrients. (2013) 5:2019–27. doi: 10.3390/nu5062019
41. Lee YC, Lee YH, Chuang PN, Kuo CS, Lu CW, Yang KC. The utility of visceral fat level measured by bioelectrical impedance analysis in predicting metabolic syndrome. Obes Res Clin Pract. (2020) 14:519–23. doi: 10.1016/j.orcp.2020.09.008
42. Yamada A, Sato KK, Kinuhata S, Uehara S, Endo G, Hikita Y, et al. Association of visceral fat and liver fat with hyperuricemia. Arthritis Care Res. (2016) 68:553–61. doi: 10.1002/acr.22729
43. Templeman NM, Skovso S, Page MM, Lim GE, Johnson JD A. Causal role for hyperinsulinemia in obesity. J Endocrinol. (2017) 232:R173–83. doi: 10.1530/JOE-16-0449
44. Nakamura K, Sakurai M, Miura K, Morikawa Y, Yoshita K, Ishizaki M, et al. Alcohol intake and the risk of hyperuricaemia: a 6-year prospective study in Japanese men. Nutr Metab Cardiovasc Dis. (2012) 22:989–96. doi: 10.1016/j.numecd.2011.01.003
45. Makinouchi T, Sakata K, Oishi M, Tanaka K, Nogawa K, Watanabe M, et al. Benchmark dose of alcohol consumption for development of hyperuricemia in Japanese male workers: an 8-year cohort study. Alcohol. (2016) 56:9–14. doi: 10.1016/j.alcohol.2016.08.002
46. Gaffo AL, Roseman JM, Jacobs DR, Lewis CE, Shikany JM, Mikuls TR, et al. Serum urate and its relationship with alcoholic beverage intake in men and women:findings from the coronary artery risk development in young adults. (CARDIA) Cohort Ann Rheum Dis. (2010) 69:1965–70. doi: 10.1136/ard.2010.129429
Keywords: interaction effect, hyperuricemia, excess adiposity, alcohol intake, modifiable risk factor
Citation: He H, Pan L, Ren X, Wang D, Du J, Cui Z, Zhao J, Wang H, Wang X, Liu F, Pa L, Peng X, Yu C, Wang Y and Shan G (2022) Joint Effect of Beer, Spirits Intake, and Excess Adiposity on Hyperuricemia Among Chinese Male Adults: Evidence From the China National Health Survey. Front. Nutr. 9:806751. doi: 10.3389/fnut.2022.806751
Received: 01 November 2021; Accepted: 04 January 2022;
Published: 22 February 2022.
Edited by:
Weimin Ye, Karolinska Institutet (KI), SwedenReviewed by:
Sitong Luo, Tsinghua University, ChinaXian-E Peng, Fujian Medical University, China
Meihong Xu, Peking University Health Science Centre, China
Copyright © 2022 He, Pan, Ren, Wang, Du, Cui, Zhao, Wang, Wang, Liu, Pa, Peng, Yu, Wang and Shan. This is an open-access article distributed under the terms of the Creative Commons Attribution License (CC BY). The use, distribution or reproduction in other forums is permitted, provided the original author(s) and the copyright owner(s) are credited and that the original publication in this journal is cited, in accordance with accepted academic practice. No use, distribution or reproduction is permitted which does not comply with these terms.
*Correspondence: Guangliang Shan, Z3VhbmdsaWFuZ19zaGFuQDE2My5jb20=