 Xiaojing Feng1†
 Yanyi Yang2†Huiqi Xie1Siqi Zhuang1Yiyuan Fang1Yufeng Dai1Ping Jiang1Hongzhi Chen3,4Haoneng Tang1,3*†
 Lingli Tang1*†
- 1Department of Laboratory Medicine, The Second Xiangya Hospital, Central South University, Changsha, China
- 2Health Management Center of the Second Xiangya Hospital, Central South University, Changsha, China
- 3National Clinical Research Center for Metabolic Disease, The Second Xiangya Hospital, Central South University, Changsha, China
- 4Key Laboratory of Diabetes Immunology, Ministry of Education, Metabolic Syndrome Research Center, Department of Metabolism and Endocrinology, The Second Xiangya Hospital, Central South University, Changsha, China
Purpose: Serum uric acid (UA) not only affects the development of obesity but also alters the metabolic status in obese subjects; thus we investigated the relationship between serum UA and the overweight/obese metabolic phenotypes.
Methods: The demographic, biochemical, and hematological data were collected for 12,876 patients undergoing routine physical examination, and 6,912 participants were enrolled in our study. Participants were classified into four obesity metabolic phenotypes according to their BMI and the presence of metabolic syndrome: metabolically healthy overweight/obese (MHOO), metabolically healthy and normal weighted (MHNW), metabolically abnormal and overweight/obese (MAOO), and metabolically abnormal but normal weighted (MANW). Univariate and multivariate logistic regression analysis, stratified analysis, and also interaction analysis were conducted to analyze the relationship between serum UA and obesity metabolic phenotypes.
Results: Multivariable logistic regression analysis showed that hyperuricemia was positively associated with MHOO, MANW, and MAOO phenotypes relative to MHNW. After adjusting for the confounding factors, the odds ratios (OR) for individuals with hyperuricemia to be MHOO, MANW, and MAOO phenotypes were 1.86 (1.42–2.45), 2.30 (1.44–3.66), and 3.15 (2.34–4.24), respectively. The ORs for having MHOO, MANW, and MAOO increased 6% [OR: 1.06 (1.05–1.07), P < 0.0001], 5% [OR: 1.05 (1.03–1.07), P < 0.0001], and 11% [OR: 1.11 (1.10–1.13), P < 0.0001] for each 10 unit (μmol/L) of increase in serum UA level. Stratification analysis as well as an interaction test showed that sex and age did not interfere with the association of hyperuricemia with each metabolic phenotype. In terms of the components of the metabolic syndrome, after adjusting for other confounding factors including all of the metabolic indicators except itself, hyperuricemia was positively associated with increased BMI [OR: 1.66 (1.32–2.09), P < 0.0001], hypertriglyceridemia [OR: 1.56 (1.21–2.02), P = 0.0006], and hypertension [OR: 1.22 (1.03–1.46), P = 0.0233], while it had no significant association with hyperglycemia and low HDL-C (all P > 0.05).
Conclusion: In our study, we discovered that hyperuricemia was positively associated with MHOO, MANW, and MAOO phenotypes, and this relationship was independent of sex and age.
Introduction
Obesity has been notorious for being the risk factors of multiple diseases, for instance, metabolic abnormalities (1), cardiovascular disease (2), hypertension (3), lung disease (4), and even female infertility (5). A tremendous increase in health expenses related to obesity has also been reported (6, 7). Therefore, understanding the association between obesity and other diseases is crucial for managing the global pandemic of obesity.
However, within overweight/obese subjects, there are differential metabolic profiles, where many are “fat but fit” while others are typically accompanied with metabolic disorders (8). Additionally, there are people who are “unhealthy but normal weight,” that is, although being normal-weighted, they still developed metabolic disorders (9). Therefore, based on the body mass index (BMI) and the presence of components of metabolic syndrome, the overweight/obese metabolic phenotypes may include metabolically healthy overweight/obese (MHOO), metabolically abnormal overweight/obese (MAOO), and metabolically abnormal but normal weight (MANW), and metabolically healthy and normal weight (MHNW) phenotype (10). Studies have indicated that the metabolic phenotypes have significant differences in inflammation levels (11, 12), and the MHOO phenotype was associated with a lower level of systemic inflammation (13). As for MANW subjects, they are also characterized by higher adipose tissue inflammation level compared to MHNW phenotype (14). These findings suggest a crucial role of inflammation in the development of different obesity metabolic phenotypes, which leads to the question of what factors may alter the inflammation and metabolic status in overweight/obese or normal weight subjects.
Uric acid (UA) is an end product of purine metabolism, and its elevation in serum has been significantly associated with the progression of metabolic syndrome (15). It has been well documented as a pro-inflammatory and pro-oxidant substance (16). These properties of UA may result in endothelial dysfunction that may represent a pathogenic mechanism for coronary disease, diabetes, and hypertension (15). Some studies have found that increased fat accumulation in the liver could be induced by UA through endoplasmic reticulum stress and upregulation of lipogenesis, and these metabolic alterations may result in obesity and diabetes (17–19). Interestingly, in addition to the liver, mature adipocytes and adipose tissues were found to be able to produce UA, which may represent an underlying mechanism of the low-grade inflammation and insulin resistance observed in subjects with metabolic syndrome (20, 21). Research also has shown that serum levels of UA are a significant predictor of unhealthy obesity in youth and adults (22). However, whether this association was consistent in other obesity phenotypes remains unknown. In addition, considering sex differences in UA levels, whether the association was influenced by factors such as sex or age has not yet been fully understood.
Therefore, we hypothesized that hyperuricemia is involved in the progression of obesity and may have different associations with various obesity phenotypes. In this study, we performed a retrospective analysis of the relationship between hyperuricemia and various overweight/obese metabolic phenotypes in the Chinese general population and explored the potential role of UA in the differences of various metabolic states in overweight/obese subjects from an epidemiological interpretation.
Materials and Methods
Study Population
This study was approved by the Ethics Committee of Second Xiangya Hospital of Central South University and adhered to the principles of the Declaration of Helsinki. The subjects were participants for physical examination at the Health Management Center of Second Xiangya Hospital of Central South University from January 2019 to December 2019. The total number of the subjects was 12,876, whose age range was from 18 to 75 years. After excluding subjects with missing or erroneous information on covariates, thin (BMI < 18.5 kg/m2), abnormal renal function, severe infections, pregnancy, cancers, and those who were not Chinese, a total of 6,912 eligible subjects were included in the final analysis (Supplementary Figure 1).
Laboratory Measurements
Anthropometric data were collected during the visit for physical examination of the participants. Weight and height were measured according to the recommendations of the World Health Organization, with an accuracy to the nearest 0.1 kg and 0.1 cm respectively, with the participants in light weight clothing without shoes. BMI was calculated as weight/height2 (kg/m2). Blood pressure was measured twice using a digital sphygmomanometer according to the standard protocol in a sitting resting position after at least 5 min of rest.
Blood samples from participants who underwent overnight fasting were collected in the morning and analyzed within an hour in the hospital. The hepatic parameters including alanine aminotransferase (ALT), aspartate aminotransferase (AST), direct bilirubin (DBIL), albumin, total protein (TP), the renal parameters including urea, creatinine (Cr), the lipid parameters including total cholesterol (TC), triglyceride (TG), high-density lipoprotein cholesterol (HDL-C), low-density lipoprotein cholesterol (LDL-C), and UA were measured by Abbott C16000 analyzers (Abbott, Chicago, IL, United States). Fasting plasma glucose (FPG) was measured using the glucose oxidase-peroxidase method in Abbott C16000 analyzers (Abbott, Chicago, IL, United States). Glycated hemoglobin (HbA1c) was measured with high-performance liquid chromatography using Arkray HA-8160 analyzers (Arkray, Tokyo, Japan). The hematological parameters including white cell count (WBC), neutrophil (NEUT), eosinophils (EO), red cell count (RBC), hemoglobin (HGB), hematocrit (HCT), mean corpuscular volume (MCV), mean corpuscular hemoglobin (MCH), and mean corpuscular hemoglobin concentration (MCHC) were detected by Sysmex XN counters (Sysmex, Kobe, Japan).
Definition of Overweight/Obesity, Metabolic Syndrome, Metabolic Phenotypes, and Hyperuricemia
Overweight/obesity is defined as a BMI ≥23 kg/m2 (23). Metabolic abnormalities were identified according to criteria established by the Adult Treatment Panel III of the National Cholesterol Education Program (NCEP-ATPIII) (24, 25). Participants with two or more of the following four components were considered metabolically abnormal: (1) systolic blood pressure (SBP) ≥130 mmHg or diastolic blood pressure(DBP) ≥85 mmHg (elevated blood pressure); (2) FPG ≥ 5.60 mmol/L (elevated FPG); (3) TG ≥1.7 mmol/L (elevated TG); and (4) HDL-C <1.04 mmol/L in men or <1.29 mmol/L in women (low HDL-C) (24, 25). Overweight/obese metabolic phenotypes were defined according to the presence/absence of overweight/obesity and metabolic abnormalities, and all study subjects were classified into four groups: MHNW, MANW, MHOO, and MAOO. Hyperuricemia was defined as serum UA level >428 μmol/L in men or >357 μmol/L in women.
Statistical Analysis
Continuous variables with normal distribution were expressed as mean [standard deviation (SD)] and those with non-normal distribution as median (IQR: 25–75%), while categorical variables were reported as numbers and percentages (%). Differences in continuous variables between the groups were tested using t-test for normally distributed variables and Mann–Whitney U tests for non-normally distributed variables. Differences in categorical variables were analyzed by Chi-square test. The relationship between UA levels and clinic–metabolic parameters was analyzed by the Spearman’s correlation coefficient as well as partial correlation analysis.
Multivariable logistic regression was used to estimate the association of hyperuricemia or UA serum levels (scaled to 10 μmol/L increments) with overweight/obese metabolic phenotypes and its related metabolic indexes. Confounders were screened according to the P value when introducing different indexes into the regression models, and indexes with P value less than 0.1 were included as covariates. Non-adjusted and adjusted models were used to assess confounding. In addition, stratified analyses and interaction analyses by sex, age (<45 years, 45–60 years, ≥60 years) were further conducted.
All statistical analyses were performed using SPSS version 20.0 (SPSS Inc., Chicago, IL, United States), software Empower (R)1 (X & Y Solutions Inc., Boston, MA, United States), and R.2 Two-tailed P < 0.05 was considered statistically significant.
Results
Baseline Characteristics of the Study Population
A total of 6,912 participants were enrolled in our study. Table 1 shows the baseline characteristics of the participants. The percentages of men and women were close (49.83 and 50.17%), with an average age of 48.88 ± 11.85 years. All participants were classified into two groups according to UA levels: normouricemia group and hyperuricemia group. Significant differences were observed in sex composition between the two groups (P < 0.001), where the hyperuricemia group mainly consisted of men (72.14 vs 27.86%), while in the normouricemia group it was similar (47.04 vs 52.96%). The two groups had no significant difference in age but the BMI of the hyperuricemia group was significantly higher than those with normal UA levels (P < 0.001). The average or median value of metabolic indicators (i.e., SBP, DBP, FPG, TG, TC, HDL-C, and LDL-C) in the hyperuricemia group was significantly different from the normouricemic group (all P < 0.05). All of the other laboratory indicators were also significantly different between the two groups (all P < 0.001) except pulse, HbA1c, DBIL, MCV, and MCH.
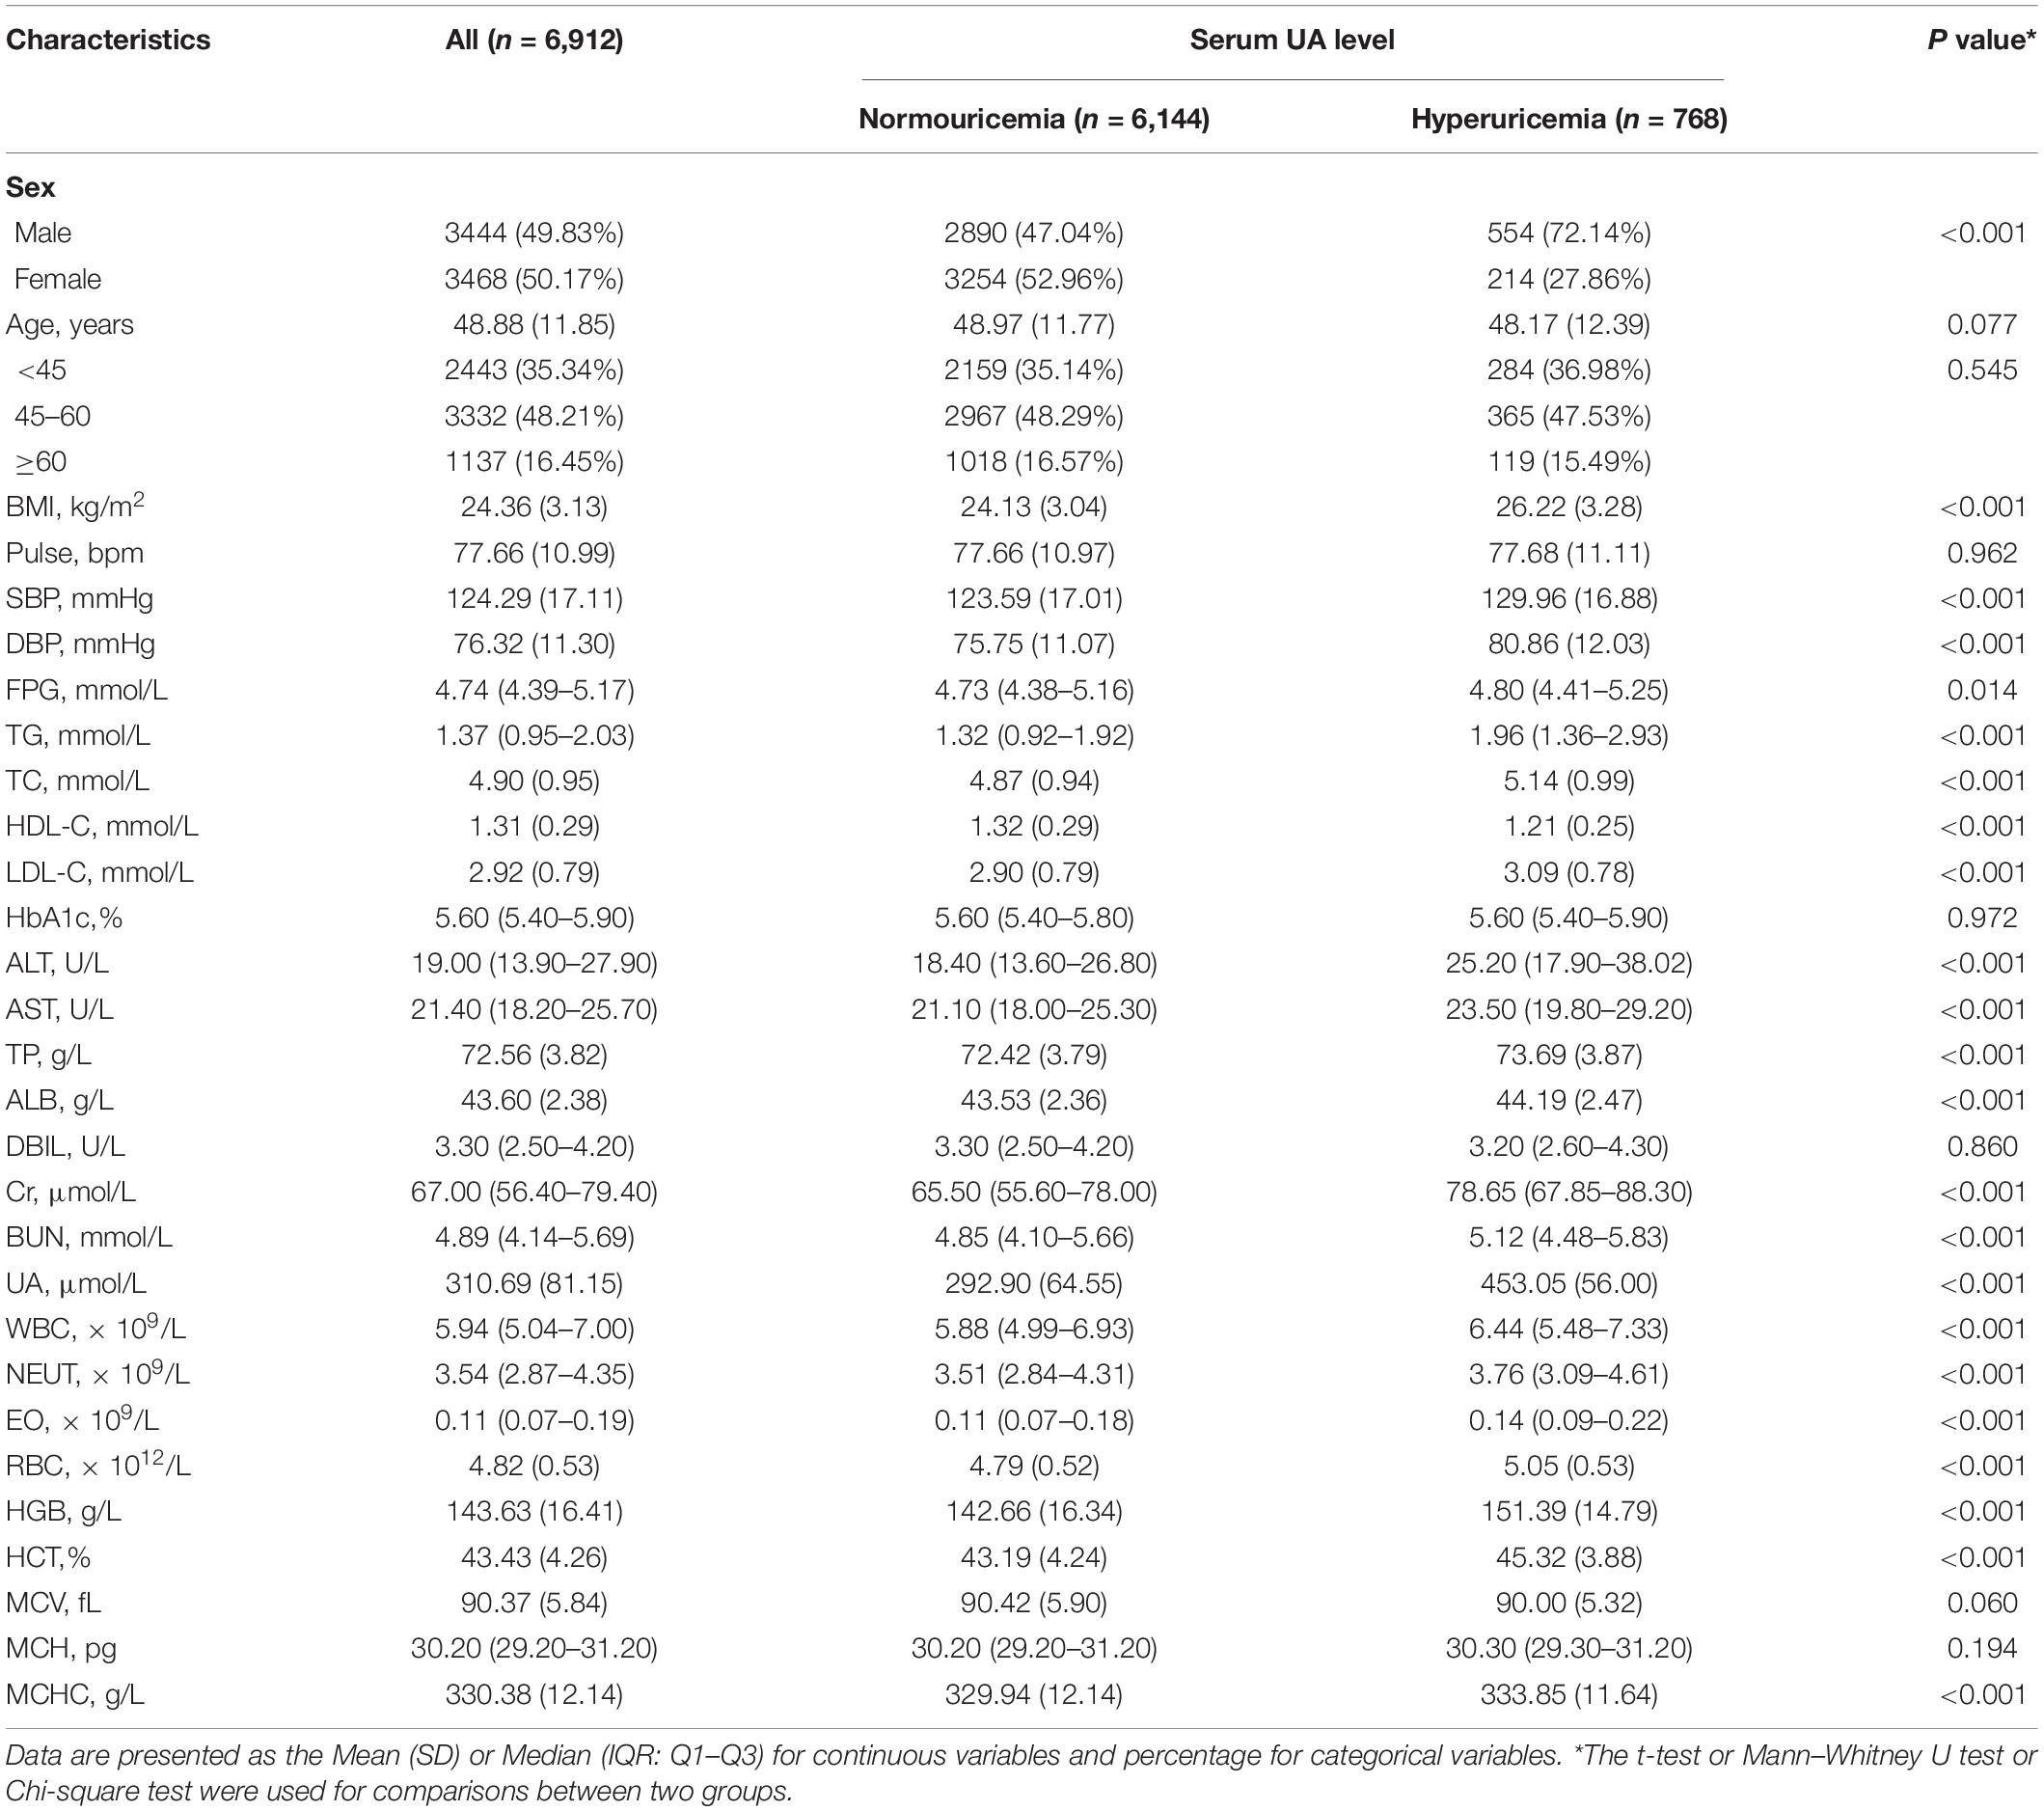
Table 1. Baseline characteristics of the study population.
Prevalence of Different Overweight/Obese Metabolic Phenotypes in Hyperuricemia and Normouricemia Groups
The differences in the proportion of obesity metabolic phenotypes were analyzed in the two groups (Figure 1). When compared with the normouricemic group, the percentage of MAOO phenotype was significantly higher in hyperuricemia group (50.26 vs 26.32%, P < 0.001), while the percentage of MHNW and MANW phenotypes were significantly lower in the hyperuricemia group (11.20 vs 32.75%, P < 0.001; 4.30 vs 6.12%, P = 0.004).
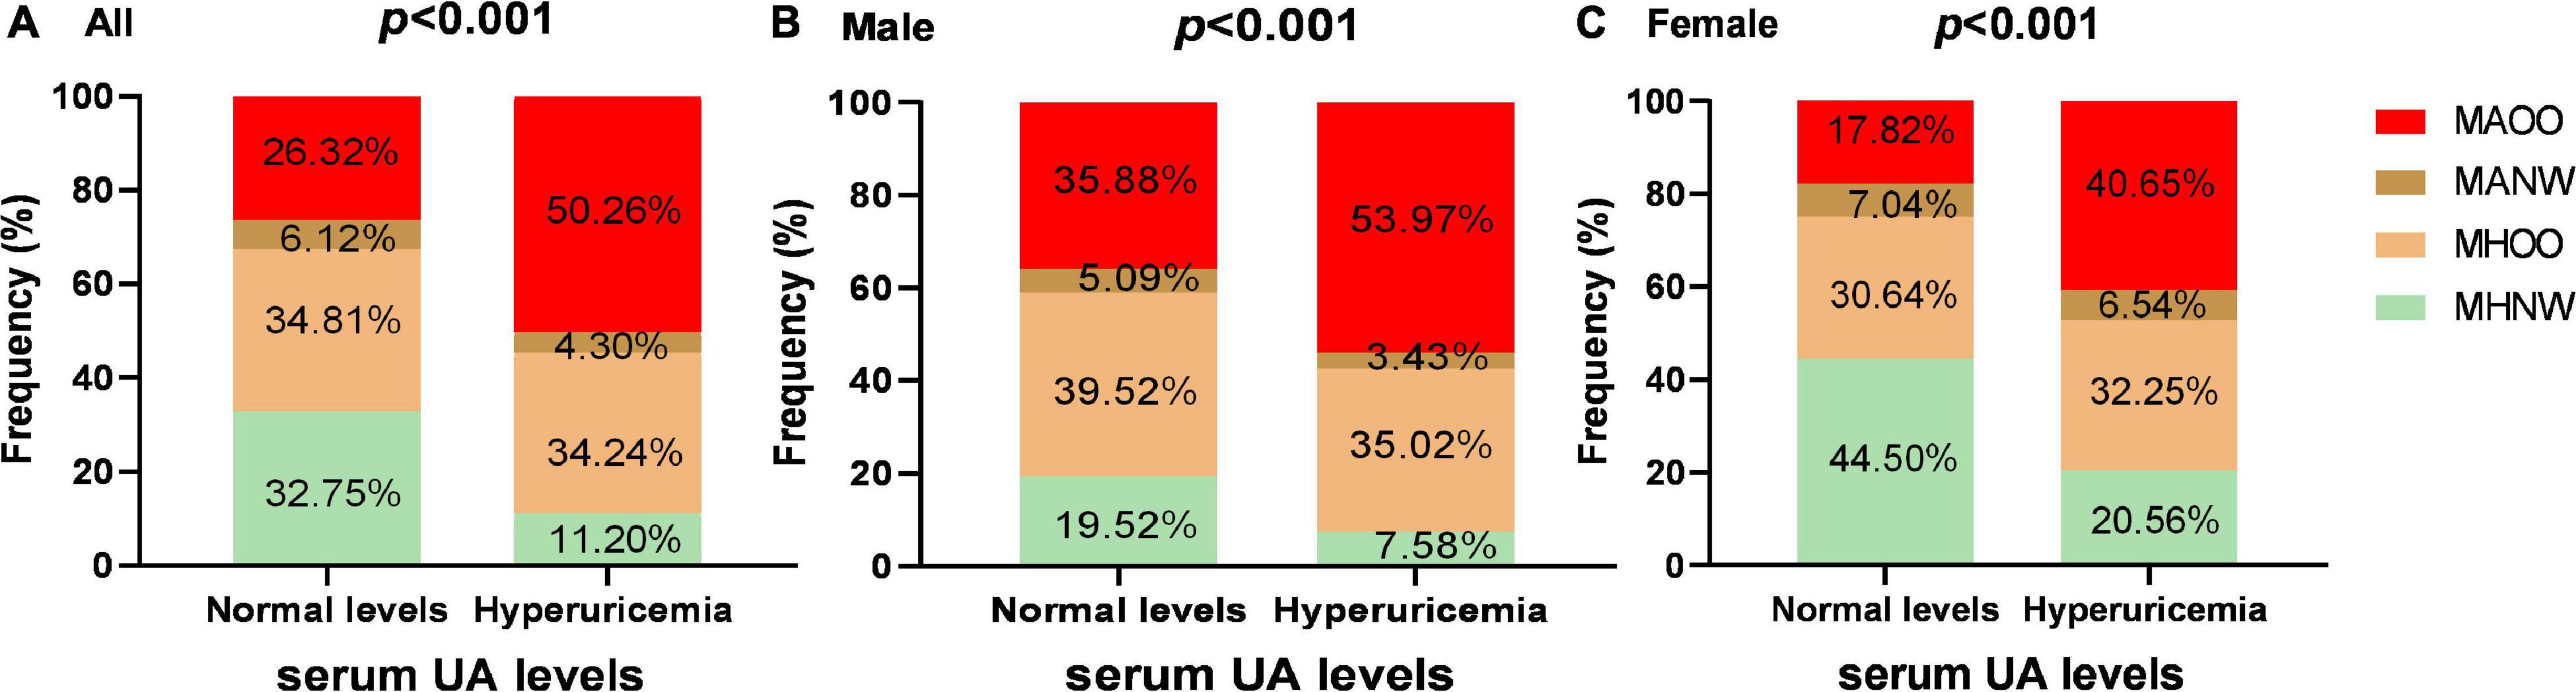
Figure 1. The proportion of obesity metabolic phenotypes among the subjects with hyperuricemia and normal UA levels. Panels (A–C) show the proportion differences of various obesity metabolic phenotypes in hyperuricemia group and normouricemic group in all subjects, men and women, respectively. Differences in the proportion of obesity metabolic phenotypes were analyzed by Chi-square test.
We further stratified the participants according to their sex. Among male participants, percentages of MAOO, MHOO, and MHNW phenotypes were significantly different in hyperuricemia group from the normouricemic group (MAOO: 53.97 vs 35.88%, P < 0.001; MHOO: 35.02 vs 39.52%, P = 0.047; MHNW: 7.58 vs 19.52%, P < 0.001), while the percentage was basically consistent in the MANW phenotype. In female participants, the percentage of two phenotypes were different with significance (MAOO: 40.65 vs 17.82%, P < 0.001; MHNW: 20.56 vs 44.50%, P < 0.001).
Association of the Presence of Hyperuricemia and the Occurrence of Different Overweight/obese Metabolic Phenotypes
Multivariate logistic regression analyses were conducted to investigate the association between hyperuricemia and metabolic phenotypes (Table 2). The results showed that MHOO, MANW, and MAOO phenotypes were all positively associated with hyperuricemia in all the models when using MHNW phenotype as a reference phenotype. After adjusting for all confounding factors, the OR for individuals with hyperuricemia to be MHOO, MANW, and MAOO phenotypes were 1.86(95%CI:1.42–2.45; P < 0.0001), 2.30(95%CI:1.44–3.66; P = 0.0005), and 3.15(95%CI:2.34–4.24; P < 0.0001), respectively. The association between UA serum levels and each phenotype were also analyzed (Table 2). In the analyses adjusted for all relevant confounders, the OR for having MHOO, MANW, and MAOO phenotypes increased by 6% [OR: 1.06 (1.05–1.07), P < 0.0001], 5% [OR: 1.05 (1.03–1.07), P < 0.0001] and 11% [OR: 1.11 (1.10–1.13), P < 0.0001], respectively, for each 10 unit (μmol/L) of increase in UA levels.
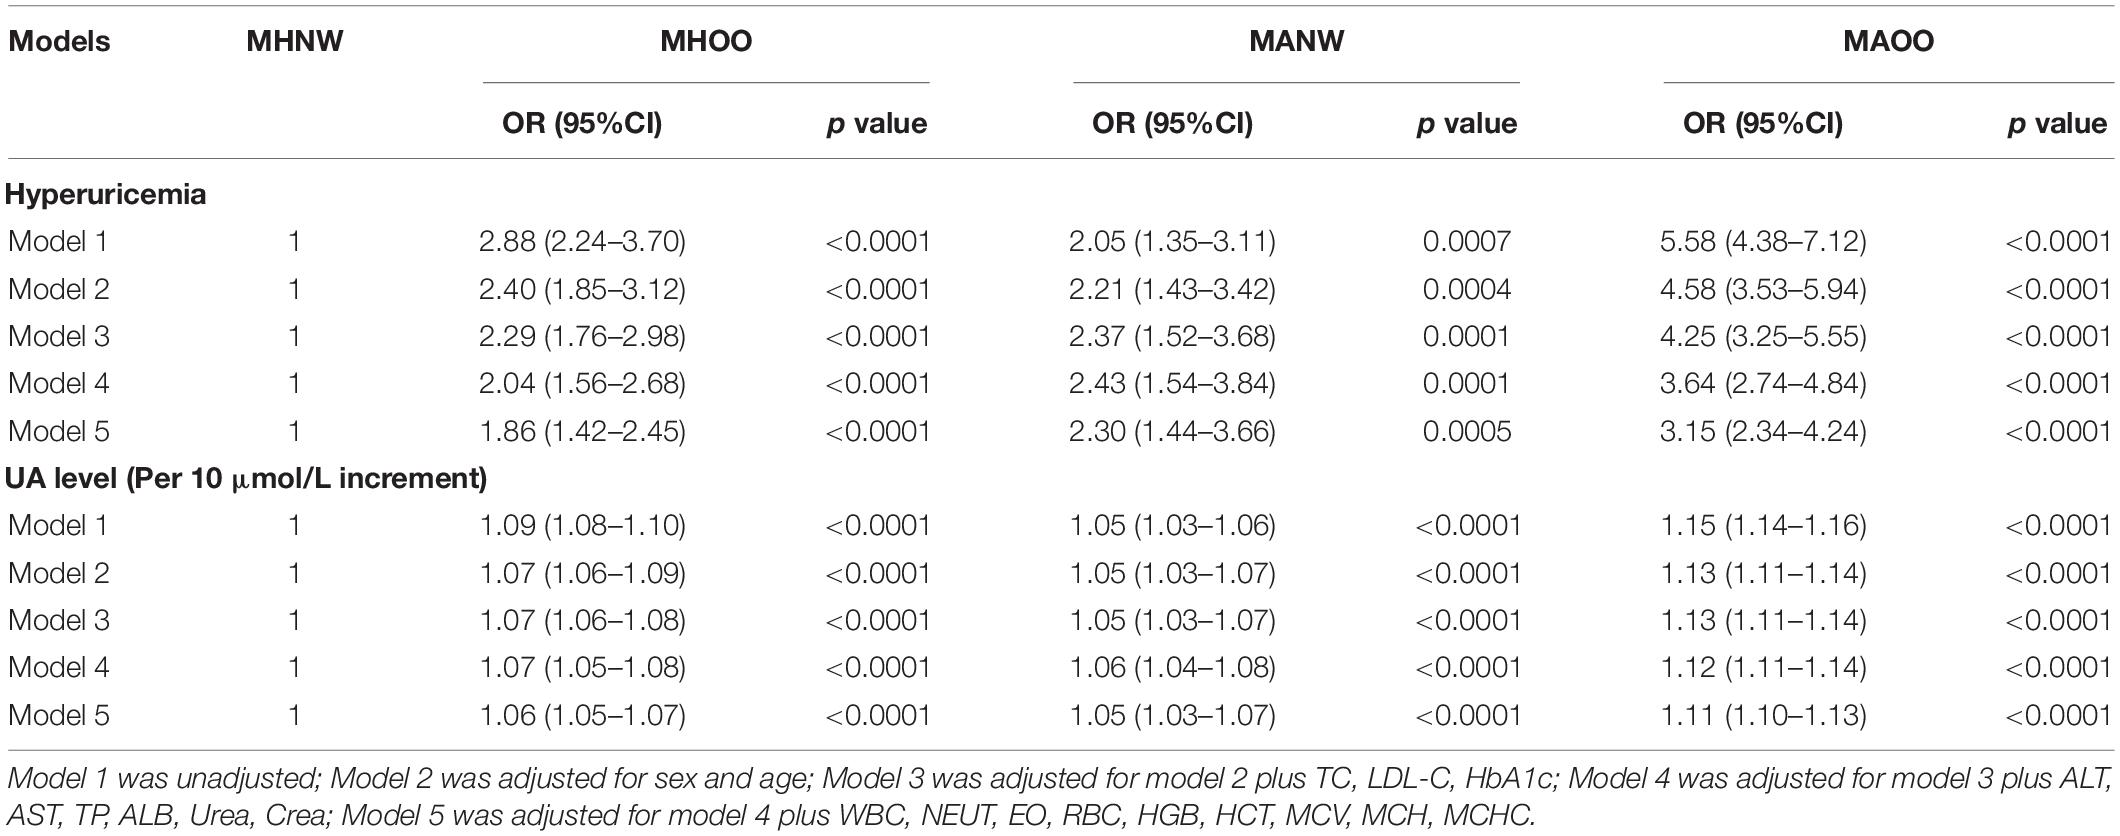
Table 2. Multivariable logistic regression analysis of the association between hyperuricemia and obesity metabolic phenotypes.
Stratification analysis and interaction analysis were further performed to explore whether the positive association between hyperuricemia and metabolic phenotypes were influenced by sex or age (Figure 2). Interaction analysis showed that both sex and age did not significantly interfere with the positive association of hyperuricemia and each phenotype (all P > 0.05). However, the association between hyperuricemia and these phenotypes were different among different sex and age subgroups. Hyperuricemia was significantly associated with all phenotypes in men (all P < 0.05), and was significantly associated with MANW and MAOO phenotypes in women (all P < 0.05). As for age stratification, the positive association between the hyperuricemia and MHOO or MANW phenotype was not significant in people older than 60 years (all P > 0.05), but were significant in those younger than 60 years (all P < 0.05); and hyperuricemia was positively associated with MAOO phenotype in all the age subgroups (all P < 0.01).
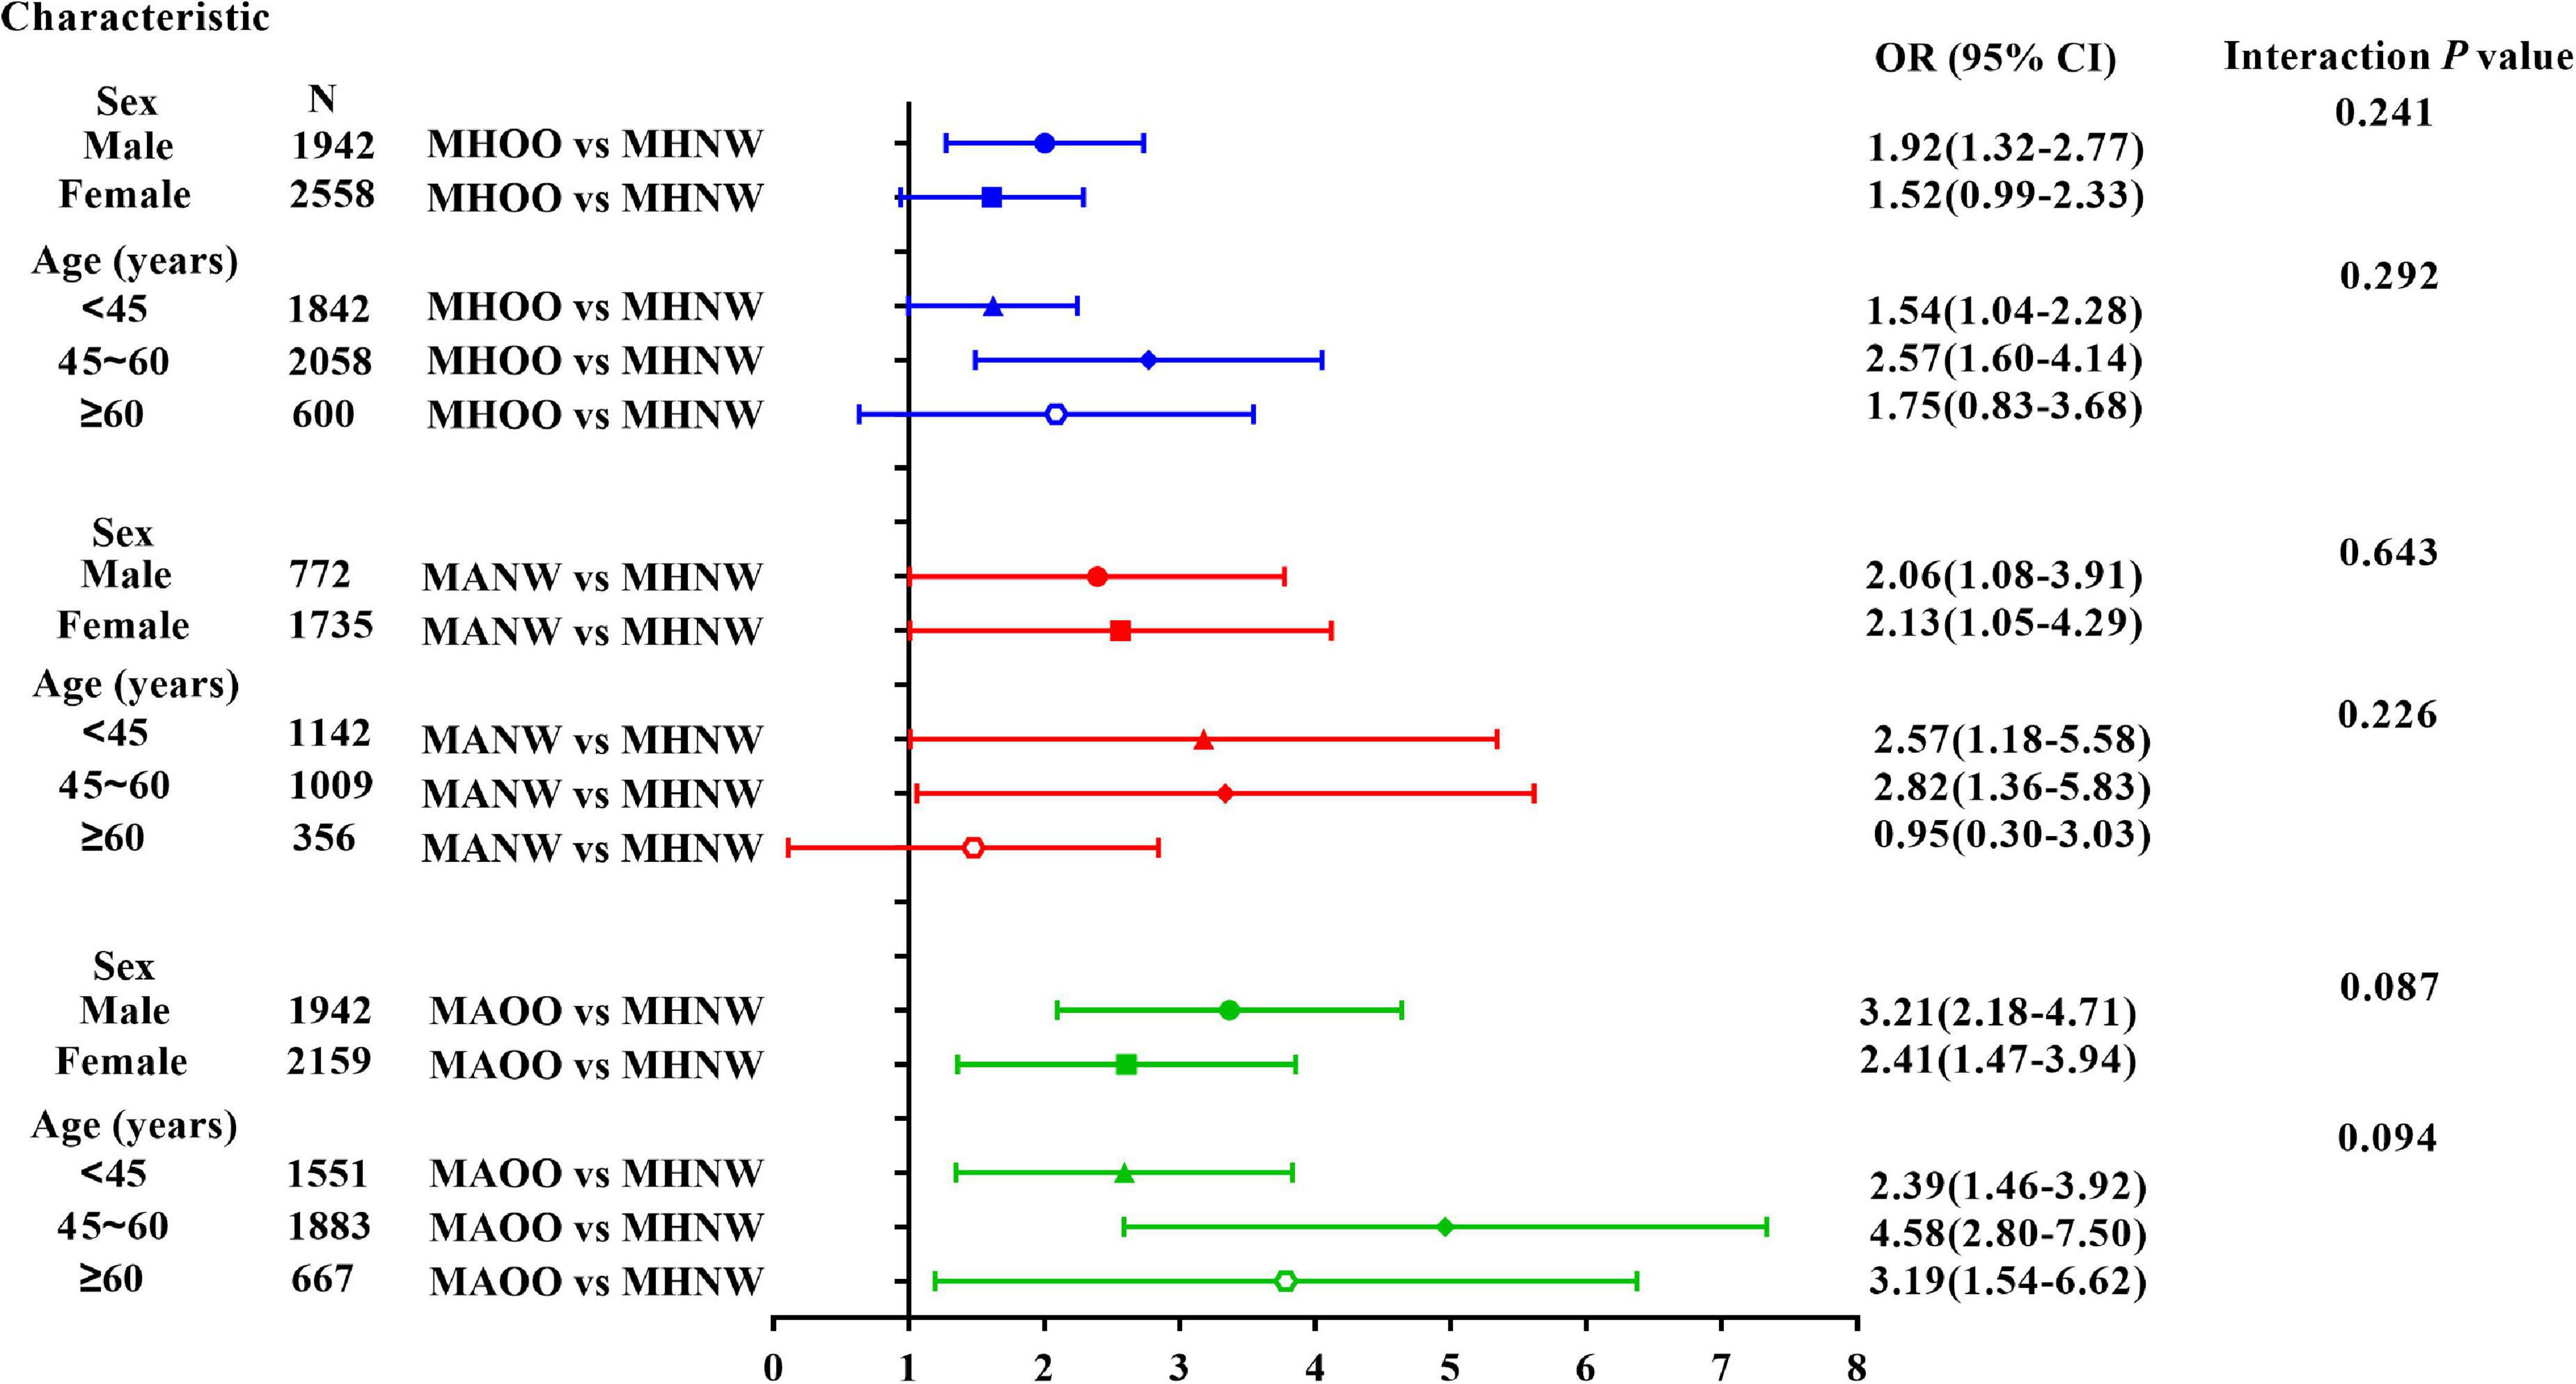
Figure 2. Stratified analyses and interaction tests of the association between hyperuricemia and obesity phenotypes. Models are adjusted for HbA1c, TC, LDL-C, ALT, AST, TP, albumin, Cr, BUN. WBC, NEUT, EO, RBC, HGB, HCT, MCV, MCH, and MCHC.
Correlation Analysis of UA Serum Levels With Clinical and Laboratory Parameters
We then conducted correlation analysis on UA and clinical and laboratory parameters after uncorrected and corrected for confounders (Table 3), and the Spearman correlation analysis results showed that UA was correlated with all indicators. After adjusting for age and sex, partial correlation analysis also showed that except pulse and MCH, UA was still positively associated with BMI, SBP, DBP, TG, TC, LDL-C, TP, Crea, WBC, RBC, HGB, HCT, while negatively correlated with HDL-C.
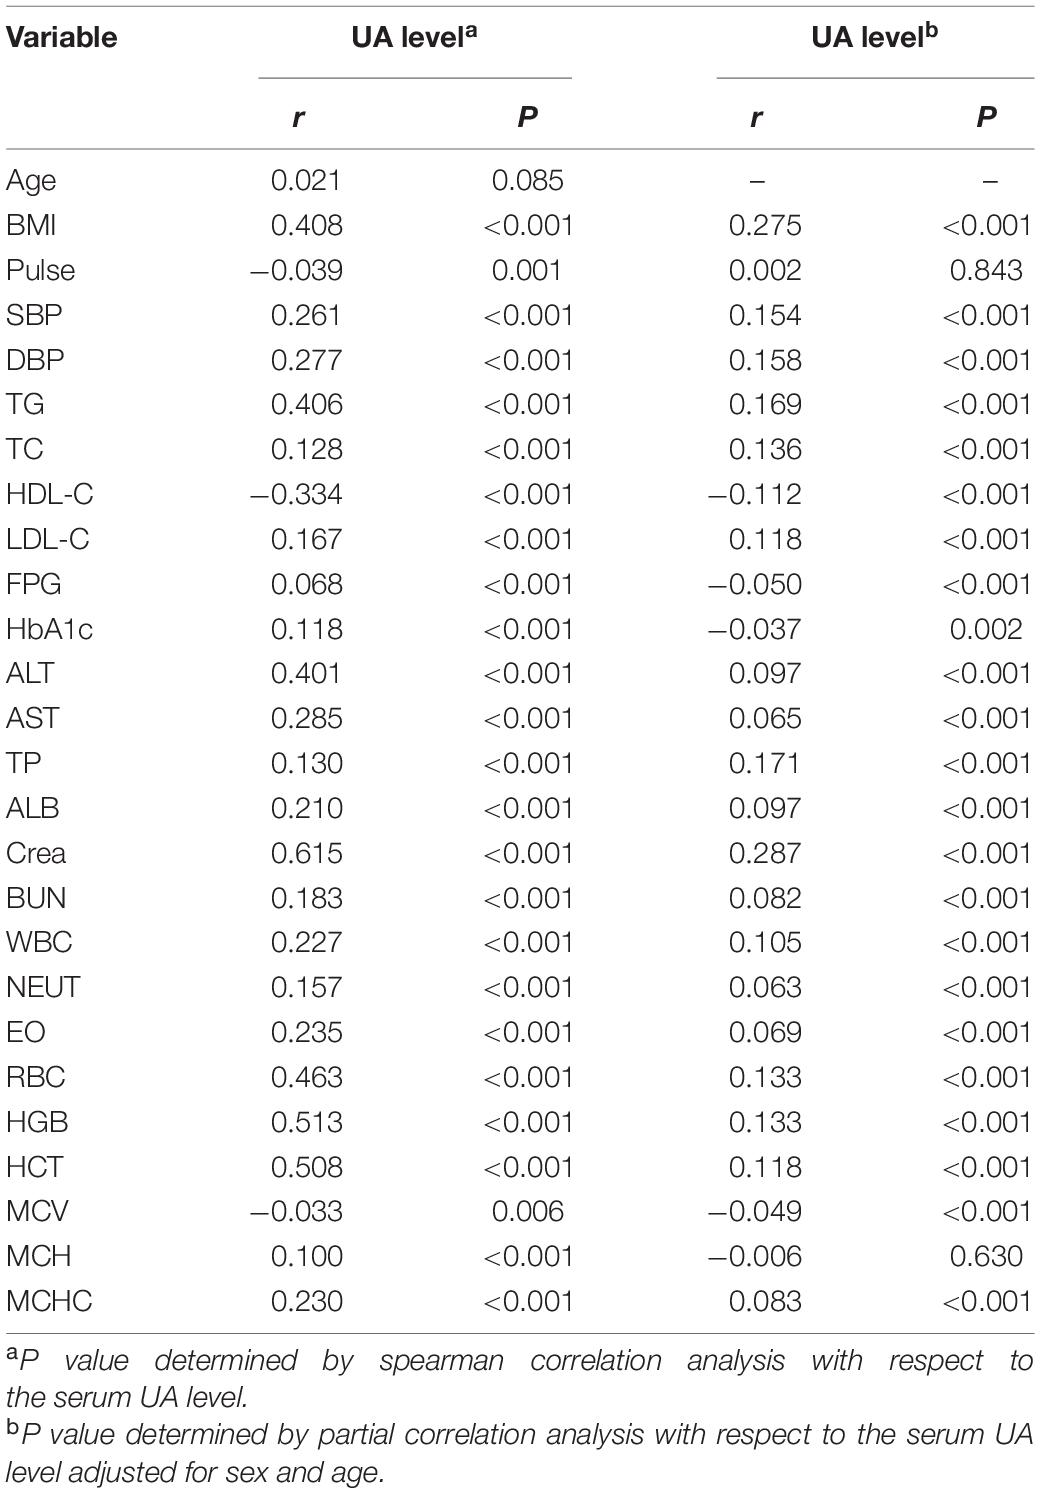
Table 3. Correlations between serum UA levels and anthropometric and laboratory parameters in all individuals.
The Association of Hyperuricemia With Overweight/Obesity and Metabolic Syndrome-Related Components
Since our results showed that UA was weakly correlated with many laboratory indexes, we finally clarified the specific association between hyperuricemia and BMI as well as metabolic syndrome-related components (Table 4). The results showed that hyperuricemia was positively associated with increased BMI in all models [Model 3: OR: 1.66 (1.32–2.09), P < 0.0001]. In terms of each metabolic disorders, after adjusting for other confounding factors, including all of the metabolic indicators except itself, hyperuricemia had a significant positive association with hypertension [OR: 1.22 (1.03–1.46), P = 0.0233] and hypertriglyceridemia [OR: 1.56 (1.21–2.02), P = 0.0006], while it had no significant association with hyperglycemia and low HDL-C (all P > 0.05).
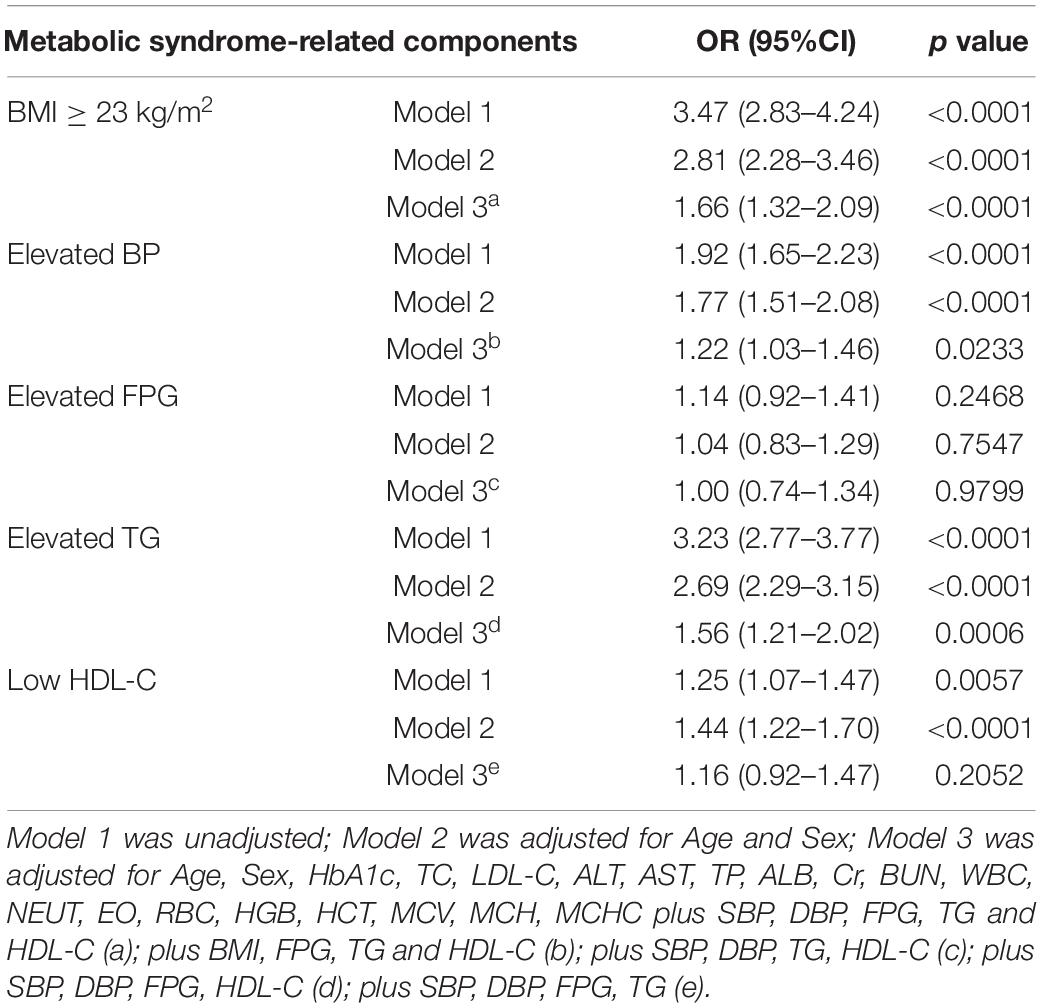
Table 4. The association between hyperuricemia and overweight/obese and metabolic dysfunction in all subjects.
Discussion
Numerous studies have confirmed that overweight/obese people may be accompanied with various metabolic phenotypes (10, 12, 14, 26). In this retrospective study among general population who underwent routine physical examination, we discovered that hyperuricemia as well as the increase of UA level was positively associated with the presence of MHOO, MANW, and MAOO phenotypes.
Hyperuricemia has been reported to be more manifest in male subjects (27), which is similar to our data. In patients with hyperuricemia, deposition of UA in joints and tissues promotes the occurrence of gout and metabolic disorders (28). Consistent with that conclusion, our data showed that participants with hyperuricemia display higher BMI, SBP, DBP, FPG, TG, TC, LDL-C levels, and lower HDL-C levels when compared with subjects with normouricemia. Our results found that MAOO phenotype was significantly more prone to occur in participants with hyperuricemia in both men and women. These results suggested that hyperuricemia may be closely associated with metabolic disorders, obesity, and its phenotypes, and their interactions may appear to be complex.
Previous studies have shown that obesity and its phenotypes are significantly associated with the risk of hyperuricemia, and the relationship are sex-specific and age-specific differences (29–31). In the Chinese population, Tian et al. suggested that the MHOO phenotype was significantly associated with the risk of hyperuricemia only in women and not in men from the China Health and Nutrition Survey (30). Yu et al. found that MUOO, in comparison with MHOO, was significantly associated with hyperuricemia in Chinese adults (29). High serum UA levels have long been considered a potential master conductor in metabolic syndrome and fat storage (17, 32), but it is still unknown whether serum UA is a risk factor of obesity-related metabolic phenotypes in Chinese population. Thus, our study analyzed the effect of hyperuricemia on various obesity phenotypes from comprehensive perspective.
In an Austrian study, serum UA was a significant predictor of unhealthy obesity in juveniles and adults (22). However, our results have shown that the presence of hyperuricemia or the increase of UA level was associated with the risk of MHOO, MANW, and MAOO phenotypes, and the association did not differ by sex and age, but have some different characteristics among different sex-based and age-based subgroups. As we all know, people with various obesity metabolic phenotypes have different metabolic characteristics, risk, mortality of disease, and quality of life (9, 11, 33). Many studies have shown that hyperuricemia has emerged as a risk marker for clinical diseases including cardiovascular disease, chronic kidney disease, metabolic disease, and premature mortality (34). Thus, we speculated that the association between elevated UA and different obesity phenotypes may be a contributory causal factor for progress of various obesity phenotypes. In addition, features of obesity phenotypes in different sex and age have shown complex results according to previous studies (35, 36). Our study also reflected that the effect of hyperuricemia on different metabolic phenotypes was quite different in both sex and different age subgroups. Taken together, further research on the association between hyperuricemia and obesity phenotypes in different population is significant and indispensable for clinically individualized therapeutic approaches.
The present study further showed that hyperuricemia was significantly associated with obesity phenotypes-related variables such as elevated TG and elevated BP but not elevated FPG and low HDL-C, which is slightly different from other studies. Many epidemiological studies have demonstrated a strong association between UA and various metabolic syndrome-related components, but the association could be differed by study objects (37–39). Nejatinamini et al. found that UA was positively correlated with triglycerides, and negatively with HDL-C in 101 non-smoking Iranians (39). Tian et al. suggested that elevated serum UA concentration was shown to be associated with central obesity and hypertension in middle aged and elderly Chinese (38). In addition, a prospective study demonstrated that serum UA predicts incident metabolic syndrome in the elderly in an analysis of the Brisighella Heart Study (40). Review has concluded that the underlying biological mechanism between hyperuricemia and obesity phenotypes-related components is closely associated with oxidative stress and inflammatory induced by elevated serum UA (32). Compared to previous studies, subjects in the present study were the physical examination population, which suggested that the relationship between hyperuricemia and obesity phenotypes-related variables may have their own characteristics in different populations. Meanwhile, it is time to recommend definitive, large-scale clinical trials to determine whether lowering UA can be beneficial in the treatment and prevention of overweight/obesity, hypertension, dyslipidemia, and insulin resistance.
Some highlights of this study are worth mentioning. Our study is a comprehensive analysis of a large cohort with the major anthropometric data, and conventional biochemical and hematological parameters. The combined use of multiple regression, stratification analysis, and interaction analysis can ensure the reliability of the conclusion. Moreover, it was found that hyperuricemia was positively associated with MHOO, MANW, and MAOO phenotypes to varying degrees and these relationships were not affected by sex or age, which could be expected to provide a theoretical basis for clinical application.
There are some drawbacks of our study that are worth considering. First, as a retrospective cross-sectional study, we were unable to determine the causal relationship between hyperuricemia and obesity phenotype. Second, we did not have access to the body fat content of the participants for some reasons, so a more accurate metabolic classification of obesity is not possible. Third, the data of dietary intake (e.g., intake of foods rich in the sources of UA, intake of saturated and unsaturated fatty acids) were not available due to some reasons. Fourth, the results of sex stratification may be partially affected by menstruation, menopause, and contraceptives (41–43), data of which we did not obtain due to the lack of patient inquiry in health examination. In future researches, we may also collect data on inflammatory cytokines and saturated fat to further explore the potential relationship among UA, inflammation, and the metabolic phenotypes of obesity.
Conclusion
In our study, hyperuricemia was positively associated with MHOO, MANW, and MAOO phenotypes, and these relationships were not affected by sex or age. Moreover, hyperuricemia was associated differently with various overweight/obesity-related metabolic disorders in the Chinese general population. To sum up, our research provided theoretical basis on the important role of UA for the different metabolic status among Chinese general population, and there needs to be more researches to study the degree of role in different populations for precise prevention and treatment.
Data Availability Statement
The raw data supporting the conclusions of this article will be made available by the authors, without undue reservation.
Ethics Statement
The study involving human participants were reviewed and approved by the Ethics Committee of Second Xiangya Hospital of Central South University. Written informed consent for participation was not required for this study in accordance with the national legislation and the institutional requirements.
Author Contributions
LT and HT designed the study and revised the manuscript. XF, YY, HX, SZ, YF, YD, PJ, HC, and HT conducted the research. XF, YY, and HT analyzed the data. XF, YY, and HX wrote the manuscript. All authors read and approved the final manuscript.
Funding
This work was supported by the Natural Scientific Foundation of Hunan Province (Grant Number 2021JJ40867) and National Natural Scientific Foundation of China (Grant Numbers 81970746).
Conflict of Interest
The authors declare that the research was conducted in the absence of any commercial or financial relationships that could be construed as a potential conflict of interest.
Publisher’s Note
All claims expressed in this article are solely those of the authors and do not necessarily represent those of their affiliated organizations, or those of the publisher, the editors and the reviewers. Any product that may be evaluated in this article, or claim that may be made by its manufacturer, is not guaranteed or endorsed by the publisher.
Supplementary Material
The Supplementary Material for this article can be found online at: https://www.frontiersin.org/articles/10.3389/fnut.2022.773220/full#supplementary-material
Supplementary Figure 1 | Flow chart of the study population.
Footnotes
References
1. Caballero B. Humans against obesity: who will win? Adv Nutr (Bethesda Md). (2019) 10(Suppl. 1):S4–9. doi: 10.1093/advances/nmy055
2. Alpert MA, Omran J, Bostick BP. Effects of obesity on cardiovascular hemodynamics, cardiac morphology, and ventricular function. Curr Obes Rep. (2016) 5:424–34. doi: 10.1007/s13679-016-0235-6
3. Seravalle G, Grassi G. Obesity and hypertension. Pharmacol Res. (2017) 122:1–7. doi: 10.1016/j.phrs.2017.05.013
4. Peters U, Dixon AE, Forno E. Obesity and asthma. J Aller Clin Immunol. (2018) 141:1169–79. doi: 10.1016/j.jaci.2018.02.004
5. Broughton DE, Moley KH. Obesity and female infertility: potential mediators of obesity’s impact. Fertil Steril. (2017) 107:840–7. doi: 10.1016/j.fertnstert.2017.01.017
6. Wharton S, Lau DCW, Vallis M, Sharma AM, Biertho L, Campbell-Scherer D, et al. Obesity in adults: a clinical practice guideline. Canad Med Associat J. (2020) 192:E875–91. doi: 10.1503/cmaj.191707
7. Kuroki M. Obesity and bankruptcy: evidence from US COUNTIES. Econom Hum Biol. (2020) 38:100873–80. doi: 10.1016/j.ehb.2020.100873
9. Stefan N, Schick F, Häring HU. Causes, characteristics, and consequences of metabolically unhealthy normal weight in humans. Cell Metab. (2017) 26:292–300. doi: 10.1016/j.cmet.2017.07.008
10. Goossens GH. The metabolic phenotype in obesity: fat mass, body fat distribution, and adipose tissue function. Obesity Facts. (2017) 10207–15. doi: 10.1159/000471488
11. Phillips CM, Perry IJ. Does inflammation determine metabolic health status in obese and nonobese adults? J Clin Endocrinol Metab. (2013) 98:E1610–9. doi: 10.1210/jc.2013-2038
12. Gonçalves CG, Glade MJ, Meguid MM. Metabolically healthy obese individuals: key protective factors. Nutrition (Burbank Los Angeles County Calif). (2016) 32:14–20. doi: 10.1016/j.nut.2015.07.010
13. Bala C, Craciun AE, Hancu N. Updating the concept of metabolically healthy obesity. Acta Endocrinol (Bucharest Romania 2005). (2016) 12:197–205. doi: 10.4183/aeb.2016.197
14. Ding C, Chan Z, Magkos F. Lean, but not healthy: the ‘metabolically obese, normal-weight’ phenotype. Curr Opin Clin Nutrit Metab Care. (2016) 19:408–17. doi: 10.1097/mco.0000000000000317
15. Battelli MG, Bortolotti M, Polito L, Bolognesi A. The role of xanthine oxidoreductase and uric acid in metabolic syndrome. Biochim Biophys Acta Mol Bas Dis. (2018) 1864:2557–65. doi: 10.1016/j.bbadis.2018.05.003
16. Braga TT, Davanso MR, Mendes D, de Souza TA, de Brito AF, Cruz MC, et al. Sensing soluble uric acid by Naip1-Nlrp3 platform. Cell Death Dis. (2021) 12:158–72. doi: 10.1038/s41419-021-03445-w
17. King C, Lanaspa MA, Jensen T, Tolan DR, Sánchez-Lozada LG, Johnson RJ. Uric acid as a cause of the metabolic syndrome. Contribut Nephrol. (2018) 192:88–102. doi: 10.1159/000484283
18. Johnson RJ, Sánchez-Lozada LG, Andrews P, Lanaspa MA. Perspective: a historical and scientific perspective of sugar and its relation with obesity and diabetes. Adv Nutr (Bethesda Md). (2017) 8:412–22. doi: 10.3945/an.116.014654
19. Kushiyama A, Nakatsu Y, Matsunaga Y, Yamamotoya T, Mori K, Ueda K, et al. Role of uric acid metabolism-related inflammation in the pathogenesis of metabolic syndrome components such as atherosclerosis and nonalcoholic steatohepatitis. Mediat Inflam. (2016) 2016:8603164. doi: 10.1155/2016/8603164
20. Tsushima Y, Nishizawa H, Tochino Y, Nakatsuji H, Sekimoto R, Nagao H, et al. Uric acid secretion from adipose tissue and its increase in obesity. J Biol Chem. (2013) 288:27138–49. doi: 10.1074/jbc.M113.485094
21. Lima WG, Martins-Santos ME, Chaves VE. Uric acid as a modulator of glucose and lipid metabolism. Biochimie. (2015) 116:17–23. doi: 10.1016/j.biochi.2015.06.025
22. Mangge H, Zelzer S, Puerstner P, Schnedl WJ, Reeves G, Postolache TT, et al. Uric acid best predicts metabolically unhealthy obesity with increased cardiovascular risk in youth and adults. Obesity (Silver Spring Md). (2013) 21:E71–7. doi: 10.1002/oby.20061
23. Weir CB, Jan ABMI. Classification Percentile And Cut Off Points. StatPearls. Treasure Island, FL: StatPearls Publishing (2021).
24. Tang H, Liu N, Feng X, Yang Y, Fang Y, Zhuang S, et al. Circulating levels of IL-33 are elevated by obesity and positively correlated with metabolic disorders in Chinese adults. J Transl Med. (2021) 19:52–63. doi: 10.1186/s12967-021-02711-x
25. Tang HN, Xiao F, Chen YR, Zhuang SQ, Guo Y, Wu HX, et al. Higher serum neuropeptide Y levels are associated with metabolically unhealthy obesity in obese chinese adults: a cross-sectional study. Mediat Inflam. (2020) 2020:1–9. doi: 10.1155/2020/7903140
26. Chen Y, Zhang N, Sun G, Guo X, Yu S, Yang H, et al. Metabolically healthy obesity also has risk for hyperuricemia among Chinese general population: a cross-sectional study. Obes Res Clin Pract. (2016) 10(Suppl. 1):S84–95. doi: 10.1016/j.orcp.2016.03.008
27. Han B, Wang N, Chen Y, Li Q, Zhu C, Chen Y, et al. Prevalence of hyperuricaemia in an Eastern Chinese population: a cross-sectional study. BMJ open. (2020) 10:1–7. doi: 10.1136/bmjopen-2019-035614
28. Jeong J, Suh YJ. Association between Serum Uric Acid and Metabolic Syndrome in Koreans. J Kor Med Sci. (2019) 34:1–9. doi: 10.3346/jkms.2019.34.e307
29. Yu J, Sun H, Zhu J, Wei X, Shi H, Shen B, et al. Asymptomatic hyperuricemia and metabolically unhealthy obesity: a cross-sectional analysis in the tianning cohort. Diab Metab Syndr Obes. (2021) 14:1367–74. doi: 10.2147/dmso.s301363
30. Tian S, Liu Y, Feng A, Zhang S. Sex-specific differences in the association of metabolically healthy obesity with hyperuricemia and a network perspective in analyzing factors related to hyperuricemia. Front Endocrinol. (2020) 11:573452. doi: 10.3389/fendo.2020.573452
31. Kim IY, Han KD, Kim DH, Eun Y, Cha HS, Koh EM, et al. Women with metabolic syndrome and general obesity are at a higher risk for significant hyperuricemia compared to men. J Clin Med. (2019) 8:1–14. doi: 10.3390/jcm8060837
32. Kanbay M, Jensen T, Solak Y, Le M, Roncal-Jimenez C, Rivard C, et al. Uric acid in metabolic syndrome: from an innocent bystander to a central player. Eur J Int Med. (2016) 29:3–8. doi: 10.1016/j.ejim.2015.11.026
33. Liu C, Wang C, Guan S, Liu H, Wu X, Zhang Z, et al. The prevalence of metabolically healthy and unhealthy obesity according to different criteria. Obes Fact. (2019) 12:78–90. doi: 10.1159/000495852
34. Chen-Xu M, Yokose C, Rai SK, Pillinger MH, Choi HK. Contemporary prevalence of gout and hyperuricemia in the united states and decadal trends: the national health and nutrition examination survey, 2007-2016. Arthr Rheumatol (Hoboken NJ). (2019) 71:991–9. doi: 10.1002/art.40807
35. Camhi SM, Katzmarzyk PT. Differences in body composition between metabolically healthy obese and metabolically abnormal obese adults. Int J Obes (2005). (2014) 38:1142–5. doi: 10.1038/ijo.2013.208
36. Kronenberg F, Paulweber B, Lamina C. [Genomwide association studies on obesity: what can we learn from these studies]. Wiener Med Wochens (1946). (2016) 166:88–94. doi: 10.1007/s10354-015-0429-7
37. Zhang J, Zhu W, Qiu L, Huang L, Fang L. Sex- and age-specific optimal anthropometric indices as screening tools for metabolic syndrome in chinese adults. Int J Endocrinol. (2018) 2018:1–16. doi: 10.1155/2018/1067603
38. Tian Y, Chen K, Xie Z, Fang Y, Wang H, Nie Y, et al. The association between serum uric acid levels, metabolic syndrome and cardiovascular disease in middle aged and elderly Chinese: results from the DYSlipidemia International Study. BMC Cardiovas Disord. (2015) 15:66–76. doi: 10.1186/s12872-015-0059-4
39. Nejatinamini S, Ataie-Jafari A, Qorbani M, Nikoohemat S, Kelishadi R, Asayesh H, et al. Association between serum uric acid level and metabolic syndrome components. J Diabet Metab Disord. (2015) 14:70–7. doi: 10.1186/s40200-015-0200-z
40. Cicero AFG, Fogacci F, Giovannini M, Grandi E, Rosticci M, D’Addato S, et al. Serum uric acid predicts incident metabolic syndrome in the elderly in an analysis of the Brisighella Heart Study. Sci Rep. (2018) 8:1–6. doi: 10.1038/s41598-018-29955-w
41. Cho SK, Winkler CA, Lee SJ, Chang Y, Ryu S. The prevalence of hyperuricemia sharply increases from the late menopausal transition stage in middle-aged women. J Clin Med. (2019) 8:1–11. doi: 10.3390/jcm8030296
42. Li Y, Chen S, Shao X, Guo J, Liu X, Liu A, et al. Association of uric acid with metabolic syndrome in men, premenopausal women and postmenopausal women. Int J Environ Res Public Health. (2014) 11:2899–910. doi: 10.3390/ijerph110302899
Keywords: obesity, uric acid, hyperuricemia, metabolic phenotypes, overweight
Citation: Feng X, Yang Y, Xie H, Zhuang S, Fang Y, Dai Y, Jiang P, Chen H, Tang H and Tang L (2022) The Association Between Hyperuricemia and Obesity Metabolic Phenotypes in Chinese General Population: A Retrospective Analysis. Front. Nutr. 9:773220. doi: 10.3389/fnut.2022.773220
Received: 09 September 2021; Accepted: 24 February 2022;
Published: 18 April 2022.
Edited by:
Arne Astrup, Novo Nordisk Foundation, DenmarkReviewed by:
Mostafa Waly, Sultan Qaboos University, OmanKatarina Sebekova, Comenius University, Slovakia
Copyright © 2022 Feng, Yang, Xie, Zhuang, Fang, Dai, Jiang, Chen, Tang and Tang. This is an open-access article distributed under the terms of the Creative Commons Attribution License (CC BY). The use, distribution or reproduction in other forums is permitted, provided the original author(s) and the copyright owner(s) are credited and that the original publication in this journal is cited, in accordance with accepted academic practice. No use, distribution or reproduction is permitted which does not comply with these terms.
*Correspondence: Lingli Tang, bGluZ2xpdGFuZ0Bjc3UuZWR1LmNu; Haoneng Tang, NTA1NDYyQGNzdS5lZHUuY24=
†These authors have contributed equally to this work