 Martin Jáni
 Lenka Zacková1,3
 Pavel Piler
 Milan Brázdil
 Klára Marečková
94% of researchers rate our articles as excellent or good
Learn more about the work of our research integrity team to safeguard the quality of each article we publish.
Find out more
ORIGINAL RESEARCH article
Front. Nutr., 10 January 2023
Sec. Clinical Nutrition
Volume 9 - 2022 | https://doi.org/10.3389/fnut.2022.1100237
This article is part of the Research TopicBiomarkers: Precision Nutrition in Chronic DiseasesView all 26 articles
Background: Biological aging and particularly the deviations between biological and chronological age are better predictors of health than chronological age alone. However, the predictors of accelerated biological aging are not very well understood. The aim was to determine the role of birth outcomes, time of puberty onset, body mass index (BMI), and body fat in accelerated biological aging in the third decade of life.
Methods: We have conducted a second follow-up of the Czech part of the European Longitudinal Study of Pregnancy and Childhood (ELSPAC-CZ) prenatal birth cohort in young adulthood (52% male; age 28–30; n = 262) to determine the role of birth outcomes, pubertal timing, BMI, and body fat on biological aging. Birth outcomes included birth weight, length, and gestational age at birth. Pubertal timing was determined by the presence of secondary sexual characteristics at the age of 11 and the age of first menarche in women. Biological age was estimated using the Klemera-Doubal Method (KDM), which applies 9-biomarker algorithm including forced expiratory volume in one second (FEV1), systolic blood pressure, glycated hemoglobin, total cholesterol, C-reactive protein, creatinine, urea nitrogen, albumin, and alkaline phosphatase. Accelerated/decelerated aging was determined as the difference between biological and chronological age (BioAGE).
Results: The deviations between biological and chronological age in young adulthood ranged from −2.84 to 4.39 years. Accelerated biological aging was predicted by higher BMI [in both early (R2adj = 0.05) and late 20s (R2adj = 0.22)], subcutaneous (R2adj = 0.21) and visceral fat (R2adj = 0.25), puberty onset (ηp2 = 0.07), birth length (R2adj = 0.03), and the increase of BMI over the 5-year period between the two follow-ups in young adulthood (R2adj = 0.09). Single hierarchical model revealed that shorter birth length, early puberty onset, and greater levels of visceral fat were the main predictors, together explaining 21% of variance in accelerated biological aging.
Conclusion: Our findings provide comprehensive support of the Life History Theory, suggesting that early life adversity might trigger accelerated aging, which leads to earlier onset of puberty but decreasing fitness in adulthood, reflected by more visceral fat and higher BMI. Our findings also suggest that reduction of BMI in young adulthood slows down biological aging.
We live in an era of unprecedented aging (1). The percentage of people aged 65 and higher worldwide was 9% in 2019 and is expected to rise to 12% by 2030 and to 16% by 2050 (2). This increase in lifespan brings a proportional increase in age-related disease (3, 4). Previous research suggested that age-related changes in the organism accumulate well before the onset of disease and that even early life factors contribute to the speed of aging (5–7). In order to intervene early, a better understanding of the age-related changes and early detection of the altered aging trajectory is crucial (8).
To measure the aging process, US National Health and Nutrition Survey (NHANES) studied participants aged 30–75 years and developed a 10-biomarker-based measure of “Biological Age”, which was more successful in predicting mortality in the 20-year follow-up than chronological age (9). Using the NHANES algorithm, Belsky et al. (8) calculated the Biological Age of Dunedin Study members and found variations in biological aging in young individuals of the same chronological age. While all participants were 38 years old, their biological age varied from 28 to 61 years (8). Higher biological vs. chronological age was associated with poorer physical fitness, appearance, and cognitive decline (8). The current study aims to find predictors of such accelerated biological aging.
Growing evidence in the last decade suggests that higher Body mass index (BMI) can have detrimental effect on life expectancy (10–12). Obesity has been linked to multiple chronic diseases, reduced functional capacity and lower quality of life (11–14). It is thus of no surprise that anti-aging strategies proposed to extend lifespan focus on caloric restriction (15). Promising results have been reported in primates, but their effectiveness is yet to be verified. However, shared epigenetic signatures (e.g., histone modification, DNA methylation, non-coding RNAs, and chromatin remodeling) have been reported in obesity and aging (16), suggesting BMI might be a possible predictor of biological aging.
Higher BMI in adulthood was associated with earlier onset of puberty (17, 18), another important predictor of all-cause and cardiovascular mortality (19, 20). According to Belsky (21, 22) early pubertal maturation and accelerated biological aging are part of the same evolutionary-developmental process, i.e., Life History Theory. Recent research supported this theory by demonstrating accelerated epigenetic aging in women with earlier onset of puberty (5, 23).
According to Belsky and Shalev (22, 24), earlier pubertal maturation is the result of faster biological aging that stems from adverse/stressful events early in life. Further research on aging and timing of puberty reported that child maltreatment (sexual, physical, or emotional abuse) predicts earlier onset of puberty in women (25) and is associated with accelerated epigenetic aging (5). Earlier pubertal maturation was also found in women who reported more risky and uncertain environments early in life (26) and in the offspring of mothers who reported depression symptoms, marital conflict, and financial stress during pregnancy (27). Consistently, an independent line of research associated higher mortality with preterm birth (28) and small body size indicated by small ponderal index (29), suggesting that birth outcomes might be among the key predictors of biological aging.
This emerging evidence suggests that higher mortality in adulthood is associated with accelerated biological aging, which might have its roots in early life. The current study aims to use data from the European Longitudinal Study of Pregnancy and Childhood (ELSPAC-CZ) prenatal birth cohort (30) and its two follow-ups in young adulthood [VULDE, Health Brain Age (7)] to determine the role of birth outcomes, time of puberty onset, BMI, and body fat in accelerated biological aging in the third decade of life. Since earlier pubertal development has been reported in women compared to men (31) and previous studies showed different trajectory of fat distribution between men and women during pubertal development (32) that continue with aging (33), we also considered potential sex differences in the relationships.
A total of 262 young adults (52% men, 28–30 years of age; all of European ancestry) participated in the Health Brain Age project at the Central European Institute of Technology, Masaryk University (CEITEC MU), a follow-up of the Czech part of the European Longitudinal Study of Pregnancy and Childhood (ELSPAC-CZ) (30), a prenatal birth cohort born in the South Moravian Region of the Czechia between 1991 and 1992. A subset of these participants (n = 110, 51% men) also took part in the first follow-up of this prenatal birth cohort at the age of 23–24 years, entitled Biomarkers and Underlying Mechanisms of Vulnerability to Depression (VULDE; n = 131) (7), and thus have a within-subject design data regarding anthropometrics in young adulthood. A diagram illustrating the sample size of the different studies as well as the final sample of the current study is provided in Supplementary Figure 1. Men and women did not differ in any of the demographic variables; detailed characteristics of the Health Brain Age sample can be found in Table 1 and descriptive statistics and sample size included in the different analyses can be found in Table 2. All participants gave written informed consent for participation in Health Brain Age and VULDE (when applicable) and agreed to merge their historic data from ELSPAC-CZ and the subsequent studies. Informed consent was approved by the ELSPAC Ethics Committee.
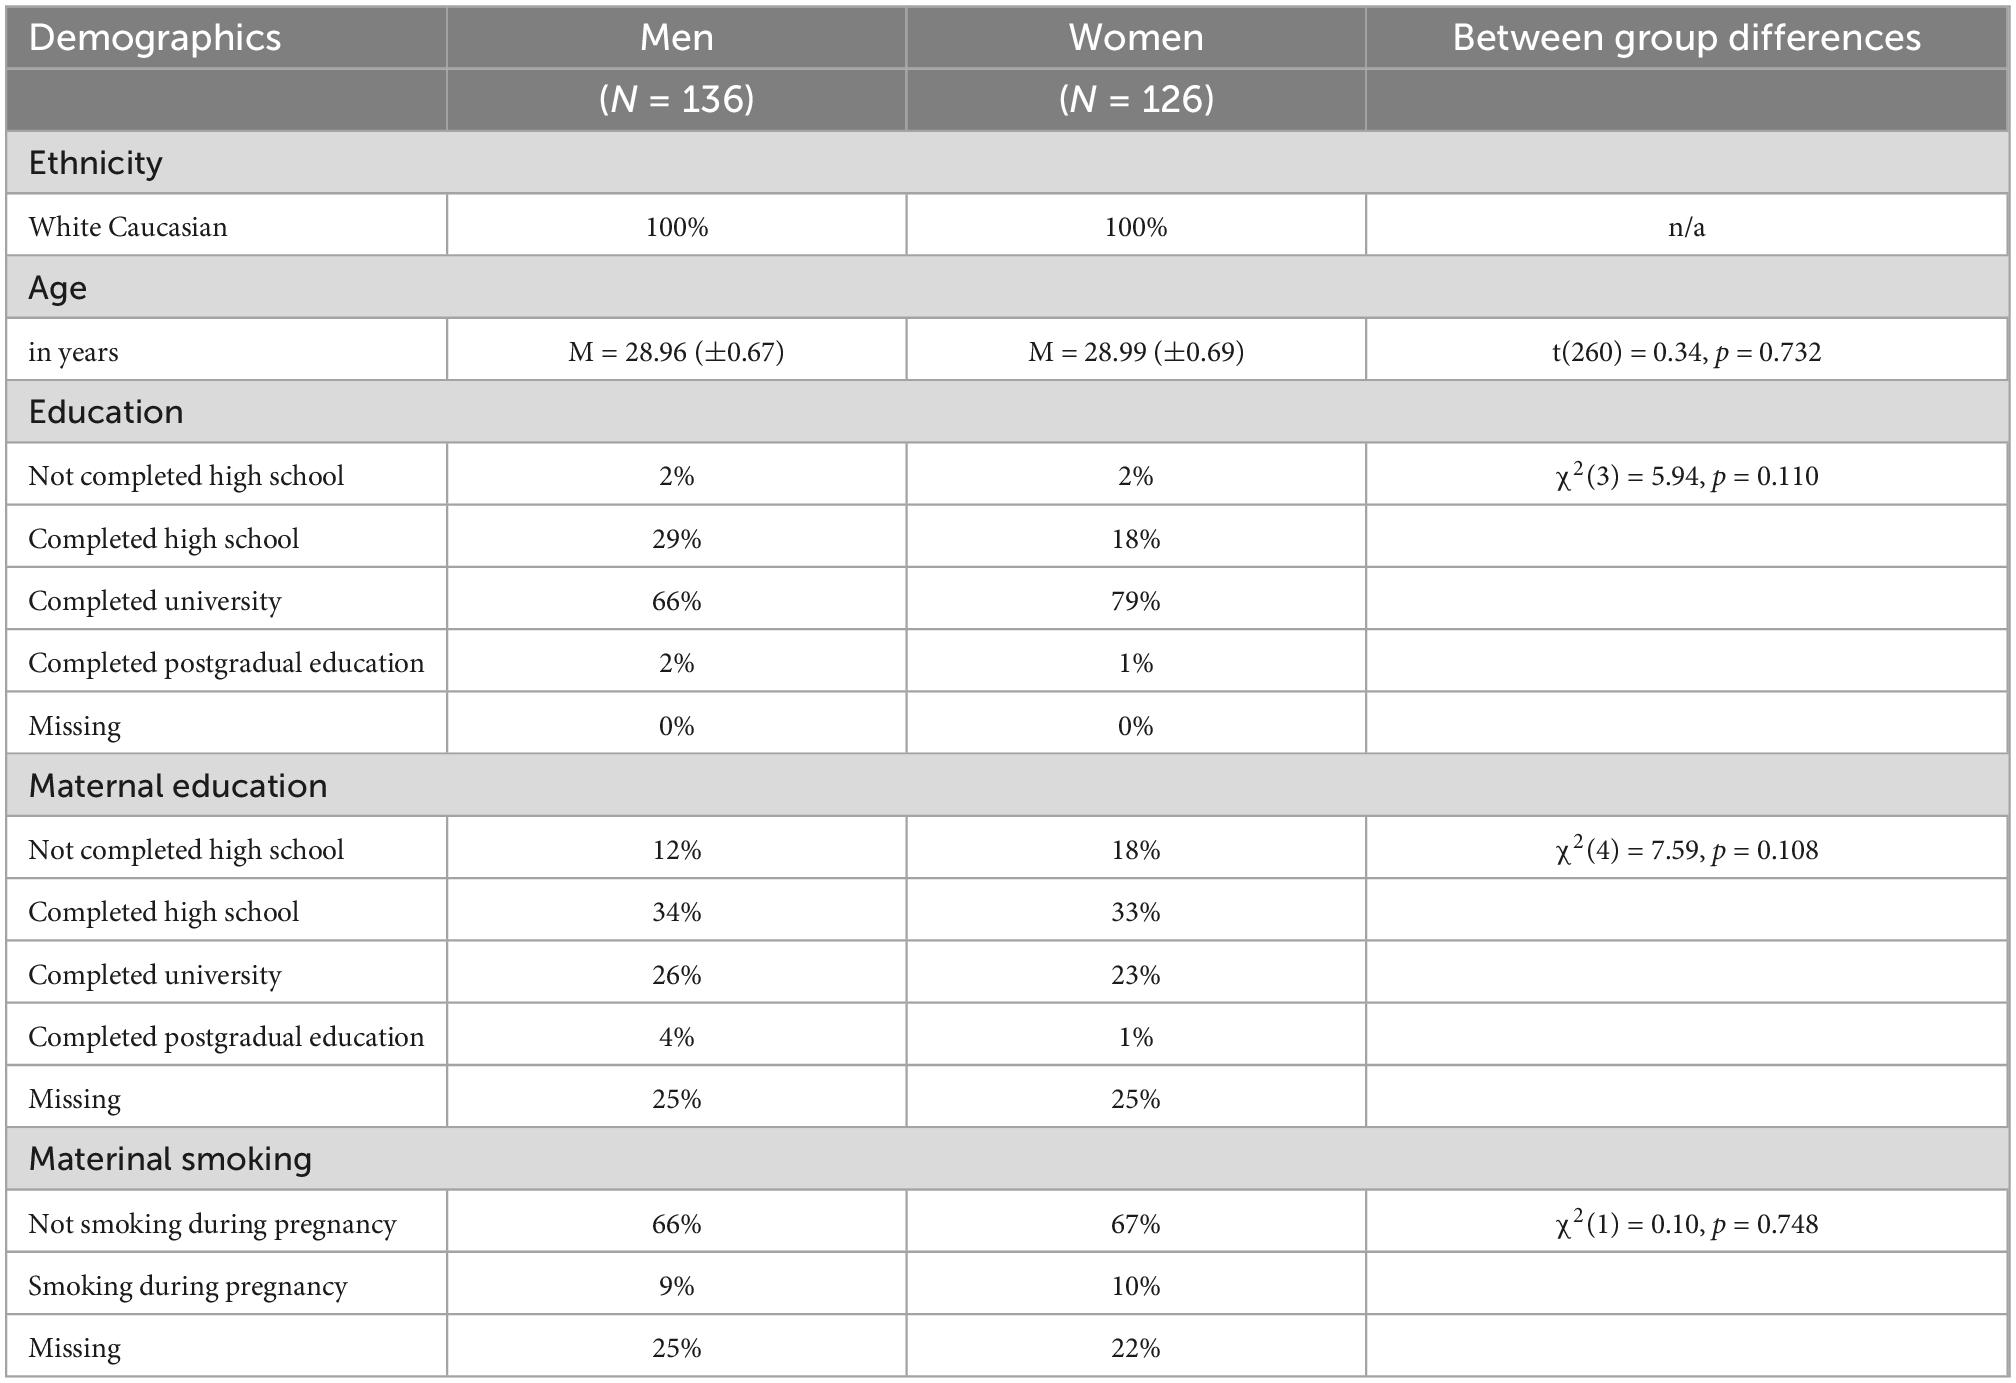
Table 1. Demographic information.
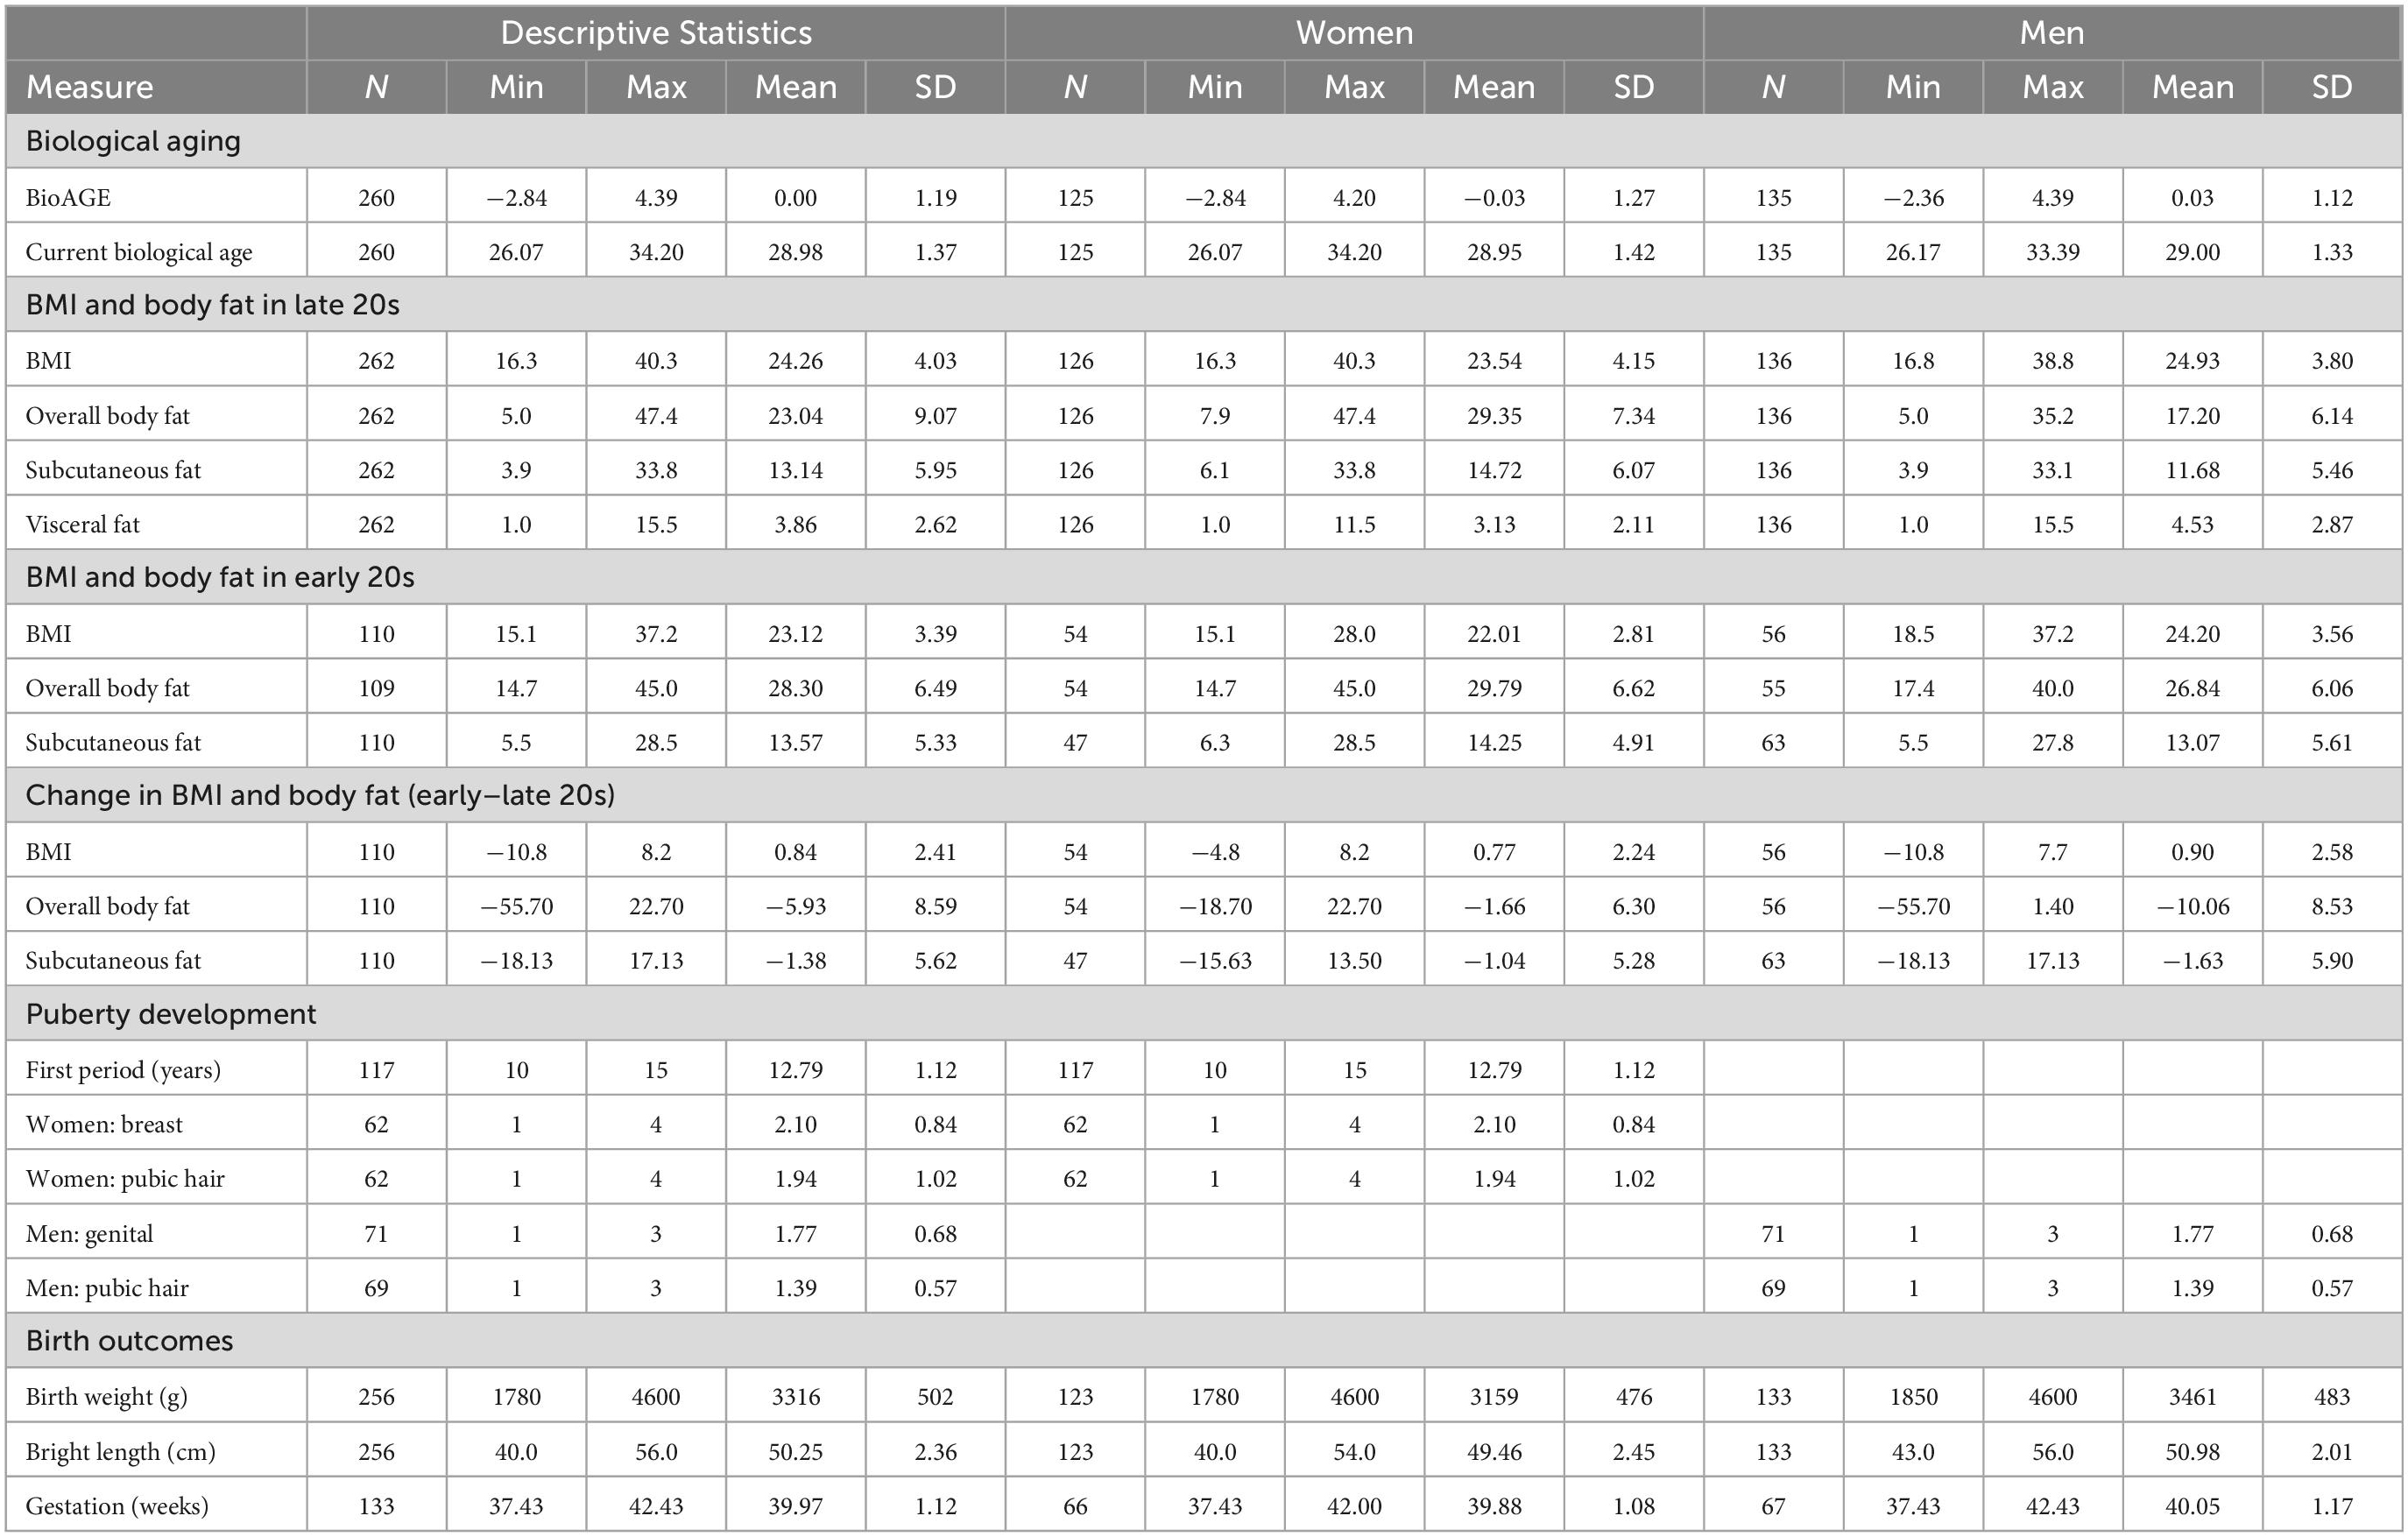
Table 2. Biological aging and its predictors–descriptive statistics.
Weight and height were measured once at birth and twice in young adulthood (age 23–24, age 28–30). BMI in young adulthood was calculated as the ratio of the participant’s weight (kg) and height (m2). Total body fat and amount of visceral fat in young adulthood were estimated by bio-impedance using the scale Tanita BC-545 N. The bio-impedance scale was used in a standardized manner for all participants; the procedure followed the collection of fasting blood sample, and all participants were provided water during the consent procedure. All participants were also instructed not to drink alcohol the day before. Subcutaneous fat in young adulthood was measured with skinfold calipers at four locations (biceps, triceps, suprailia, and under scapula) using a standard procedure and the mean of these four measures (in millimeters) was used in the subsequent analyses.
Gestational age was calculated as the difference between the date of birth and the ultrasound-based date of conception.
At the age of 11, pediatricians assessed the development of secondary sexual characteristics (breasts in women, penis in men, and pubic hair in both sexes) on a scale from 1 (least developed) to 4 (most developed). Participants with less developed secondary sexual characteristics at the age of 11 were classified as the early puberty onset group. In women, the age of menarche served as an additional predictor of puberty onset.
In the late 20s, forced expiratory volume in one second (FEV1) was calculated using MIR Smart One Spirometer. Systolic and diastolic blood pressure were assessed according to standard protocols. Blood samples were taken in the morning before the first meal. Cholesterol, C-reactive protein (CRP), glucose, albumin, creatinine, urea nitrogen serum levels (mg/dL) as well as alkaline phosphatase activity in serum (U/L) were measured on ROCHE analyzer (Cobas Integra 400, Roche diagnostics). The percentage of glycated hemoglobin was calculated based on glucose levels according to published equations and recommendations of the international consensus statement (34–37).
Biological age was calculated using Klemera-Doubal Method (KDM), available through the R package “Bio-Age” (9) that applies a 9-biomarker algorithm including forced expiratory volume in one second (FEV1), blood pressure (systolic), glycated hemoglobin, total cholesterol, C-reactive protein, creatinine, urea nitrogen, albumin, and alkaline phosphatase (see Supplementary Table 1 for descriptive statistics of biomarkers). The difference between biological age and chronological age (BioAGE) thus reflects accelerated/decelerated aging.
All statistical analyses were performed in SPSS version 28.0.0 (IBM SPSS Statistics). First, we assessed the distribution of data, and variables that did not follow a normal distribution were transformed using logarithmic transformation. Outliers that were greater than three standard deviations were removed from the analysis.
Measures of secondary sexual characteristics were fed into Two-Step Cluster Analysis (separate for both sexes) using Schwarz’s Bayesian Criterion to automatically detect clusters. Linear regression was used to assess the predictors of BioAGE. In each model where men and women were treated as one group, sex and the interaction between sex and the predictor were treated as covariates. The significant predictors were then used in a hierarchical multiple linear regression to assess the multiple predictors of BioAGE within a single model. Predictors entered the model following the order of the lifetime: 1. Birth length, 2. Puberty onset, 3. Fat measures in adulthood (visceral and subcutaneous simultaneously). Two analogous models were estimated: one for the whole group with sex as a covariate, and another one for women only, where the year of the first menarche was used as a more precise measure of puberty onset. Simple group differences were analyzed using an independent samples t-test. Group by puberty onset interaction was assessed using two-way ANOVA. Multiple comparisons were corrected using the False Discovery Rate (FDR) method and thus FDR-corrected p-values larger than 0.05 were considered significant.
While all participants were 28–30 years old, their current biological age ranged from 26.07 to 34.20 years, and thus their BioAGE ranged from −2.84 to 4.39 years (Figure 1).
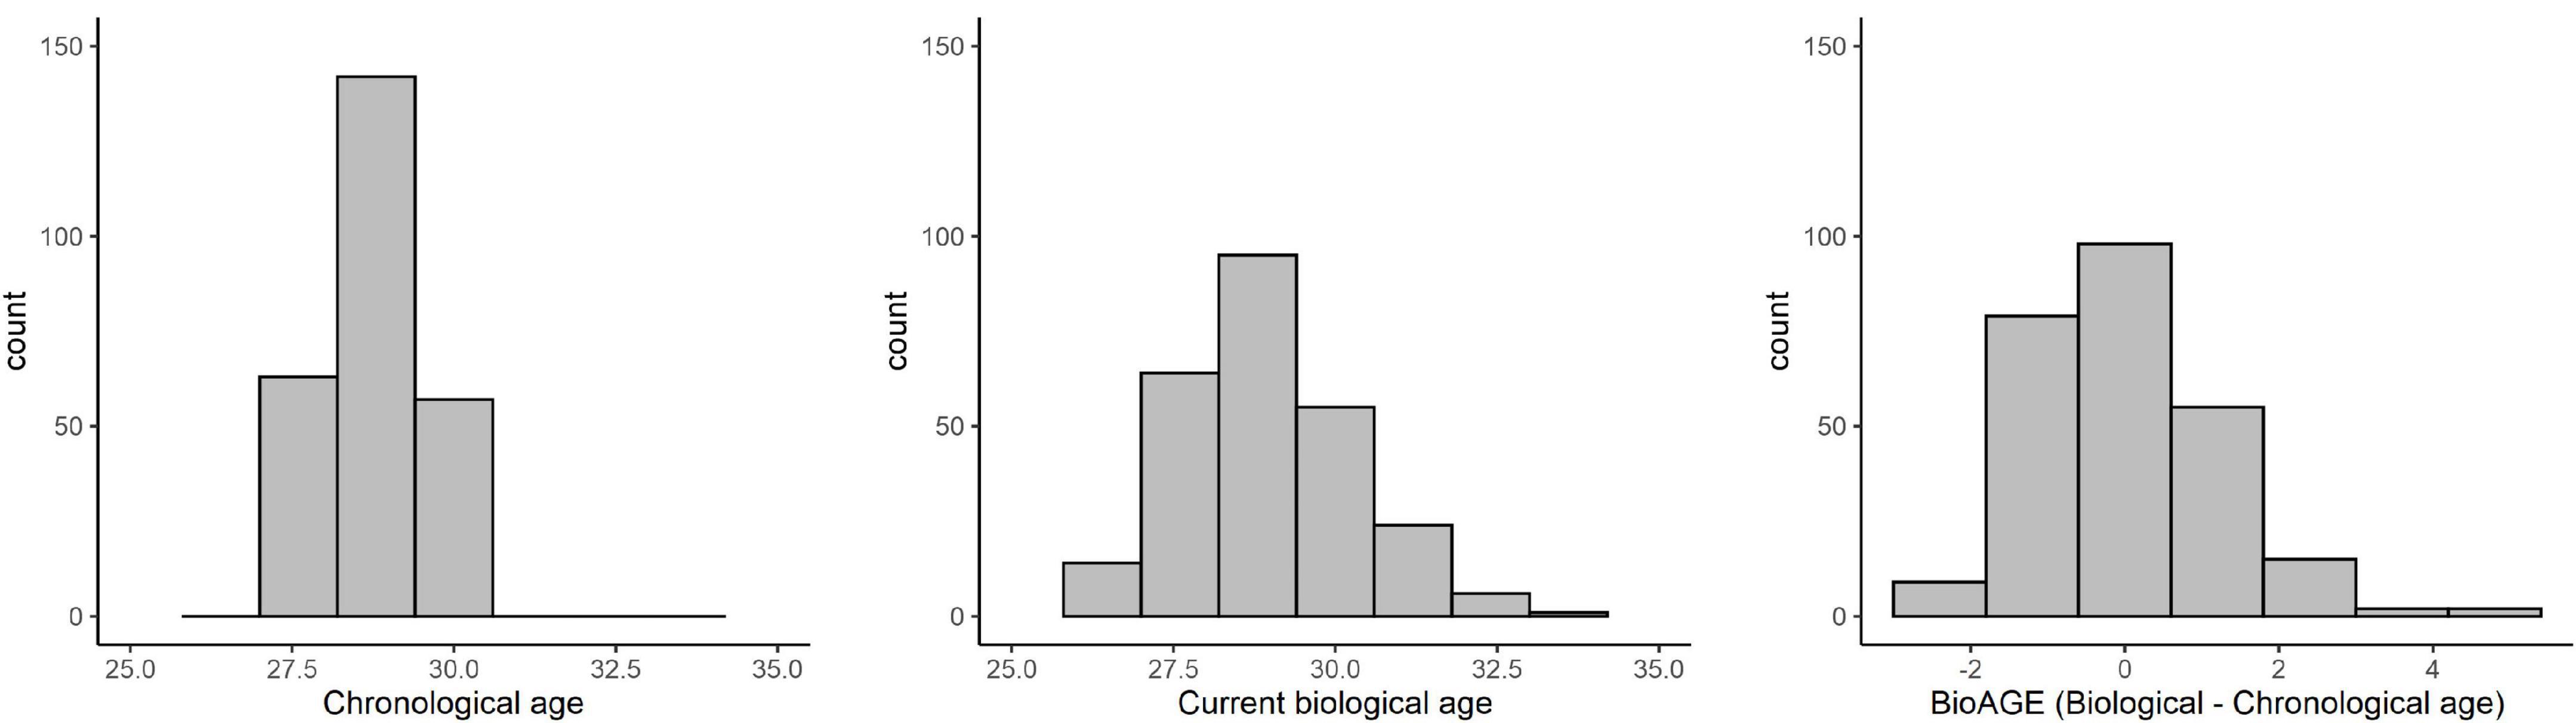
Figure 1. Distribution of chronological age, current biological age, and BioAGE.
BioAGE in the late 20s (Figure 2A) was predicted by higher BMI [R2adj = 0.22, F(3,256) = 25.03, β = 0.10, p < 0.001], overall body fat [R2adj = 0.17, F(3,256) = 19.22, β = 0.07, p < 0.001], subcutaneous fat [R2adj = 0.21, F(3,256) = 23.35, β = 0.08, p < 0.001] and visceral fat [R2adj = 0.25, F(3,256) = 30.44, β = 0.16, p < 0.001]. In addition, we found an interaction effect between sex and BMI (for every unit of BMI increase, BioAGE in women increased 0.08 years more than in men, β = 0.79, p = 0.022) and between sex and visceral fat (for every percent increase in visceral fat, BioAGE in women increased 0.2 years more than in men, β = 0.35, p < 0.001).

Figure 2. BMI and body fat in young adulthood as predictors of biological aging. Accelerated biological aging in the late 20s was predicted not only by BMI and body fat measured in the late 20s (A), but also by BMI and body fat in the early 20s (B), as well as the change in BMI and body fat over the 5-year period between the measurements (C).
Post-hoc regressions in each sex revealed that BioAGE in late 20s was predicted by BMI in both women [R2 = 0.33, F(1,123) = 61.20, β = 0.58, p < 0.001] and men [R2 = 0.10, F(1,133) = 15.13, β = 0.32, p < 0.001], and by visceral fat in both women [R2 = 0.35, F(1,123) = 68.09, β = 0.60, p < 0.001] and men [R2 = 0.15, F(1,133) = 23.92, β = 0.39, p < 0.001].
BioAGE in the early 20s (Figure 2B) was significantly associated with higher BMI [R2adj = 0.05, F(3,105) = 3.09, β = 0.04, p = 0.037], overall body fat [R2adj = 0.09, F(3,104) = 4.54, β = 0.04, p = 0.009] and subcutaneous fat [R2adj = 0.05, F(3,105) = 2.78, β = 0.02, p = 0.049]. There were no interactions with sex (p = 0.022).
Decrease of BMI [R2adj = 0.09, F(3,105) = 4.39, β = 0.08, p = 0.009] and subcutaneous fat [R2adj = 0.07, F(3,105) = 3.77, β = 0.04, p = 0.018], but not of overall body fat (p = 0.431) over the 5-year period in young adulthood were associated with lower BioAGE in late 20s (Figure 2C). There were no interactions with sex (p = 0.189).
The puberty data were classified into two categories based on the development of secondary sexual characteristics at the age of 11 in both women (late onset of puberty: n = 17, early onset of puberty, n = 45) and men (late onset of puberty: n = 26, early onset of puberty: n = 43).
Two-way ANOVA revealed a significant effect of puberty timing on BioAGE, BMI as well as body fat. Early puberty onset group had more accelerated BioAGE [ηp2 = 0.07, F(1,125) = 10.01, p = 0.004], higher BMI [ηp2 = 0.12, F(1,127) = 17.90, p < 0.001], overall body fat [ηp2 = 0.07, F(1,127) = 10.05, p = 0.004], subcutaneous fat [ηp2 = 0.12, F(1,127) = 17.99, p < 0.001] as well as visceral fat [ηp2 = 0.09, F(1,127) = 12.11, p = 0.003] in late 20s than the late puberty onset group (Figure 3A). There was no significant interaction between puberty timing and sex on any of the dependent variables (p = 0.053).
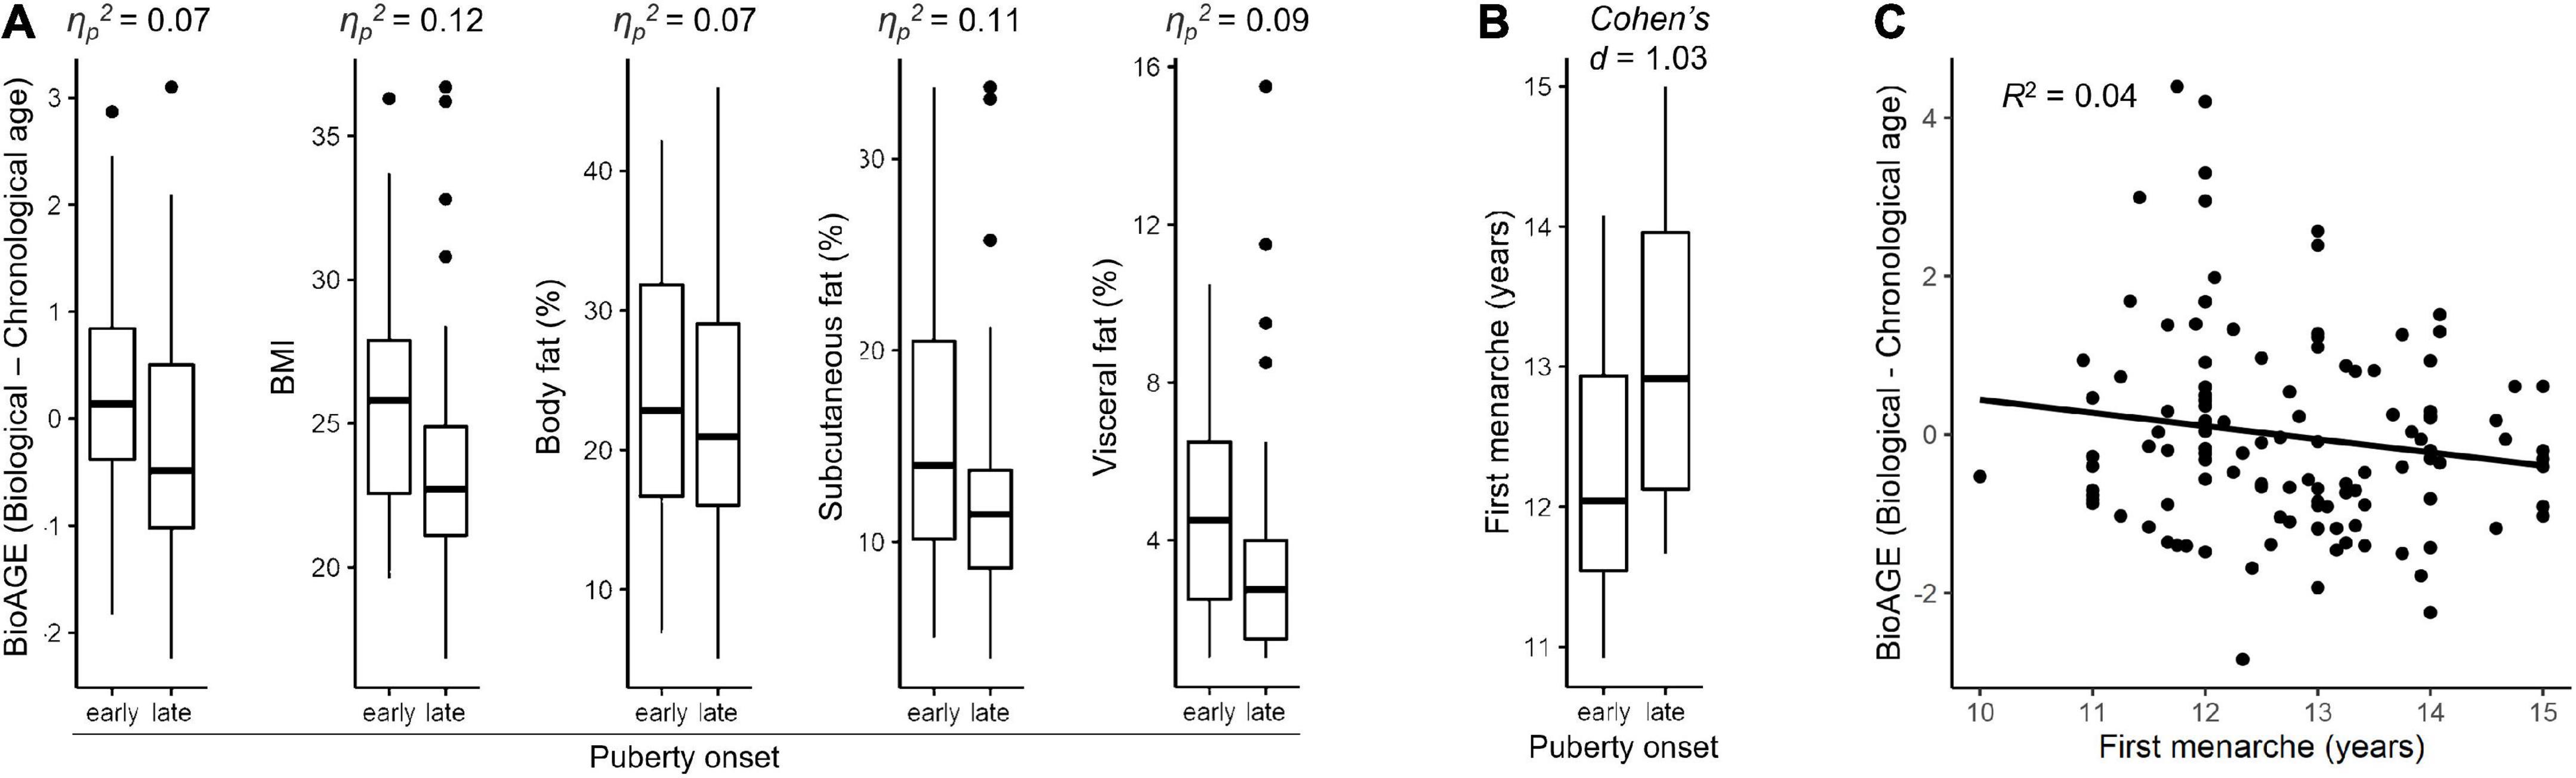
Figure 3. Pubertal timing. Differences between early and late onset of puberty based on secondary sexual characteristics in relation to accelerated biological aging, BMI, and fat measures in late 20s within whole sample (A) and in relation to age of first menarche in women (B). Accelerated biological aging (BioAGE) in women predicted by earlier age of first menarche (C).
Sex-specific post-hoc analyses showed that the effects of puberty onset were driven by women (Supplementary Figure 2). In women, early puberty onset group had more accelerated BioAGE [ηp2 = 0.11, F(1,125) = 16.06, p = 0.001], higher BMI [ηp2 = 0.13, F(1,127) = 18.62, p = 0.001], higher overall body fat [ηp2 = 0.07, F(1,127) = 9.85, p = 0.009], subcutaneous fat [ηp2 = 0.11, F(1,127) = 16.33, p = 0.001] and visceral fat [ηp2 = 0.08, F(1,127) = 10.83, p = 0.007] than late puberty onset group (Supplementary Figure 2). No similar effects of puberty onset were found in men (p = 0.261). Complete statistics is reported in Supplementary Table 3.
Women with earlier onset of puberty experienced earlier first menarche [Cohen’s d = 1.03, t(56) = 3.93, p < 0.001] (Figure 3B) and earlier first menarche predicted higher BioAGE [R2 = 0.04, F(1,114) = 6.13, β = 0.26, p = 0.015] (Figure 3C).
Shorter birth length was associated with higher BioAGE [R2 adj=0.03, F(3,250)=3.61, β=−0.08, p = 0.042], but no significant relationship emerged between birth weight (p = 0.127) or the duration of gestation (p = 0.843) and BioAGE (see Figure 4). There were no interactions with sex (p = 0.382).
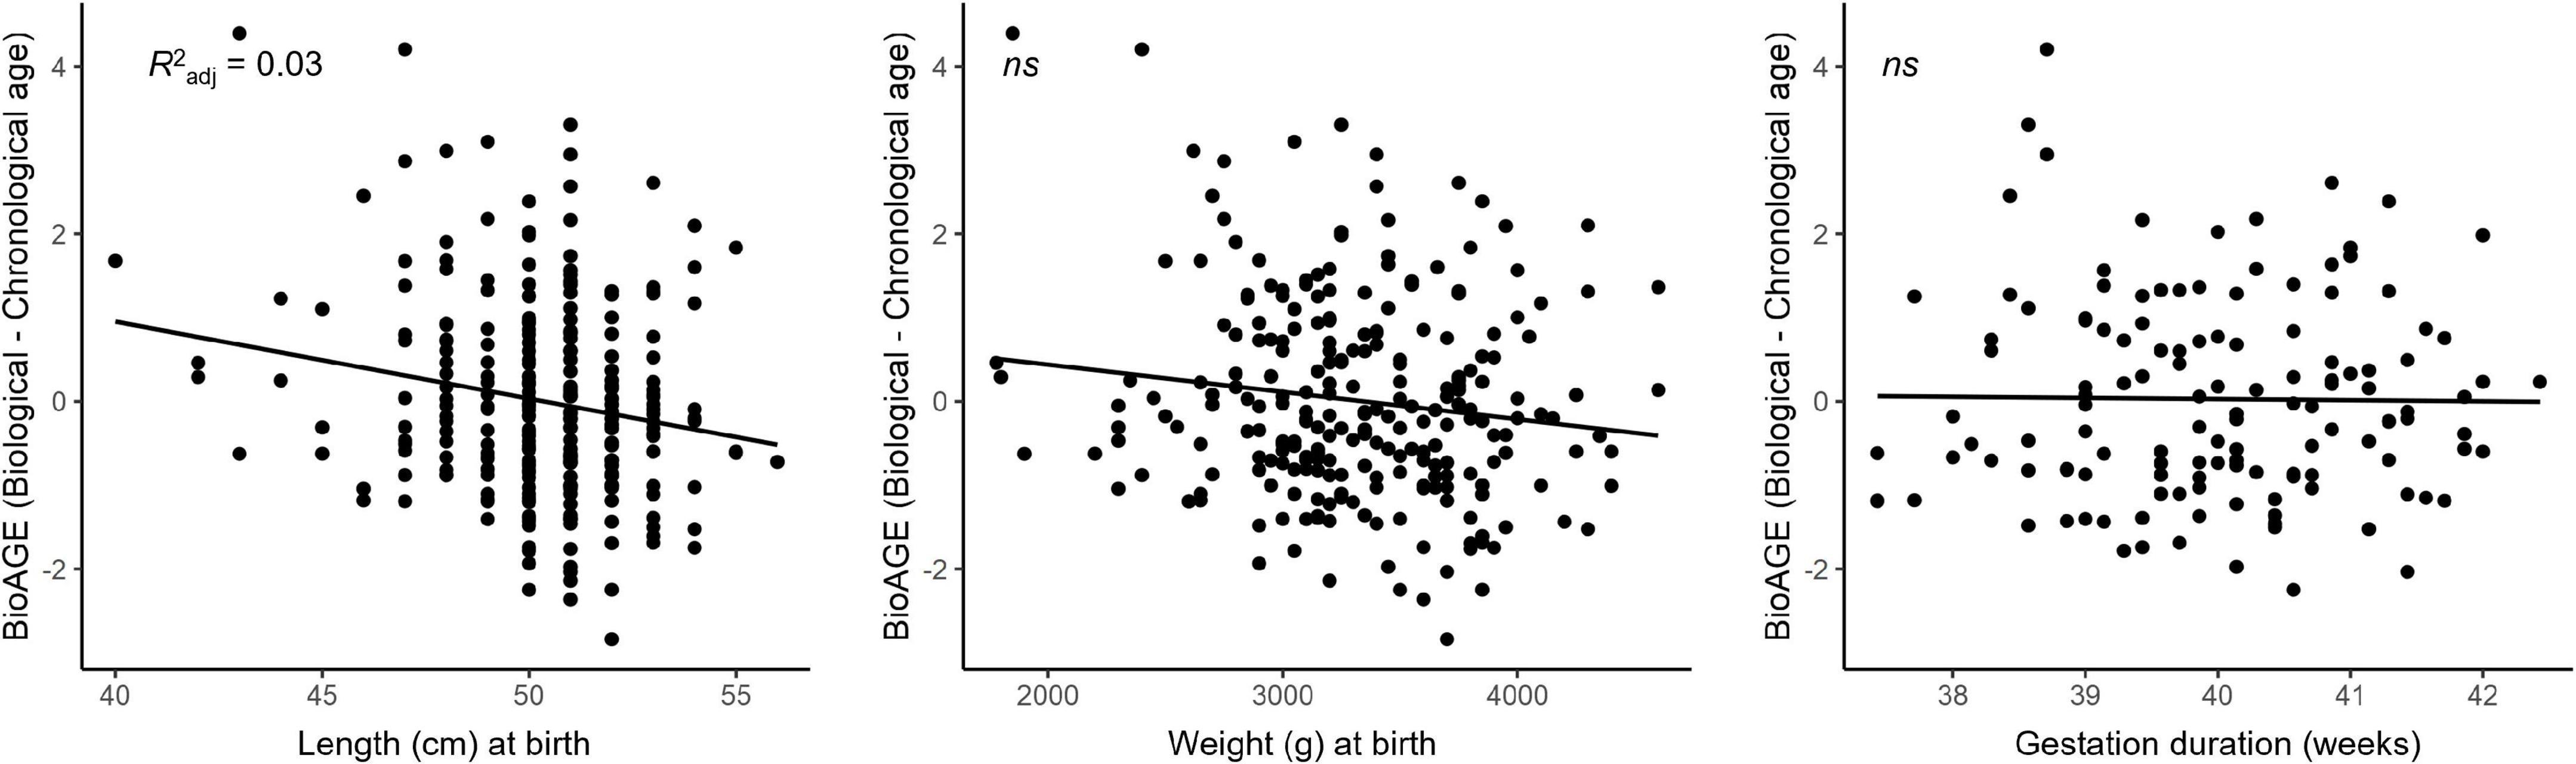
Figure 4. Accelerated biological aging in the late 20s was predicted by birth length but not birth weight or duration of gestation.
Multiple regression evaluating the effects of birth length, puberty onset, and visceral and subcutaneous fat in the late 20s on BioAGE in the whole sample showed that all the predictors together explained 21% of the variance in biological aging [R2adj = 0.21, F(5,119) = 7.59, p > 0.001]. While birth length explained 3.7% of the variance [F(122,1) = 6.49, p = 0.012], early puberty onset explained additional 5.2% [F(121,1) = 8.00, p = 0.005], and visceral fat another 12.1% [F(119,2) = 10.28, p < 0.001]. For every cm of birth length, BioAGE decreased by 0.119 years (β = −0.236, p = 0.012). Participants with early puberty onset had on average 0.56 years more advanced BioAGE than those with late puberty onset (β = −0.244, p = 0.005). For every% of visceral fat, BioAGE increased by 0.167 years (β = 0.361, p = 0.006). The effect of subcutaneous fat did not reach significance in the multiple regression (p = 0.737). Complete statistics with all regressors are in Supplementary Table 4A.
Similar multiple regression in women, where we could use the age of menarche as a more accurate measure of puberty timing, showed that the whole model explained even 30% of the variance [R2adj = 0.30, F(4,108) = 13.01, p > 0.001]. While birth length explained 6.9% of the variance [F(111,1) = 9.26, p = 0.003], adding year of first menarche explained additional 0.9% although not significant [F(110,1) = 2.11, p = 0.149], and body fat another 22.2% [F(1008,2) = 18.47, p < 0.001]. For every cm of birth length, BioAGE decreased by 0.137 years (β = −0.28, p < 0.003). For every% of visceral fat, BioAGE increased by 0.247 years (β = 0.445, p < 0.001). The effect of first menarche (p = 0.149) and subcutaneous fat (p = 0.634) did not reach significance in the multiple regression. Complete statistics with all regressors are in Supplementary Table 4B.
We studied biological aging in young adults from the ELSPAC-CZ prenatal birth cohort and demonstrated that accelerated biological aging in young adulthood was associated with higher BMI as well as higher overall, subcutaneous, and visceral body fat, with visceral fat showing the strongest association. Moreover, we showed that the effects of BMI and body fat on biological aging are stable–present in both early and late 20s–and reach a greater effect size in women as compared to men. Most importantly, we demonstrated that reduction of BMI over the 5-year period between the measurements was associated with decelerated biological aging, suggesting that reducing weight over a relatively short period of time during adulthood can possibly slow down the pace of biological aging.
These findings extend previous prospective cohort studies, which linked higher BMI (10–12) and body fat (38) with increased mortality. They also support research by others reporting associations between higher BMI and accelerated epigenetic aging (39–43). While the mechanisms explaining the relationships between higher BMI and accelerated epigenetic aging remain to be clarified, the associations suggest the existence of a shared developmental mechanism (16).
The relationships between accelerated biological aging and higher BMI in both the late and early 20s demonstrate the stability of the effect. But interestingly, a reduction of BMI over the 5-year period predicted lower BioAGE, suggesting that we might be able to slow down the speed of our biological aging by relatively accessible management options. This is in agreement with previous research suggesting dieting (44) and caloric restriction (15) as means to increase lifespan. Consistently, exercise was found to affect epigenetic changes in DNA methylation (45), histone modification (46), chromatin modifications (47), and non-coding RNAs (48) that are associated with aging (16). Further research is needed to assess the link between exercise and BioAGE.
Early puberty onset was another key predictor of accelerated biological aging, particularly in women. This is in agreement with previous studies that found a relationship between earlier menarche and accelerated epigenetic aging in women (5, 23). While Binder et al. (23) reported a relationship between epigenetic aging and menarche but not breast development, we found the effects of both menarche and breast development (together with pubic hair development). These divergent findings might be attributed to differences in methodology: first, our measure of aging is composed of wider selection of biomarkers; second, compared to the onset of breast development used by Binder et al. (23), we measured the degree of development at the age of 11.
We found only limited evidence for the hypothesized early life origins of biological aging. In particular, newborns who were shorter (but not lighter or younger) at birth were aging faster in their late 20s. This might be related to the fact that all our participants fell within the healthy range and the low variance in gestational age and birth weight might not have allowed us to detect any significant relationships with biological aging in young adulthood.
Finally, combining predictors of BioAGE from birth to adulthood allowed us to explain up to 21% of the variance in the whole sample and up to 30% of the variance in the women’ group. Interestingly, visceral but not subcutaneous fat was a significant predictor of BioAGE. While both types of fat have been associated with increased morbidity (49, 50), there are indications that visceral fat is a more relevant predictor of cardiometabolic diseases than subcutaneous fat (51–53). Our findings suggest that higher levels of visceral fat might have important health consequences not only for the risk of cardiometabolic diseases but also aging and that high levels of visceral fat have particular negative impact on women. The puberty timing measured by secondary sexual characteristics was another significant predictor of accelerated aging in both the whole sample as well as women only. However, the timing of puberty measured by the first menarche did not constitute a significant predictor of BioAGE in women, when birth length and measures of visceral and subcutaneous fat in adulthood were accounted for. It must be noted that the effect of the first menarche was rather small even when considered alone and its lack of effect in the multiple regression model might be attributed to the limited sample size.
Overall, our findings support the Life History Theory, according to which early pubertal maturation can be accounted for accelerated biological aging (21). The rationale behind the theory is that the adaptation of an organism to early live adversity is reflected in accelerated aging. This leads to earlier pubertal maturation which increases the organism’s chance of reproduction before dying. However, the payoff for the earlier pubertal maturation is decreased health in adulthood which is associated with aging, leading to increased morbidity and premature mortality.
Our study has several limitations that need to be acknowledged. First, the sample size is considerably small, which can be, at least in part, attributed to the longitudinal design of our study. Second, members of our prenatal birth cohort were not born preterm and had a healthy birth weight, limiting the possibility to study the impact of birth outcomes. Third, while our study uses longitudinal data for the predictors, the blood sample to estimate biological age was collected only at a single point at the late 20s. Further research is needed to assess the stability of the biological age gap (BioAGE) across the lifespan. Fourth, potential confounders such as lifestyle and dietary behavior might have affected the results and should be considered by future studies. Finally, this is a correlational study and therefore does not allow us to prove causal relationships between BioAGE and its predictors.
In conclusion, using longitudinal data on the ELSPAC-CZ prenatal birth cohort, we demonstrated that birth length, puberty timing, and visceral fat predict biological aging in young adulthood. In particular, the results of our study provide comprehensive support for the Life History Theory, suggesting that early life adversity might trigger accelerated aging, which in turn leads to earlier pubertal timing but decreasing fitness in adulthood, reflected by higher visceral fat and BMI. Moreover, we discovered that a reduction of BMI in young adulthood might slow down biological aging.
The raw data supporting the conclusions of this article will be made available by the authors, without undue reservation.
The studies involving human participants were reviewed and approved by European Longitudinal Study of Pregnancy and Childhood (ELSPAC-CZ) Ethics Committee. The patients/participants provided their written informed consent to participate in this study.
MJ: investigation, formal analysis, and writing the original draft. LZ: investigation. PP: resources. LA: resources. MB: review and editing. KM: conceptualization, methodology, supervision, funding acquisition, review, and editing. All authors contributed to the article and approved the submitted version.
This work was supported by Czech Health Research Council (NU20J-04-00022), the European Union (Marie Curie Intra-European Fellowship for Career Development, FP7-PEOPLE-IEF-2013, grant #6485124), the European Union’s Horizon 2020 Research and Innovation Program under grant agreement No 857560, and the Czech Ministry of Education, Youth and Sports/MEYS CR (CZ.02.1.01/0.0/0.0/17_043/0009632 and CZ.02.1.01/0.0/0.0/15_003/0000469; LM2018121; LX22NPO5107–funded through European Union–Next Generation EU). This publication reflects only the author’s view, and the European Commission is not responsible for any use that may be made of the information it contains.
The authors declare that the research was conducted in the absence of any commercial or financial relationships that could be construed as a potential conflict of interest.
All claims expressed in this article are solely those of the authors and do not necessarily represent those of their affiliated organizations, or those of the publisher, the editors and the reviewers. Any product that may be evaluated in this article, or claim that may be made by its manufacturer, is not guaranteed or endorsed by the publisher.
The Supplementary Material for this article can be found online at: https://www.frontiersin.org/articles/10.3389/fnut.2022.1100237/full#supplementary-material
1. Campisi J, Kapahi P, Lithgow GJ, Melov S, Newman JC, Verdin E. From discoveries in ageing research to therapeutics for healthy ageing. Nature. (2019) 571:183–92.
3. Burch JB, Augustine AD, Frieden LA, Hadley E, Howcroft TK, Johnson R, et al. Advances in geroscience: impact on healthspan and chronic disease. J Gerontol A Biol Sci Med Sci. (2014) 69(Suppl 1):S1–3.
4. Li Z, Zhang Z, Ren Y, Wang Y, Fang J, Yue H, et al. Aging and age-related diseases: from mechanisms to therapeutic strategies. Biogerontology. (2021) 22:165–87.
5. Hamlat EJ, Prather AA, Horvath S, Belsky J, Epel ES. Early life adversity, pubertal timing, and epigenetic age acceleration in adulthood. Dev Psychobiol. (2021) 63:890–902. doi: 10.1002/dev.22085
6. Gilbert LK, Breiding MJ, Merrick MT, Thompson WW, Ford DC, Dhingra SS, et al. Childhood adversity and adult chronic disease. Am J Prev Med. (2015) 48:345–9.
7. Mareckova K, Marecek R, Andryskova L, Brazdil M, Nikolova YS. Maternal depressive symptoms during pregnancy and brain age in young adult offspring: findings from a prenatal birth cohort. Cereb Cortex. (2020) 30:3991–9.
8. Belsky DW, Caspi A, Houts R, Cohen HJ, Corcoran DL, Danese A, et al. Quantification of biological aging in young adults. Proc Natl Acad Sci. (2015) 112:E4104–10.
9. Levine ME. Modeling the rate of senescence: can estimated biological age predict mortality more accurately than chronological age? J Gerontol A Biol Sci Med Sci. (2013) 68:667–74. doi: 10.1093/gerona/gls233
10. Stenholm S, Head J, Aalto V, Kivimäki M, Kawachi I, Zins M, et al. Body mass index as a predictor of healthy and disease-free life expectancy between ages 50 and 75: a multicohort study. Int J Obes. (2017) 41:769–75.
11. Flegal KM, Kit BK, Orpana H, Graubard BI. Association of all-cause mortality with overweight and obesity using standard body mass index categories. JAMA. (2013) 309:71.
12. di Angelantonio E, Bhupathiraju SN, Wormser D, Gao P, Kaptoge S, de Gonzalez AB, et al. Body-mass index and all-cause mortality: individual-participant-data meta-analysis of 239 prospective studies in four continents. Lancet. (2016) 388:776–86. doi: 10.1016/S0140-6736(16)30175-1
13. Zaninotto P, Pierce M, Breeze E, de Oliveira C, Kumari M. BMI and waist circumference as predictors of well-being in older adults: findings from the english longitudinal study of ageing. Obesity. (2010) 18:1981–7.
14. Larsson U, Karlsson J, Sullivan M. Impact of overweight and obesity on health-related quality of life—a Swedish population study. Int J Obes. (2002) 26:417–24. doi: 10.1038/sj.ijo.0801919
15. Pifferi F, Aujard F. Caloric restriction, longevity and aging: recent contributions from human and non-human primate studies. Prog Neuropsychopharmacol Biol Psychiatry. (2019) 95:109702. doi: 10.1016/j.pnpbp.2019.109702
16. Ghanemi A, Yoshioka M, St-Amand J. Ageing and obesity shared patterns: from molecular pathogenesis to epigenetics. Diseases. (2021) 9:87.
17. Laitinen J, Power C, Järvelin MR. Family social class, maternal body mass index, childhood body mass index, and age at menarche as predictors of adult obesity. Am J Clin Nutr. (2001) 74:287–94. doi: 10.1093/ajcn/74.3.287
18. Pierce MB, Leon DA. Age at menarche and adult BMI in the aberdeen children of the 1950s cohort study. Am J Clin Nutr. (2005) 82:733–9. doi: 10.1093/ajcn/82.4.733
19. Charalampopoulos D, McLoughlin A, Elks CE, Ong KK. Age at menarche and risks of all-cause and cardiovascular death: a systematic review and meta-analysis. Am J Epidemiol. (2014) 180:29–40. doi: 10.1093/aje/kwu113
20. Tamakoshi K, Yatsuya H, Tamakoshi A. Early age at menarche associated with increased all-cause mortality. Eur J Epidemiol. (2011) 26:771–8.
21. Belsky J. Early-life adversity accelerates child and adolescent development. Curr Dir Psychol Sci. (2019) 28:241–6.
22. Belsky J, Shalev I. Contextual adversity, telomere erosion, pubertal development, and health: two models of accelerated aging, or one? Dev Psychopathol. (2016) 28(4pt2):1367–83.
23. Binder AM, Corvalan C, Mericq V, Pereira A, Santos JL, Horvath S, et al. Faster ticking rate of the epigenetic clock is associated with faster pubertal development in girls. Epigenetics. (2018) 13:85–94. doi: 10.1080/15592294.2017.1414127
24. Shalev I, Belsky J. Early-life stress and reproductive cost: a two-hit developmental model of accelerated aging? Med Hypotheses. (2016) 90:41–7. doi: 10.1016/j.mehy.2016.03.002
25. Mendle J, Ryan RM, McKone KM. Early childhood maltreatment and pubertal development: replication in a population-based sample. J Res Adolesc. (2016) 26:595–602. doi: 10.1111/jora.12201
26. Chisholm JS, Quinlivan JA, Petersen RW, Coall DA. Early stress predicts age at menarche and first birth, adult attachment, and expected lifespan. Hum Nat. (2005) 16:233–65. doi: 10.1007/s12110-005-1009-0
27. Belsky J, Ruttle PL, Boyce WT, Armstrong JM, Essex MJ. Early adversity, elevated stress physiology, accelerated sexual maturation and poor health in females. Dev Psychol. (2015) 51:816. doi: 10.1037/dev0000017
28. Crump C, Sundquist J, Winkleby MA, Sundquist K. Gestational age at birth and mortality from infancy into mid-adulthood: a national cohort study. Lancet Child Adolesc Health. (2019) 3:408–17. doi: 10.1016/S2352-4642(19)30108-7
29. Kajantie E, Osmond C, Barker DJP, Forsén T, Phillips DIW, Eriksson JG. Size at birth as a predictor of mortality in adulthood: a follow-up of 350 000 person-years. Int J Epidemiol. (2005) 34:655–63. doi: 10.1093/ije/dyi048
30. Piler P, Kandrnal V, Kukla L, Andrýsková L, Švancara J, Jarkovský J, et al. Cohort profile: the European longitudinal study of pregnancy and childhood (ELSPAC) in the Czech Republic. Int J Epidemiol. (2017) 46:1379f–1379f.
32. He Q, Horlick M, Thornton J, Wang J, Pierson RN, Heshka S, et al. Sex-specific fat distribution is not linear across pubertal groups in a multiethnic study. Obes Res. (2004) 12:725–33.
33. He X, Li Z, Tang X, Zhang L, Wang L, He Y, et al. Age- and sex-related differences in body composition in healthy subjects aged 18 to 82 years. Medicine. (2018) 97:e11152. doi: 10.1097/MD.0000000000011152
34. Nathan DM, Kuenen J, Borg R, Zheng H, Schoenfeld D, Heine RJ, et al. Translating the A1C assay into estimated average glucose values. Diabetes Care. (2008) 31:1473–8.
35. Little RR, Sacks DB. HbA1c: how do we measure it and what does it mean? Curr Opin Endocrinol Diabetes Obes. (2009) 16:113–8.
36. Hoelzel W, Weykamp C, Jeppsson JO, Miedema K, Barr JR, Goodall I, et al. IFCC reference system for measurement of hemoglobin A1c in human blood and the National standardization schemes in the United States, Japan, and Sweden: a method-comparison study. Clin Chem. (2004) 50:166–74. doi: 10.1373/clinchem.2003.024802
37. Treviño G. Consensus statement on the Worldwide Standardization of the Hemoglobin A1C Measurement: the American Diabetes Association, European Association for the Study of Diabetes, International Federation of Clinical Chemistry and Laboratory Medicine, and the International Diabetes Federation: response to the Consensus Committee. Diabetes Care. (2007) 30:e141. doi: 10.2337/dc07-1752
38. Jayedi A, Khan TA, Aune D, Emadi A, Shab-Bidar S. Body fat and risk of all-cause mortality: a systematic review and dose-response meta-analysis of prospective cohort studies. Int J Obes. (2022) 46:1573–81. doi: 10.1038/s41366-022-01165-5
39. Samblas M, Milagro FI, Martínez A. DNA methylation markers in obesity, metabolic syndrome, and weight loss. Epigenetics. (2019) 14:421–44.
40. van Dijk SJ, Molloy PL, Varinli H, Morrison JL, Muhlhausler BS, Buckley M, et al. Epigenetics and human obesity. Int J Obes. (2015) 39:85–97.
42. Ling C, Rönn T. Epigenetics in human obesity and type 2 diabetes. Cell Metab. (2019) 29:1028–44.
43. Shi Y, Qu J, Gai L, Yuan D, Yuan C. Long Non-coding RNAs in metabolic and inflammatory pathways in obesity. Curr Pharm Des. (2020) 26:3317–25.
44. Acosta-Rodríguez VA, Rijo-Ferreira F, Green CB, Takahashi JS. Importance of circadian timing for aging and longevity. Nat Commun. (2021) 12:2862.
45. Voisin S, Eynon N, Yan X, Bishop DJ. Exercise training and DNA methylation in humans. Acta Physiol. (2015) 213:39–59.
46. Fernandes J, Arida RM, Gomez-Pinilla F. Physical exercise as an epigenetic modulator of brain plasticity and cognition. Neurosci Biobehav Rev. (2017) 80:443–56.
47. Solagna F, Nogara L, Dyar KA, Greulich F, Mir AA, Türk C, et al. Exercise-dependent increases in protein synthesis are accompanied by chromatin modifications and increased MRTF-SRF signalling. Acta Physiol. (2020) 230:e13496. doi: 10.1111/apha.13496
48. Bonilauri B, Dallagiovanna B. Long non-coding RNAs are differentially expressed after different exercise training programs. Front Physiol. (2020) 11:1183. doi: 10.3389/fphys.2020.567614
49. Abraham TM, Pedley A, Massaro JM, Hoffmann U, Fox CS. Association between visceral and subcutaneous adipose depots and incident cardiovascular disease risk factors. Circulation. (2015) 132:1639–47.
50. Yokokawa H, Fukuda H, Saita M, Goto K, Kaku T, Miyagami T, et al. An association between visceral or subcutaneous fat accumulation and diabetes mellitus among Japanese subjects. Diabetol Metab Syndr. (2021) 13:1–10.
51. Qiu Y, Deng X, Sha Y, Wu X, Zhang P, Chen K, et al. Visceral fat area, not subcutaneous fat area, is associated with cardiac hemodynamics in type 2 diabetes. Diabetes Metab Syndr Obes. (2020) 13:4413.
52. Sato F, Maeda N, Yamada T, Namazui H, Fukuda S, Natsukawa T, et al. Association of epicardial, visceral, and subcutaneous fat with cardiometabolic diseases. Circ J. (2018) 82:502–8.
Keywords: biological aging, BMI, obesity, puberty, birth outcomes, life history theory
Citation: Jáni M, Zacková L, Piler P, Andrýsková L, Brázdil M and Marečková K (2023) Birth outcomes, puberty onset, and obesity as long-term predictors of biological aging in young adulthood. Front. Nutr. 9:1100237. doi: 10.3389/fnut.2022.1100237
Received: 16 November 2022; Accepted: 22 December 2022;
Published: 10 January 2023.
Edited by:
Zhenjun Zhu, Jinan University, ChinaReviewed by:
Juliana Rombaldi Bernardi, Federal University of Rio Grande do Sul, BrazilCopyright © 2023 Jáni, Zacková, Piler, Andrýsková, Brázdil and Marečková. This is an open-access article distributed under the terms of the Creative Commons Attribution License (CC BY). The use, distribution or reproduction in other forums is permitted, provided the original author(s) and the copyright owner(s) are credited and that the original publication in this journal is cited, in accordance with accepted academic practice. No use, distribution or reproduction is permitted which does not comply with these terms.
*Correspondence: Klára Mare čková,  a2xhcmEubWFyZWNrb3ZhQGNlaXRlYy5tdW5pLmN6
Disclaimer: All claims expressed in this article are solely those of the authors and do not necessarily represent those of their affiliated organizations, or those of the publisher, the editors and the reviewers. Any product that may be evaluated in this article or claim that may be made by its manufacturer is not guaranteed or endorsed by the publisher.
Research integrity at Frontiers
Learn more about the work of our research integrity team to safeguard the quality of each article we publish.