 Junbo Liu
 Qian Wang1
- 1Institute of Agricultural Products Processing, Hangzhou Academy of Agricultural Sciences, Hangzhou, China
- 2Department of Environmental Health and Food Science and Technology, Hangzhou Wanxiang Polytechnic, Hangzhou, China
Introduction: Harvested blueberries can be processed into wine to extend their shelf life and increase their commercial value. In order to produce fruit wine, external sugar is often added prior to fermentation to increase the final alcohol content to a target of 8–12% (v/v) to meet consumer expectations.
Method: we explore the effect of 8–14% (w/w) sucrose on the physicochemical properties of blueberry wine throughout the main fermentation process. We monitor changes of alcohol content, sugar, color, phenol, acidity, anthocyanin, and odor.
Results and discussion: We notice that sucrose affects the fermentation process and physicochemical composition of the final blueberry wine by fermentation rate, fermentation color and protection of functional substances protection. Additional sucrose extends the total time of fermentation, and increases wine acidity. The color of the wine is also affected, with added sugar darkening and yellowing the final product. Interestingly, the sucrose has a protective effect on anthocyanin levels, although total anthocyanin levels are still substantially reduced following fermentation. Finally, the additional sugar increases accumulation of volatile odor components, particularly alcohols and esters, as measured by an electronic nose. We conclude that an addition of 12% sucrose produces wine with superior physicochemical properties of alcohol, anthocyanin loss and odor relative to other conditions tested and recommend this approach to commercial manufacturers.
Introduction
Blueberries are colloquially referred to as the king of fruits and universally loved by consumers (1, 2). Blueberries are rich in carbohydrates, organic acids, anthocyanins, phenols, flavonoids and other beneficial nutrients with antioxidative (3) and immunostimulatory effects (4), which can improve hypoglycemia (5), and protect eyesight (6). However, blueberries have a limited shelf life of 3–7 days at room temperature, resulting in rapid deterioration and short retail distance (7, 8). Furthermore, blueberries with thin skin and higher flesh content are at increased risk of microbial infection (9). For these reasons, commercial harvest enterprises can incur serious losses from spoilage following a typical summer harvest. To avoid this, fresh blueberries can be fermented into wine (10), dried (11), or juiced to extend their shelf life and increase the profitability of a harvest (12).
Blueberry wine is a high-value processed product from the highly perishable blueberry fruit, which is widely consumed (13). In recent years, the production of blueberries in China has gradually increased. Blueberries have berry characteristics similar to grapes and are used for fermentation and wine production. In the Chinese market, blueberry wine is mainly dry red. Blueberry wine is produced from fresh or frozen blueberry fruit through crushing, fermentation, aging, filtration, filling and packing (14). The fermentation process produces alcohol and carbon dioxide from metabolism of sugar by wine yeast (Saccharomyces cerevisiae). The sugar content of blueberry is generally 80–100 g·L−1, and lower than grapes of 214–228 g·L−1 (15), the most widely-used fruit to produce wine. While 17 g·L−1 sugar present in blueberries should theoretically produce 1% (v/v) alcohol after fermentation, consumers generally expect an alcohol content of 8–12% (v/v). To produce the proper alcohol content, commercial producers typically supplement the crushed fruit with sucrose, an economical sugar source. However, it is unclear how this additional sucrose affects the odor and physicochemical properties during fermentation.
The fermentation process of blueberry wine can be divided into a main and secondary fermentation stage (16). During main fermentation, yeast propagate and produce ethanol (2). This dynamic stage also results in the degradation, transformation, generation of new substances and chemical byproducts. Conversely, the post fermentation process is predominantly a odor improvement stage during which lactic acid bacteria (LAB) degrade malic acid to produce lactic acid and catalyze additional chemical reactions which influence the aroma of the wine (17).
In this study, we investigate the impact of sucrose addition during the main fermentation process on the physicochemical properties of the finished blueberry wine, including the alcohol content, nutrient abundance, and odor profile. We expect these results can be used to improve commercial-scale production of blueberry wine.
Materials and methods
Materials
Blueberries, the variety of rabbit eye, purchased from Hangzhou Gaofeng Blueberry Planting Co., Ltd (Hangzhou, China). Yeast (S. cerevisiae, RW) was provided by Angel Yeast Co., Ltd (Yichang, China). Malvidin, delphinidin, cyanidin, peonidin and petunidin were purchased from Beijing Tanmo Quality Inspection Technology Co., Ltd (Beijing, China).
Preparation of blueberry wine
Fresh or frozen blueberries were washed and crushed at a temperature no >35°C before transfer to a sterilized fermenter and heated to 35°C. Potassium metabisulfite was added to produce a final sulfur dioxide concentration of 30 mg·kg−1. Pectinase [≥5,000 U/mg, Novozymes (China) Biotechnology Co., Ltd] was added to a final concentration of 30 mg/kg (w/v) and allowed to react for 1.0 h. Additional sucrose, if present, was added at concentrations of 8, 10, 12, and 14% (w/w) prior to fermentation. Yeast was dissolved in 10 times of water at 30°C and activated for 10 min according to manufacturer's instructions and added at a final concentration of 200 mg·L−1 at 30°C. Samples were taken at 2, 4, 6, 8, and 10 days for further physicochemical analysis. All experimental groups were fermented 3 batches.
Alcohol quantitation
A volume of 100 mL blueberry wine was removed from the fermenter and transferred into a 500 mL distillation flask. The distillate was collected in a water bath held at 20.0 ± 0.1°C for 30 min, and the alcohol content was measured using a density flask.
Acid quantitation
The Acid content of the wine was assayed according to Chinese national standard (18). A volume of 1 mL blueberry wine was transferred to a conical flask and mixed with 100 mL water and two drops of phenolphthalein indicator solution. Then the solution was titrated to the end point with 50 mM sodium hydroxide until the color remained unchanged for 30 s. A control experiment without blueberry wine was performed in parallel.
Tartaric acid was quantified using the following formula:
where X is [Tartaric acid] (g·L−1), C is [NaOH], mol/L, V1-V0 is the difference in volume of NaOH added in the sample and control titrations, respectively (mL), and V2 is the volume of blueberry wine present in the sample titration (mL).
Sugar quantitation
The total sugar content of the wine was assayed by volumetric analysis according to Chinese national standard (18). First, a volume of blueberry wine was diluted tenfold with pure water and heated to boiling. Then, a solution of freshly prepared Fehling's Reagents were added at a rate of 0.5 drop/s until the end point, indicated by the disappearance of color. The total consumed volume of sample solution was recorded and repeated three times in parallel.
Sugar content was quantified according to the following formula:
where X is the total sugar content of blueberry wine (g/L), F represents the total oxidative potential of Fehling's reagents (g of glucose), V1 is the volume of blueberry wine sample absorbed (mL), V2 is the volume of blueberry wine sample diluted, mL, and V3 is the volume of blueberry wine sample consumed (mL).
Colorimetric analysis
Colorimetric analysis of clarified blueberry wine was performed using a colorimeter in transmittance mode (Hunter Lab, USA). The color of each sample was quantified according to the Hunter L, a, b color scale which uses the following parameters: L* represents brightness (where 0 is dark, 100 is light), a* represents the degree of red and green (–a* is green, +a* is red), and b* represents the degree of yellow and blue (–b* is blue, +b* is yellow).
Phenol quantitation
Phenol content determination were assayed according to Martín-Gomez et al. (19)'s analytical method. A volume of 1 mL blueberry wine was diluted fivefold, and 1 mL of this diluted sample was mixed with 1 mL Folin's Phenol Reagent and 5 mL of water. After 3 min, 3 mL 75 g/L sodium bicarbonate was added and the mixture was heated to 50°C for 10 min. The A647 was measured using a spectrophotometer, and used to calculate total phenol content using a standard curve generated with a gallic acid standard.
Anthocyanin characterization
Anthocyanins were characterized using Liquid chromatography tandem mass spectrometry (LC-MS/MS) (waters, Massachusetts, USA) following ultrasonic extraction at 100 w for 10 min. First, 5 g crushed blueberry mash was transferred into a 25 mL colorimetric tube, combined with two volumes of absolute ethanol, one volume of hydrochloric acid, and one volume of water, and then heated in a boiling water bath for 1 h. The sample was then sonicated for 30 min, and centrifuged at 4,000 r/min. The supernatant was collected, filtered through 0.22 μm filter, and analyzed using LC-MS under the following conditions.
Chromatographic column: Waters ACQUITY BEH C18 column (1.7 um, 2.1 × 100 mm); Column temperature: 40°C; Injection volume: 2 μL; Flow rate: 0.5 mL/min. Mobile phase: 0.1% formic acid (A) and 100% acetonitrile (B); Gradient elution procedure: 0–1.1 min, 5–10% B; 1.1–5.5 min, 10–50% B; 5.5–6.9 min, 50–5% B; 6.9–7.5 min, 5% B, balance for 1 min.
Ion source: electric spray (ESI+); Detection mode: MRM; Capillary voltage: 1.0 kV; Ion source temperature: 150°C; Cone gas flow rate: 50 L/h; Solvent gas temperature: 500°C; Solvent gas flow rate: 1,000 L/h; Collision gas (argon): 0.15 mL/min; Dwell time: 0.02 s.
Malvidin, delphinidin, cyanidin, peonidin, and petunidin were directly injected as references.
Electronic nose analysis
A solution of 15 mL blueberry wine was collected into centrifuge tube. A 2 mL injection tube was used absorb volatile gases from the wine and inject into the electronic nose system (Zhejiang Gongshang University, China). The system is composed of an air pump, air chamber, sensor array, signal acquisition system and pattern recognition algorithm. The sensor array is composed of fourteen gas sensitive metal oxide sensors, as shown in Table 1, where each sensor is sensitive to one or more types of gases. When the volatile gases contact the sensor, the conductivity (G) of the sensor changes relative to the initial conductivity (G0), and the ratio G/G0 represents the total response. Each sample is tested six times.
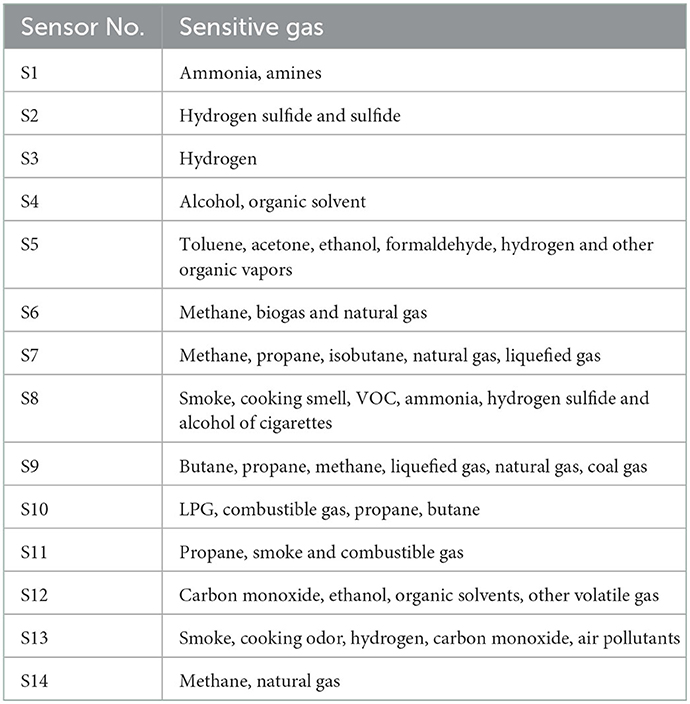
Table 1. Detection of flavor component corresponding to sensors.
Statistical analysis
All data were shown as mean ± standard deviation. Each test was repeated three times. Statistical analysis was performed using EXCEL (Microsoft, USA) and SPSS version 24 (IBM, USA). Graph Pad Prism 8.3.0 (GraphPad Software, USA) was used to graph. One-way ANOVA was used to analyze the anthocyanins content data with Duncan's test, and means were considered significantly different if p < 0.05.
Results and discussion
Alcohol content
During fermentation, sugars present in the blueberry mash are gradually converted into ethanol, and alcohol content is the key indicator for evaluating the quality of blueberry wine. Fermentation begins with the growth stage ~1–2 days following addition of yeast, during which temperature and sugar content have the greatest influence on the fermentation rate (20). Then, the fermentation enters the stable stage where the total concentration of sugar reaches 5 g·L−1, indicating that main fermentation is complete. The main fermentation phase is usually completed in a week (21).
Due to the complexity of the fermentation process, the natural sugar present in the mash is usually not entirely converted into alcohol. For example, although the sugar content of blueberry fruit is 86 g·L−1, blueberry wine fermented without supplemental sugar only produces a final alcohol concentration of 4.5% (Figure 1). Alcohol concentration is gradually increased as external sugar is added, with a sugar content of 12% producing a final alcohol concentration of 11.7%. However, increasing sugar content from 12 to 14% does not lead to a significant increase in alcohol concentration, because yeast vitality is inhibited at high alcohol concentrations. Considering demand of consumers and fermentation capacity, 12% sugar content is recommended to obtain more acceptable alcohol.
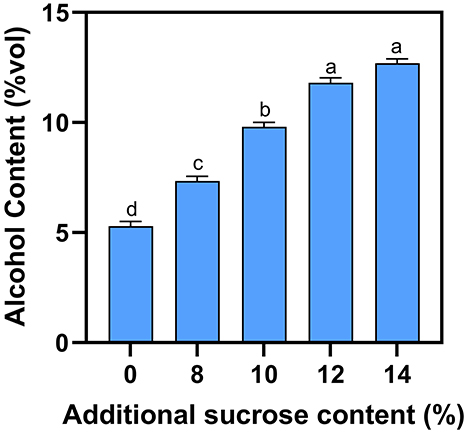
Figure 1. Effect of additional sucrose on alcohol content. Different superscript letters in the graph are significantly different (P < 0.05).
Acid content
Pyruvic acid, acetic acid, lactic acid and other metabolites are produced by yeast during the fermentation process (22). Generally, potassium bicarbonate is added to reduce the acidity of blueberry wine, as high acidity is undesirable (14). Fermentation of natural blueberry wine without supplemental sugar yields 12.6 g·L−1 total acid (Figure 2). As external sugar is added during fermentation, the total acid content rises slightly to 14.2–16.5 g·L−1 at 8–10% sucrose, respectively. However, addition of sucrose beyond 10% does not significantly raise acidity.
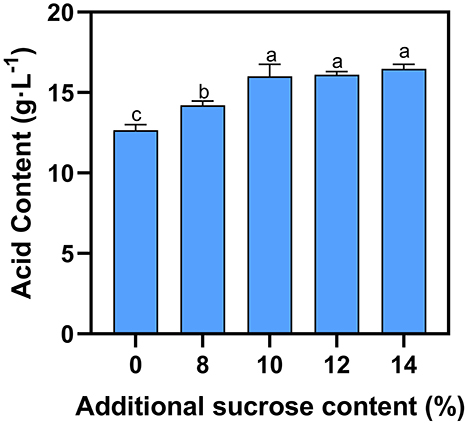
Figure 2. Effect of additional sucrose on acid content. Different superscript letters in the graph are significantly different (P < 0.05).
Sugar content
Fermentation is mainly the process of decomposing sugar and producing alcohol. Therefore, monitoring the sugar content can indicate the fermentation process. For blueberry wine with external sugar concentration < 12% (w/w), the sugar content rapidly decreased to 10 g/L after 6 days and to 5 g/L after 8 days (Figure 3). For blueberry wine with 12 and 14% sugar, this trend was delayed by 2 days. However, in all cases, the fermentation process finishes within 10 days. Total sugar content serves as a proxy for the dynamic blueberry fermentation process (23), and once the post fermentation stage begins, operations such as blueberry residue filtration could be implemented to save time and avoid negative impact of residual microorganisms in wine puree on odor and quality. It is necessary to dynamically monitor the change of sugar content during wine fermentation (24).
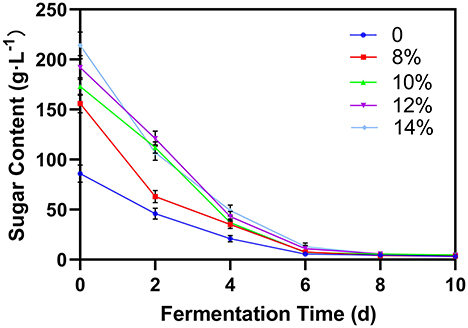
Figure 3. Effect of additional sucrose on sugar content during main fermentation.
Color
The chromaticity parameters L*, a* and b* can be used to infer the quality of blueberry wine throughout fermentation (13). In blueberry wine with added sucrose, the L*value, representing brightness, is lower than in wine without additional sugar, whereas the b* value representing yellow color is higher (Figure 4). This may be a result the added sucrose producing a cumulative increase in fermentation products which darken the wine and alter its color. Interestingly, the a* values which represent red color first rose and then slowly decreased during the fermentation process. The initial increase may be a result of red-colored pigments in residual blueberry peel dissolving into solution, whereas the subsequent decrease may result from yeast metabolizing these compounds as fermentation continues. This result is consistent with current literature, with Li et al. also showing that the a* of blueberry wine increased first during fermentation and then decreased.
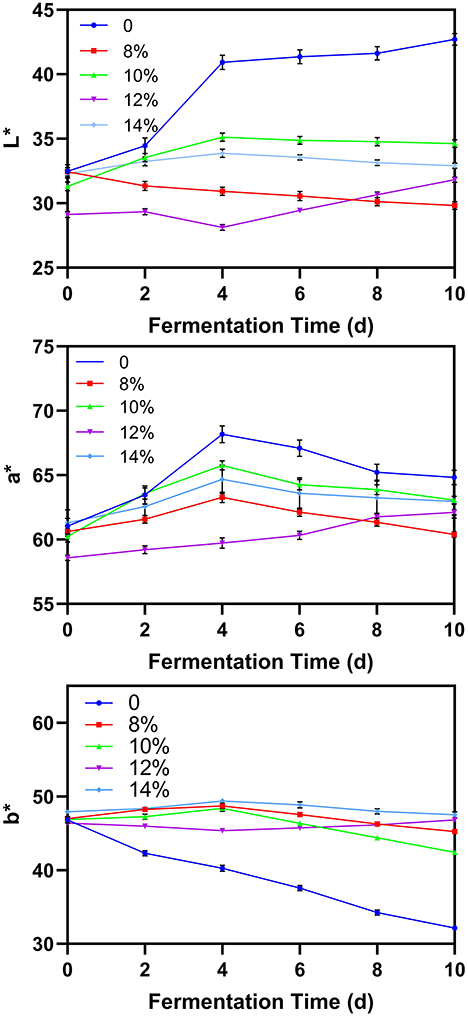
Figure 4. Effect of additional sucrose on L*, a*, and b* during main fermentation.
Phenol content
Phenols are the key substances determining the biological activity of blueberries (19, 25). The composition of phenolic substances is relatively complex. Figure 5 shows the change in phenol concentration during the blueberry fermentation process. In all cases, phenol concentration declined slowly as fermentation progressed, likely due to the metabolism of phenolic substances by the yeast or the reaction with other byproducts of fermentation (26). Although phenol concentration decreased for all groups, blueberry wines with added sucrose showed higher phenol levels early in the fermentation process, suggesting that additional sugar can prevent the degradation of phenols. However, by the end of fermentation, after the external sucrose was fully converted into ethanol, there was no significant difference in the phenol content between samples.
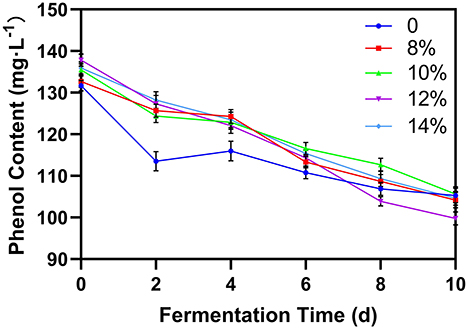
Figure 5. Effect of additional sucrose on phenol content during main fermentation.
Anthocyanin characterization
Anthocyanins are the most concerned components in blueberry processing because of antioxidant activity and health benefits (27). Anthocyanins are susceptible to several processing and storage conditions, such as pH condition, temperature and light exposure, etc. (28) and the degradation and loss of anthocyanin are inevitable during the fermentation solution environment (28). Anthocyanins are composed of cyanidin, delphinidin, malvidin, petunidin and peonidin and glycosidic groups (29), and can be deglycosylated into their corresponding aglycone structure by heating in acidic environment. The resulting cyanidin, delphinidin, malvidin, petunidin, and peonidin correspond to their native anthocyanin forms and can be quantitatively analyzed using LC-MS/MS (30). Because blueberries contain a wide variety of anthocyanins, it can be difficult to find appropriate reference samples to accurately quantify them (31). Furthermore, the retention time of aglycones are similar on HPLC, resulting in poor resolution and inaccurate quantification. However, liquid chromatography coupled with tandem mass spectrometry (LC-MS/MS) can avoid the disadvantages of HPLC by accurately determining and quantifying both the parent ions and the daughter ions of the substance resulting from a specific collision energy. Importantly, the cyanidin, delphinidin, malvidin, petunidin, and peonidin references were well resolved using this technique (Figure 6).
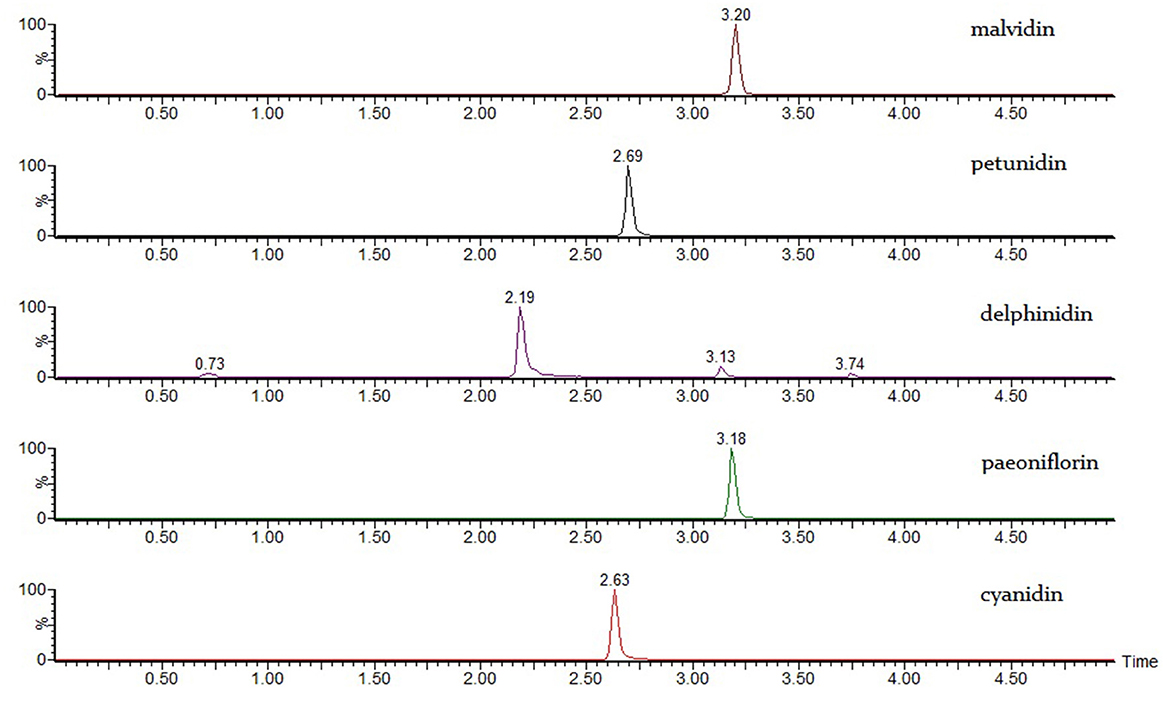
Figure 6. Mass spectrogram of malvidin, petunidin, delphinidin, paeoniflorin, and cyanidin.
Delphinidin and malvidin are the two most abundant anthocyanins in blueberries, which were both lost to varying degrees after the main fermentation (Figure 7), consistent with previous literature reports (23). Groups with added sucrose show significantly higher anthocyanin levels suggesting that additional sucrose can improve anthocyanin stability during fermentation. A similar protective function resulting from mannoproteins has also been demonstrated in the literature (17). The groups with 12% external sucrose showed the smallest loss in overall anthocyanin concentration during fermentation, with a anthocyanin content of 51.9% relative to levels prior to fermentation. Within the analyzed anthocyanin classes, the degree of degradation varied between classes. Delphinidin and malvidin levels showed the greatest loss during fermentation, with delphinidin levels 31.3% of their original concentration and malvidin levels 64.8% of their original concentration. Therefore, 12% sugar addition concentration was recommended because the favored anthocyanin loss was minimal.
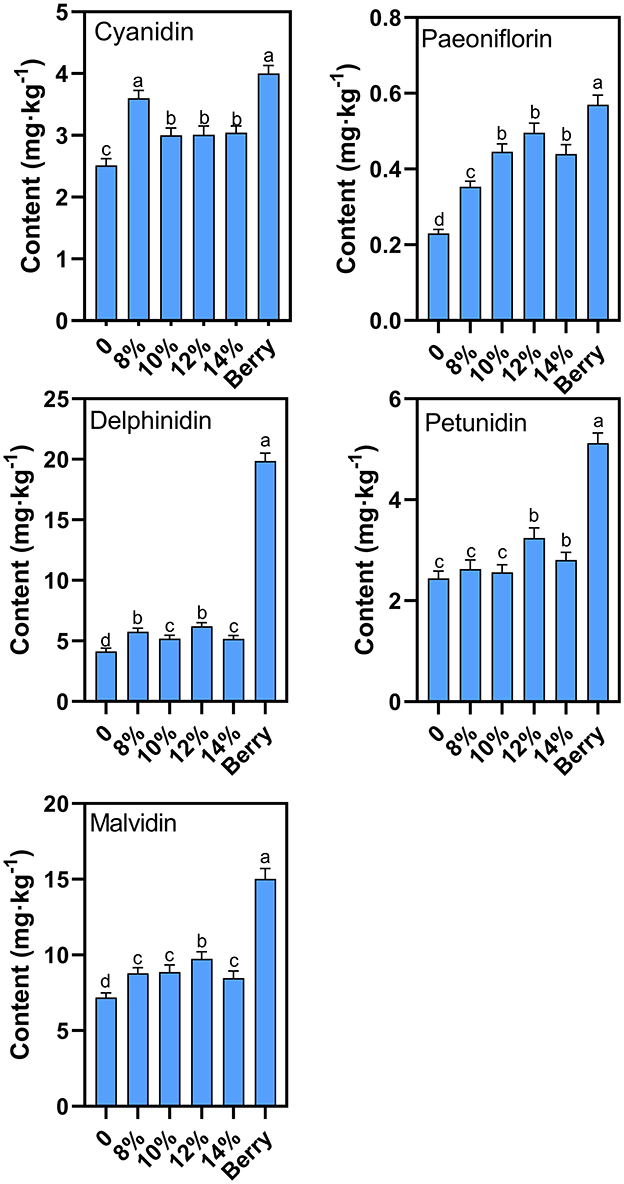
Figure 7. Effect of additional sucrose on anthocyanins after main fermentation. Different superscript letters in the graph are significantly different (P < 0.05).
Electronic nose analysis
It is possible to characterize the odor profile of wine using an electronic nose, which represent fourteen kinds of aromatic substances produced during blueberry wine fermentation (32, 33). For all samples, sensors S8, S1, S2, and S4 have the highest response (Figure 8A), and represent volatile alcohols, aromatic esters, sulfides and amines, respectively, which together constitute the characteristic odor components of blueberry wine. Alcohols, esters and amines are metabolites naturally produced by yeast during fermentation, while sulfides originate from the addition of potassium metabisulfite to inhibit bacteria growth. Additional sucrose does not change the basic odor composition of blueberry wine, reflected by the similar shape of the electronic nose odor profile between all samples. Compared with the experimental group without added sucrose, the added sucrose groups had similar odor composition, which indicates that the added sucrose produces specific odor components. However, additional sucrose enhances the response of each odor substance compared with the control group, especially the group of 12%. Although sucrose is metabolized to produce alcohol in the fermentation process, its metabolism also promotes the accumulation of odorful substances like esters, indicated by the increased response of sensor S8.
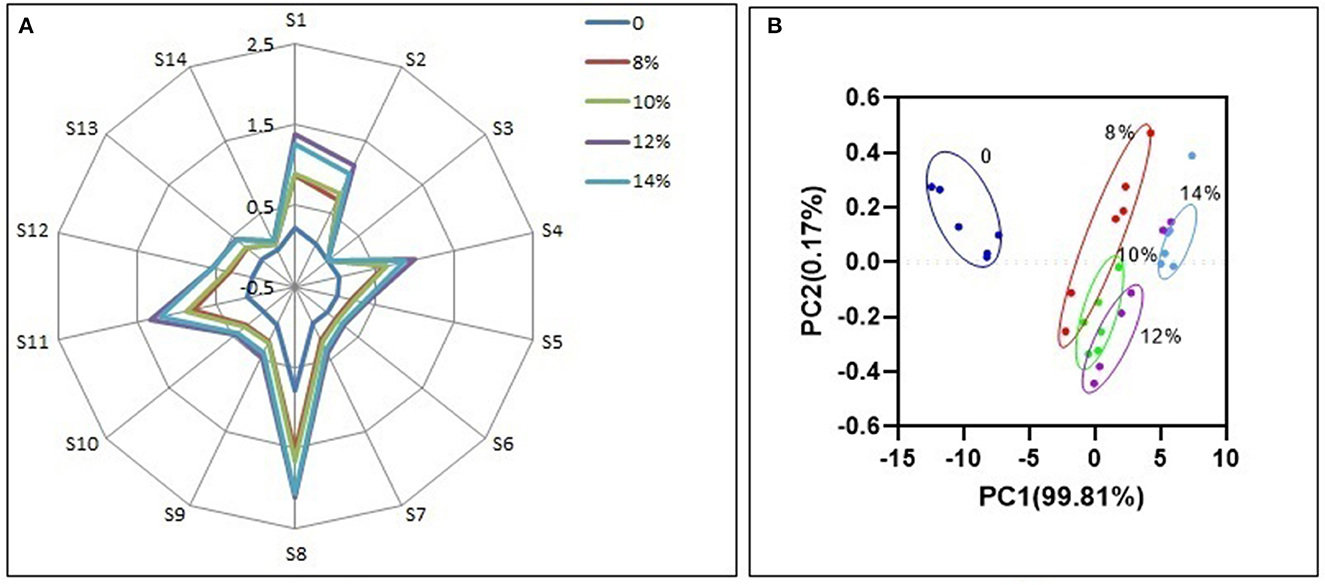
Figure 8. Odor response value of electronic nose (A) and PCA (B).
Although the odor composition is similar, different groups of blueberry wine can be distinguished by principal component analysis (PCA) of electronic nose data (Figure 8B). Principal factor 1 (PC1) explained 99.81% of the variance in the data and principal factor 2 (PC2) explained 0.17% of the variance. The DI value was 84.39%, above the required 80% cutoff (34), indicating PCA can effectively discriminate electronic nose profiles with good repeatability.
Conclusion
The physicochemical properties blueberry wine and the effect of external sucrose during main fermentation process of were analyzed by measuring alcohol content, sugar, color, phenol, anthocyanins, acid, and odor. Although yeast strain and sulfur dioxide were not investigated as part of this study, these also impact the physicochemical properties of blueberry wine and warrant further investigation. Additional sucrose extends the fermentation time and increases the acid content relative to natural blueberry wine. The extra sugar also alters the color profile of the wine, by lowering L* and raising b* relative to natural blueberry wine. Although total anthocyanin levels are reduced throughout the fermentation process, addition of sugar produced a protective effect on delphinidin, cyanidin, paeoniflorin, and petunidin, and especially malvidin. Finally, additional sugar enhanced volatile odor components in blueberry wine, particularly of alcohols and esters, as measured by an electronic nose. Taken together, these data recommend addition of 12% sucrose in commercial preparation of blueberry wine especially for physicochemical properties of alcohol, anthocyanin loss and odor.
Data availability statement
The original contributions presented in the study are included in the article/supplementary material, further inquiries can be directed to the corresponding authors.
Author contributions
JL and JF designed and conceived the study. LW, JQ, and HJ performed the experiments. QW analyzed the data and drafted the manuscript. JL, QW, LZ, and LW contributed to the writing of the manuscript. LZ provided the funding and resources. All authors revised and approved the submitted version of the manuscript.
Funding
This research was supported by Zhejiang Provincial Natural Science Foundation of China under Grant No. LGN18C200011, Hangzhou Agricultural Research Initiative Design Foundation No. 20190101A06, Hangzhou Academy of Agricultural Sciences Innovation Foundation No. 2022HNCT-22 and Hangzhou High-level Special Talents Support Plan.
Acknowledgments
We sincerely thank all participants for their support. Besides, we are incredibly grateful to Joseph Elliot at the University of Kansas for his assistance with English language and grammatical editing of the manuscript.
Conflict of interest
The authors declare that the research was conducted in the absence of any commercial or financial relationships that could be construed as a potential conflict of interest.
Publisher's note
All claims expressed in this article are solely those of the authors and do not necessarily represent those of their affiliated organizations, or those of the publisher, the editors and the reviewers. Any product that may be evaluated in this article, or claim that may be made by its manufacturer, is not guaranteed or endorsed by the publisher.
References
1. Li S, Yang T, Dan L, Guang W, Jian Z, Sivakumar M, et al. Fermentation of blueberry juices using autochthonous lactic acid bacteria isolated from fruit environment: Fermentation characteristics and evolution of phenolic profiles. Chemosphere. (2021) 276:130090. doi: 10.1016/j.chemosphere.2021.130090
2. Liu F, Li S, Gao J, Cheng K, Uan F. Changes of terpenoids and other volatiles during alcoholic fermentation of blueberry wines made from two southern highbush cultivars. LWT. (2019) 109:233–40. doi: 10.1016/j.lwt.2019.03.100
3. Li D, Li B, Ma Y, Sun X, Lin Y, Meng X. Polyphenols, anthocyanins, and flavonoids contents and the antioxidant capacity of various cultivars of highbush and half-high blueberries. J Food Compos Anal. (2017) 62:84–93. doi: 10.1016/j.jfca.2017.03.006
4. Byung-Taek O, Jeong S, Velmurugan P, Park J, Jeong D. Probiotic-mediated blueberry (Vaccinium corymbosum L.) fruit fermentation to yield functionalized products for augmented antibacterial and antioxidant activity. J Biosci Bioeng. (2017) 124:542–50. doi: 10.1016/j.jbiosc.2017.05.011
5. Ongkowijoyo P, Luna-vital DA, Elvira GDM. Extraction techniques and analysis of anthocyanins from food sources by mass spectrometry: an update. Food Chem. (2018) 250:113–26. doi: 10.1016/j.foodchem.2018.01.055
6. Sun X, Zhou T, Wei C, Lan W, Zhao Y, Pan Y, et al. Antibacterial effect and mechanism of anthocyanin rich Chinese wild blueberry extract on various foodborne pathogens. Food Control. (2018) 94:155–61. doi: 10.1016/j.foodcont.2018.07.012
7. Wang C, Tao Y, Han Y, Zhang R, Li L, Gao Y. Influences of subcellular Ca redistribution induced by γ irradiation on the fruit firmness of refrigerated blueberries. Postharvest Biol Tec. (2023) 195:112146. doi: 10.1016/j.postharvbio.2022.112146
8. Guo J, Yin M, Han X, You Y, Huang W, Zhan J. The influence of oxygen on the metabolites of phenolic blueberry extract and the mouse microflora during in vitro fermentation. Food Res Int. (2020) 136:109610. doi: 10.1016/j.foodres.2020.109610
9. Jiang B, Liu R, Fang X, Wu W, Han Y, Chen H, et al. Botrytis cinerea infection affects wax composition, content and gene expression in blueberry fruit. Postharvest Biol Technol. (2022) 192:112020. doi: 10.1016/j.postharvbio.2022.112020
10. Ana M, Eduardo C, Catarina B, José M, O'Arlete M. Production of blueberry wine and volatile characterization of young and bottle-aging beverages. Food Sci Nutr. (2019) 7:617–27. doi: 10.1002/fsn3.895
11. Guisella T, Nidia C, Patricio O, Guillermo P. Blueberry juice: bioactive compounds, health impact, and concentration technologies—a review. J Food Sci. (2021) 86:5062–77. doi: 10.1111/1750-3841.15944
12. Karolina C, Monika M, Dorota K, Tomasz K. The influence of ultrasound and cultivar selection on the biocompounds and physicochemical characteristics of dried blueberry (Vaccinium corymbosum L). snacks J Food Sci. (2018) 83:2305–16. doi: 10.1111/1750-3841.14292
13. Li X, Zhang L, Peng Z, Zhao Y, Wu K, Zhou N, et al. The impact of ultrasonic treatment on blueberry wine anthocyanin color and its in-vitro anti-oxidant capacity. Food Chem. (2020) 333:127455. doi: 10.1016/j.foodchem.2020.127455
14. Varo MA, Martin-Gomez J, Serratosa MP, Merida J. Effect of potassium metabisulphite and potassium bicarbonate on color, phenolic compounds, vitamin C and antioxidant activity of blueberry wine. LWT. (2022) 163:113585. doi: 10.1016/j.lwt.2022.113585
15. Van Leeuwen C, Roby J, Alonso-Villaverde V, Gindro K. Impact of clonal variability in vitis vinifera cabernet franc on grape composition, wine quality, leaf blade stilbene content, and downy mildew resistance. J Agri Food Chem. (2012) 61:19–24. doi: 10.1021/jf304687c
16. Su M, Chien P. Antioxidant activity, anthocyanins, and phenolics of rabbiteye blueberry (Vaccinium ashei) fluid products as affected by fermentation. Food Chem. (2007) 104:182–7. doi: 10.1016/j.foodchem.2006.11.021
17. Sun X, Yan Z, Zhu T, Zhu J, Wang Y, Li B, et al. Effects on the color, taste, and anthocyanins stability of blueberry wine by different contents of mannoprotein. Food Chem. (2019) 279:63–9. doi: 10.1016/j.foodchem.2018.11.139
19. Martín-Gomez J, García-Martínez T, Angeles Varo M, Merida J, Serratosa MP. Phenolic compounds, antioxidant activity and color in the fermentation of mixed blueberry and grape juice with different yeasts. LWT. (2021) 146:111661. doi: 10.1016/j.lwt.2021.111661
20. Zhang N, Gao Y, Fan G, Zhong W, Chen X, Guo X, et al. Combined high-throughput and fractionation approaches reveal changes of polysaccharides in blueberry skin cell walls during fermentation for wine production. Food Res Int. (2022) 162:112027. doi: 10.1016/j.foodres.2022.112027
21. Liu S, Laaksonen O, Kortesniemi M, Kalpio M, Yang B. Chemical composition of bilberry wine fermented with non-Saccharomyces yeasts (Torulaspora delbrueckii and Schizosaccharomyces pombe) and Saccharomyces cerevisiae in pure, sequential and mixed fermentations. Food Chem. (2018) 266:262–74. doi: 10.1016/j.foodchem.2018.06.003
22. Chena C, Xiong Y, Xie Y, Zhang H, Jiang K, Pang X, et al. Metabolic characteristics of lactic acid bacteria and interaction with yeast isolated from light-flavor Baijiu fermentation. Food Biosci. (2022) 50:102102. doi: 10.1016/j.fbio.2022.102102
23. Sun X, Shokri S, Gao B, Xu Z, Li B, Zhu T, et al. Improving effects of three selected co-pigments on fermentation, color stability, and anthocyanins content of blueberry wine. LWT. (2022) 156:113070. doi: 10.1016/j.lwt.2022.113070
24. Zhao C, Su W, Mu Y, Jiang L, Mu Y. Correlations between microbiota with physicochemical properties and volatile flavor components in black glutinous rice wine fermentation. Food Res Int. (2020) 138:109800. doi: 10.1016/j.foodres.2020.109800
25. Aleixandre-Tudo JL, Buica A, Nieuwoudt H, Aleixandre JL, du Toit W. Spectrophotometric analysis of phenolic compounds in grapes and wines. J Agr Food Chem. (2017) 20:4009–26. doi: 10.1021/acs.jafc.7b01724
26. Morata A, Loira I, MaríaHeras J, JesúsCallejo M, Tesfaye W, González C, et al. Yeast influence on the formation of stable pigments in red winemaking. Food Chem. (2016) 197:686–91. doi: 10.1016/j.foodchem.2015.11.026
27. Kalt W, Cassidy A, Howard LR, Krikorian R, Stull AJ, Tremblay F, et al. Recent research on the health benefits of blueberries and their anthocyanins. Adv Nutr. (2020) 11:224–36. doi: 10.1093/advances/nmz065
28. Kalt W, McDonald JE, Donner H. Anthocyanins, phenolics, and antioxidant capacity of processed lowbush blueberry products. J Food Sci. (2000) 65:390–3. doi: 10.1111/j.1365-2621.2000.tb16013.x
29. Chai Z, Herrera-Balandrano DD Yu H, Beta T, Zeng Q, Zhang X, et al. A comparative analysis on the anthocyanin composition of 74 blueberry cultivars from China. J Food Compos Anal. (2021) 102:104051. doi: 10.1016/j.jfca.2021.104051
30. Lang Y, Li E, Meng X, Tian J, Ran X, Zhang Y, et al. Protective effects of bovine serum albumin on blueberry anthocyanins under illumination conditions and their mechanism analysis. Food Res Int. (2019) 122:487–95. doi: 10.1016/j.foodres.2019.05.021
31. Norberto S, Silva S, Meireles M, Faria A, Pintado M, Calhau C. Blueberry anthocyanins in health promotion: a metabolic overview. J Funct Foods. (2013) 5:1518–28. doi: 10.1016/j.jff.2013.08.015
32. Sanaeifar A, Dizaji H, Jafari A, de LaGuardia M. Early detection of contamination and defect in foodstuffs by electronic nose: a review. TrAC Trends Anal Chem. (2017) 97:257–71. doi: 10.1016/j.trac.2017.09.014
33. Zhang L, Hua Y, Wang Y, Kong B, Chen Q. Evaluation of the flavour properties of cooked chicken drumsticks as affected by sugar smoking times using an electronic nose, electronic tongue, and HS-SPME/GC-MS. LWT. (2021) 140:110764. doi: 10.1016/j.lwt.2020.110764
Keywords: physicochemical properties, blueberry, wine, main fermentation, sucrose
Citation: Liu J, Wang Q, Weng L, Zou L, Jiang H, Qiu J and Fu J (2023) Analysis of sucrose addition on the physicochemical properties of blueberry wine in the main fermentation. Front. Nutr. 9:1092696. doi: 10.3389/fnut.2022.1092696
Received: 08 November 2022; Accepted: 31 December 2022;
Published: 19 January 2023.
Edited by:
Hao Jiang, Northwest A&F University, ChinaReviewed by:
Zhenbin Liu, Shaanxi University of Science and Technology, ChinaWenchao Cai, Shihezi University, China
Gongnian Xiao, Zhejiang University of Science and Technology, China
Copyright © 2023 Liu, Wang, Weng, Zou, Jiang, Qiu and Fu. This is an open-access article distributed under the terms of the Creative Commons Attribution License (CC BY). The use, distribution or reproduction in other forums is permitted, provided the original author(s) and the copyright owner(s) are credited and that the original publication in this journal is cited, in accordance with accepted academic practice. No use, distribution or reproduction is permitted which does not comply with these terms.
*Correspondence: Junbo Liu,  anVuYmxpdUAxMjYuY29t; Ligen Zou, amdzemxnQDE2My5jb20=