 Fuge Niu1
 Christos Ritzoulis
 Weichun Pan
95% of researchers rate our articles as excellent or good
Learn more about the work of our research integrity team to safeguard the quality of each article we publish.
Find out more
ORIGINAL RESEARCH article
Front. Nutr. , 04 January 2023
Sec. Food Chemistry
Volume 9 - 2022 | https://doi.org/10.3389/fnut.2022.1082464
This article is part of the Research Topic Advances in Anthocyanins: Sources, Preparation, Analysis Methods, Bioavailability, Physiochemical Properties, and Structural Features View all 5 articles
Introduction: Protein gelation process is of importance in food industry. The objective of this study is to investigate the influence of salt concentration variation, which induced protein conformation change, on protein’s intermolecular interactions and its gelation process.
Methods: Paramyosin has been separated and purified from myofibrillar protein extracted from giant squid. Then Giant squid’s paramyosin molecular mass and intermolecular interactions were quantified by means of light scattering techniques. Finally, the micro-rheology study via diffusing wave spectroscopy (DWS) technique revealed that this conformation change dramatically affected myofibrillar protein gelation process.
Results: The obtained apparent molecular weight (ca 2 × 10⁵ g/mol) suggested that protein molecules existed as dimers, while the second virial coefficient A2 significantly reduced from −3.98456 × 10⁻⁵ to −5.07575 × 10⁻⁴ ml mol/g2 when KCl concentrated from 0.15 to 1 mol/L. Light scattering data also suggest that paramyosin dimers are stiff, with a persistence length of 120 nm, almost the length of a molecule and independent of salt concentration. Mean-square displacement (MSD) of tracer particles at 5 temperatures with 4 salt concentrations displayed that this conformation change had dramatic effect. Therefore, G’ and G” were remarkably altered with at least one order of magnitude difference owing to this event occurrence.
Conclusions: Paramyosin conformation change due to KCl concentrated enhances attractive interactions with apparent molecular mass increase, which resulted in majority paramyosin molecules (> 99%) in dimeric form and promoted aggregates formation. DWS technique revealed that the conformation change dramatic affected this process characterized by the correlation functions, MSD, and G’ and G”. This study brings forward data on understanding the effect of a major salt supplement, KCl, on the chemical physics of a major muscle protein.
Salt plays a major role in the food industry and is multifunctional. In conventional wisdom, except for the essential role of regulating food flavor to achieve desirable organoleptic characteristics, it is able to modify intermolecular interactions between molecules via either the screening effect originating from Coulomb force (1) or binding to the specific positions of bio-macromolecules (2). As a result, protein solubility should strongly depends on ion species and strength. In the protein gelation process, the salt concentration is a common means to modify the morphology of protein aggregates and thereby control the properties of final products (3). In addition, ion has a species effect on protein stability. Hundred years ago, Hofmeister studied the dependency of egg white protein solubility on salt (4), initiating the famous “Hofmeister series,” which later on extended to describe the ion-specific effects on protein stability and other phenomena (5). However, potassium chloride, made up of two Hoffmeister-neutral ions, namely, K+ and Cl–, should, in principle, not have any influence on protein conformation. However, in 2017, this group reported KCl’s salting-in effect on muscle protein, which has been ascribed to the enhancement of the repulsive intermolecular interactions between protein molecules, with paramyosin changing its conformation from 100% helix to 100% β-sheet when KCl concentration increases from 0.1 M to 0.5 mol/L (6). Understanding in detail the effect of KCl on the paramyosin’s structure is important, as this salt is a prime candidate for the replacement of NaCl in the processing and consumption of muscle food products, given that the consumption of NaCl raises well-known health concerns (7).
In this study, the giant squid was selected due to its abundant and high nutrition (6). However, its drawback is obvious as well, such as bitter taste and high protein solubility with the inferior gelation performance of its mince. Although the effect of salt concentration on this process is reported (8), the effect of composition protein conformation modification has not been available so far, to the best of our knowledge.
In the present study, paramyosin has been separated from the solution of myofibrillar protein extracted from giant squid, and its molecular weight and purity were assessed by sodium dodecyl sulfate-polyacrylamide gel electrophoresis (SDS-PAGE). Since results obtained from the light scattering technique are sensitive to impurities, size exclusion chromatography (SEC) was applied to further analyze the purity of paramyosin. In order to complement the above, the molecular weight of paramyosin and the interactions between the protein individual macromolecules were assessed as well.
Then, diffusing wave spectroscopy (DWS) was applied to track myofibrillar protein gelation with 4 KCl concentrations (0, 0.15, 0.5, and 1 M) under 5 temperatures (25, 30, 35, 40, and 45°C). The salt concentration range covers protein responsibility from no effect to pure screening effect and then to conformation change. The studying temperature was stopped at 45°C because myofibrillar protein molecules denaturation mostly occurred under this value in the heating gelation process (9). This study aims at understanding the mechanism of the KCl effect on paramyosin interactions, thereby probing this protein molecule conformation change under various KCl concentrations. Moreover, the influence of this molecular conformation change on the myofibrillar protein gelation process is uncovered. This study will shed light on meat food process development with the guide of salt-protein interactions in order to achieve desired texture and flavor while gradually substituting NaCl with KCl.
Glycine, acrylamide solutions with 30% (w/v), SDS, ethylene diamine tetraacetic acid (EDTA), dithio-bis-nitrobenzoic acid (DTNB), 1-anilino-8-naphtha-lene sulfonate (ANS), Triton-X100, N,N,N′,N′-tetramethylethylenediamine (TEMED), and ammonium persulfate (APS) were provided by Macklin Biochemical Co., Ltd. (Shanghai, China). Ready-to-use protein molecular weight standard marker (6.5–200 kDa) was purchased from Sigma (St. Louis, MO). Disodium hydrogen phosphate (Na2HPO4), potassium dihydrogen phosphate (KH2PO4), potassium chloride, sodium hydroxide, ethanol, and other reagents were obtained from Hangzhou Jiecheng Biotechnology Co. (Hangzhou, China). All reagents were of analytical purity.
Giant squid, purchased from Zhoushan Second Ocean Fishery Co., Ltd. (Zhoushan, China), were immediately frozen without any treatment after being caught and stored at −20°C for less than 3 months. All squids were deheaded, degutted, and cleaned using water after they were defrosted in the air to room temperature. The mantles with the fins were sealed and stored at −40°C for further experiments.
Myofibrillar protein samples were prepared following the procedure described by Hashimoto et al. with minor modifications (10). Ground muscle mixed with buffer A (15.6 mM Na2HPO4, 3.5 mM KH2PO4, 10 mM EDTA, pH 7.5) (1:8, w/v) was homogenized using a tissue homogenizer (Homogenizer T25 basic, IKA, Staufen, Germany) at a speed of 12,745 × g. Homogenization was performed in an ice bath, as to avoid overheating and consequent protein denaturation; five successive 30 s homogenization cycles were performed, each followed by a 30 s interval. The connective tissues were then removed by filtration using two layers of gauze. The obtained material was centrifuged at 8,000 × g for 10 min at 4°C (Biofuge Stratos, Thermo Scientific Inc., Belmont, CA, USA).
The supernatant was removed, and the sediment was resuspended with 2 vol 1% Triton X-100 (w/v). This sample was again centrifuged at 8,000 × g for 10 min at 4°C. The residue (the myofibrillar protein precipitate) was washed with 8 vol of buffer A. The mixtures were then centrifuged at 8,000 × g for 10 min at 4°C. The supernatant was removed, and the washing procedure was repeated three times. The white paste precipitate was myofibrillar protein.
The white paste precipitate was mixed with buffer B (0.15 M KCl, 15.6 mM Na2HPO4, 3.5 mM KH2PO4, pH 7.5) and refrigerated overnight at 4°C. The mixtures were then centrifuged at 8,000 × g for 10 min at 4°C. The final pellet, which still carried a lot of aqueous solutions, was collected and stored at −20°C.
Myofibrillar protein pellets were dissolved in phosphate-buffered saline (PBS) solution and then stayed for 3 h for the protein molecules’ full hydration. This mixture was centrifuged at 10,000 × g/10 min/4°C. The supernatants were collected for further study.
The Bradford assay was utilized in order to determine protein concentration (11). A volume of 1 ml protein solution was mixed with 5 ml Coomassie Brilliant Blue reagent for 5 min, and then, its absorbance values were assessed using a spectrophotometer (UV-2600, Shimadzu, Kyoto, Japan) operating at 595 nm. With the aid of a standard curve obtained from bovine serum albumin, the corresponding concentration values were assessed. All experiments were performed at 25°C, and each sample was assessed at least three times.
The method to purify paramyosin was described in detail by Zhang et al. (6). In brief, an AKTA purifier (100-fast protein liquid chromatography system) (GE Healthcare, Pittsburg, PA) was used to purify the target protein. The myofibrillar protein sample (6.25 mg/ml) was loaded onto a HiTrap Q FF column (5 ml, GE Healthcare) that had been pre-equilibrated in PBS buffer. The column was washed with 0.1–1 M KCl, using 42 column volumes (CVs) in three consecutive steps, with 0, 0.3, 0.5, and 1 M KCl. The protein concentration was measured based on ultraviolet (UV) absorption at 280 nm. The composition of each fraction (1 ml) was determined using SDS-PAGE. The fractions under peak A (Supplementary Figure 1) were pooled, desalted, and concentrated by centrifugation (10,000 × g/10 min/4°C) to 3 mg/ml. Similar operations were carried out for the fractions corresponding to peaks B, C, and D as well. Each sample (500 μl) was then loaded onto a Superdex 200 10/30 GL gel filtration column (24 ml, GE Healthcare) that had been equilibrated with PBS buffer (0.1 M KCl, 15.6 mM Na2HPO4, 3.5 mM KH2PO4, pH 7.5) and then eluted with 1.5 CVs of this PBS buffer solution at a rate of 0.5 ml/min. Three fractions were desalted and concentrated. Part of the protein sample was used for assessment, and the rest was dried using a custom-built vacuum freeze-drying system; the obtained powder was packaged and stored at −20°C.
Polyacrylamide gel electrophoresis using dissociating SDS and a Tris–glycine–SDS buffer system in a continuous gel (from 6 to 18%) was performed as described by Zhang using a Mini-Protean™ Tetra system (Bio-Rad Laboratories, Richmond, CA, USA) (6). An aqueous mixture containing 0.1 M Tris–HCl, 4% SDS (w/v), 20% glycerol (v/v), 5 × 10⁻⁵ mol/L bromophenol blue (3′,3″,5′,5″-tetrabromophenolsulfonephthalein, w/v), and 200 mM dithiothreitol was used to dissociate samples. Then, the resultant samples were heated at 100°C for 5 min and then cooled to room temperature (25°C) before loading. The loading sample concentration was 2 mg/ml. The conditions of electrophoretic runs were 17–25°C for half an hour at 70 V and then for 3 h at 110 V. After electrophoresis, the gel was stained with 0.1% (w/v) Coomassie Brilliant Blue R-250 (Bio Basic Inc., Markham, Canada) in 40% ethanol and 10% acetic acid and then destained with 40% (v/v) ethanol and 10% acetic acid.
A volume of 0.05 g of obtained paramyosin powder was mixed with 10 ml PBS buffer (0.1 M KCl, pH 7.5) at 4°C under stirring for 3 h and then centrifuged at 5,000 × g for 10 min at 4°C. The supernatant was collected and diluted down to 1 mg/ml with 0.05 M phosphate buffer and was measured with the Bradford assay. This solution was passed through a 0.45 μm filter (Millex-HA, 25 mm, MCA) to remove dust and was then sonicated in an ultrasound cleaner (KQ-50DE, Shumei Co., Kunshan, Jiangsu, China) at 25°C with an ultrasonic frequency of 40 kHz and an input power of 100 Wm, in order to remove air bubbles. A Shodex SEC/GPC protein KW-804 column (300 × 8.0 mm i.d.), an Agilent 1,260 Quaternary pump with an Agilent 1260 VWD detector (λ = 280 nm) was used to separate and detect the components of the protein solutions. A PBS solution with 0.5 M KCl was used as the mobile phase with a flow rate of 1 ml/min. The elution time was 20 min, and the column temperature was 25°C.
Stock solutions of paramyosin were prepared by dissolution of its powder 0.04 g in 40 ml PBS buffer (pH 7.5). Meanwhile, the same PBS buffer was used to prepare 3 M KCl solutions. Solutions with various paramyosin concentrations with 0.15 M KCl were prepared by mixing with the desired volume of the protein solution and the counterpart of the 3 M KCl solution. Similar procedures were also carried out to prepare a series of paramyosin solutions with various concentrations of 0.5 and 1.0 M KCl, respectively.
The particle size of the purified paramyosin solution was assessed using an ALV/CGS-3 goniometer system (ALV, Langen, Germany). The measurement conditions were 25°C, 90° (the detecting angle), and 1 min (acquiring time for each shooting). Each sample was repeated at least 3 times.
The literature reported that the gyration radius of paramyosin was ca. 38 nm (12), approximately 1/17 of the laser wavelength (632.8 nm). Thus, its static light scattering (SLS) results are independent of the detector angle, (13) and the Debye plot (Eq. 1) could be used to estimate protein molecule mass Mw and the intermolecular interactions characterized by the second virial coefficient A2 between protein molecules.
where is the Rayleigh ratio of the scattered to the incident light intensity; K is the machine constant defined by (2), where n0 is the refractive index of the solvent at the wavelength of the laser beam, NA is Avogadro’s number; and , the refractive increment, is the derivative of the refractive index n with respect to protein concentration c.
The refractive index increments were determined using an SEC-3010 DN/DC differential refractometer (WGE Dr. Bures, Dallgow-Doeberitz, Germany), operated at 620 nm and 25°C.
All experiments were carried out at 25°C using salt concentrations of 0.15, 0.5, and 1.0 M. The paramyosin concentrations were varied from 0.01 to 0.1 mg/ml. Thus, the third- and higher-order virial coefficients made no contribution to the measurements. The measurement angle was 90°, and the acquirement time was 1 min.
A commercial DWS apparatus (λ = 685 nm, 45 mW, LS Instruments, Fribourg, Switzerland) equipped with a multispeckle echo module for long correlation times was applied in this study (14). A flat glass cell (Hellma 110-OS) with an optical length of 5 mm was used as a container. A Peltier temperature controller (±0.01°C) was used to control the sample temperature. The intensity cross-correlation function was calculated using a digital correlator, based on the intensity assessment via a photomultiplier, and the electrical field correlation function g1(τ) was determined as follows:
where p(s) is the probability distribution function of a given path followed by the photon of total length s, s is the path length, k0 = 2πn/λ, with n the refractive index of the solvent and λ the wavelength of the laser, < Δr2(t) > is the mean square displacement (MSD) of the scatters, and l* is the photon transport mean free path which depends directly on the sample. The l* of the sample is calculated directly by comparing the count rate (CR) of a reference sample as follows:
The MSD can be extracted from g1(τ) inverting Eq. 1. While the storage and loss moduli could be estimated by the Laplace transformation of the MSD (fitted by a polynomial of order 7).
The sample was prepared by blending the desirable amount of myofibrillar protein pellet with PBS buffer containing the desirable KCl concentration. Then, this obtained solution stayed at 4°C overnight for full hydration. Its protein concentration was determined by Bradford assay with the value of 5.6 mg/ml. Approximately 3 ml of solution was moved to the glass cell, which was then mounted on the DWS system. Using the control software, each testing temperature was set and the waiting period was 1–2 min for the system to achieve thermal equilibrium. Then, the DWS measurement was carried out with the transmission mode with an acquirement time of 1 min. Each condition was repeated at least 10 times. The size of the tracer was determined by the dynamic light scattering (DLS) technique.
Values were taken as the mean ± the standard deviation. Descriptive statistics, one-way analysis of variance, and multiple comparisons using Tukey’s test were performed using SPSS software (version 18.0). The significance level was set at P < 0.01.
Supplementary Figures 1, 3 displayed the myofibrillar protein separations under two consequent columns, HiTrap Q FF 16/10 column (5 ml) and Superdex 200 10/30 GL gel filtration column (24 ml). Protein compositions in the resultant solutions in each marked peak were analyzed by the SDS-PAGE technique and are exhibited in Supplementary Figures 2, 4. The peaks BA, CA, and DA collected by the gel filtration chromatography should be paramyosin with a molecular weight of approximately 97 kDa (6, 15).
The resultant paramyosin was analyzed by SEC to further assess its purity. In Supplementary Figure 5, it can be seen that the majority of protein belongs to paramyosin, since there is only one significant peak while the second small is the system peak. The rough assessment of paramyosin purity due to the peak area shows that its purity should be > 90%. In the separation and purification of paramyosin process, the salting-in effect due to its molecular conformation change results in the significant increase of (P < 0.01) Rh of its dimmers. Similar behaviors appear in the mixture of human serum albumin with single-walled and multi-walled carbon nanotubes and the drug molecules interacting with calf thymus DNA (16, 17).
The intermolecular interactions between paramyosin molecules were assessed by constructing and analyzing a Debye plot (Figure 1A). The slope in a Debye plot is 2A2 (Eq. 1). The interactions between particles are repulsive when A2 > 0. While A2 < 0, these interactions are attractive. The magnitude of A2 represents the strength of these interactions. If there is not any molecular conformation change with salt concentrated in solutions, the Debye length of the ion carrying the opposite charge around particles becomes short, which will reduce the repulsive double-layer interactions. As a result, the value of the obtained A2 will decrease.
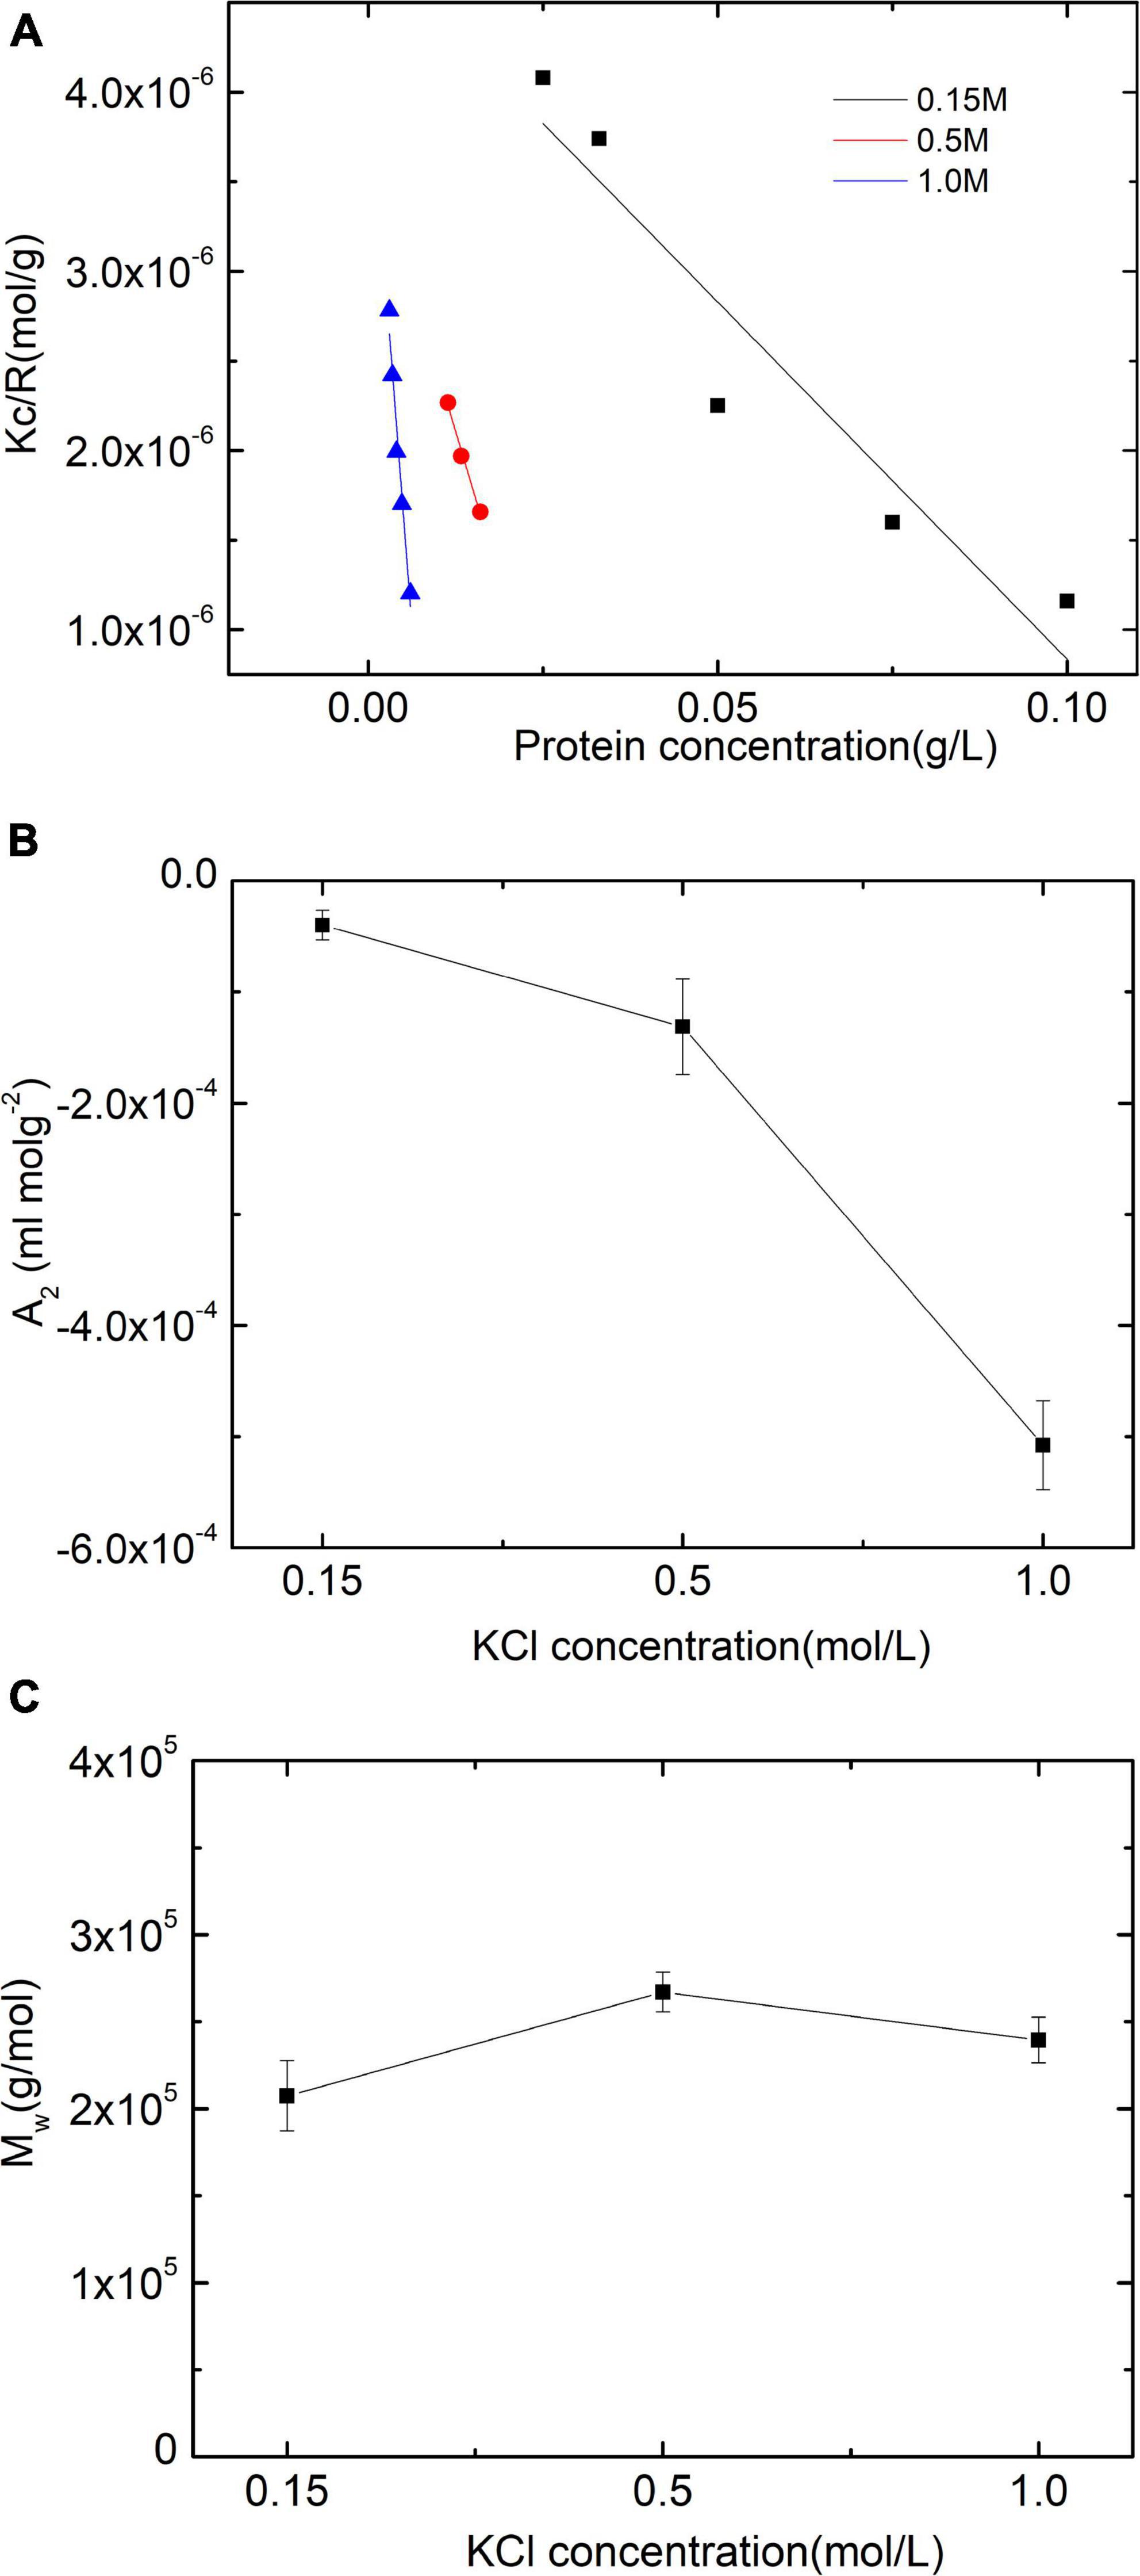
Figure 1. Static light scattering (SLS) assessments of paramyosin. (A) Debye plots of paramyosin solutions under three salt concentrations. (B,C) Are the corresponding second virial coefficient A2 and the molecular masses of protein Mw.
Thus, from the plot, it can be seen that increasing salt concentrations enhance the attractive interactions between protein molecules (Figure 1B), which is reasonable only if the double-layer force is taken into account (18). The second topic of this study is the apparent Mw determination of the isolate as a function of KCl content. Figure 1C shows no particular effect of salt on the apparent Mw, at least as far as the effect of self-assembly influences the scattering pattern (0.15 M)-induced apparent Mw increase (P < 0.01).
Figure 2 is a typical result of paramyosin DLS assessment, with two populations of particles classified by their hydrodynamic radius (Rh). The value of a small particle is ca. 20 nm and is independent of salt concentration. When salt concentration increases from 0.1 to 0.5 M, Rh of large particle population suddenly increases from ca. 95 to 106 nm (P < 0.01), a small but reproducible effect.
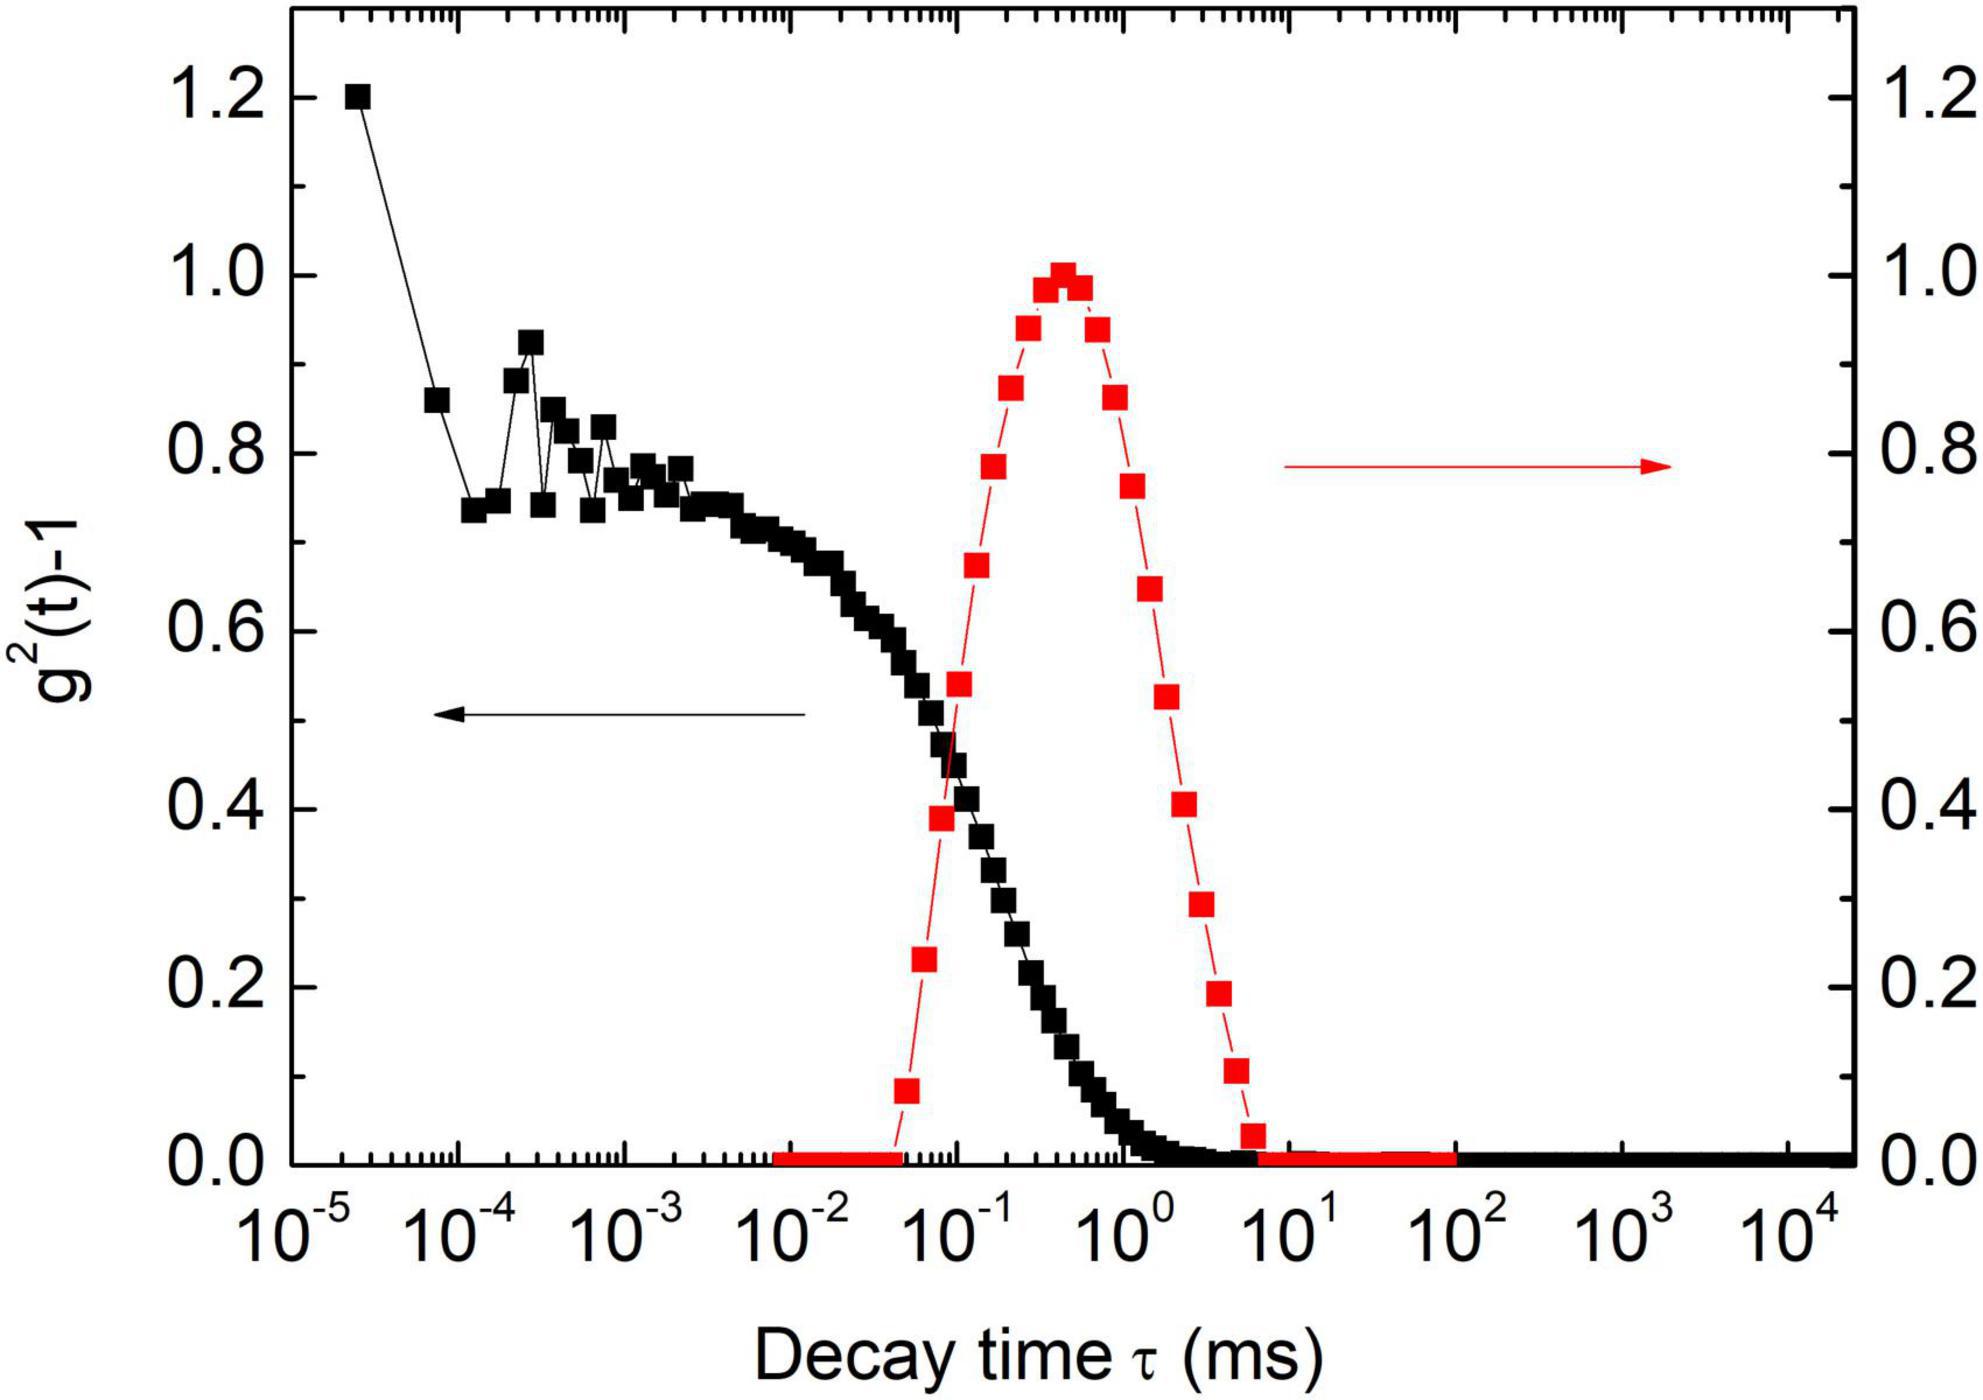
Figure 2. Dynamic light scattering (DLS) autocorrelation function [g2(t)-1] for a typical sample (0.15 mol/L KCl) and its corresponding characteristic decay time distribution.
The introduced KCl with various concentrations dramatically affects myofibrillar protein gelation characterized by the correlation function. At 25°C, a high concentration of KCl facilitated the amplitude decrease of the correlation function, and this function decay was slowly retarded due to KCl concentrated except 0 M (Figure 3A).
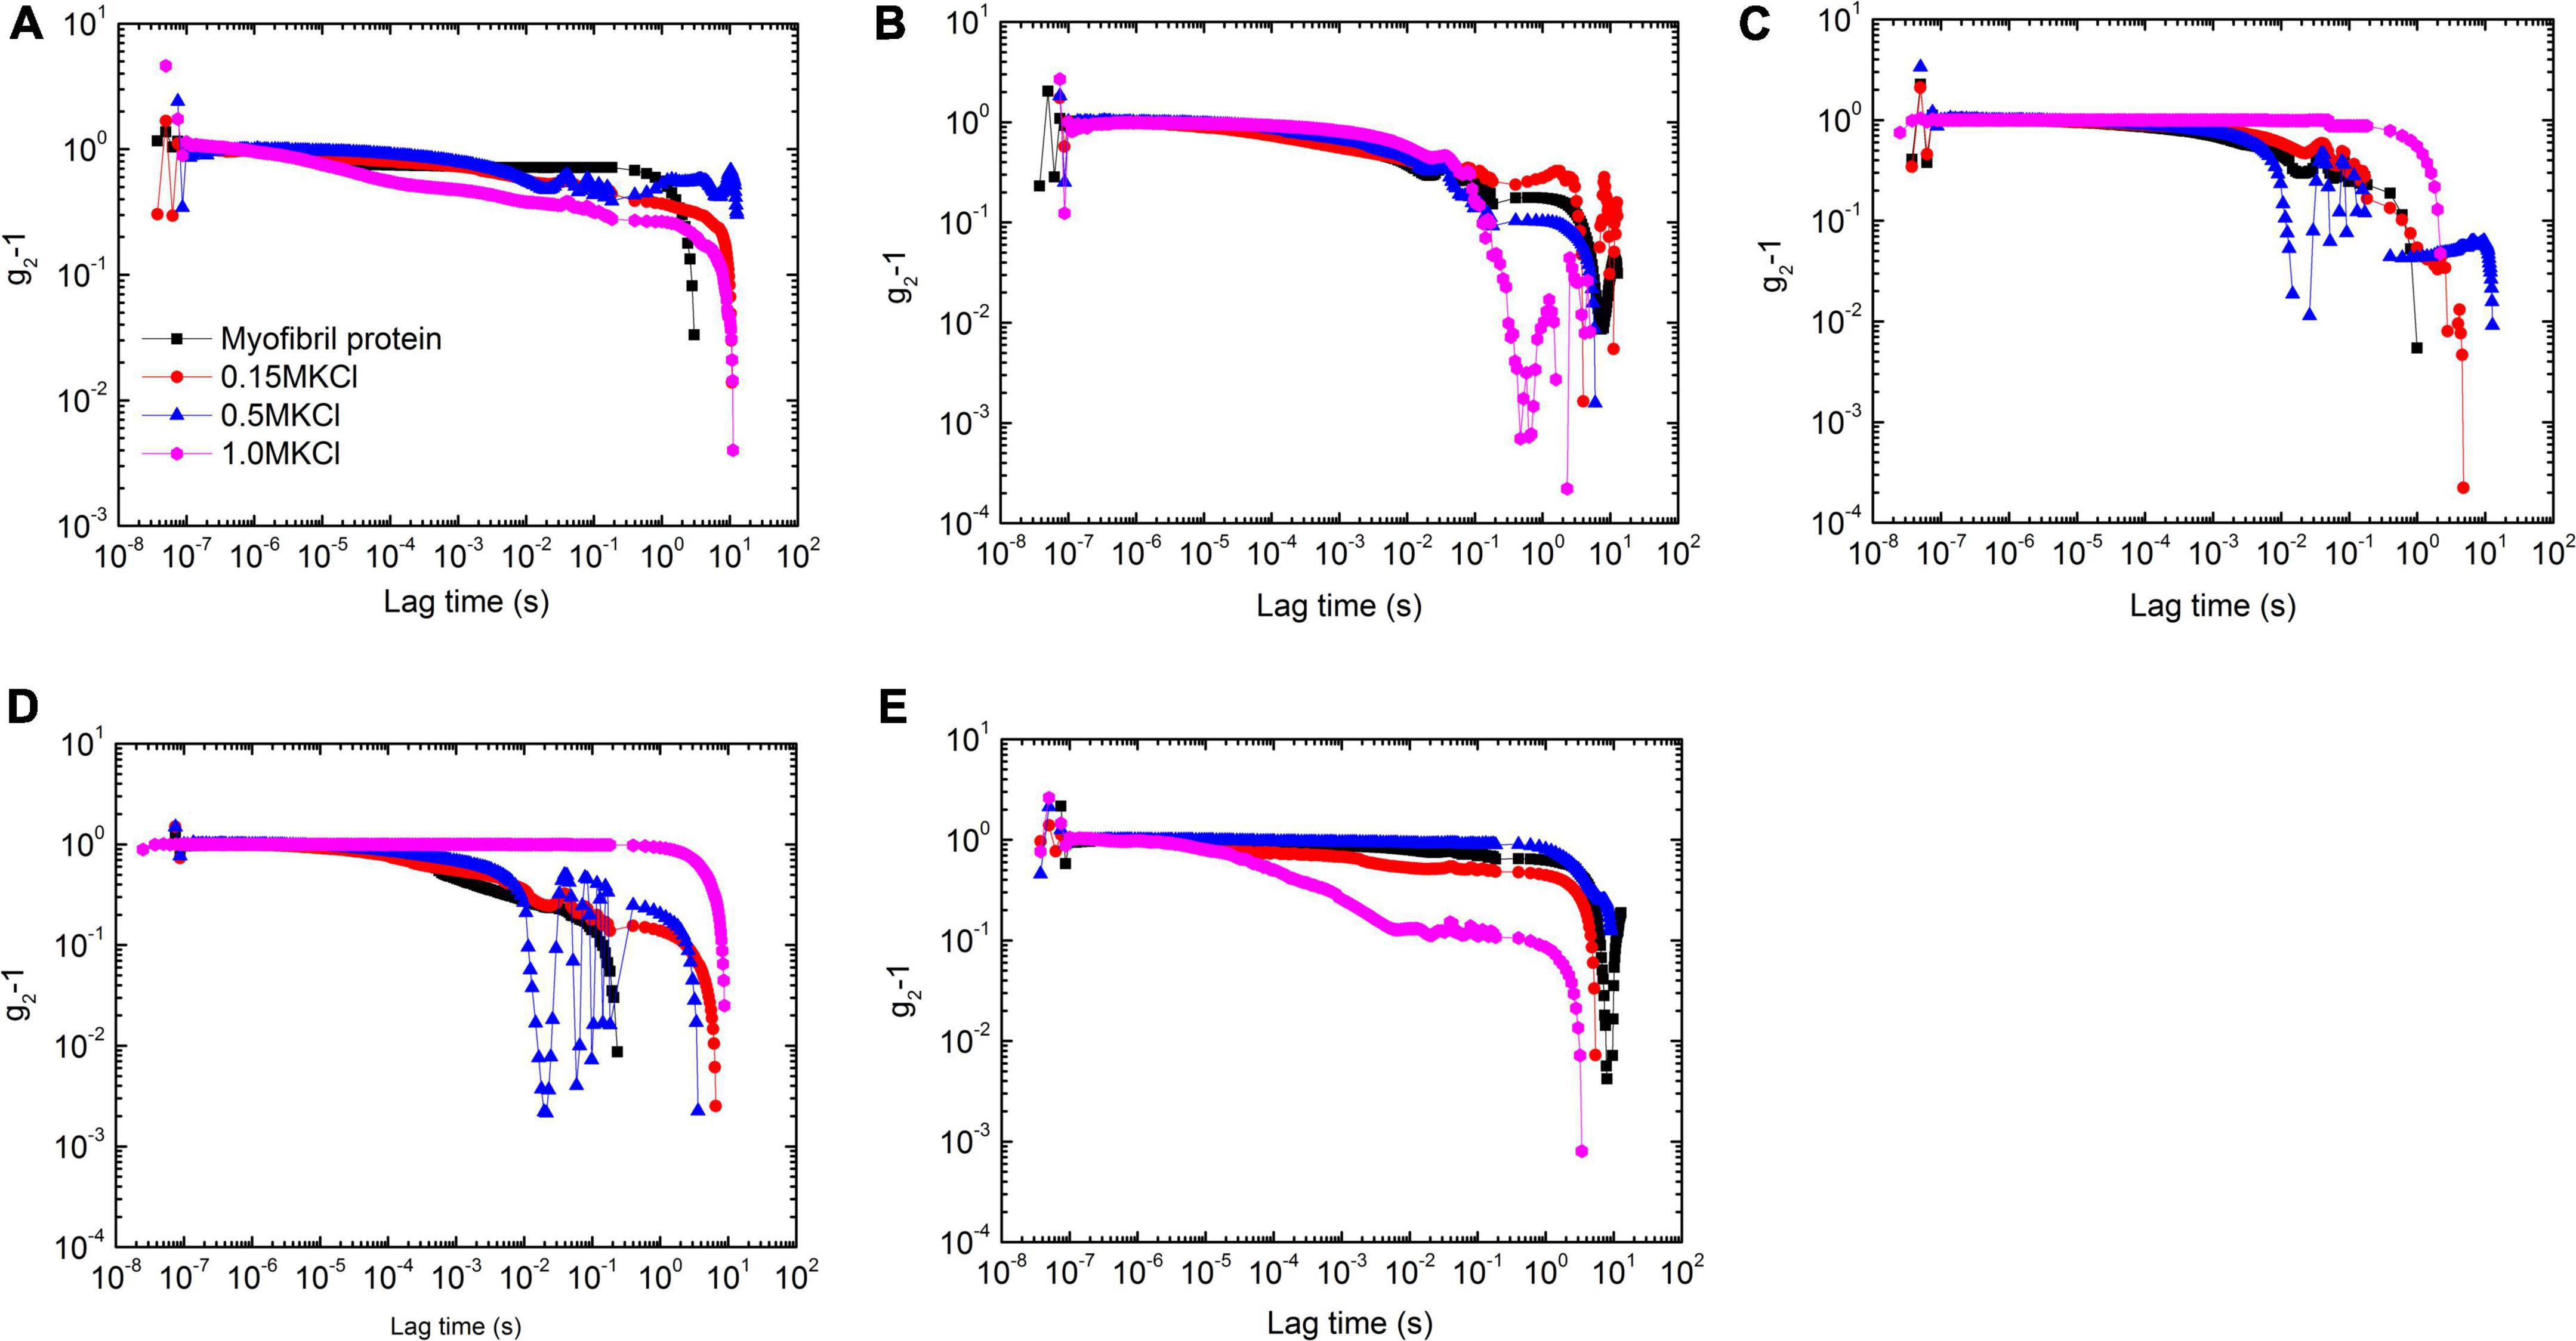
Figure 3. The correlation functions of myofibrillar protein solutions under 5 temperatures [25°C (A), 30°C (B), 35°C (C), 40°C (D), and 45°C (E)] with 4 concentrations of KCl [0 mol/L (black square), 0.15 mol/L (red circle), 0.5 mol/L (blue triangle), and 1 mol/L (magenta diamond)].
When the temperature increased to 30°C, the correlation functions in the short decay time (ca. ≤ 0.1 s) clasped into s master curve for solutions with 4 KCl concentrations (Figure 3B). But they were distinguishable for a long period. Although the characterized decay time was not sensitive to salt concentration except 1 M with the fast decay, the function amplitude had a large value at low concentrations but 0.15 M in which the largest value of amplitude appeared.
When the temperature further increased to 35°C, the correlation function decay became slow down with the large value of amplitude compared with that in 30°C (Figure 3C). The one in 1.0 M solutions had the largest value of amplitude while that in 0.5 M solutions did the smallest one. The corresponding characterized decay time had the same dependency on salt concentration.
When the temperature rose to 40°C, 1 M solutions displayed gel-like behaviors with the value of the correlation function close to 1 throughout almost the whole decay time. The decrease in its amplitude at the end of the decay time measurement came from the echo mode operation (Figure 3D). In addition, 0.5 M solutions showed the retarding as well with the large characterized decay time compared with that at 35°C. All hints that paramyosin conformation change prefers protein binding with slow decay. This conclusion further corroborates by the observations in solutions with the lower salt concentration, in which the fast decay appeared compared with that at 35°C.
But at 45°C, solutions with a low salt concentration (≤0.5 M) decelerated the correlation function while a 1 M solution accelerated it (Figure 3E).
In order to study the salt effect in more detail, the corresponding MSD behaviors were calculated (Figure 4). The whole profile of each MSD vs. time curve is usually divided into 2–3 parts discerned by their slope, which indicates that the particles experienced various environments in the whole measurement time. In addition, the plateau and the inflection point could be used to estimate the cage size by the corresponding value in y-coordinate with y = 6δ2, where δ is the value of apparent cage size (19, 20).
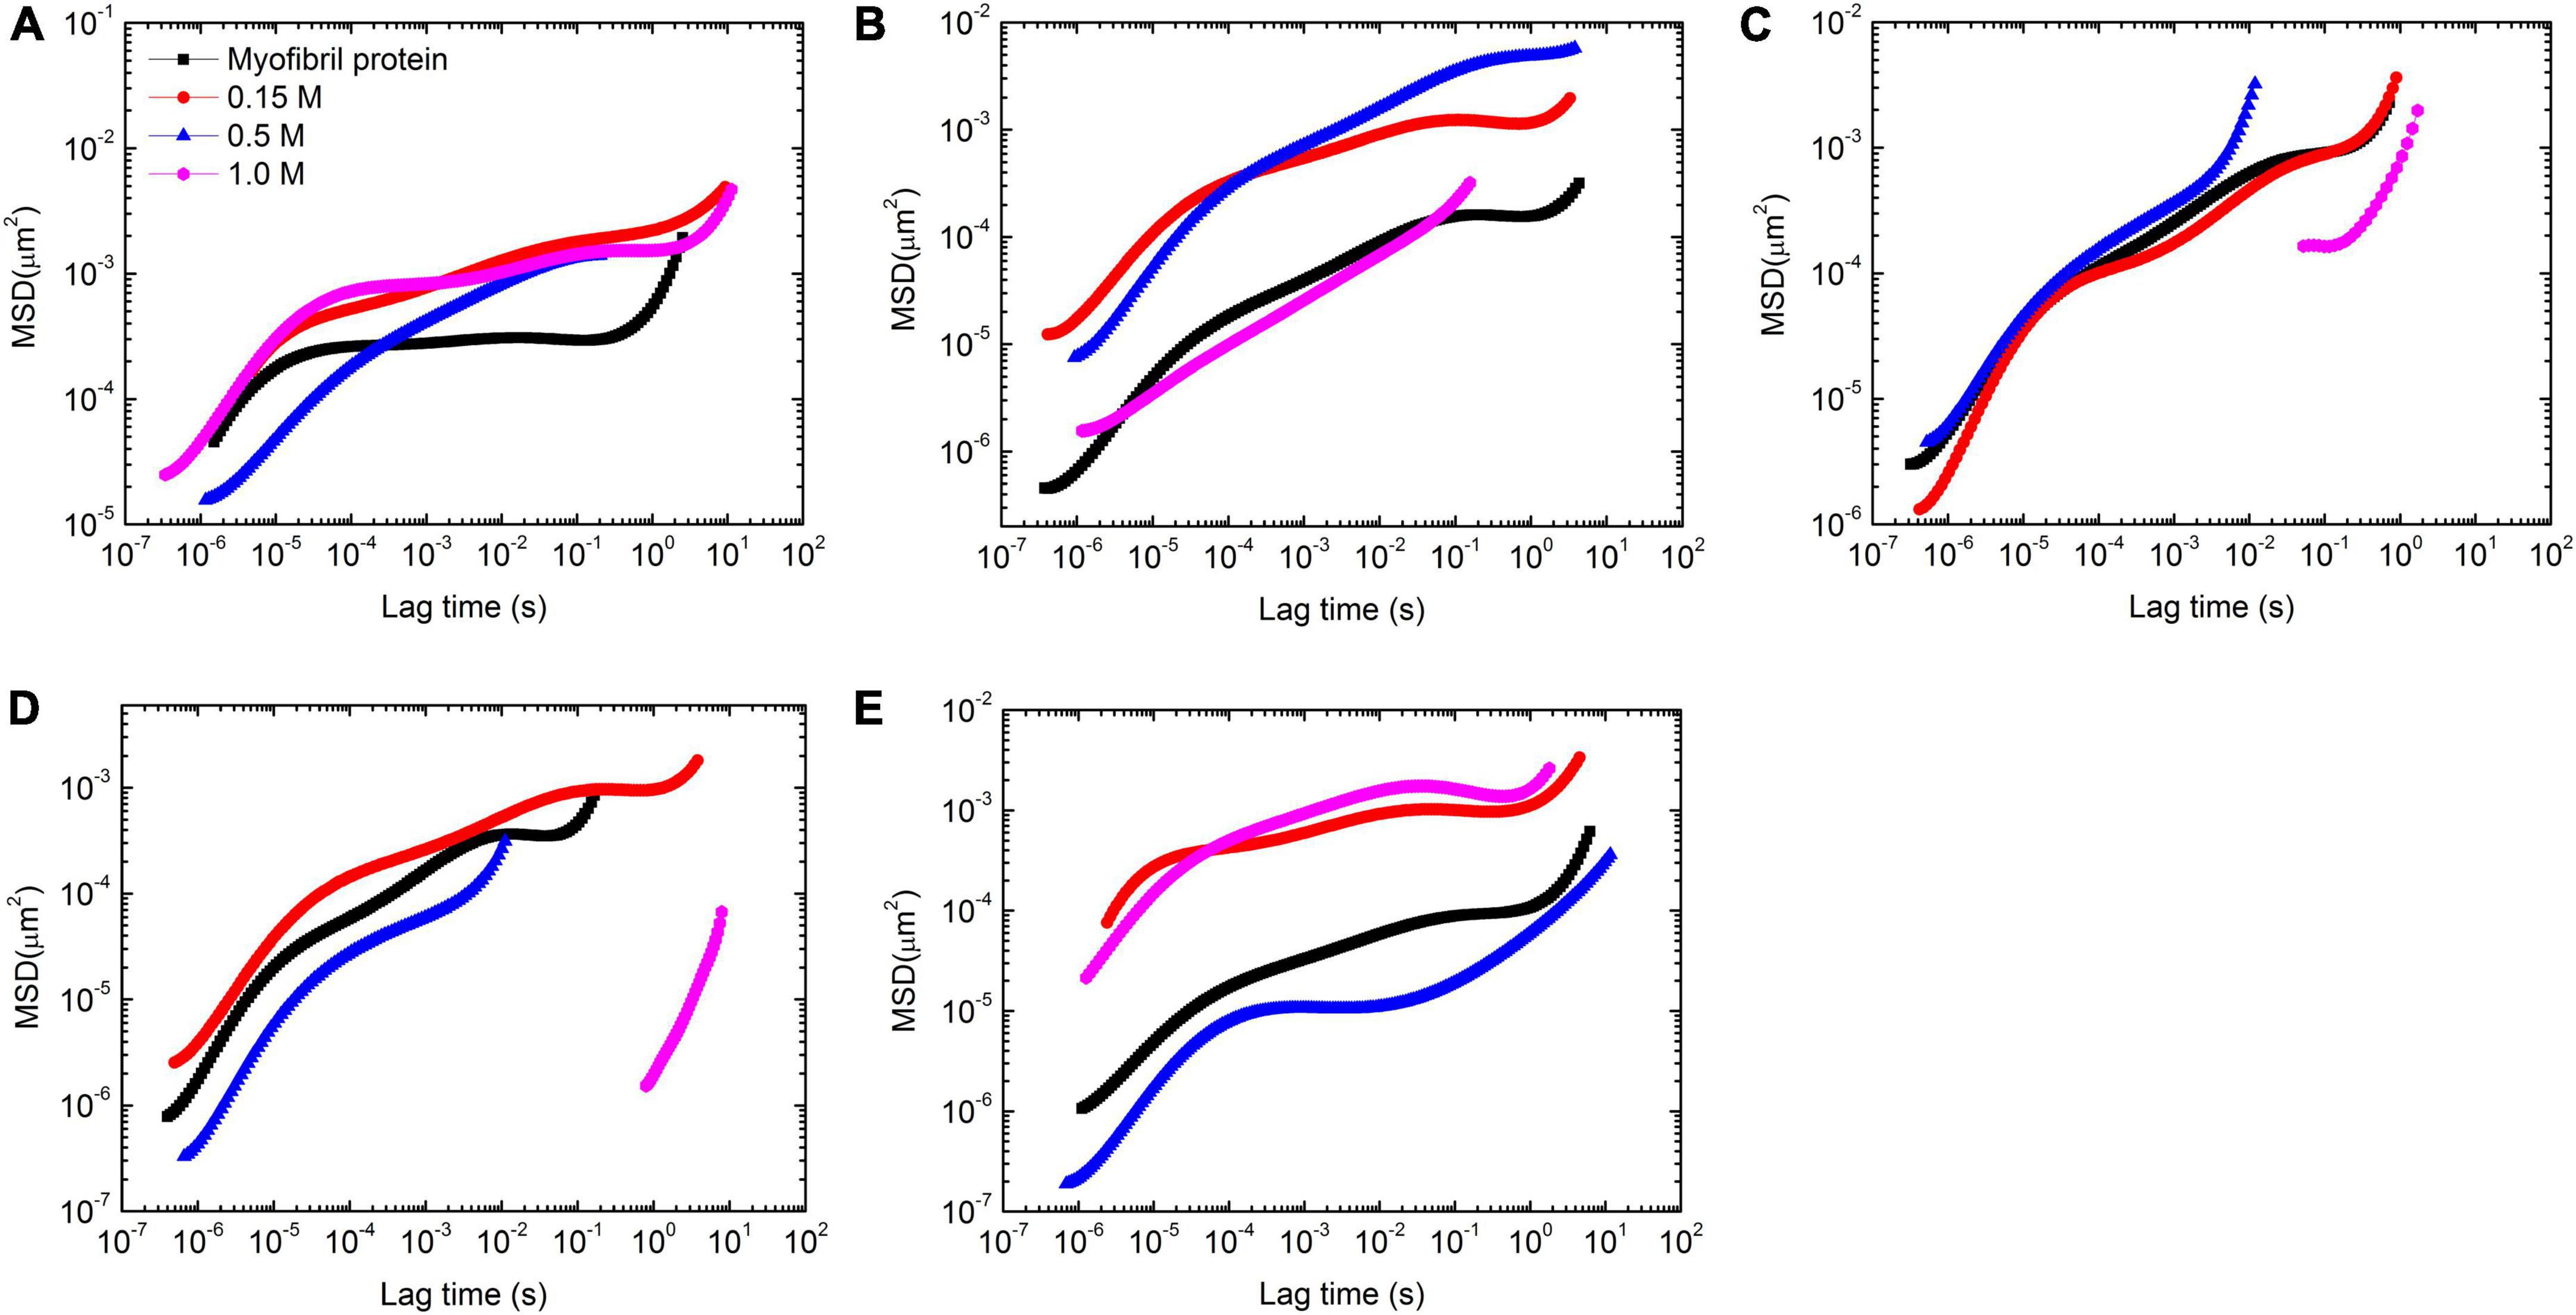
Figure 4. Mean-square displacement (MSD) vs. temperature with 4 concentrations of KCl (0, 0.15, 0.5, and 1 mol/L) at 5 temperatures [25 (A), 30 (B), 35 (C), 40 (D), and 45°C (E)] in myofibrillar protein (5.6 mg/ml) gelation process.
Solutions at 25°C showed that high salt concentration had less effect on the short time motion of tracer particles but decelerated their long time motion (Figure 4A). Additionally, the cage size increased from 7 to 11 nm with salt concentrated from 0 to 1 M (Supplementary Table 1).
With the temperature rising to 30°C, the tracer particle motion slowed down in 0, 0.15, and 1 M solutions compared with that at 25°C (Figure 4B). But the opposite trend appeared in 0.5 M solutions. In addition, the speed of this motion had two classes. One includes 0 and 1 M and the rest concentrations of salt are set in the second class with a relatively fast motion compared with the first class. Additionally, the fast motion was associated with a large apparent cage size (Supplementary Table 1).
Further increasing to 35°C, the motion of tracer particles sped up compared with that at 30°C in 4 concentrations of salt. The fast motion speed of tracer particles was 0.5 M > 0 M > 0.15 M∼1 M (Figure 4C). In addition, the apparent cage size was 3 nm except in 1 M with 5 nm. This observation is of interest. The influence of the paramyosin conformation change on the myofibrillar protein gelation process depends on salt concentration.
At 40°C, the motion speed of tracer particles was 0.15 M > 0 M > 0.5 M > 1 M (Figure 4D). In addition, the difference between 1 M and the rest was dramatic in terms of MSD vs. time curve. The apparent cage size followed the same order via decreasing from 5 to 2 nm.
The remarkable change occurred at 45°C. The tracer particles moved the fastest in 1 M solutions and then, slightly slowed down in 0.15 M solutions. In 0.5 M solutions, the tracer particles moved the slowest (Figure 4E). Additionally, the fast motion may partially come from the large apparent cage size. Along this salt concentration order, this value decreased from 9 to 7 nm, then to 2 nm, and finally to 1 nm.
The rheological properties of myofibrillar protein changed with salt concentration under these 5 temperatures in terms of G′ and G″ as well.
At 25°C, 0 M solutions were solid-like with G′ large than G″ (Supplementary Figure 6A), and ωc (the value of ω for G′ and G″ crossed over) was 1.5 × 10⁵ rad/s. A similar pattern occurred in 0.15 M solutions but G′ decreased while G″ slightly increased compared with that in 0 M. The paramyosin conformation change due to salt concentrated to 0.5 M induced the solution presence solid-like at low ω. The corresponding ωc was ca. 7 × 10³ rad/s. It is of interest that salt concentrated to 1 M induced both G′ and G″ decrease and ωc increase to 4 × 10⁴ rad/s.
At 30°C, G′ and G″ increased in 0 M solutions compared with at 25°C with G′ dominating at low ω (Supplementary Figure 6B). ωc was ca. 4 × 10⁴ rad/s. The temperature had less effect on G′ and G″ in 0.15 M, in which the pattern of the relative position between G′ and G″ was the same as that in 0 M and with the same value of ωc. The paramyosin conformation change did not favor G′ and G″ in 0.5 M solutions. Although the low ω preferred solid-like behavior with G′ dominance over G″, ωc reduced to ca. 104 rad/s. But in 1 M solutions, G′ and G″ increased compared with 25°C and were close to each other except at very low ω (ca. 7 rad/s) in which G′ was larger than G″.
At 35°C, in 0 M solutions, G′ was larger than G″ at low ω with ωc of ca. 4 × 10⁴ rad/s (Supplementary Figure 6C). The salt concentrated at 0.15 M induced both G′ and G″ increase but their relative position was the same as that in 0 M with ωc of ca. 4 × 10⁴ rad/s. The further concentrated salt to 0.5 M with myofibrillar protein conformation change reduced both G′ and G″. Additionally, G′ dominated over G″ at low ω with ωc of ca. 3 × 10⁴ rad/s. It is noted that 1 M solutions cannot produce enough data for this analysis.
At 40°C, the salt concentration decreased G′ and G″ at first and then increased again (Supplementary Figure 6D). It is noted that 0 M solutions had ωc with the value of ca. 7 × 10⁴ rad/s. Additionally, G′ was larger than G″ when ω less than ωc. The same pattern was retained in 0.15 M solutions with ωc of ca. 3 × 10⁴ rad/s. When salt concentrated to 0.5 M, there were two ωcs with the values of 300 rad/s and 1.9 × 10⁴ rad/s, respectively. In the middle part of this frequency region, G′ dominated over G″.
At 45°C, 1 M solutions had the smallest value of G′ and G″ (Supplementary Figure 6E), while in 0.5 M solutions, both values were almost the largest. It is noted that 0 M solutions presented the second largest values of G′ and G″. G′ dominated over G″ in all salt concentrations but 0 M, in which ωc was 7 × 10⁴ rad/s.
In 0 M solutions, with a temperature rising from 25 to 45°C, G′ and G″ increased, then decreased, and increased again (Supplementary Figure 7A). At 45°C, G′ and G″ attained the maximum values. In addition, the difference between G′ and G″ generally narrowed down with the temperature rising. Additionally, the value of ωc decreased until the temperature reached 40°C and then increased.
In 0.15 M solutions, the patterns of G′ and G″ dependencies on temperature were similar to that in 0 M solutions (Supplementary Figure 7B). However, at high temperatures (≥40°C), G′ dominated over G″ throughout the whole available ω spectra, and the properties of solid-like became more obvious with the temperature increasing.
At 0.5 M conditions with paramyosin conformation change, solutions displayed distinguishable behaviors from the solutions with less salt concentration in terms of G′ and G″ dependencies on ω. At low temperatures (≤35°C), the difference between G′ and G″ was small compared with that in solutions with low salt concentration (Supplementary Figure 7C). Additionally, the temperature had less effect on G′ and G″ in this temperature region as well. With the temperature further increasing, both values rose. But at 40°C, G′ dominated over G″ at low and high ω regions. In contrast, G′ almost dominated over G″ throughout the whole available ω spectra.
In 1 M solutions, G′ and G″ first increased and then decreased with the temperature rising (Supplementary Figure 7D). The difference between G′ and G″ followed the same pattern.
The concentrated salt shortens the Debye length to increase the screening effect; thereby the double-layer force decreases. However, this trend contradicts the observation that increases in salt concentration enhance the repulsive interactions with a salting-in phenomenon appearance (6). This last source reports that paramyosin molecule conformation changes from 100% α-helices to 100% β-sheet as KCl concentration increases from 0.1 to 0.5 M, while the value of A2 increases with KCl, suggesting that the tendency for aggregation is reduced with increasing salt content. This dilemma could be compromised by the fact that > 90% of protein molecules exist in myofibrillar protein solutions by the means of nanoprotein particles (NPPs) (21). Thus, salt concentration affects paramyosin conformation to induce NPP structure modification and thereby influences interactions between NPP. Currently, the strategy to study each component separately to probe the entire food’s properties is still popular; however, this bottom-up pathway should be verified carefully in food research due to implications relevant to the above observation.
The results of the Mw determination suggest the following two issues. (1) The apparent Mw is approximately twofold of 100 kDa, which hints that the preferred paramyosin quaternary structure is a dimer. This result is consistent with reports in which the apparent Mw ranges from 200 kDa to even higher values (22). Since the paramyosin assembly is regulated by intermolecular ionic interactions (23), the presence of SDS, an organic sodium salt that is also a surfactant and a protein denaturant, may induce dimer disassembly into monomers, as verified by the Mw of 97 kDa shown by SDS-PAGE. (2) Paramyosin conformation changes induce it to further aggregate, with apparent Mw increases. However, the problem with this observation is that all reported values are not multiplies of the Mw assessed by SDS-PAGE analyses, with the exception of that in 0.15 M KCl. This observation hints that some paramyosin molecules participate in the self-assembly, which has been reported in the presence of divalent cations (22), even at low concentrations of protein and salt with pH between 6 and 7 (24). This is partly because the apparent Mw is calculated using the following formula:
where the superscript ap stands for “apparent”; k does for the species k, and f denotes weight fraction (25).
The values of Rh are reasonable. It is because the radius of gyration (Rg) of dimer paramyosin could be estimated by (26) with the value of ca. 37 nm, a good agreement with 41 nm (12). Due to the Kirkwood–Riseman theory, (27), Rh of paramyosin dimer is ca. 25 nm, a good agreement with the present result. The Rh of paramyosin dimer does not depend on the salt concentration (Table 1). It is of interest that protein conformation change results in insignificant alternations of Rh for monomer proteins (P ≥ 0.01) but has a serious effect on the Rh of dimers (P < 0.01). Indeed, NaCl can play a similar role to induce paramyosin conformation change. Additionally, these behaviors are not new and have been observed in the studies of human serum albumin interacting with drug molecules and other proteins (28, 29).
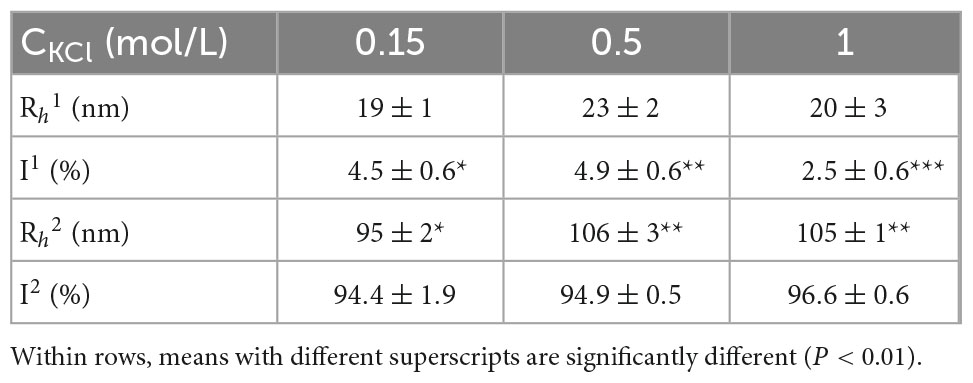
Table 1. Summary of dynamic light scattering (DLS) assessments of paramyosin under three salt concentrations.
Another interesting aspect of this observation is that the dimeric paramyosin molecule is stiff with a persistence length of 120 nm, based on the estimations of Rg and Rh (27). In addition, the images obtained by electron microscopy corroborate this conclusion with paramyosin molecules being almost straight rods (23).
The dependency of Rh of large particle population on salt concentration suggests that molecular conformation changes, coupled with strong attractive interactions, promote large aggregate formation in paramyosin solutions. Here, the solutions are in a dilute regime since the average distance between dimer paramyosin molecules is ca. 150 nm (0.1 mg/ml). Therefore, the observed large particles due to the entanglement among dimer paramyosin may confidently be ruled out.
Since the presence of paramyosin aggregate contributes to light scattering results, it is necessary to estimate its magnitude.
For a polarized laser (13), the Rayleigh ratio is , where r is the distance between the sample and detector, and N is particle number concentration. The fluctuation theory of light scattering (30) leads to the following:
where P(θ) is the shape factor; A3 and A4 are the third and fourth virial coefficients. If there are two types of particles with different Rh, with the aid of Eq. 5, the ratio of these two types of particles in terms of their number is as follows:
where subscribes 1 and 2 denote dimer paramyosin and its aggregates, respectively. Furthermore, 1 + 2A2CMwP(θ) + 3A3C2MwP(θ) + 4A4C3MwP(θ) + ⋯≈1since the concentrations of paramyosin and its aggregates are low. In addition, we assumed ∂n/∂C1≈∂n/∂C2. If we roughly estimate the Mw of paramyosin aggregates by , and with the aid of the definition of P(θ) of a spherical particle, Eq. 6 could be rewritten as
In Eq. 7, the value of R is used by Rh and the value of I is displayed in Table 1 as the intensity percentage. Therefore, the ratio of paramyosin aggregates in terms of their number concentration could be assessed. The calculation suggests that only ca. 1% (number percentage) of the solute particles are paramyosin aggregates.
In addition, with the aid of Eq. 4, f2 and Mw2 (the apparent molecular mass of aggregates) could be roughly estimated as follows:
The results elucidate that the mass fraction of aggregates is ca. 1–2%, and the apparent molecular mass is ca. 1,000 kDa, which suggests that there are ca. 5 dimer paramyosin particles inside an aggregate.
The obtained A2 by SLS is an apparent value, which is determined as follows:
where stands for the interactions between species j and k. Due to the low concentration of paramyosin aggregates, the contribution between paramyosin and its aggregates plus that between aggregates could be ignored. Here, we should stress that the Mw of paramyosin aggregates may be dramatically overestimated by the proposed method because the geometrical structure of both types of particles is not spherical. Therefore, the assumption of is not accurate. In addition, the aspect of the molecular weight of aggregate (ca. 1,000 kDa) suggests that this structure is not compact. All induce the values of the number of percentage of aggregates almost equal to that of mass percentage.
This investigation suggests that the intermolecular interactions assessed by SLS mainly come from the contribution of dimeric paramyosin.
Diffusing wave spectroscopy results highlighted the importance of paramyosin conformation change. Zhang et al. revealed KCl concentrated in myofibrillar solution, enhancing the repulsive interaction between protein particles (6), which should speed up the corresponding particle movement with the fast decay of their correlation function (31), contradicting the experimental result. However, the paramyosin conformation alteration provides a solution. The concentrated KCl promoted paramyosin molecule aggregation to induce the particle size increase and thereby slowing down the particle motion.
It is known that salt concentration affects myofibrillar protein composition and its conformation (32). The fact of dramatic increase of β-sheet content in myofibrillar protein when salt concentration jumps from 0.1 to 0.5 M but no further discerned change when salt increases to 0.9 M suggest that this content increase is mainly due to paramyosin conformation change at pH near neutral. Additionally, salt concentration affects the protein denature process at 35°C (33, 34). The paramyosin molecule conformation change induced myofibrillar protein aggregators’ disassembly to speed up their correlation function decay. However, further concentrated salt resulted in attractive interactions increasing to stop this disassembly but instead to induce protein molecules binding, which was verified by the slow decay in 1.0 M solutions. In addition, at 45°C, the gel was destroyed, which hints that the resultant gel gets mature below this temperature. Moreover, paramyosin conformation change induced protein particle aggregation to swell the apparent cage size in solutions. We ascribed this to the attractive interactions increasing due to the salt screening effect, which somehow induces the cage size swelling.
Paramyosin has been separated and purified from the solution of myofibrillar protein extracted from the giant squid. Then, SLS is applied to paramyosin solutions with three concentrations of KCl. This change enhances attractive interactions with apparent molecular mass increase. DLS results uncover the following two issues: (1) majority paramyosin molecules (>99%) are in dimeric form; (2) paramyosin aggregates are formed, which could be used to further explain some contradictions in the existing literature. Paramyosin molecular conformation change promotes aggregate growth. In addition, the influence of this protein conformation change on the myofibrillar protein gelation process was investigated via the DWS technique. Results revealed that the conformation change dramatically affected this process characterized by the correlation functions, MSD, and G′ and G″.
This study brings forward data on understanding the effect of a major salt supplement, KCl, on the chemical physics of a major muscle protein. Paramyosin is versatile because its application ranges from food to medicine and pharmaceutical practices. However, its physicochemical properties are still not fully understood. Our study could fill this gap and shed light on the further study on this protein.
The original contributions presented in this study are included in the article/Supplementary material, further inquiries can be directed to the corresponding author/s.
FN: methodology and investigation. SM: investigation and writing. XZ and YC: investigation. CR: writing—review and editing. WP: conceptualization, supervision, and writing. All authors contributed to the article and approved the submitted version.
This study was supported by grants from the National Natural Science Foundation of China (31171713 and 31701650) and the Natural Science Foundation of Zhejiang Province (LY22C200009).
YC was employed by the China Aquatic Products Zhoushan Marine Fisheries Corporation.
The remaining authors declare that the research was conducted in the absence of any commercial or financial relationships that could be construed as a potential conflict of interest.
All claims expressed in this article are solely those of the authors and do not necessarily represent those of their affiliated organizations, or those of the publisher, the editors and the reviewers. Any product that may be evaluated in this article, or claim that may be made by its manufacturer, is not guaranteed or endorsed by the publisher.
The Supplementary Material for this article can be found online at: https://www.frontiersin.org/articles/10.3389/fnut.2022.1082464/full#supplementary-material
2. Eisenberg DS, Crothers DM. Physical chemistry with applications to life sciences. San Francisco, CA: The Benjamin/Cummins (1979).
3. Linden EVD, Foegeding EA. Gelation: Principles models and applications to proteins. In: Kasapis S, Norton IT, Ubbink JB editors. Modern Biopolymer Science. Amsterdam: Elsevier (2009). p. 29–91. doi: 10.1016/B978-0-12-374195-0.00002-1
4. Hofmeister F. Zur lehre von der wirkung der salze. Archiv Exp Pathol Pharmakol. (1888) 25:247–60. doi: 10.1007/BF01918191
5. Schwartz CP, Uejio JS, Duffin AM, England AH, Kelly DN, Prendergast D, et al. Investigation of protein conformation and interactions with salts via X-ray absorption spectroscopy. Proc Natl Acad Sci USA. (2010) 107:14008–13. doi: 10.1073/pnas.1006435107
6. Zhang R, Zhou R, Pan W, Lin W, Zhang X, Li M, et al. Salting-in effect on muscle protein extracted from giant squid (Dosidicus gigas). Food Chem. (2017) 215:256–62. doi: 10.1016/j.foodchem.2016.07.177
7. Tahergorabi R, Jaczynski J. Physicochemical changes in surimi with salt substitute. Food Chem. (2012) 132:1281–6. doi: 10.1016/j.foodchem.2011.11.104
8. Núñez-Flores R, Cando D, Borderías AJ, Moreno HM. Importance of salt and temperature in myosin polymerization during surimi gelation. Food Chem. (2018) 239:1226–34. doi: 10.1016/j.foodchem.2017.07.028
9. Tolano-Villaverde IJ, Santacruz-Ortega H, Rivero-Espejel IA, Torres-Arreola W, Suárez-Jiménez GM, Márquez-Ríos E. Effect of temperature in the actomyosin-paramyosin structure from giant squid mantle (Dosidicus gigas). J Sci Food Agric. (2019) 99:5377–83. doi: 10.1002/jsfa.9797
10. Hashimoto K, Watabe S, Kono M, Shiro K. Muscle protein composition of sardine and mackerel. Bul JPN Soc Sci Fish. (1979) 45:1435–41. doi: 10.2331/suisan.45.1435
11. Bradford MM. A rapid and sensitive method for the quantitation of microgram quantities of protein utilizing the principle of protein-dye binding ana. Biochem. (1976) 72:248–54. doi: 10.1006/abio.1976.9999
12. Lowey S, Kucera J, Holtzer A. On the structure of the paramyosin molecule. J Mol Biol. (1963) 7:234–44. doi: 10.1016/S0022-2836(63)80003-0
13. Chu B. Laser Light Scattering. Cambridge, MA: Academic Press (1991). doi: 10.1016/B978-0-12-174551-6.50005-7
14. Zakharov P, Cardinaux F, Scheffold F. Multispeckle diffusing-wave spectroscopy with a single-mode detection scheme. Phys Rev E. (2006) 73:011413. doi: 10.1103/PhysRevE.73.011413
15. Blanco-Pascual N, Fernández-Martín F, Montero MP. Effect of different protein extracts from Dosidicus gigas muscle co-products on edible films development. Food Hydrocoll. (2013) 33:118–31. doi: 10.1016/j.foodhyd.2013.02.019
16. Hosseinzadeh M, Nikjoo S, Zare N, Delavar D, Beigoli S, Chamani J. Characterization of the structural changes of human serum albumin upon interaction with single-walled and multi-walled carbon nanotubes: spectroscopic and molecular modeling approaches. Res Chem Intermed. (2019) 45:401–23. doi: 10.1007/s11164-018-3608-5
17. Dareini M, Tehranizadeh ZA, Marjani N, Taheri R, Aslani-Firoozabadi S, Talebi A, et al. A novel view of the separate and simultaneous binding effects of docetaxel and anastrozole with calf thymus DNA: Experimental and in silico approaches. Spectrochim Acta, Part A. (2020) 228:117528. doi: 10.1016/j.saa.2019.117528
18. Derjaguin B, Landau L. Theory of the stability of strongly charged lyophobic sols and of the adhesion of strongly charged particles in solutions of electrolytes. Prog Surf Sci. (1993) 43:30–59. doi: 10.1016/0079-6816(93)90013-L
19. Galvan-Miyoshi J, Delgado J, Castillo R. Diffusing wave spectroscopy in Maxwellian fluids. Eur Phys J E Soft Matter Biol Phys. (2008) 26:369–77. doi: 10.1140/epje/i2007-10335-8
20. Bellour M, Skouri M, Munch J-P, Hébraud P. Brownian motion of particles embedded in a solution of giant micelles. Eur Phys J E Soft Matter Biol Phys. (2002) 8:431–6. doi: 10.1140/epje/i2002-10026-0
21. Niu F, Jiao Y, Zhang R, Fan J, Ritzoulis C, Pan W, et al. Properties of nano protein particle in solutions of myofibrillar protein extracted from giant squid (Dosidicus gigas). Food Chem. (2020) 330:127254. doi: 10.1016/j.foodchem.2020.127254
22. Cohen C, Szent-Györgyi AG, Kendrick-Jones J. Paramyosin and the filaments of molluscan “catch” muscles: I. Paramyosin: Structure and assembly. J Mol Biol. (1971) 56:223–37. doi: 10.1016/0022-2836(71)90461-X
23. Cohen C, Lanar DE, Parry DAD. Amino acid sequence and structural repeats in schistosome paramyosin match those of myosin. Biosci Rep. (1987) 7:11–6. doi: 10.1007/BF01122722
24. Krause S, DeLaney DE. A study of paramyosin aggregation using transient electric birefringence techniques. Biopolymers. (1977) 16:1167–81. doi: 10.1002/bip.1977.360160602
26. Berne BJ, Pecora R. Dynamic light scattering with applications to chemistry, biology, and physics. New York, NY: Wiley (1976).
27. Strobl GR. The physics of polymers- concepts for understanding their structures and behaviors. Berlin: Springer (2007).
28. Abdollahpour N, Soheili V, Saberi MR, Chamani J. Investigation of the interaction between human serum albumin and two drugs as binary and ternary systems. Eur J Drug Metab Pharmacokinet. (2016) 41:705–21. doi: 10.1007/s13318-015-0297-y
29. Khashkhashi-Moghadam S, Ezazi-Toroghi S, Kamkar-Vatanparast M, Jouyaeian P, Mokaberi P, Yazdyani H, et al. Novel perspective into the interaction behavior study of the cyanidin with human serum albumin-holo transferrin complex: Spectroscopic, calorimetric and molecular modeling approaches. J Mol Liq. (2022) 356:119042. doi: 10.1016/j.molliq.2022.119042
30. Zimm BH. The scattering of light and the radial distribution function of high polymer solutions. J Chem Phys. (1948) 16:1093–9. doi: 10.1063/1.1746738
31. Muschol M, Rosenberger F. Interactions in undersaturated and supersaturated lysozyme solutions: Static and dynamic light scattering results. J Chem Phys. (1995) 103:10424–32. doi: 10.1063/1.469891
32. Lin W, Niu F, Zhang X, Pan W, Han B, Fan J, et al. Influence of shear on the gelation of myofibrillar protein extracted from humboldt squid (Dosidicus gigas). SDRP J Food Sci Technol. (2019) 4:563–80.
33. Chamani J, Moosavi-Movahedi AA. Effect of n-alkyl trimethylammonium bromides on folding and stability of alkaline and acid-denatured cytochrome c: A spectroscopic approach. J Colloid Interface Sci. (2006) 297:561–9. doi: 10.1016/j.jcis.2005.11.035
Keywords: paramyosin, salt concentration, conformation, change, gelation, diffusing wave spectroscopy (DWS)
Citation: Niu F, Ma S, Zhang X, Ritzoulis C, Chen Y and Pan W (2023) The influence of KCl concentration on the gelation of myofibrillar protein giant squid (Dosidicus gigas) due to molecular conformation change. Front. Nutr. 9:1082464. doi: 10.3389/fnut.2022.1082464
Received: 28 October 2022; Accepted: 29 November 2022;
Published: 04 January 2023.
Edited by:
Wuyang Huang, Jiangsu Academy of Agricultural Sciences (JAAS), ChinaReviewed by:
Jamshidkhan Chamani, Islamic Azad University of Mashhad, IranCopyright © 2023 Niu, Ma, Zhang, Ritzoulis, Chen and Pan. This is an open-access article distributed under the terms of the Creative Commons Attribution License (CC BY). The use, distribution or reproduction in other forums is permitted, provided the original author(s) and the copyright owner(s) are credited and that the original publication in this journal is cited, in accordance with accepted academic practice. No use, distribution or reproduction is permitted which does not comply with these terms.
*Correspondence: Weichun Pan, ✉ cGFud2VpY2h1bjE5NzBAMTYzLmNvbQ==
Disclaimer: All claims expressed in this article are solely those of the authors and do not necessarily represent those of their affiliated organizations, or those of the publisher, the editors and the reviewers. Any product that may be evaluated in this article or claim that may be made by its manufacturer is not guaranteed or endorsed by the publisher.
Research integrity at Frontiers
Learn more about the work of our research integrity team to safeguard the quality of each article we publish.