 Jingjing Li1,2
 Zhiliang Jiang
95% of researchers rate our articles as excellent or good
Learn more about the work of our research integrity team to safeguard the quality of each article we publish.
Find out more
ORIGINAL RESEARCH article
Front. Nutr. , 09 January 2023
Sec. Food Chemistry
Volume 9 - 2022 | https://doi.org/10.3389/fnut.2022.1075296
This article is part of the Research Topic Application of Nanosensors For the Detection and Analysis of Food Contaminants View all 4 articles
High affinity peptides (PTs) have been used in nanoanalysis, but there are no reports which combine PTs with a liquid crystal (LC) covalent organic framework (COF) supported soluble starch (SS) catalytic amplification system as a biosensor recognition element. In this study, a new, highly sensitive and selective bi-mode molecular biosensor has been developed for the determination of cadmium ion (Cd2+). Specifically, a highly catalytic and stable COF supported SS nanosol catalyst was fabricated such that a nanocatalytic indicator reaction system for HAuCl4-sodium formate was established based on surface-enhanced Raman scattering (SERS). The Au nanoparticles produced exhibited a surface plasmon resonance (SPR) absorption peak at 535 nm and a SERS peak at 1,615 cm–1. Combining the nanocatalytic amplification indicator system with the specific PTs reaction permitted a sensitive and selective SERS/absorption bi-mode platform to be developed for the determination of cadmium in rice. The linear range for SERS determination was 0.025–0.95 nmol/L and the detection limit (DL) was 0.012 nmol/L.
Peptides (PTs) which are widely available and of relatively low cost have good biocompatibility and water solubility properties. They also have a high affinity for many metal ions and have become excellent receptors for use in methodologies which exploit molecular recognition chemistry. Among them, absorption, fluorescence and electrochemical methods are used frequently in chemical analysis (1, 2). Zhuang et al. (3) reported a peptide fluorescent probe TP-2 (TPE-TrP-Pro-GlN-His-Glu-NH2), which utilized an aggregation-induced emission effect and afforded high selectivity in the determination of Hg2+, the detection limit (DL) being 41 nM. Yu et al. (4) immobilized an antibody against C-peptide onto TRF microspheres in a directional manner, thus fully exposing the antigen binding site, to determine C-peptide in human serum with a DL of 0.005 ng/mL. Furthermore, DNA and metal ions can be also determined by using PT-based sensors (5-7). However, to the best of our knowledge there are no reports on the use of a PT sensor for the determination of Cadmium ion (Cd2+) based on quantitative surface-enhanced Raman scattering (SERS) analysis, whereby a covalent organic framework (COF) loaded soluble starch (SS) facilitates nanocatalytic amplification.
SERS is a versatile analytical technique in the biosciences and affords high sensitivity, rapid and non-destructive analysis and multiple measurement capability (8-10). Based on the competitive binding between Au nanoparticles and RKGSGRRLVKC (11 peptide) and CALNN (5 peptide), SERS has been used to determine heparin (11), the analytical range being 0.2–2.4 μg/mL with a DL of 0.042 μg/mL. Liang et al. (12) studied the combination of catalytic graphene oxide nanoribbons (GONR) and human chorionic gonadotropin (hCG) polypeptide as a novel biosensor and established a new GONR-catalyzed RRS/absorption method to determine hCG with a DL of 70 pg/mL.
The COFs are a class of crystalline porous organic polymers that use small organic monomers as building blocks that are connected by covalent bonds. The pore structures, the strong light absorption ability and the tunable structures have attracted much interest recently (13, 14). In fact, COFs have been used as a multifunctional platform for gas adsorption and separation, sensing, and proton conduction, energy storage and heterogeneous catalysis (15, 16). The synthesis of COFs can be carried out using a variety of procedures including those based on solvothermal, ionothermal, and microwave energy (17). Most of these procedures, however, require relatively hazardous conditions and relatively long COF package crystallization times. As attractive synthesis routes, mechanical chemical polishing and hydrothermal treatment at room temperature are facilitating the extensive application and preparation of the COF package (18) as evidenced by recent studies (19-21) in optics, chemistry and electronics. Also, SERS has been applied to the determination of metal ions, based on the use of COF materials (22, 23). To improve the performance of the COFs, the doping of metal nanoparticles into the COFs is simple and effective strategy. In this approach, the number of free electrons on the surface of the COFs is increased, thereby facilitating the transfer of redox electrons and promoting the intended reaction (24). Starch is a common natural polydextrose (25, 26). In natural starch, amylose, which is soluble, accounts for 20∼26% of the total content, the remainder consisting of amylopectin. Oyamada et al. reported (26) that three amylose alkyl carbamate esters, namely, amylose triester (n-butylcarbamate), amylose triester (ethyl carbamate), and amylose triester (hexyl carbamate) in tetrahydrofuran form different liquid crystal (LC) phases that exhibit lyotropic liquid crystallinity. However, the thermotropic LC properties are rarely reported for amylose. Amylose has been used as an end sealer for metal and bimetal nanoparticles. Balasurya et al. (27) developed a novel core-shell Fe@Ag-starch nanosphere phenylalanine conjugate, and determined trace levels (1.84 nmol/L) of Hg2+ by absorption (Abs) spectrophotometry. Sapyen et al. (28) used SS-capped AgNPs in combination with a colorimetric method to determine trace levels (48 μg/L) of Cr (VI). Though starch as a natural polymer is cheap and may be used in nanoanalysis, little attention has been given to the stabilization of starch nanoparticles in catalytic reactions.
Cadmium ion is a toxic heavy metal and may be removed from polluted and contaminated waters by ion exchange, electrolysis, chemical precipitation, bioremediation or adsorption (29). However, chemical precipitation would result in sedimentation, which could then cause secondary pollution (30). Ion-exchange and electrolysis methods, while more efficient, have much higher maintenance costs (31). Therefore, to establish a highly sensitive and selective method for the determination of trace levels of Cd2+ is of great significance. Traditional analytical methods for the determination of Cd2+ include electrochemical, colorimetric, and fluorescence methods (32). In comparison with the aforementioned methods, biosensors are favored because of their low cost, real-time monitoring capability and low equipment requirements. In this work, the LC properties of SS and COF supported SS (COFTpBD–SS) were studied by resonance Rayleigh scattering (RRS) and Abs spectrophotometry. The COFTpBD–SS was prepared for the first time as a nanoparticle enzyme in the liquid phase in order to facilitate a catalytic Au nanoreaction. A novel PT biosensor with high sensitivity and selectivity was then constructed by combining the COFTpBD–SS with the PT biometric element to exploit the novel catalytic effect. Thereafter, a bi-mode biosensor platform was established, which afforded not only a SERS and Abs measurement capability but also was simple and of low-cost.
TU-1901 type dual-beam UV-Vis spectrophotometer (Beijing Puxi General Instrument Co., Ltd., Beijing, China); DXR Raman spectrometer (Thermo Fisher Scientific Company, Massachusetts, USA); Ultrasonic cleaner SK3300B (Shanghai Kedao Ultrasonic Instrument Co., Ltd., Shanghai, China); SYZ-550 type quartz sub-boiling water distiller (Jiangsu Jingbo Instrument Factory, Jiangsu, China); DHG-9023A electric heating constant temperature blast drying oven (Shanghai Jinghong Experimental Equipment Co., Ltd., Shanghai, China); HH-1 electric heating constant temperature water bath (Shanghai Weicheng Instrument Co., Ltd., Shanghai, China); DF-101S-type heat-collecting constant temperature heating magnetic stirrer (Gongyi Yuhua Instrument Co., Ltd., Shanghai, China); High speed refrigerated centrifuge (GL-25MS, Shanghai Luxiangyi Centrifuge Instrument Co., Ltd., Shanghai, China).
Benzidine (BD, Jilin China Science and Technology Co., Ltd., Jilin, China); 2,5-dimethoxyterephaldehyde (DMTP, Shanghai Macklin Biochemical Co., Ltd., Shanghai, China); (SS, Xilong Science Co., Ltd., Santou, China); amylopectin (AP, Xilong Science Co., Ltd., Santou, China); dimethyl sulfoxide (DMSO, Xilong Chemical Co., Ltd., Santou, China); 2,4,6-trihydroxy-1,3,5-benzenetricarbaldehyde (Tp, Shanghai Macklin Biochemical Co., Ltd., Shanghai, China); acetone (AT, Xilong Science Co., Ltd., Santou, China); tetrahydrofuran (THF, Xilong Science Co., Ltd., Santou, China); Benzene-1,3,5-tricarbaldehyde (BTCA, Shanghai Macklin Biochemical Co., Ltd., Shanghai, China); 1,3,5-tris (4-aminophenyl)benzene (TAPB, Shanghai Macklin Biochemical Co., Ltd., Shanghai, China); 0.1% HAuCl4 (1.0 mg/mL, National Group Chemical Reagent Co., Ltd., Shanghai, China); Peptide CW-Cd2+ (PT) sequence:Csy-Pro-Pro-Cys-Trp-NH2 (Shanghai Apeptide Co., Ltd., Shanghai, China); 10–5°mol/L Victoria Blue B (VBB) and 1 mol/L NaCl were used. The reagents used were of analytical grade, and the experimental water was sub-boiling distilled water.
In a clean stoppered glass bottle (50 × 30), 6.5 mg of Tp (3 mmol/L), 20 mL of C2H5OH, and 2.5 mL of 3 mol/L acetic acid were added in succession. Dissolution of the reagents was achieved by agitation in an ultrasonic bath for 30 min. 8.3 mg of BD (4.5 mmol/L) was then added to the reaction mixture which was in an agitated state, and ultrasonic energy was applied again for 30 min. The reaction mixture was then washed with AT (3 × 10 mL) and THF (3 × 10 mL) successively and centrifuged at high speed (10,000 r/min, 10 min) to obtain a brown solid. The final product was freeze-dried for 21 h to obtain the brown COFTpBD in powdered form.
Ten milliliter of 6.75 mmol/L BD solution, 10 mL of 4.5 mmol/L Tp solution and 10 mL of 3 mmol/L SS (the optimal conditions after optimization) were added to a clean corked glass bottle (50 × 30) while undergoing agitation for 30 min. A red-brown solid was obtained. Next, successive washings of the product with AT (3 × 10 mL) and THF (3 × 10 mL) were performed, and following high-speed low temperature centrifugation (10,000 r/min, 10 min), a yellow-brown solid was obtained. The final product was freeze-dried for 24 h, resulting in the COFTpBD–SS powder which was red-brown in color.
Ten milliliter of 6.75 mmol/L BD solution, 10 mL of 4.5 mmol/L Tp solution and 10 mL of 3 mmol/L AP (the optimal conditions after optimization) were added to a clean corked glass bottle (50 × 30) which was placed in an ultrasonic bath and agitated for 30 min. An orange-brown product was obtained. The product was washed with AT (3 × 10 mL) and THF (3 × 10 mL) in turn, and centrifuged at 10,000 r/min for 10 min to obtain an orange-brown solid. The final product was freeze-dried for 24 h to yield the COFTpBD–AP powder which was yellow-brown in color.
19.6 mg of TAPB, 20 mL of DMSO and 1 mL of 3 mol/L HAc were added successively to a clean corked glass bottle (50 × 30) and the mixture was dissolved with the aid of ultrasonics for 30 min. Then, 10 mg of BTCA was added with mild stirring at room temperature, and the stirring continued for 1 min to obtain a yellow gel. The gel was next washed successively with AT (3 × 10 mL) and then THF (3 × 10 mL), and a dark yellow solid was obtained after high-speed and low temperature centrifugation (10,000 r/min, 10 min). The final product was freeze-dried for 21 h to yield the COFTB powder which was yellow in color.
Ten milliliter of 8.4 mmol/L TAPB solution, 10 mL of 8.4 mmol/L BTCA solution and 8 mL of 3 mmol/L SS solution were successively in a clean corked glass bottle (50 × 30) which was agitated in an ultrasonic bath for 30 min. A yellow product was obtained and washed successively with AT (3 × 10 mL) and THF (3 × 10 mL), and a yellow solid was obtained after high-speed low temperature centrifugation (10,000 r/min, 10 min). The final product was freeze dried for 24 h to yield the COFBT–SS which was a yellow powder.
8.7 mg of DMTP, 20 mL of BA solution and 2.5 ml of 3 mol/L HAc were added successively to a clean corked glass bottle (50 × 30) and dissolved with the aid of ultrasonic agitation for 30 min. Then 10.5 mg of TAPB was added during stirring, and the stirring was continued for 2 h. Then the product was placed into an oven at 60 product h. The product was washed successively with AT (3 × 10 mL) and anhydrous THF (3 × 10 mL). A brown solid product was obtained after high-speed low temperature centrifugation (10,000 r/min, 10 min). The final product was freeze-dried for 24 h to yield the brown COFDT powder.
Ten milliliter of DMTP solution, 10 mL of TAPB solution, 2.5 mL of 3 mol/L acetic acid solution and 8.5 mL of 3 mmol/L SS solution (the optimal condition after optimization) were added to a clean corked glass bottle (50 × 30) during stirring for 2 h. The reaction mixture was then washed successively with AT (3 × 10 mL) and THF (3 × 10 mL), and a yellow-brown solid was obtained after high-speed low temperature centrifugation (10,000 r/min, 10 min). The final product was freeze-dried for 24 h to yield the COFDT–SS which was a yellow-brown powder.
One hundred and seventy microliter of 0.1 mg/mL COFTpBD–SS, 120 μL of 100 nmol/L PT, and various concentrations of CdCl2 were added successively to a 5 mL calibrated tube, followed by 70 μL of 1 mg/mL HAuCl4. Then 60 μL of 0.1 mol/L HCl followed by 120 μL of 0.1 mol/L Fo were then added; the mixture was shaken well and the volume made up to 2 mL. Next the solution was heated in a water bath at 80°C for 15 min. After the ice water was cooled to room temperature, 100 μL of 10–5 mol/L VBB and 100 μL of 1 mol/L NaCl were added. Then, the Raman spectrometer was used to record the SERS spectrum. The SERS intensity (I) at 1615 cm–1 was measured as was the SERS signal I0 for the blank control solution (solution without Cd2+) to allow the difference signal (ΔI = I–I0) to be calculated. In the case of spectrophotometric analysis, VBB was omitted and the absorbance (A) at 535 nm was measured. The absorbance of the blank solution A0 (solution without Cd2+) was also recorded. The difference in the absorbance values, ΔA = A-A0, was then calculated.
Samples of rice grown in Hunan, Hubei, Guangxi and Wuchang were purchased from local stores. The rice samples were dried in an oven at 120°C for 8 h and ground with an agate mortar. Samples of 1.0 g (accurate to 0.1 mg) were transferred to 50 mL conical flasks containing 10 mL of mixed acid (vol HN03/vol HClO4: 4:1) and left overnight (about 15 h). The samples were digested on a hot plate until white smoke appeared. When the solutions turned colorless and clear or slightly yellow, the samples were removed and left to cool before adjusting the volume to 10 mL. Finally, 100 μL aliquots of the digests were collected after filtration using a 0.45 μm microporous membrane filter.
The COF material COFTpBD was synthesized by stirring at room temperature using benzidine (Tp) and triuronic phloroglucinol (BD) as base reagents. Then SS was incorporated into the COFTpBD, and SS was uniformly loaded on the surface of COFTpBD via hydrogen bond interaction to enhance the catalytic effect of COFTpBD. In general, in the absence of catalyst, Fo-HAuCl4 reacted slowly and its SERS signal was low. COFTpBD–SS had a strong catalytic effect on the Fo-HAuCl4 reaction, and the AuNPs exhibited a prominent SERS effect. Moreover, PT could be adsorbed on the surface of COFTpBD, blocking contact between the active site and the reacting solution, thus inhibiting the catalytic effect. When Cd2+ was added to the solution, a stable conjugate was formed with PT, and COFTpBD was released. The catalytic effect gradually recovered with increase of the Cd2+ concentration. The AuNPs generated gradually increased, and the AuNPs could be used as an active base for SERS. After adding the VBB probe molecules, the intensity of the SERS signal increased linearly as a function at 1,615 cm–1. Meanwhile, the absorbance at 535 nm was enhanced with an increase in the content of the AuNPs. Based on the SERS and the Abs responses, the possibility of developing a highly selective and bi-mode spectrochemical (SERS/Abs) method for the determination of trace levels Cd2+ was conceived (Figure 1).
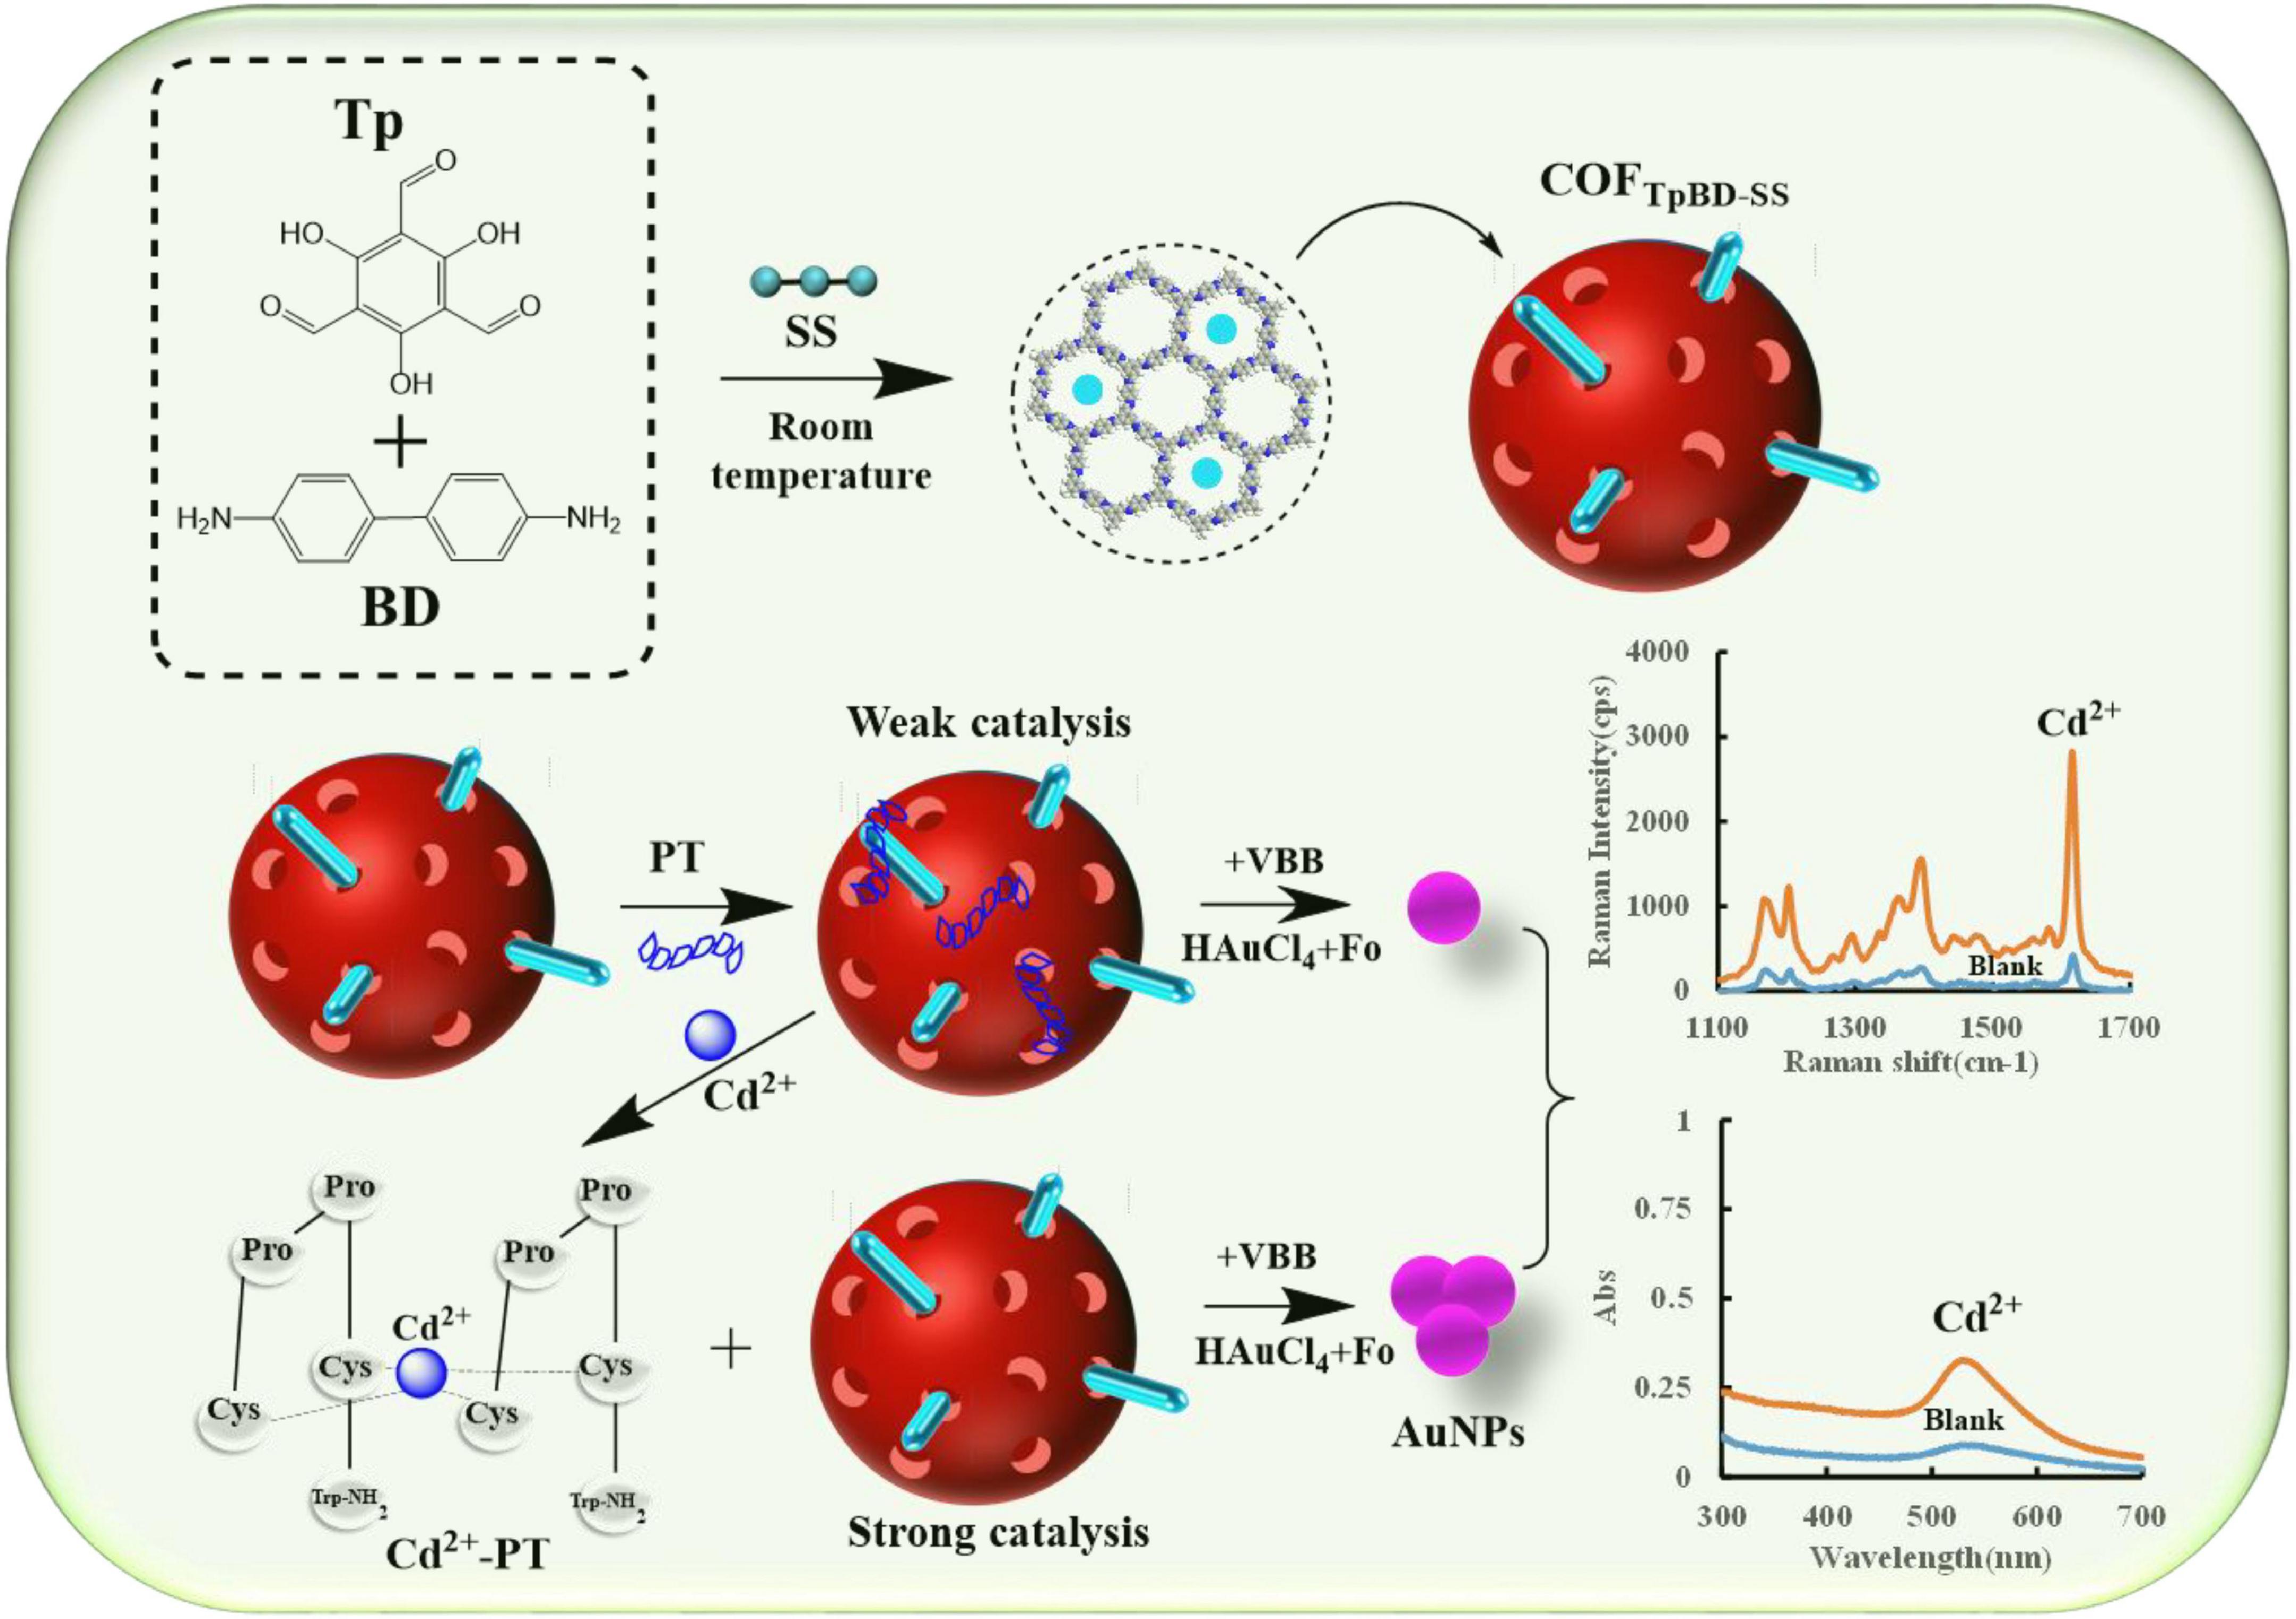
Figure 1. Schematic diagram of the SERS/Abs detection for Cd2+ coupled COFTpBD–SS catalysis amplification via PT.
The COF and the nano catalytic amplification system were analyzed by transmission electron microscopy (TEM) and energy dispersive X-ray analysis (EDS). As shown in Figure 2A, COFTpBD has a rod and layered type structure with particles of size about 450 nm; also, the diffraction peaks corresponding to C, N, and O occurred at 0.26, 0.40, and 0.53 keV, respectively (Figure 2B). In addition, as shown in Figure 2C, the COFTpBD doped SS did not change its morphology. Given that COFTpBD–SS and COFTpBD both contain elemental C, O, and N, it is not clear from the TEM and EDS spectra that SS is loaded on the surface of COFTpBD. However, it is clear that the SS is indeed loaded on the surface of COFTpBD based on inspection of the spectra of the variable temperature molecular, Raman and infrared spectroscopies. The TEM images of the AuNPs generated by the reaction of the PT-COFTpBD–SS-AuNPs-Fo-HAuCl4 (Figures 2D, E) showed that in the absence of Cd2+, the AuNP were formed with an average particle size of 35 nm. In contrast, the addition of Cd2+ produced a large number of AuNPs particles with an average particle size of about 55 nm, as evidenced by the spectral peak at 2.2 keV (Figure 2F).

Figure 2. Transmission electron microscopy and energy dispersive X-ray analysis of the nanoparticles. (A) TEM of COFTpBD; (B) EDS of COFTpBD; (C) TEM of COFTpBD–SS; (D) TEM of analysis system: 5 nmol/L PT + 2.5 mmol/L HCl + 6.25 μg/mL COFTpBD–SS + 0.025 mg/mL HAuCl4 + 5 mmol/L Fo; (E) TEM of analysis system: D + 0.045 nmol/L Cd2+; (F) EDS of analysis system.
As shown in Supplementary Figures 1A, B, COFTpBD had an absorption peak at 495 nm and SS had no absorption peak. After loading SS, the absorption peak of COFTpBD–SS had a slight red shift and appeared at 500 nm relative to COFTpBD (Supplementary Figure 1C). It can be seen from consideration of the above that the spectral results of the two molecules are consistent. The absorption peaks of AP and COFTpBD–AP are shown in Supplementary Figures 1D, E. The UV variable temperature molecular absorption spectra of COFTpBD, SS and COFTpBD–SS are presented in Supplementary Figures 1F–H. The Abs peak for COFTpBD at 500 nm did not change with temperature, but the Abs peak for COFTpBD–SS at 500 nm occurred within the temperature range 70–950e temperatwas added to COFTpBD. The absorbance increased with increase of temperature, but not before 70ea This indicated that COFTpBD–SS exhibited the characteristics of a thermotropic LC (33), reflecting the fact that SS confers LC properties, and that some of SS molecules may be exposed on the COF surface. In Supplementary Figures 1I, J, the Abs peaks of AP and COFTpBD–AP at 495 nm did not change with change in temperature indicating that AP and COFTpBD–AP did not exhibit the characteristics of a thermotropic LC.
RRS is a simple and sensitive technique for studying nanoparticles such as LCs, hence was used in this work. COFTpBD and SS generate a characteristic RRS peak at 535 and 370 nm (Figures 3A, B), respectively. By examining the RRS spectrum of COFTpBD–SS (Figure 3C), it was found that after the loading of SS by COFTpBD, the characteristic peak of COFTpBD was observed at 535 nm, while the RRS peak for SS at 370 nm was not clear. The variable temperature RRS spectra of COFTpBD and SS are shown in Figures 3D, E, respectively. The RRS peak of COFTpBD at 545 nm did not change with change of temperature, while the RRS peak of SS at 370 nm was unchanged before 60°C, but did change within the temperature range 60–95°C, the intensity of the RRS peak increasing with increase of temperature. This demonstrated that SS has LC properties. By investigating the variable temperature RRS spectra of COFTpBD–SS (Figure 3F), it was found that after COFTpBD was loaded with SS, two peaks appeared in the spectra, namely, at 300 and 535 nm. The two peaks did not change in appearance at temperatures less than 60°C. For temperatures between 60 and 95°C, the RRS intensity at 300 nm increased with increase in temperature (Figures 3G, H). The intensity of COFTpBD–SS was weaker than that of the SS. However, the intensity of the COFTpBD–SS peak at 535 nm remained constant. The results would suggest that COFTpBD–SS had LC properties whereby some SS molecules were embedded into the COF porous structure, and some SS molecules may have been exposed on the COF surface. The variable temperature RRS spectra of AP and COFTpBD–AP are presented in Figures 3I, J. The RRS peak of COFTpBD–AP at 545 nm did not change with change of temperature, thus indicating that COFTpBD–AP did not exhibit the characteristics of thermotropic LCs.
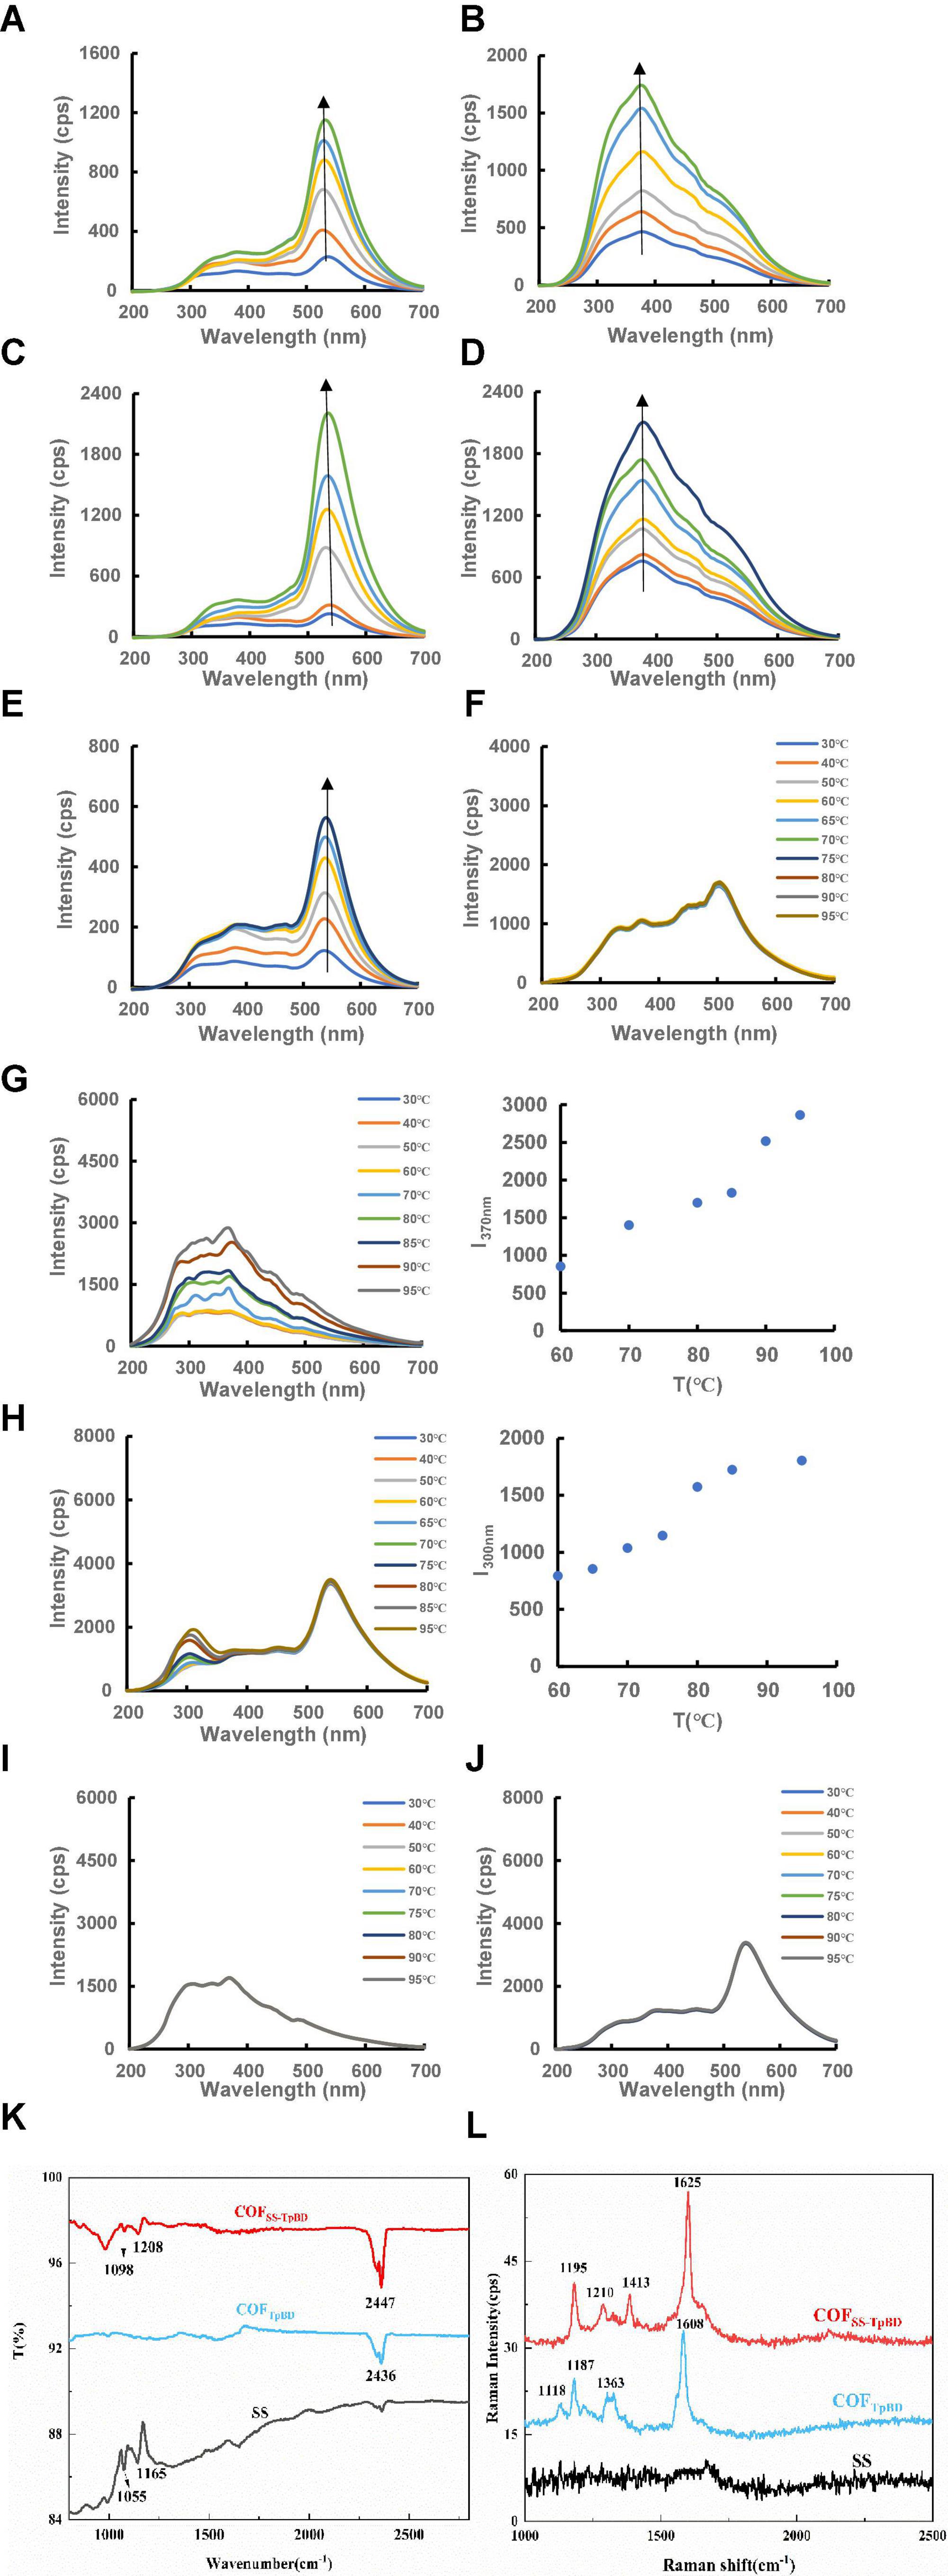
Figure 3. Resonance Rayleigh scattering spectra of COFTpBD/SS/COFTpBD–SS/AP/COFTpBD–AP and FTIR and SERS spectra of OFTpBD/SS/COFTpBD–SS. (A) COFTpBD RRS spectra, 0.35, 1.25, 6.25, 12.5, 20, 25 μg/mL; (B) SS RRS spectra, 0.35, 2.5, 4.25, 12.5, 20, 25 μg/mL; (C) COFTpBD–SS RRS spectra 0.35, 0.7, 6.25, 12.5, 20, 25 μg/mL; (D) AP RRS spectra, 0.35, 1.25, 3.25, 6.25, 12.5, 20, 25 μg/mL; (E) COFTpBD–AP RRS spectra, 0.35, 3.25, 6.25, 12.5, 20, 25 μg/mL; (F) The RRS signal for 30 μg/mL of COFTpBD with variation in temperature; (G) The RRS signal for 30 μg/mL of SS with variation in temperature; (H) The RRS signal for 30 μg/mL of COFTpBD–SS with variation in temperature; (I) The RRS signal for 30 μg/mL AP with variation in temperature; (J) The RRS signal for 30 μg/mL of COFTpBD–AP with variation in temperature; (K) the FTIR of COFTpBD/SS/COFTpBD–SS; (L) the SERS signal for 10 μg/mL of COFTpBD/10 μg/mL SS/10 μg/mL COFTpBD–SS with 0.1 mmol/L AuNP + 0.05 mol/L NaCl + 0.5 μmol/L VBB.
The infrared spectrum of COFTpBD/SS/COFTpBD–SS is shown in Figure 3K. Due to the introduction of SS, the electronic structure of the surface underwent modification, hence the FTIR spectrum did change. As shown in Figure 3K, COFTpBD exhibited characteristic infra-red peaks near 2,436 cm–1, which were attributed to the stretching vibration and in-plane rocking of the NH bond. The peaks for COFTpBD–SS were at 1,098 and 1,208 cm–1 relative to COFTpBD. New peaks were formed, which were assigned to the C-O-C antisymmetric and symmetric stretching vibrations, indicating that the doping by SS may lead to changes in the surface structure of COFTpBD. The structure of COF was confirmed by the Raman spectra for the COFTpBD and COFTpBD–SS samples with AuNPs serving as the SERS substrate and NaCl as the aggregating agent (Figure 3L). COFTpBD exhibited characteristic Raman peaks near 1,118, 1,187, 1,363, and 1,608 cm–1, which were attributed to the torsional vibration, the in-plane rocking of the CH bond, the stretching vibration of the benzene ring and the C = C stretching vibration, respectively. Characteristic Raman peaks for COFTpBD–SS occurred at 1,195, 1,210, 1,413, and 1,625 cm–1, and the peaks belonged to the in-plane rocking of the CH bond, the stretching vibration of the C-O-C, the stretching vibration of the benzene ring and the C = C stretching vibration, respectively. The SS has no clear characteristic peaks in the Raman spectrum. Compared with COFTpBD, COFTpBD–SS had a “new” characteristic peak at 1,210 cm–1, which was attributed to the stretching vibration of C-O-C. Due to the introduction of carbohydrate SS, the surface electronic structure had changed, hence the SERS spectrum changed. This indicated that a strong intermolecular force existed between the COFTpBD and the SS, and the SS is well supported in the pores of COFTpBD; this factor may well account for the enhanced catalytic activity.
The particle size distribution of COFTpBD was measured using a particle size analyzer. The particle sizes of most COFTpBD particles ranged from 300 to 800 nm, and the average size was 522 nm. The average particle size of COFTpBD–SS was 1,412 nm after COF was loaded with SS, which reflects the incorporation of the long chain amylose (Supplementary Figure 2A). The charge distribution potentials for COFTpBD and COFTpBD–SS were 0.0652 and 0.11 mV, respectively (Supplementary Figures 2B, C). The larger the absolute potential became, the more stable were the particles in the solution, and hence the stability of COFTpBD–SS was significantly improved (Supplementary Figure 2C).
To test the stability of COFTpBD, SS and COFTpBD–SS, changes in the charge distribution potential and their stability over time for solutions containing different concentrations of NaCl were studied, respectively. Supplementary Figure 2D shows that the absorbance values for COFTpBD and SS and the mixed of SS and COFTpBD solution decreased over time; the absorbance value for COFTpBD–SS was, however, stable, and the change was less than 5%. To study the stability of these catalytic materials in NaCl solutions of different concentrations, 150 μL of 0.1 mg/mL COFTpBD, SS and COFTpBD–SS were added into a series of 5 mL volumetric flasks. The absorbance signals were then measured by adding different volumes of 1 mol/L NaCl solution diluted with H2O to 2 mL (Supplementary Figure 2E). The COFTpBD and SS samples were found to be unstable in the different concentrations of NaCl solution, while the absorbance value for COFTpBD–SS was stable in low salinity solution. The absorbance value for the COFTpBD–SS solution decreased slightly with increasing NaCl concentration. The results showed that COFTpBD–SS was also stable in saline solution, while COFTpBD and SS were relatively less stable. This was because SS could be evenly dispersed on the surface and in the pores of the COFTpBD structure after COFTpBD was loaded with SS, thus the stability of SS was greatly improved compared with that of COFTpBD and SS.
Supplementary Figure 3A shows that COFTpBD only has a diffraction peak near 25.7°, which corresponds to the (001) facet (34). Compared with COFTpBD, COFTpBD–SS has no diffraction peaks of SS. This may be due to the low crystallinity of the loaded SS. To evaluate the permanent porosities and the surface area of COFs, the nitrogen adsorption-desorption isotherm was measured after degassing at 70°C for 6 h (Supplementary Figure 3B). According to the Brunauer–Emmett–Teller (BET) formula, the specific surface areas of COFTpBD and COFTpBD–SS are calculated to be 256 and 1,033 m2 g–1, respectively. The pore size distribution is illustrated in Supplementary Figure 3C, where the average pore sizes of COFTpBD and COFTpBD–SS are 7.9 and 3.2 nm, respectively. The existence of the mesoporous structure can easily expose active sites and facilitate full contact with the reactants, effectively improving the catalytic efficiency.
Under experimental conditions, the AuNPs generated by the Cd2+-PT-Fo-COFTpBD/SS/COFTpBD–SS/ COFTB/COFTB–SS/COFDT/COFDT–SS-HAuCl4 exhibited a strong SERS peak at 1,615 cm–1. After adding PT to the catalytic system, due to the electrostatic effect, the PT would be adsorbed on the surface of the catalyst, resulting in a decrease in the catalytic activity and a reduction in the number of AuNPs generated, hence a decrease in the SERS signal occurred. When the unknown sample (test solution containing trace level of Cd2+) was added to the inhibition system, PT was bound specifically to Cd2+ forming a stable structure, which detached from the catalyst surface. At the same time, the catalytic activity was restored, resulting in an increase in the number of the AuNPs generated by the nano system hence a recovery of the SERS signal (Figure 4A). Therefore, based on these SERS responses, it may be possible to establish a novel method for the measurement of Cd2+. In addition, the SERS spectra of the COFTB/COFTB–SS/COFDT/COFDT–SS- HAuCl4 system were recorded when different catalyst systems were used (Supplementary Figures 4A–F), however, as can be seen, the COFTpBD–SS system exhibited the largest slope. For the experimental conditions used, a surface plasmon resonance (SPR) absorption peak of Cd2+-PT-COFTpBD–SS-Fo-HAuCl4 was observed at 535 nm (Figure 4B). This corresponded to the SPR absorption peak of the AuNPs.
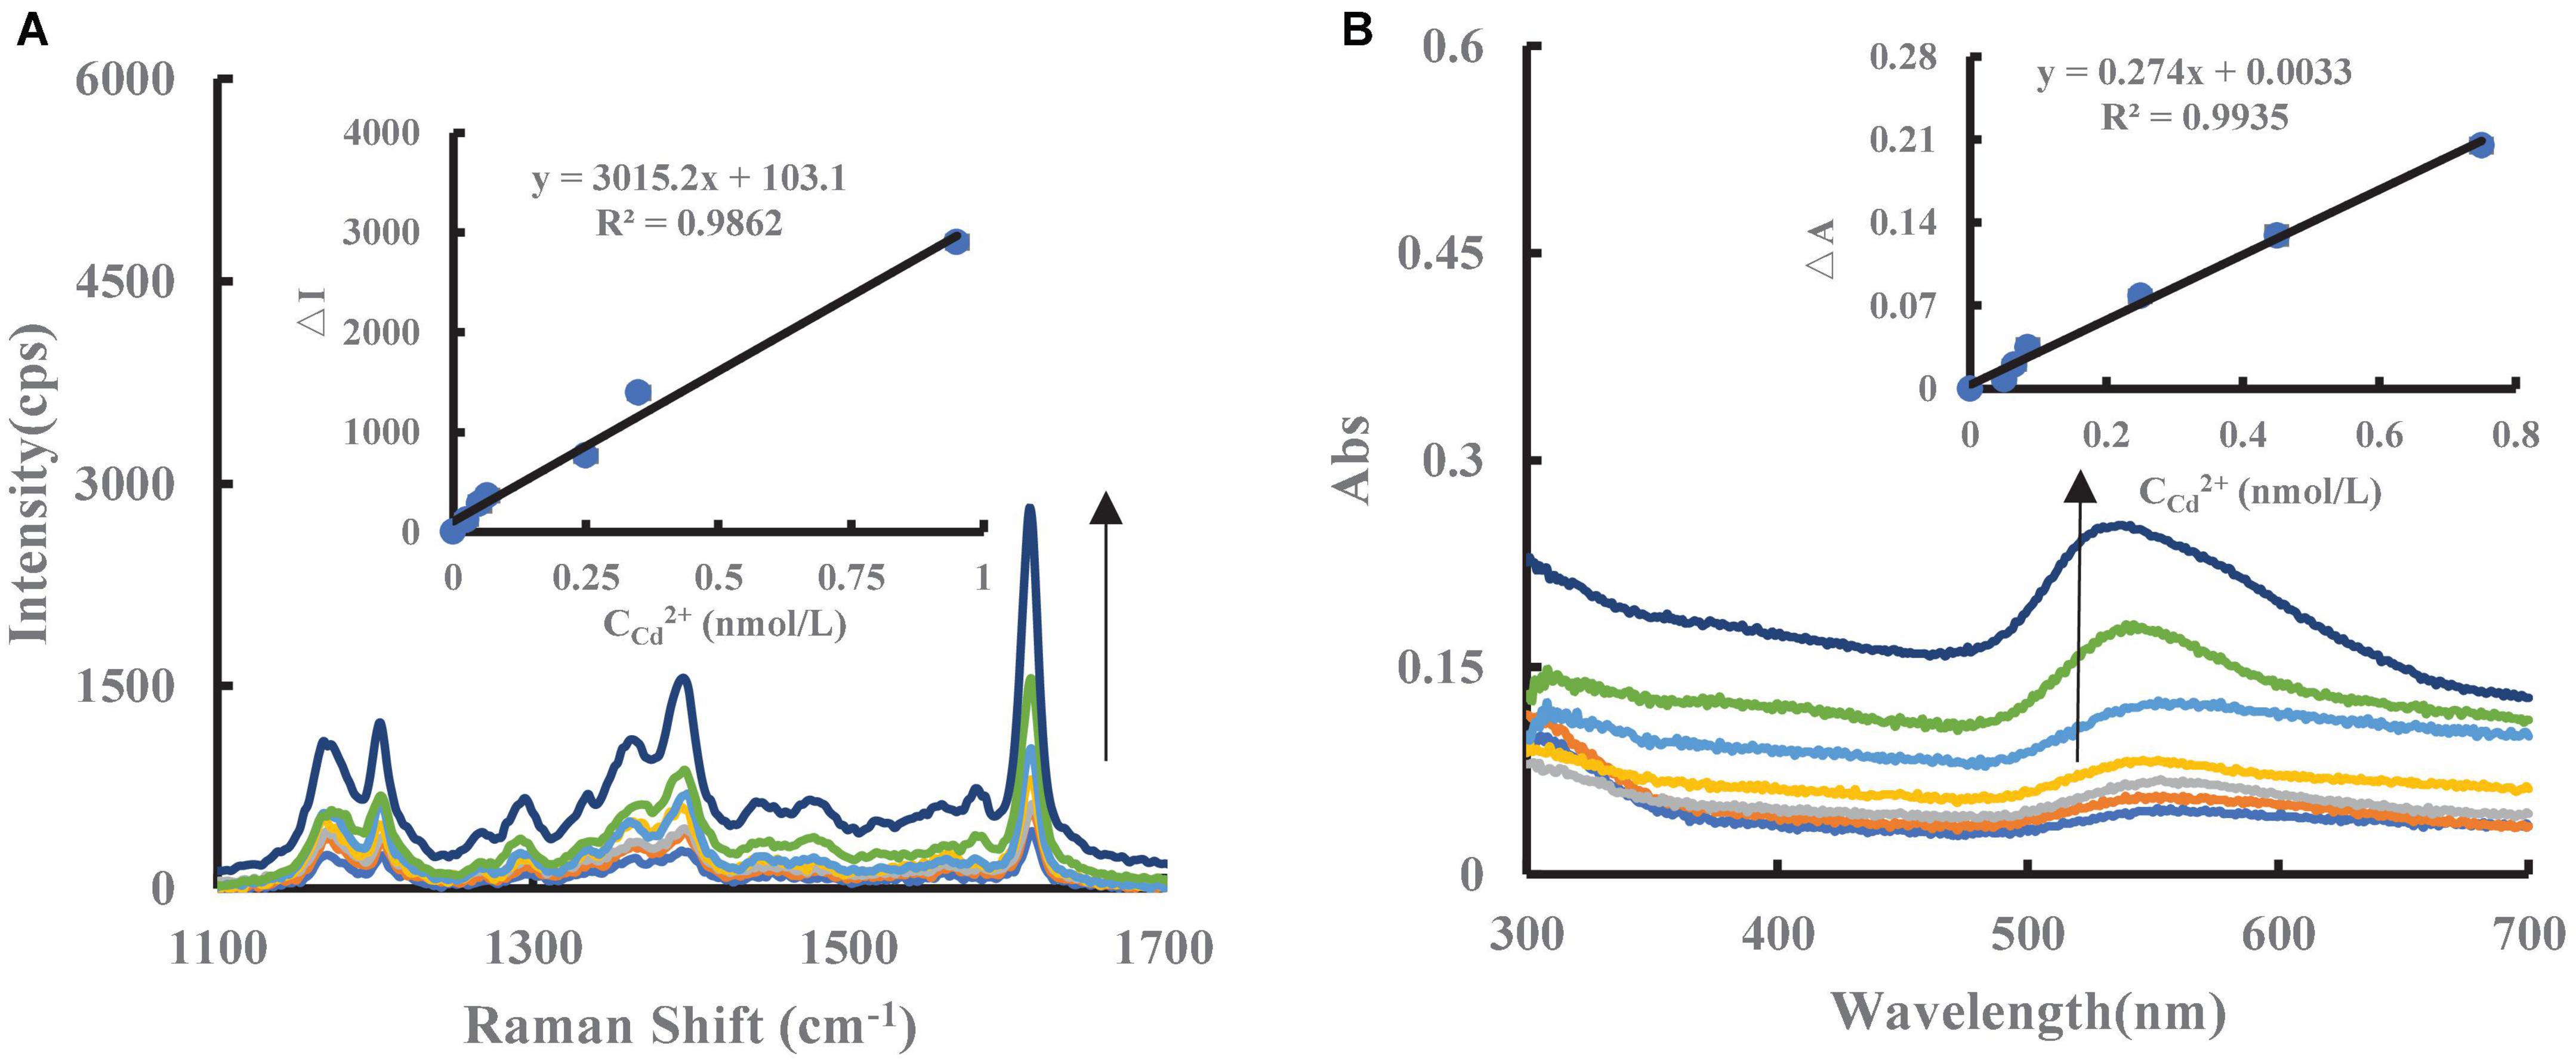
Figure 4. SERS/Abs spectra of catalytic amplification system. (A) (0, 0.025, 0.050, 0.065, 0.25, 0.35, 0.95) nmol/L Cd2+ + 5 nmol/L PT + 6.25 μg/mL COFTpBD–SS + 2.5 mmol/L Fo + 0.5 mmol/L HCl + 0.025 mg/mL HAuCl4 + 0.5 μmol/L VBB + 0.05 mol/L NaCl; (B) Abs of (0, 0.05, 0.065, 0.085, 0.25, 0.45, 0.75) nmol/L Cd2+ + 5 nmol/L PT + 6.25 μg/mL COFTpBD–SS + 5 mmol/L Fo + 2.5 mmol/L HCl + 0.025 mg/mL HAuCl4.
Regarding COFTpBD, the particle size distribution observed was from 710 to 1990 nm for a solution of 6.25 μg/mL of COFTpBD–SS at 25°C. For a temperature of 80°C, the size distribution was from 100 to 340 nm. The average particle size of COFTpBD–SS was 286 nm. That is, an increase in temperature resulted in a smaller particle size, which correspondingly enhanced the catalytic activity of COFTpBD–SS. Therefore, in the case of large size particles, the nanocatalytic reaction did not readily take place at room temperature, and hence cooling of the solution may be used to suppress or stop the nanocatalytic reaction. For the SS, the plot for the change of size with temperature was similar to that for COFTpBD–SS (Supplementary Figure 5).
Under the experimental conditions, the reaction of Fo and HAuCl4 is slow, in which Au3+ is reduced to Au (I) and Au, and HCOO– is oxidized to CO2. COFTpBD/SS/COFTpBD–SS/COFTB/COFTB–SS/COFDT/COFDT–SS catalyzes the HAuCl4-Fo reaction (Supplementary Table 1). However, the AP and COFTpBD–AP did not exhibit catalytic activity. Regarding the slope of the linear equation in Supplementary Table 1, the slope of the COFTpBD–SS catalytic system is greater than the slope for the sum of COFTpBD and SS, thus demonstrating an enhanced catalytic effect.
A low concentration of a SS solution has a relatively small particle size, hence the surface electrons can enhance the redox electron transfer in the HAuCl4-Fo reaction (cf slope of 120.2). As is well known, SS is relatively unstable and can readily self-aggregate. When SS is loaded on the surface of COFTpBD, its stability and the catalytic effect are greatly improved, and the slope of COFTpBD–SS is 303.9. Given that COFTpBD has abundant pores and C = N bonds, there are a large number of π bonds and it is rich in π electrons, hence more active sites would be available for SS to be loaded on the surface, the size being limited by the pores. COFTpBD acts as a carrier to make SS more evenly distributed and prevent its aggregation. When the particle size is at the nanometer scale, with increase in the number of surface atoms, the number of unsaturated bonds increase and the surface energy increases. The free electrons on the SS surface undergo coupling with the π electrons on the surface of COFTpBD. The two sources of electrons greatly facilitate the transfer of electrons in the redox reaction of the COFTpBD–SS–AuNPs, a process which is accelerated by the generation of AuNPs in the reaction hence the greatly enhanced catalytic activity (Figure 5). After PT is added to the nanosystem, due to the electrostatic effect, PT will be adsorbed on the surface of the catalyst and inhibit the catalytic activity. With increase in the PT concentration, the concentration of free catalyst in the system would decrease, and the catalytic activity would be weakened. Therefore, the AuNPs generated in the system would decrease as would the SERS signal (Supplementary Table 2), thus the inhibitory effect of PT was consistent with the observations of the catalytic effect. The main reactions are as follows:

Figure 5. COFTpBD–SS nanocatalytic enhancement mechanism.
The relative standard electrode potential with common valence states of Au can be seen, E0 (Au3+/Au0) = 1.498 V; E0 (Au+/Au0) = 1.692 V; E0 (Au3+/Au+) = 1.401 V. Therefore, due to the low redox potential of trivalent gold ion (Au3+), it is difficult to reduce to gold nanoparticles (Au0) in one step. As shown in Supplementary Figure 6, under the same conditions, Au3+ and Au+ can be reduced by HCOO– to form Au0. After the addition of COFTpBD–SS nanocomposite as catalyst, due to its large specific surface area and more active site, it can promote the reaction faster, accelerate the reduction of Au3+ into Au+, and Au+ into Au0, and the reaction is easier to proceed.
According to the experimental method, based on the strength of the catalytic effect of COFTpBD–SS nanosol on the Au-nanoindicator reaction, the corresponding conditions which yielded a strong catalytic effect were selected. The preparation conditions for the catalyst were optimized by changing the experimental conditions, respectively. When the loading condition for COFTpBD with SS was 10 mL of 3 mmol/L (Supplementary Figure 7A), the amount of SS in COFTB was 8 mL of 3 mmol/L (Supplementary Figure 7B), and the amount of SS in COFDT was 8.5 mL of 3 mmol/L (Supplementary Figure 7C), then the ΔI of the catalytic system was maximized Therefore, these conditions were selected as the optimum experimental conditions.
The experimental conditions for SERS analysis were checked according to the experimental procedures. When the concentrations of the reactants/reagents were as follows: 6.25 μg/mL COFTpBD–SS (Supplementary Figure 8A), 5 nmol/L PT (Supplementary Figure 8B), 0.025 mg/mL HAuCl4 (Supplementary Figure 8C), 2.5 mmol/L HCl (Supplementary Figure 8D), 5 mmol/L Fo (Supplementary Figure 8E), 0.5 μmol/L VBB (Supplementary Figure 8F), 0.05 mol/L NaCl (Supplementary Figure 8G), reaction temperature of 80°C Supplementary Figure 8H), reaction time of 15 min (Supplementary Figure 8I), the SERS response was optimal. The aforementioned conditions were chosen for SERS measurement.
Using the optimized conditions, the corresponding ΔI/ΔA values for different concentrations of Cd2+ was plotted to obtain the working curve. It can be seen from Supplementary Tables 2, 3 that the slope of the working curve of the COFTpBD–SS-Cd2+ system was 1 times that of COFTpBD and 3 times that of SS, respectively, indicating that the former was the most sensitive (Figure 4A). The linear equation for spectrophotometric measurement was ΔI1,615 cm–1 = 3015.2C + 103.1, and the linear range was 0.025–0.95 nmol/L. Although the reaction time for the spectrophotometric method was relatively short, the sensitivity was less than SERS by a factor (Supplementary Table 3). Compared with the reported molecular spectroscopic methods for the determination of Cd2+ (35-37), the present SERS method is highly sensitive method (Supplementary Table 4).
Reproducibility is an important indicator to be considered by biosensors, and it is only feasible with small coefficient of variation (CV, also called relative standard deviation) (38). The intra-batch and inter-batch differences of SERS/Abs tests were conducted under 0.25 nmol/L cadmium standard solution (Supplementary Figure 9). In the same batch of tests, the Cd2+ was detected for 6 times. The results showed no difference, indicating that the intra-batch difference between individual biosensor tests was very small (Supplementary Figure 9A). In different 8 batches of tests, the Cd2+ was detected within the scope of effective detection (usually CV values < 15%) at 0.25 nmol/L cadmium standard solution, suggesting that the inter-batch difference was within the acceptable range (Supplementary Figure 9B). The potential for interferences by coexisting ions on the SERS determination of 0.01 nmol/L Cd2+ was investigated. The experimental results indicated that in the presence of: (1) 1,000-fold excess of the following ions Mg2+, Zn2+, K+, Al3+, Na+, Ca2+, Ba2+, Fe3+, Mn2+, Co2+, Cu2+, (2) 100-fold excess of Cr6+, NH4+, Hg2+, SO42–, NO2–, I–, and (3) 10-fold excess of CO32–, PO43–, Br–, the aforementioned ions at the specified concentrations did not interfere with the measurement (Supplementary Table 5). Moreover, the relative error was within ± 10% hence the method afforded good selectivity for the determination of trace amounts of Cd2+.
After sample pretreatment, in order to perform a recovery test, aliquots of standard solutions of Cd2+ were added to the digests. The Cd2+ content was determined according to the 2.3 experimental procedures. The analytical results are shown in Supplementary Table 6. The Cd2+ contents of the digests ranged from 0 to 0.31 nmol/L, which corresponded to Cd2+ contents in rice of 0–12.21 ng/g. The relative standard deviations (RSDs) ranged from 1.9 to 9.7%, and the recoveries were 91.2–109.7%, confirming that the SERS assay was accurate and reliable.
Based on loading SS nanoparticles into COFs, a novel COFTpBD–SS nanomaterial has been prepared. The nanomaterial not only enhanced catalytic activity but also had good stability. A nanoAu indicator reaction for COFTpBD–SS catalysis was investigated by molecular spectroscopy such that a SERS/Abs bi-mode method was developed for the determination of Cd2+ in rice based on exploiting the highly sensitive nanocatalytic amplification reaction based on the highly selective reaction with PT. The SERS analysis method was sensitive, whereas the Abs was relatively simple and of low cost. A plausible nanocatalytic mechanism was proposed whereby the nanosurface electrons enhanced the redox electron transfer to speed up the AuNP reaction.
The original contributions presented in this study are included in the article/Supplementary material, further inquiries can be directed to the corresponding authors.
JL and YS: software, visualization, writing—original draft, investigation, and formal analysis. CL and ZJ: software, visualization, conception, reviewing and editing, software, methodology, validation, formal analysis, and supervision. All authors contributed to the article and approved the submitted version.
This work was supported by the Scientific Research Foundation of Guangxi Education Department (no. 2022KY0509), the National Natural Science Foundation of China (nos. 22266013 and 22264005), and the Natural Science Foundation of Guangxi (no. 2022GXNSFDA035073).
The authors declare that the research was conducted in the absence of any commercial or financial relationships that could be construed as a potential conflict of interest.
All claims expressed in this article are solely those of the authors and do not necessarily represent those of their affiliated organizations, or those of the publisher, the editors and the reviewers. Any product that may be evaluated in this article, or claim that may be made by its manufacturer, is not guaranteed or endorsed by the publisher.
The Supplementary Material for this article can be found online at: https://www.frontiersin.org/articles/10.3389/fnut.2022.1075296/full#supplementary-material
1. Mehta P, Neupane L, Park S, Lee K. Ratiometric fluorescent detection of silver nanoparticles in aqueous samples using peptide-based fluorogenic probes with aggregation-induced emission characteristics. J Hazard Mater. (2021) 411:125041. doi: 10.1016/j.jhazmat.2021.125041
2. Zhi S, Wei Q, Zhang C, Yi C, Li C, Jiang Z. MXene catalytic amplification-fluorescence/absorption dimode aptamer sensor for the detection of trace Pb2+ in milk. Front Nutr. (2022) 9:1008620. doi: 10.3389/fnut.2022.1008620
3. Zhuang H, Jiang X, Wu S, Wang S, Pang Y, Huang Y, et al. A novel polypeptide-modified fluorescent gold nanoclusters for copper ion detection. Sci Rep. (2022) 12:6624. doi: 10.1038/s41598-022-10500-9
4. Yu B, Cui Y, Mao X, Li Z, Li Z, Shi G. A time-resolved fluorescence lateral flow immunochromatographic assay based on oriented immobilized antibodies for the ultrasensitive detection of C-peptides in human serum. Anal Chim Acta. (2022) 1208:339833. doi: 10.1016/j.aca.2022.339833
5. Damayanti N, Buno K, Voytik Harbin S, Irudayaraj J. Epigenetic process monitoring in live cultures with peptide biosensors. ACS Sens. (2019) 4:562–5. doi: 10.1021/acssensors.8b01134
6. Islam S, Powner M. Prebiotic systems chemistry: complexity overcoming clutter. Chem. (2017) 2:470–501. doi: 10.1016/j.chempr.2017.03.001
7. Foden C, Islam S, Fernández-García C, Maugeri L, Sheppard T, Powner M. Prebiotic synthesis of cysteine peptides that catalyze peptide ligation in neutral water. Science. (2020) 370:865–9. doi: 10.1126/science.abd5680
8. Samoylenko A, Kögler M, Zhyvolozhnyi A, Makieieva O, Bart G, Andoh S, et al. Time-gated Raman spectroscopy and proteomics analyses of hypoxic and normoxic renal carcinoma extracellular vesicles. Sci Rep. (2021) 11:19594. doi: 10.1038/s41598-021-99004-6
9. Kuramochi H, Takeuchi S, Kamikubo H, Kataoka M, Tahara T. Fifth-order time-domain Raman spectroscopy of photoactive yellow protein for visualizing vibrational coupling in its excited state. Sci Adv. (2019) 5:eaau4490. doi: 10.1126/sciadv.aau4490
10. Fang W, Jia S, Chao J, Wang L, Duan X, Liu H, et al. Quantizing single-molecule surface-enhanced Raman scattering with DNA origami metamolecules. Sci Adv. (2019) 5:eaau4506. doi: 10.1126/sciadv.aau4506
11. Qu G, Zhang G, Wu Z, Shen A, Wang J, Hu JA. “turn-off” SERS assay of heparin with high selectivity based on heparin–peptide complex and Raman labelled gold nanoparticles. Biosens Bioelectron. (2014) 60:124–9. doi: 10.1016/j.bios.2014.04.004
12. Liang A, Li C, Li D, Luo Y, Wen G, Jiang Z. A facile and sensitive peptide-modulating graphene oxide nanoribbon catalytic nanoplasmon analytical platform for human chorionic gonadotropin. Int J Nanomedicine. (2017) 12:8725–34. doi: 10.2147/IJN.S149536
13. Lan Y, Han X, Tong M, Huang H, Yang Q, Liu D, et al. Materials genomics methods for high-throughput construction of COFs and targeted synthesis. Nat Commun. (2018) 9:5274. doi: 10.1038/s41467-018-07720-x
14. Yuan S, Li X, Zhu J, Zhang G, Van Puyvelde P, Van der Bruggen B. Covalent organic frameworks for membrane separation. Chem Soc Rev. (2019) 48:2665–81. doi: 10.1039/C8CS00919H
15. Lohse M, Bein T. Covalent organic frameworks: structures, synthesis, and applications. Adv Funct Mater. (2018) 28:1705553. doi: 10.1002/adfm.201705553
16. Liu Y, Wu H, Wu S, Song S, Guo Z, Ren Y, et al. Multifunctional covalent organic framework (COF)-Based mixed matrix membranes for enhanced CO2 separation. J Membr Sci. (2021) 618:118693. doi: 10.1016/j.memsci.2020.118693
17. Lyle S, Waller P, Yaghi O. Covalent organic frameworks: organic chemistry extended into two and three dimensions. Trends Chem. (2019) 1:172–84. doi: 10.1016/j.trechm.2019.03.001
18. Wang H, Zhao Y, Shi J, Wen G, Liang A, Jiang Z. A novel aptamer RRS assay platform for ultratrace melamine based on COF-loaded Pd nanocluster catalytic amplification. J Hazard Mater. (2022) 423:127263. doi: 10.1016/j.jhazmat.2021.127263
19. Geng K, He T, Liu R, Dalapati S, Tan K, Li Z, et al. Covalent organic frameworks: design, synthesis, and functions. Chem Rev. (2020) 120:8814–933. doi: 10.1021/acs.chemrev.9b00550
20. Lei Z, Yang Q, Xu Y, Guo S, Sun W, Liu H, et al. Boosting lithium storage in covalent organic framework via activation of 14-electron redox chemistry. Nat Commun. (2018) 9:576. doi: 10.1038/s41467-018-02889-7
21. He J, Xu F, Chen Z, Hou X, Liu Q, Long Z. AuNPs/COFs as a new type of SERS substrate for sensitive recognition of polyaromatic hydrocarbons. Chem Commun. (2017) 53:11044–7. doi: 10.1039/C7CC06440C
22. Shu Y, Zhi S, Li S, Liang A, Jiang Z. A new peptide-mediated COF nanocatalytic amplification SERS quantitative assay for ultratrace Cu2+. J Ind Eng Chem. (2022) 113:196–205. doi: 10.1016/j.jiec.2022.05.046
23. Yao D, Li C, Wang H, Wen G, Liang A, Jiang Z. A new dual-mode SERS and RRS aptasensor for detecting trace organic molecules based on gold nanocluster-doped covalent-organic framework catalyst. Sens Actuators B Chem. (2020) 319:128308. doi: 10.1016/j.snb.2020.128308
24. Wang H, Bai H, Wen G, Liang A, Jiang Z. Efficient nanocatalytic amplification of COF-loaded liquid crystal coupling with free-label aptamer to determine trace small molecular drugs by SERS quantitative strategy. Appl Mater Today. (2022) 27:101490. doi: 10.1016/j.apmt.2022.101490
25. Zugenmaier P, Voihsel M. A new class of polymeric liquid crystals: lyotropic amylose ethers. Makromol Chem Rapid Commun. (1984) 5:245–53. doi: 10.1002/marc.1984.030050502
26. Oyamada K, Terao K, Suwa M, Kitamura S, Sato T. Lyotropic liquid crystallinity of amylose tris(alkylcarbamates): cholesteric and smectic phase formation in different solvents. Macromolecules. (2013) 46:4589–95. doi: 10.1021/ma400787c
27. Balasurya S, Syed A, Swedha M, Harini G, Elgorban A, Zaghloul N, et al. A novel SPR based Fe@Ag core–shell nanosphere entrapped on starch matrix an optical probe for sensing of mercury(II) ion: a nanomolar detection, wide pH range and real water sample application. Spectrochim Acta A Mol Biomol Spectrosc. (2021) 263:120204. doi: 10.1016/j.saa.2021.120204
28. Sapyen W, Toonchue S, Praphairaksit N, Imyim A. Selective colorimetric detection of Cr(VI) using starch-stabilized silver nanoparticles and application for chromium speciation. Spectrochim Acta A Mol Biomol Spectrosc. (2022) 274:121094. doi: 10.1016/j.saa.2022.121094
29. Chen G, Shah K, Shi L, Chiang P. Removal of Cd(II) and Pb(II) ions from aqueous solutions by synthetic mineral adsorbent: performance and mechanisms. Appl Surf Sci. (2017) 409:296–305. doi: 10.1016/j.apsusc.2017.03.022
30. Hua Y, Zheng X, Xue L, Han L, He S, Mishra T, et al. Microbial aging of hydrochar as a way to increase cadmium ion adsorption capacity: process and mechanism. Bioresour Technol. (2020) 300:122708. doi: 10.1016/j.biortech.2019.122708
31. Elkady M, Abu-Saied M, Abdel Rahman A, Soliman E, Elzatahry A, Elsayed Yossef M, et al. Nano-sulphonated poly (glycidyl methacrylate) cations exchanger for cadmium ions removal: effects of operating parameters. Desalination. (2011) 279:152–62. doi: 10.1016/j.desal.2011.06.002
32. Behbahani E, Dashtian K, Ghaedi M. Fe3O4-FeMoS4: promise magnetite LDH-based adsorbent for simultaneous removal of Pb (II), Cd (II), and Cu (II) heavy metal ions. J Hazard Mater. (2021) 410:124560. doi: 10.1016/j.jhazmat.2020.124560
33. Huang H, Li J, Pan S, Wang H, Liang A, Jiang Z. A novel small molecular liquid crystal catalytic amplification-nanogold SPR aptamer absorption assay for trace oxytetracycline. Talanta. (2021) 233:122528. doi: 10.1016/j.talanta.2021.122528
34. Chen X, Addicoat M, Jin E, Xu H, Hayashi T, Xu F, et al. Designed synthesis of double-stage two-dimensional covalent organic frameworks. Sci Rep. (2015) 5:14650–69. doi: 10.1038/srep14650
35. Wang P, Wu J, Zhao C. A water-soluble peptide fluorescent chemosensor for detection of cadmium (II) and copper (II) by two different response modes and its application in living LNcap cells. Spectrochim Acta A Mol Biomol Spectrosc. (2020) 226:117600. doi: 10.1016/j.saa.2019.117600
36. Serrano N, Prieto-Simón B, Cetó X, del Valle M. Array of peptide-modified electrodes for the simultaneous determination of Pb(II), Cd(II) and Zn(II). Talanta. (2014) 125:159–66. doi: 10.1016/j.talanta.2014.02.052
37. Jiang X, Xia J, Luo X. Simple, rapid, and highly sensitive colorimetric sensor strips from a porous cellulose membrane stained with Victoria blue B for efficient detection of trace Cd(II) in water. ACS Sustain Chem Eng. (2020) 8:5184–91. doi: 10.1021/acssuschemeng.9b07614
Keywords: Cd2+, peptides, COF loaded-SS catalysis, SERS, gold nanoparticle, indicator reaction
Citation: Li J, Shu Y, Li C and Jiang Z (2023) Highly catalytic nanoenzyme of covalent organic framework loaded starch- surface-enhanced Raman scattering/absorption bi-mode peptide as biosensor for ultratrace determination of cadmium. Front. Nutr. 9:1075296. doi: 10.3389/fnut.2022.1075296
Received: 11 November 2022; Accepted: 21 December 2022;
Published: 09 January 2023.
Edited by:
Mahmood Alizadeh Sani, Tehran University of Medical Sciences, IranReviewed by:
Lingshan Gong, University of North Texas, United StatesCopyright © 2023 Li, Shu, Li and Jiang. This is an open-access article distributed under the terms of the Creative Commons Attribution License (CC BY). The use, distribution or reproduction in other forums is permitted, provided the original author(s) and the copyright owner(s) are credited and that the original publication in this journal is cited, in accordance with accepted academic practice. No use, distribution or reproduction is permitted which does not comply with these terms.
*Correspondence: Chongning Li,  bGNuNzg4MjM0MkBxcS5jb20=; Zhiliang Jiang, emxqaWFuZ0BneG51LmVkdS5jbg==
Disclaimer: All claims expressed in this article are solely those of the authors and do not necessarily represent those of their affiliated organizations, or those of the publisher, the editors and the reviewers. Any product that may be evaluated in this article or claim that may be made by its manufacturer is not guaranteed or endorsed by the publisher.
Research integrity at Frontiers
Learn more about the work of our research integrity team to safeguard the quality of each article we publish.