
94% of researchers rate our articles as excellent or good
Learn more about the work of our research integrity team to safeguard the quality of each article we publish.
Find out more
ORIGINAL RESEARCH article
Front. Nutr., 23 December 2022
Sec. Nutrition and Metabolism
Volume 9 - 2022 | https://doi.org/10.3389/fnut.2022.1053348
This article is part of the Research TopicPolyunsaturated Fatty Acids and Gut MicrobiotaView all 6 articles
 Lin Chen1
 Qihong Jiang2
 Hongling Lu1Chenkai Jiang1
 Wenjun Hu1Shaofang Yu1
 Xingwei Xiang2Chin Ping Tan3,4Yongcai Feng4Jianfang Zhang4
 Mingqian Li5*
 Guoxin Shen1*
Type 2 diabetes mellitus (T2DM) is a metabolic disease characterized by hyperglycemia. The aim of this work was to investigate the effect of sciadonic acid (SA) on disorders of glucolipid metabolism and intestinal flora imbalance and to further investigate its potential molecular mechanism of anti-diabetes. The experimental data indicated that SA could alleviate hyperlipidemia, insulin resistance, oxidative stress, the inflammatory response, repair liver function damage, and promote glycogen synthesis caused by T2DM. SA could also activate the PI3K/AKT/GLUT-2 signaling pathway, promote glucose metabolism gene expression, and maintain glucose homeostasis. Furthermore, 16S rRNA analysis revealed that SA could reduce the Firmicutes/Bacteroidota (F/B) ratio; promote norank_f__Muribaculaceae, Allobaculum, Akkermansia, and Eubacterium_siraeum_group proliferation; increase the levels of major short-chain fatty acids (SCFAs), such as acetic acid, propionic acid, and butyric acid; and maintain the homeostasis of the intestinal flora. In conclusion, these results suggested that SA could reshape the structural composition of intestinal microbes, activate the PI3K/AKT/GLUT2 pathway, improve insulin resistance, and decrease blood glucose levels.
Type 2 diabetes mellitus (T2DM) is a disorder of glucose metabolism characterized by increased insulin resistance leading to hyperglycemia (1). T2DM accounts for over 90% of people with diabetes and has become a major global public health problem (2). The global prevalence of diabetes among people aged 20–79 years is estimated to be 10.5% in 2021 and is expected to rise to 12.2% by 2045. The greatest increase in diabetes prevalence from 2021 to 2045 is predicted to occur in middle-income countries (21.1%), followed by high-income and low-income countries (12.2 and 11.9% respectively). By 2045, the number of adults with diabetes in middle-income countries will exceed 200 million (3). In particular, T2DM patients often suffer from complications due to hyperglycemia, including cardiovascular disease (4), kidney failure, and retinopathy (5). A variety of hypoglycemic drugs are currently used for the treatment of T2DM, including metformin (Met), thiazolidinediones, and sulfonylureas. However, the long-term use of these drugs can lead to certain side effects, such as gastrointestinal dysfunction (6), increased mortality, and cardiovascular risk (7). Therefore, researchers are increasingly committed to developing hypoglycemic substances with good therapeutic effects and no side effects.
Previous studies have found that vegetable oils rich in medium-chain fatty acids (MCFAs), which are fatty acids with carboxylic acid chains in the range of 6–12 carbons, may improve factors associated with T2DM by lowering total cholesterol (TC) and low-density lipoprotein (LDL) levels, reducing aspartate aminotransferase (AST) activity, and lowering the body weight (BW) and body mass index (BMI) (8, 9). Torreya grandis (T. grandis) is a large, evergreen, and ornamental coniferous tree belonging to the Cephalotaxaceae family and Torreya genus and mainly distributed in the hilly areas of subtropical China, especially in the Kuaiji Mountains of Zhejiang Province (10). T. grandis is known for its edible seeds with high nutritional and medicinal value. The seeds are rich in oils, fatty acids, proteins, vitamins, and mineral elements (10), which have biological activities, such as anti-oxidant (11), anti-tumor, and anti-inflammatory effects (12). The seed kernels of T. grandis contain approximately 42.6–61.5% oil. Unsaturated fatty acids were reported to account for 76.1–94.3% of the total fatty acids and to consist mainly of linoleic and oleic acids (13). Sciadonic acid (SA) is a polyunsaturated acid (5c, 11c, 14c-eicosatrienoic acid, SA) with anti-oxidant, anti-inflammatory, and improved lipid metabolic activities (14, 15). In the natural environment, SA is specifically abundant in conifers, such as edible pine seeds and T. grandis seeds. Compared with traditional oil, intragastric administration of T. grandis seeds oil containing SA could significantly improve obesity (14, 15). Nevertheless, the effect of SA on the alteration of gut microbiota and the potential mechanism through which it improves T2DM remain unclear. Therefore, in-depth studies on the hypoglycemic therapeutic effects of SA are important for refined production of T. grandis seeds and development of dietary supplements.
In the present study, we investigated the effects of SA on the PI3K/Akt signaling pathway at the gene and protein expression levels in a high-fat diet (HFD) and streptozotocin (STZ) induced T2DM mouse model. Furthermore, to investigate the possible mechanism of SA’s anti-diabetic activity, we also analyzed the effect of SA on the intestinal microbial structure and composition in T2DM mice. These results will help elucidate the hypoglycemic mechanism of SA, develop SA-related functional foods, and promote the high-value utilization of SA in the pharmaceutical industry.
Type 2 diabetes mellitus caused weight loss and disrupted organismal function. In the early stages of diabetes, the BW of mice increased significantly in all groups. However, the weight gain was 7.74% in group B mice, and the weight loss was 6.67% in group P mice compared to the beginning of the study. Notably, SA could inhibit the weight loss trend in T2DM mice in a dose-dependent manner and was not significantly different from that in normal mice (Figure 1A). In addition, the persistent hyperglycemia resulted in significantly increased liver and kidney indices in T2DM mice compared with the mice in group B, while the indices were significantly decreased in the T, SAL, and SAH groups; notably, SAH was more effective (Figures 1E, F). The experimental results revealed that HFD caused obesity along with abnormal blood glucose levels. The initial FBG levels in the HFD/STZ-induced T2DM mouse group were significantly higher than those in the B group. Compared with the P group, the FBG of mice in the T, SAL, and SAH groups decreased significantly after 4 weeks of Met and SA treatment (P < 0.05) by 41.01, 21.61, and 31.14%, respectively (Figure 1B).
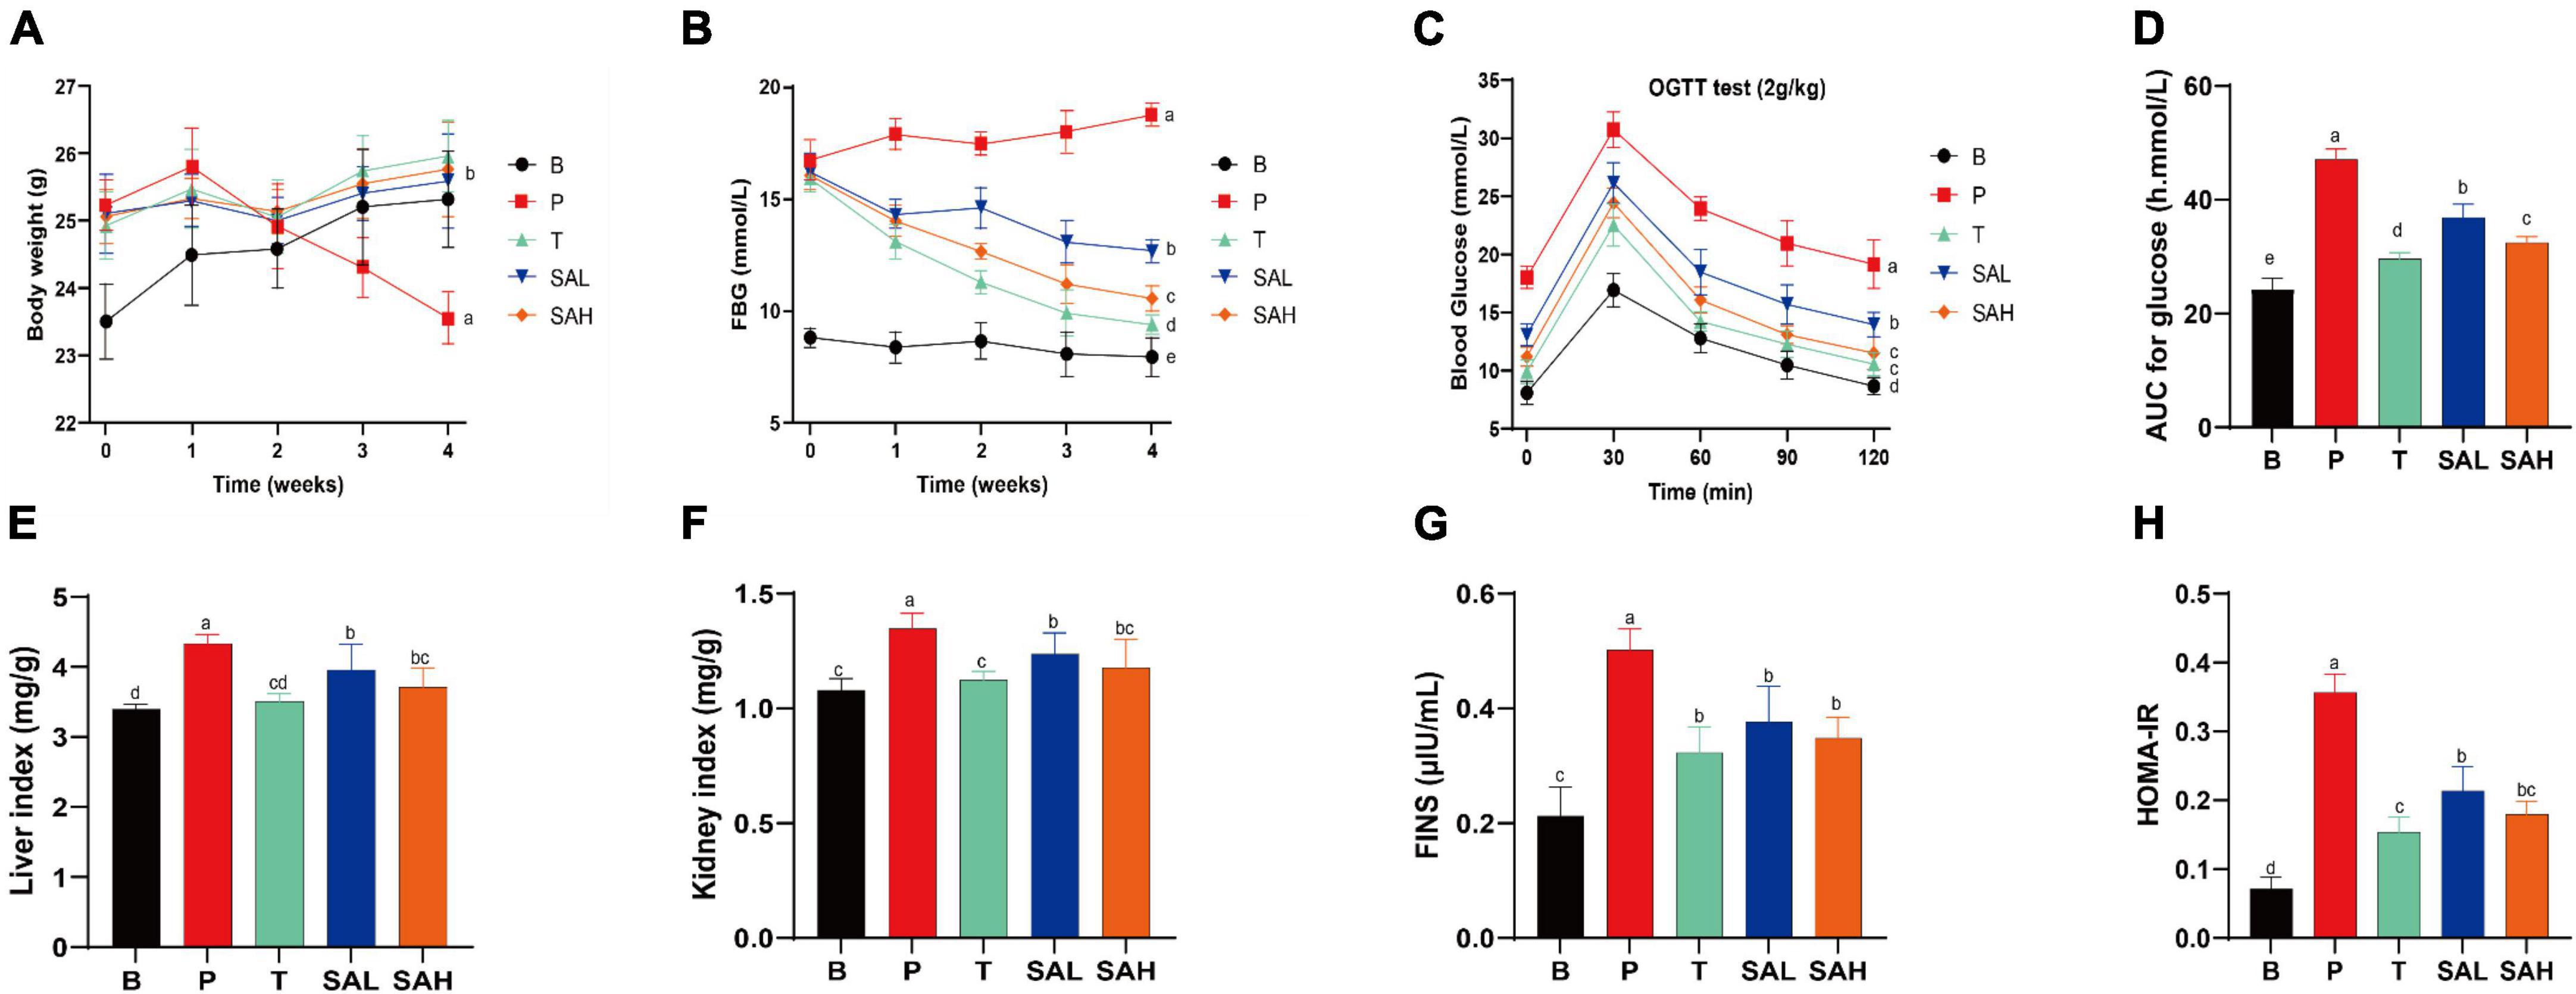
Figure 1. Sciadonic acid (SA) improved body parameters in type 2 diabetes mellitus (T2DM) mice. (A) BW, (B) FBG, (C) OGTT, (D) AUC of OGTT, (E) liver index, (F) kidney index, (G) FINS, and (H) HOMA-IR. Data were presented as the mean ± SD (n = 6). Different letters represent a significant difference among multiple groups (P < 0.05). B, control group; P, diabetic model group; T, (HFD + 200 mg kg– 1 Met); SAL, (HFD + 70 mg kg– 1 SA); SAH, (HFD + 280 mg kg– 1 SA).
To further analyze the tolerance of mice to blood glucose, we used the OGTT. In Figures 1C, D, the OGTT of blood glucose over 120 min showed a flatter overall blood glucose curve in group B. While the curve was steeper and the AUC increased significantly in group P, indicating that glucose tolerance was impaired in T2DM mice. After the Met and SA interventions, blood glucose levels exhibited a strong and significant decrease compared to the P group, indicating that SA may improve glucose tolerance in diabetic mice. Furthermore, insulin levels were significantly higher in T2DM mice compared to group B (P < 0.05), demonstrating the development of insulin resistance (Figure 1G). Met and SA administration induced FINS reductions of 55.25, 33.02, and 43.94% in the T, SAL, and SAH groups, respectively. HOMA-IR values were used to reveal the ability of insulin to transform glucose in mice. The greater the HOMA-IR, the lower the insulin sensitivity. And the greater the insulin resistance, and the lower the hypoglycemic efficiency. In the present work, T2DM mice became severely insulin resistant, with HOMA-IR values significantly higher than those in group B (P < 0.05). HOMA-IR was significantly lower in the SAL and SAH groups than in the P group and decreased by 40.02 and 49.56%, respectively (Figure 1H). These results suggested that SA could improve HFD/STZ-induced hyperglycemia and might play an important role in the hypoglycemic effect.
To investigate the effect of SA on lipid metabolism, TC, TG, LDL-C, and HDL-C levels in mouse serum were measured. The results showed that TG, TC, and LDL-C levels were significantly higher, whereas HDL-C levels were lower in the P group than in the B group. Met and SA treatment significantly improved these indices compared to the P group. Thus, these findings suggested that the intervention with SA improved the dyslipidemia in T2DM mice (Figures 2A–D). Previous studies demonstrated that oxidative stress plays a causal role in T2DM (16). The activity levels of SOD and GSH-Px in the serum of mice in group P were lower than those in group B (P < 0.05) (Figures 2E, F). In contrast, the levels of SOD and GSH-Px activities in the liver of mice in the SA group were significantly higher (P < 0.05) and showed a dose-dependent pattern. This indicated that SA could improve the antioxidant capacity of T2DM mice. Besides, our research data demonstrated that SA could reduce the serum levels of IL-6 and TNF-α in T2DM mice (Figures 2G, H), with a more significant effect in reducing IL-6 levels (P < 0.05).
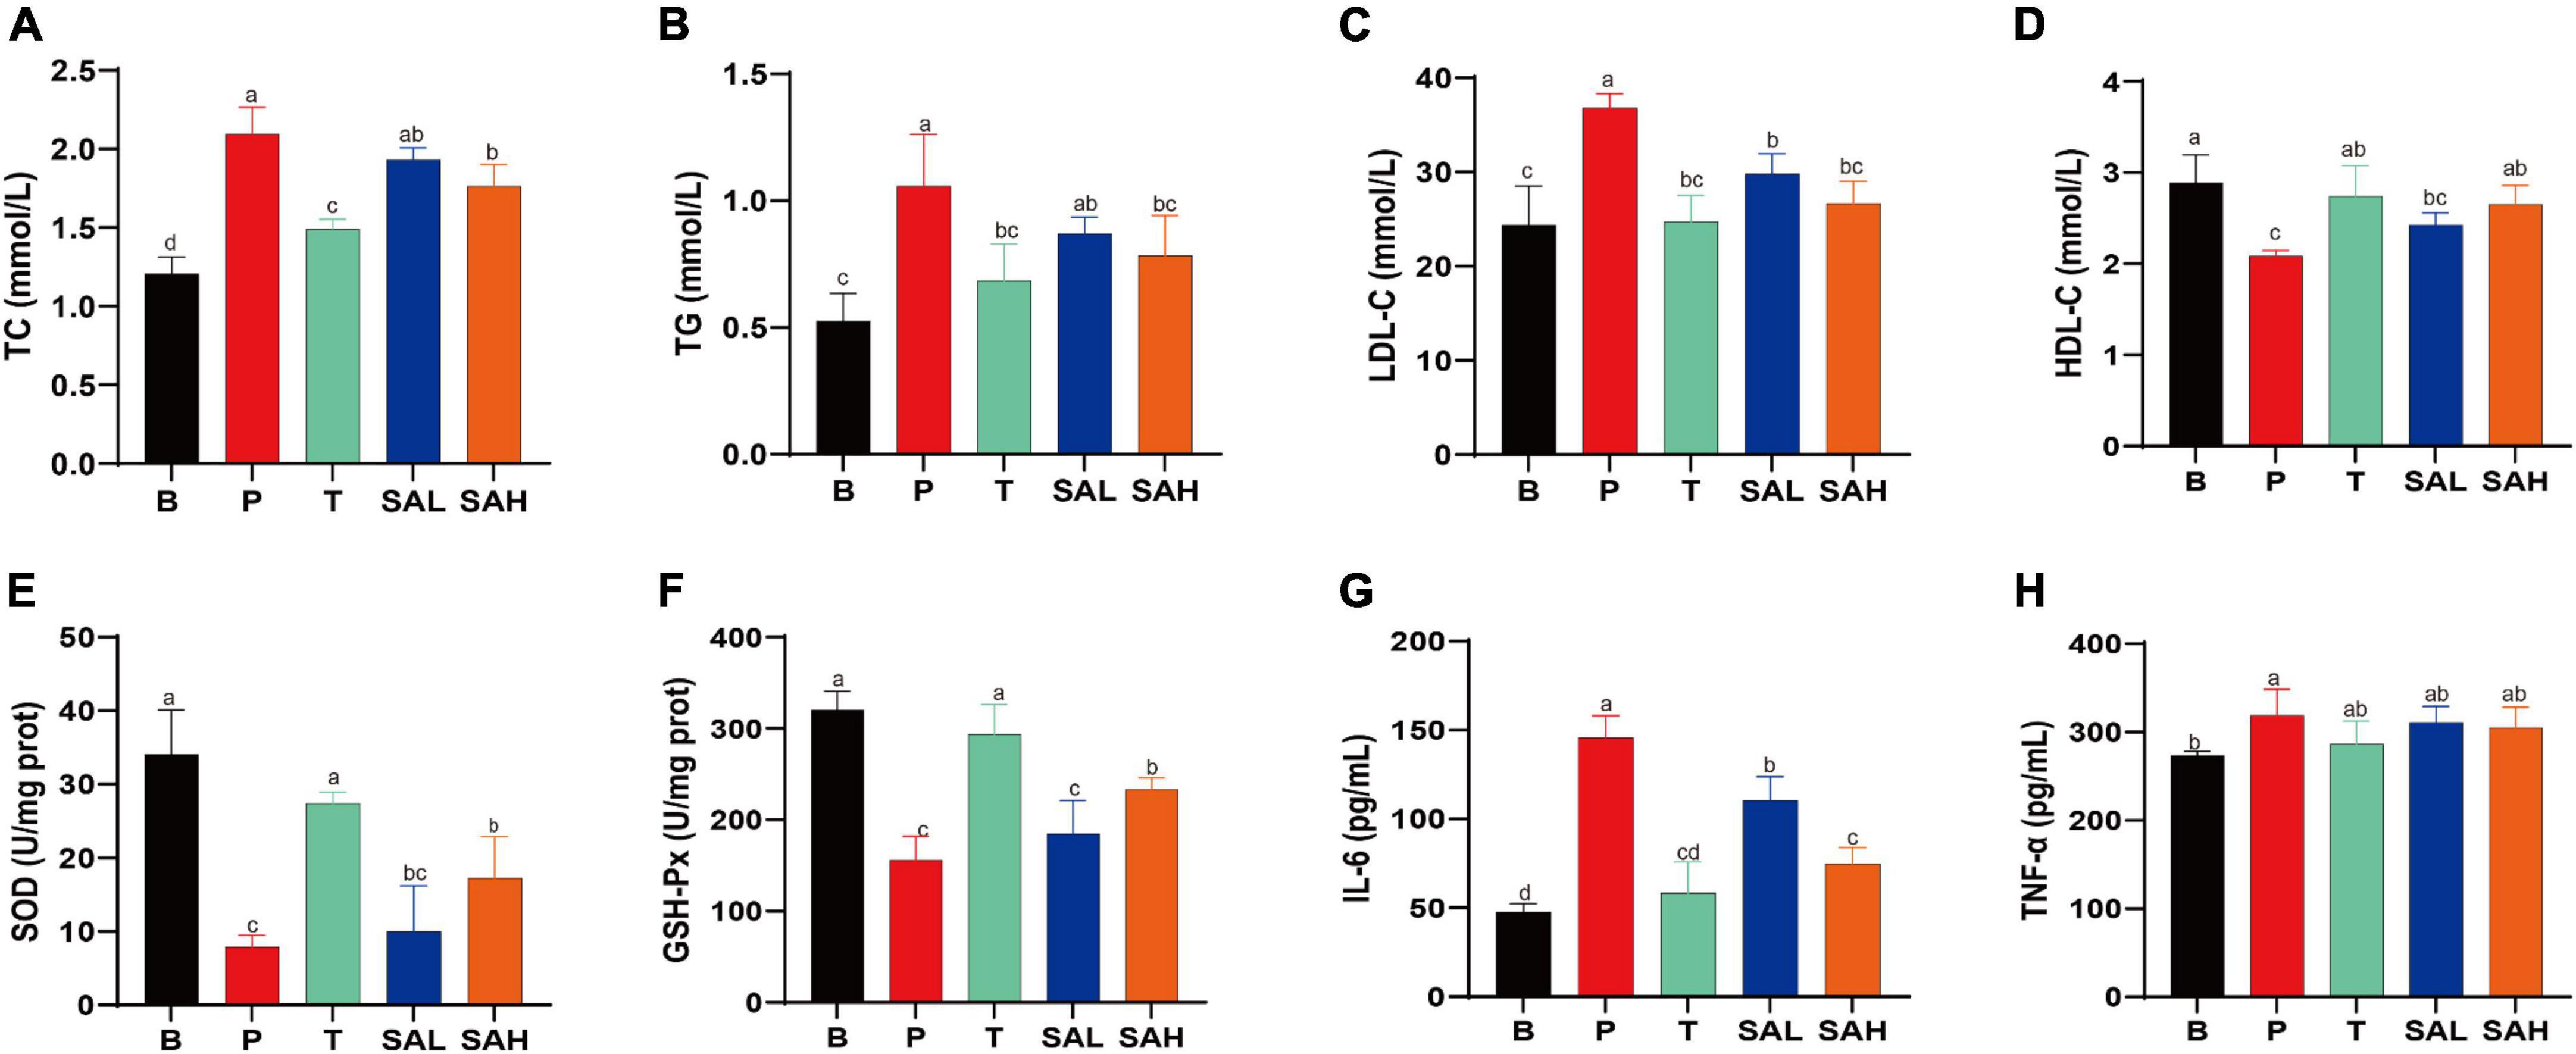
Figure 2. Sciadonic acid (SA) regulated the serum metabolic parameters in type 2 diabetes mellitus (T2DM) mice. (A) TC, (B) TG, (C) LDL-C, (D) HDL-C, (E) SOD, (F) GSH-Px, (G) IL-6, and (H) TNF-a. Data are presented as the mean ± SD of three experiments. Different letters represent a significant difference among multiple groups (P < 0.05). B, control group; P, diabetic model group; T, (HFD + 200 mg kg– 1 Met); SAL, (HFD + 70 mg kg– 1 SA); SAH, (HFD + 280 mg kg– 1 SA).
Studies have shown that T2DM is often associated with metabolic-associated fatty liver disease (MAFLD) and cardiovascular disease (17). Hepatic glycogen levels were significantly lower (P < 0.05), while AST and ALT activities were significantly increased (P < 0.05) in mice in the P group compared with those in the B group. This indicated that liver function was impaired in T2DM mice, weakening the glucose conversion capacity. However, AST and ALT activities were significantly reduced in the serum of SAL and SAH mice (P < 0.05), and liver glycogen levels were significantly increased after 4 weeks of SA administration (Figures 3A–C). To further evaluate the effect of SA on liver tissue integrity in T2DM mice, H&E staining was used. H&E staining of the liver tissue is shown in Figure 3D. The hepatocytes in group B mice were structurally normal, neatly arranged, and with obvious nuclei and nucleoli, whereas the hepatocytes of mice in group P were disordered, increased in size, and contained fat vesicles. Moreover, the mice in group P had erythrocytes in the lumen and a small number of inflammatory cells infiltrated around the veins. Compared with T2DM mice, Met and SA improved the above pathology, reduced the number of vacuoles in hepatocytes, and the hepatocytes more closely resembled those of healthy mice. In summary, SA may restore liver tissue injury and improve liver function to promote glycogen synthesis.
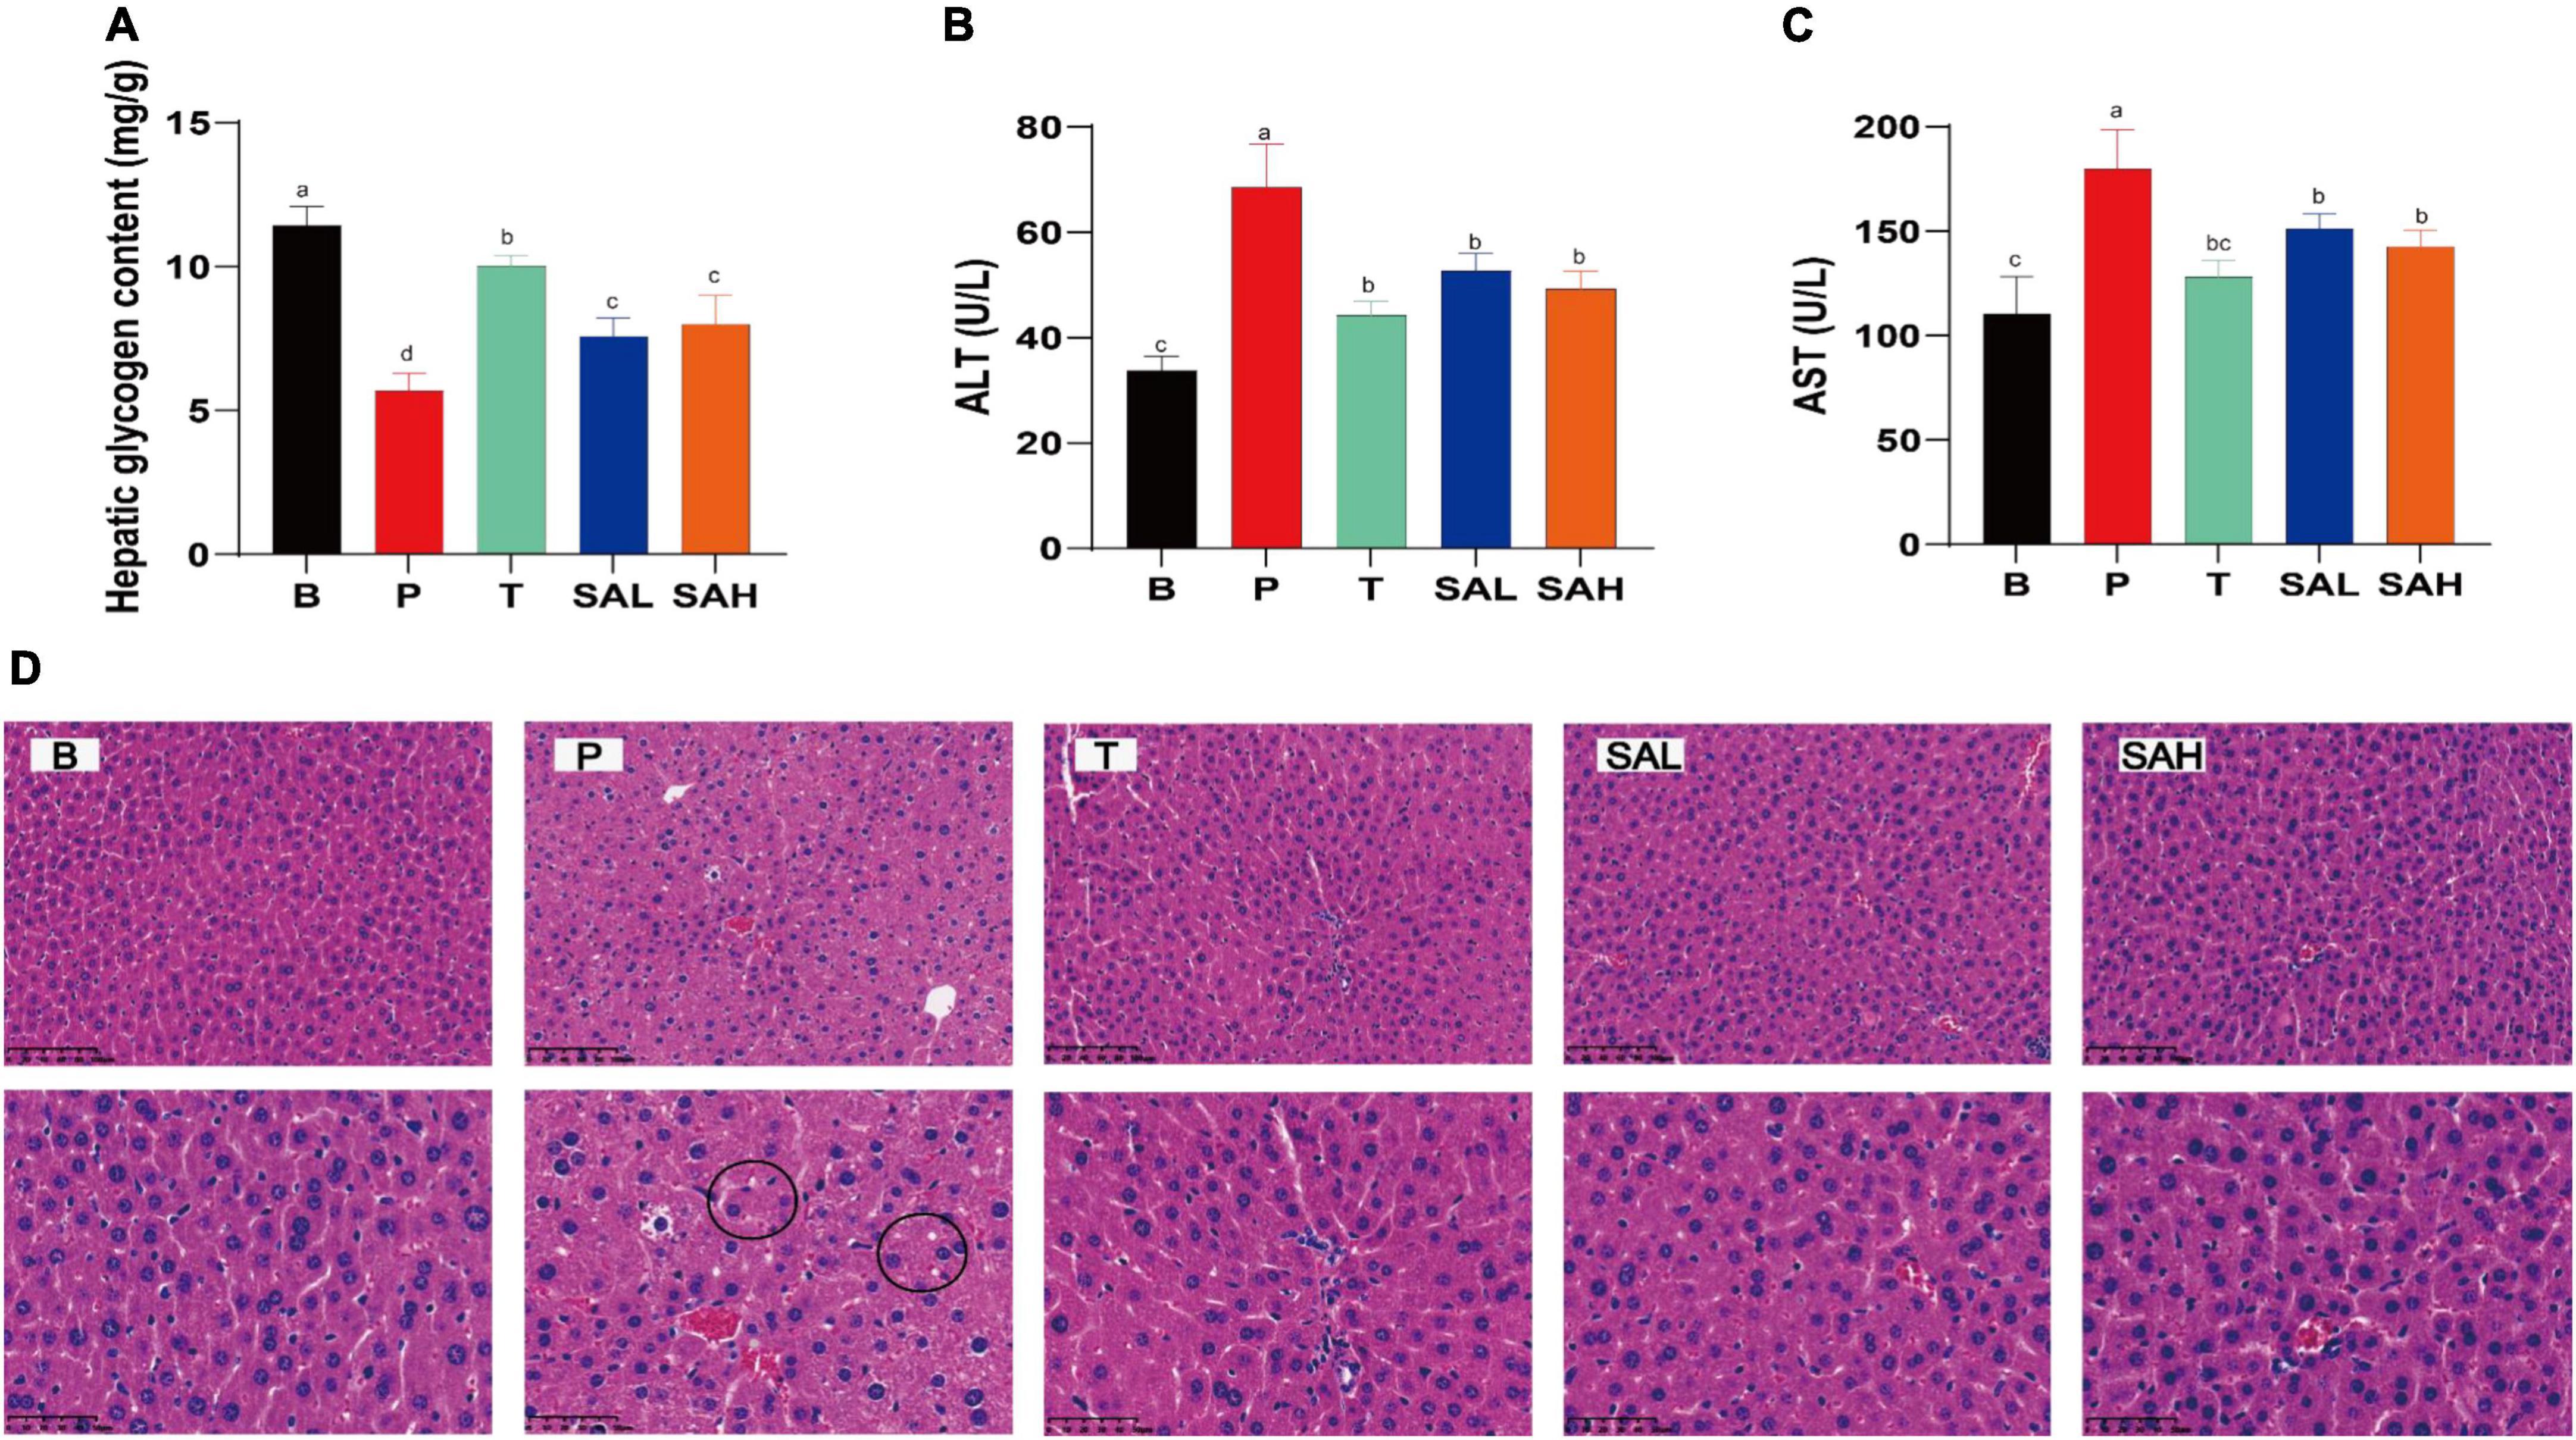
Figure 3. Sciadonic acid (SA) ameliorates hepatic impairment in type 2 diabetes mellitus (T2DM) mice. (A) Hepatic glycogen content, (B) ALT, (C) AST, and (D) H&E stain. Data are presented as the mean ± SD of three experiments. Different letters represent a significant difference among multiple groups (P < 0.05). B, control group; P, diabetic model group; T, (HFD + 200 mg kg– 1 Met); SAL, (HFD + 70 mg kg– 1 SA); SAH, (HFD + 280 mg kg– 1 SA).
In the present study, the mRNA expression levels of IRS-2, PI3K, AKT, GLUT-2, GSK3β, and PPAR-γ were determined using real-time quantitative PCR (Figure 4). The expression of IRS-2, PI3K, AKT, GLUT-2, and PPAR-γ was significantly decreased (P < 0.05), whereas the expression of GSK3β was significantly increased in the P group compared to the B group. After 4 weeks of SA treatment, the levels of IRS-2, PI3K, AKT, GLUT-2, and PPAR-γ were significantly increased, while the relative expression of GSK3β was decreased. These data suggested that SA could exert hypoglycemic effects by activating glucose metabolism signaling genes, such as PI3K/AKT/GLUT-2.
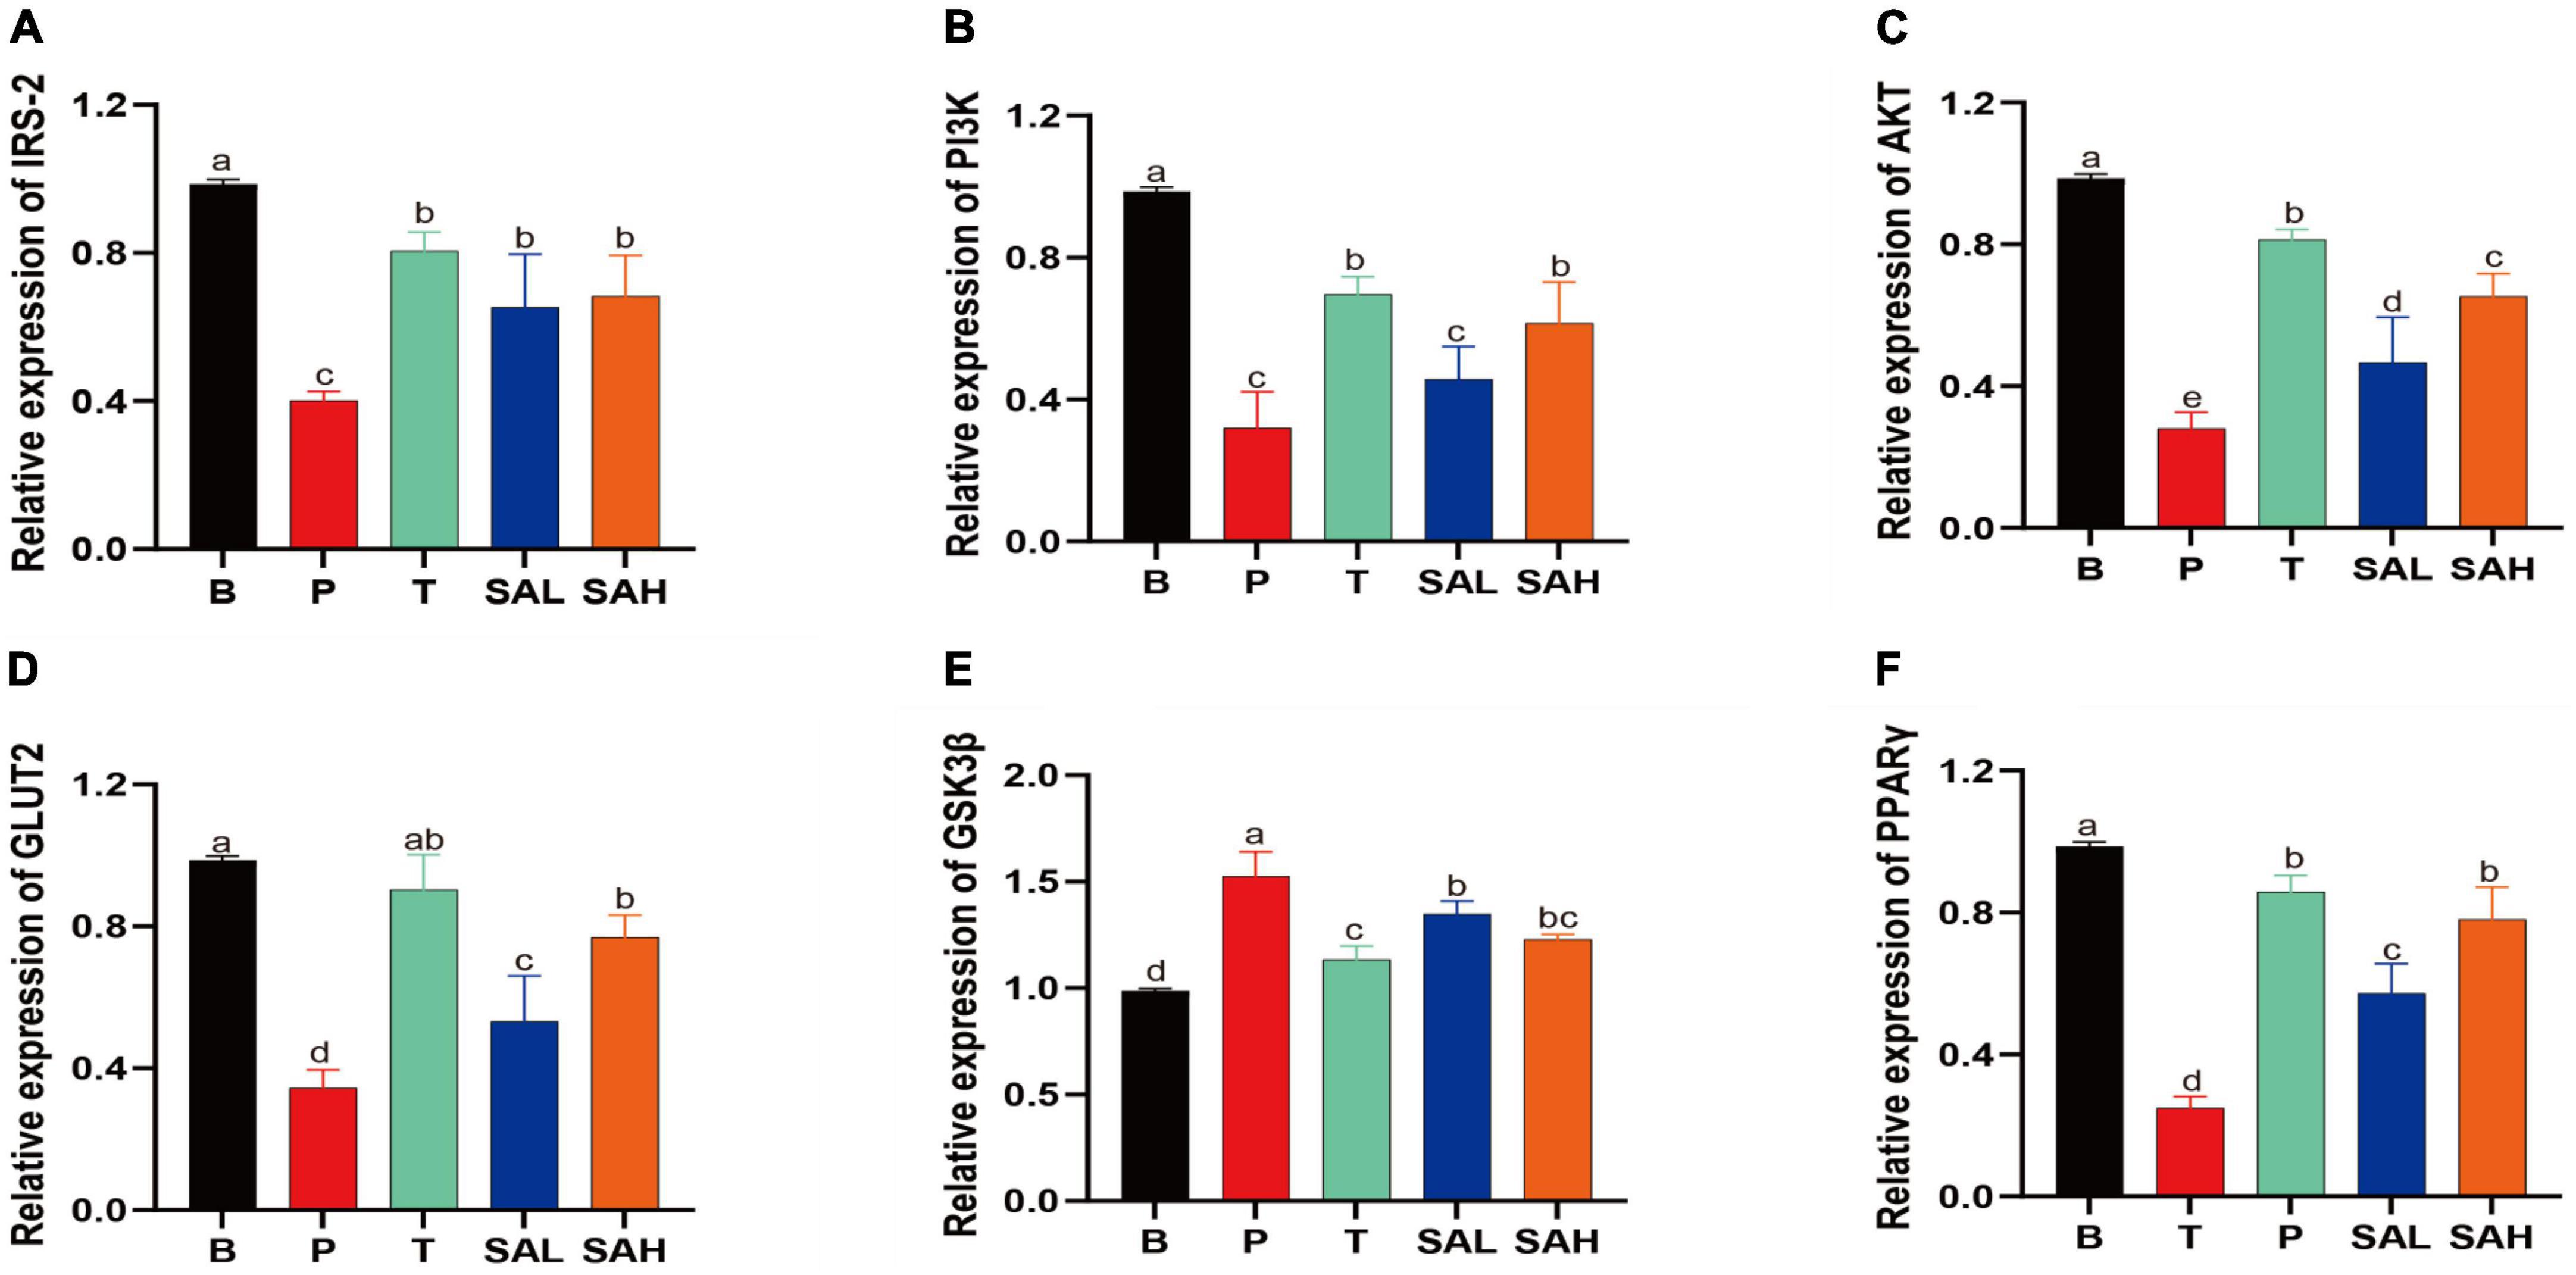
Figure 4. Sciadonic acid (SA) promotes gluconeogenic gene expression. Data are presented as the mean ± SD of three experiments. (A) IRS-2, (B) PI3K, (C) AKT, (D) GLUT-2, (E) GSK3ß, and (F) PPARγ. Data are presented as the mean ± SD of three experiments. Different letters represent a significant difference among multiple groups (P < 0.05). B, control group; P, diabetic model group; T, (HFD + 200 mg kg– 1 Met); SAL, (HFD + 70 mg kg– 1 SA); SAH, (HFD + 280 mg kg– 1 SA).
Phosphorylation is a critical pathway for the activation of insulin-signaling proteins. The expression of p-PI3K/PI3K, p-AKT/AKT, and GLUT-2 proteins was significantly decreased (P < 0.05) in the P group compared to the B group as determined with western blotting (Figure 5). p-PI3K/PI3K expression was significantly increased in the SAL group compared with the P group (P < 0.05). In addition to p-PI3K, the expression of p-AKT/AKT and GLUT-2 was also increased in the SAL group, although not significantly. Moreover, a high dose of SA was more effective in activating the expression of p-PI3K/PI3K, p-AKT/AKT, and GLUT-2 in T2DM mice (P < 0.05).
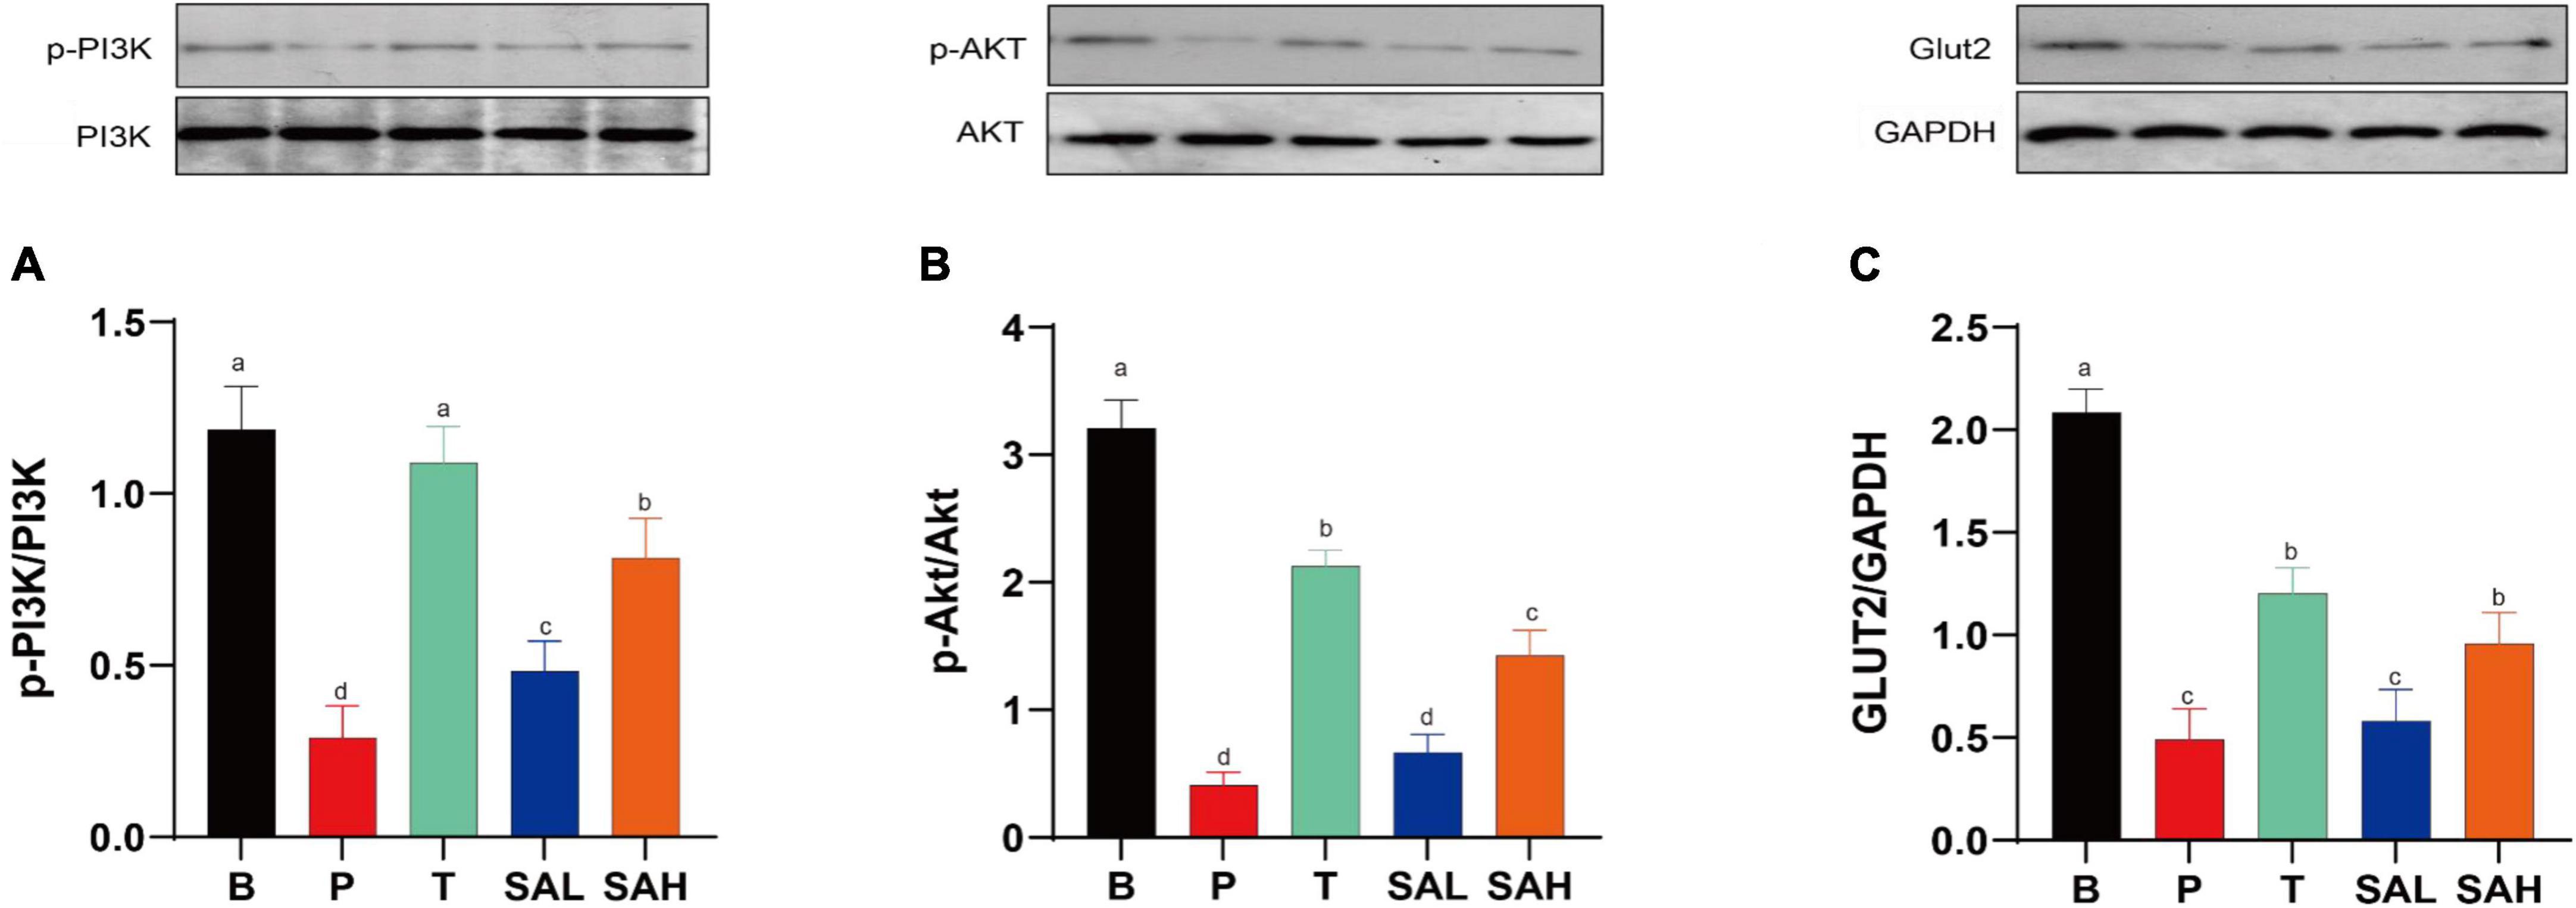
Figure 5. Sciadonic acid (SA) improved type 2 diabetes mellitus (T2DM) by activating the hepatic PI3K/AKT/GLUT-2 signaling pathway. (A) p-PI3K/PI3K, (B) p-AKT/AKT, and (C) GLUT-2/GAPDH. Data are presented as the mean ± SD of three experiments. Different letters represent a significant difference among multiple groups (P < 0.05). B, control group; P, diabetic model group; T, (HFD + 200 mg kg– 1 Met); SAL, (HFD + 70 mg kg– 1 SA); SAH, (HFD + 280 mg kg– 1 SA).
Fatty acids have been reported to improve insulin resistance and to play an important role in glucose/insulin metabolism (18). To further investigate whether the anti-diabetic effect of SA was related to the intestinal microbiota, we analyzed the microbiota in the cecum of the mice in each group. Valid sequences were clustered into operational taxonomic units (OTUs) based on 97% similarity. A total of 907,992 valid sequences from 24 samples (n = 6) with 820 different OTUs were obtained. The results of rank-abundance, pan/core, Shannon, and Simpson rarefaction curves (Supplementary Figure 1) indicated that the number of sequencing samples was sufficient. Compared with the P group, the Shannon, Chao1, and Ace indices increased significantly, and the Simpson index decreased significantly in the SAH group, indicating that SA could increase the richness and diversity of the microbial community (Figures 6A–D). A Venn diagram (Figure 6E) revealed 732, 681, 696, and 746 OTUs for the B, P, T, and SAH groups, respectively. The number of reciprocal OTUs for all samples was 551, with a total of 615 for the B and P groups and 667 for the B and SAH groups. Notably, the number of OTUs specific to the B and P groups was 21 and that for the B and SAH groups was eight. β-Diversity analysis, including non-metric multidimensional scaling analysis (NMDS) and principal coordinate analysis (PCoA), indicated that the structural composition of the microbial community was completely separated between the P and B groups and suggested that the structure of the HFD/STZ-induced intestinal flora in T2DM mice had been disrupted. However, SA could restore the intestinal flora closer to the normal group (Figures 6F, G).
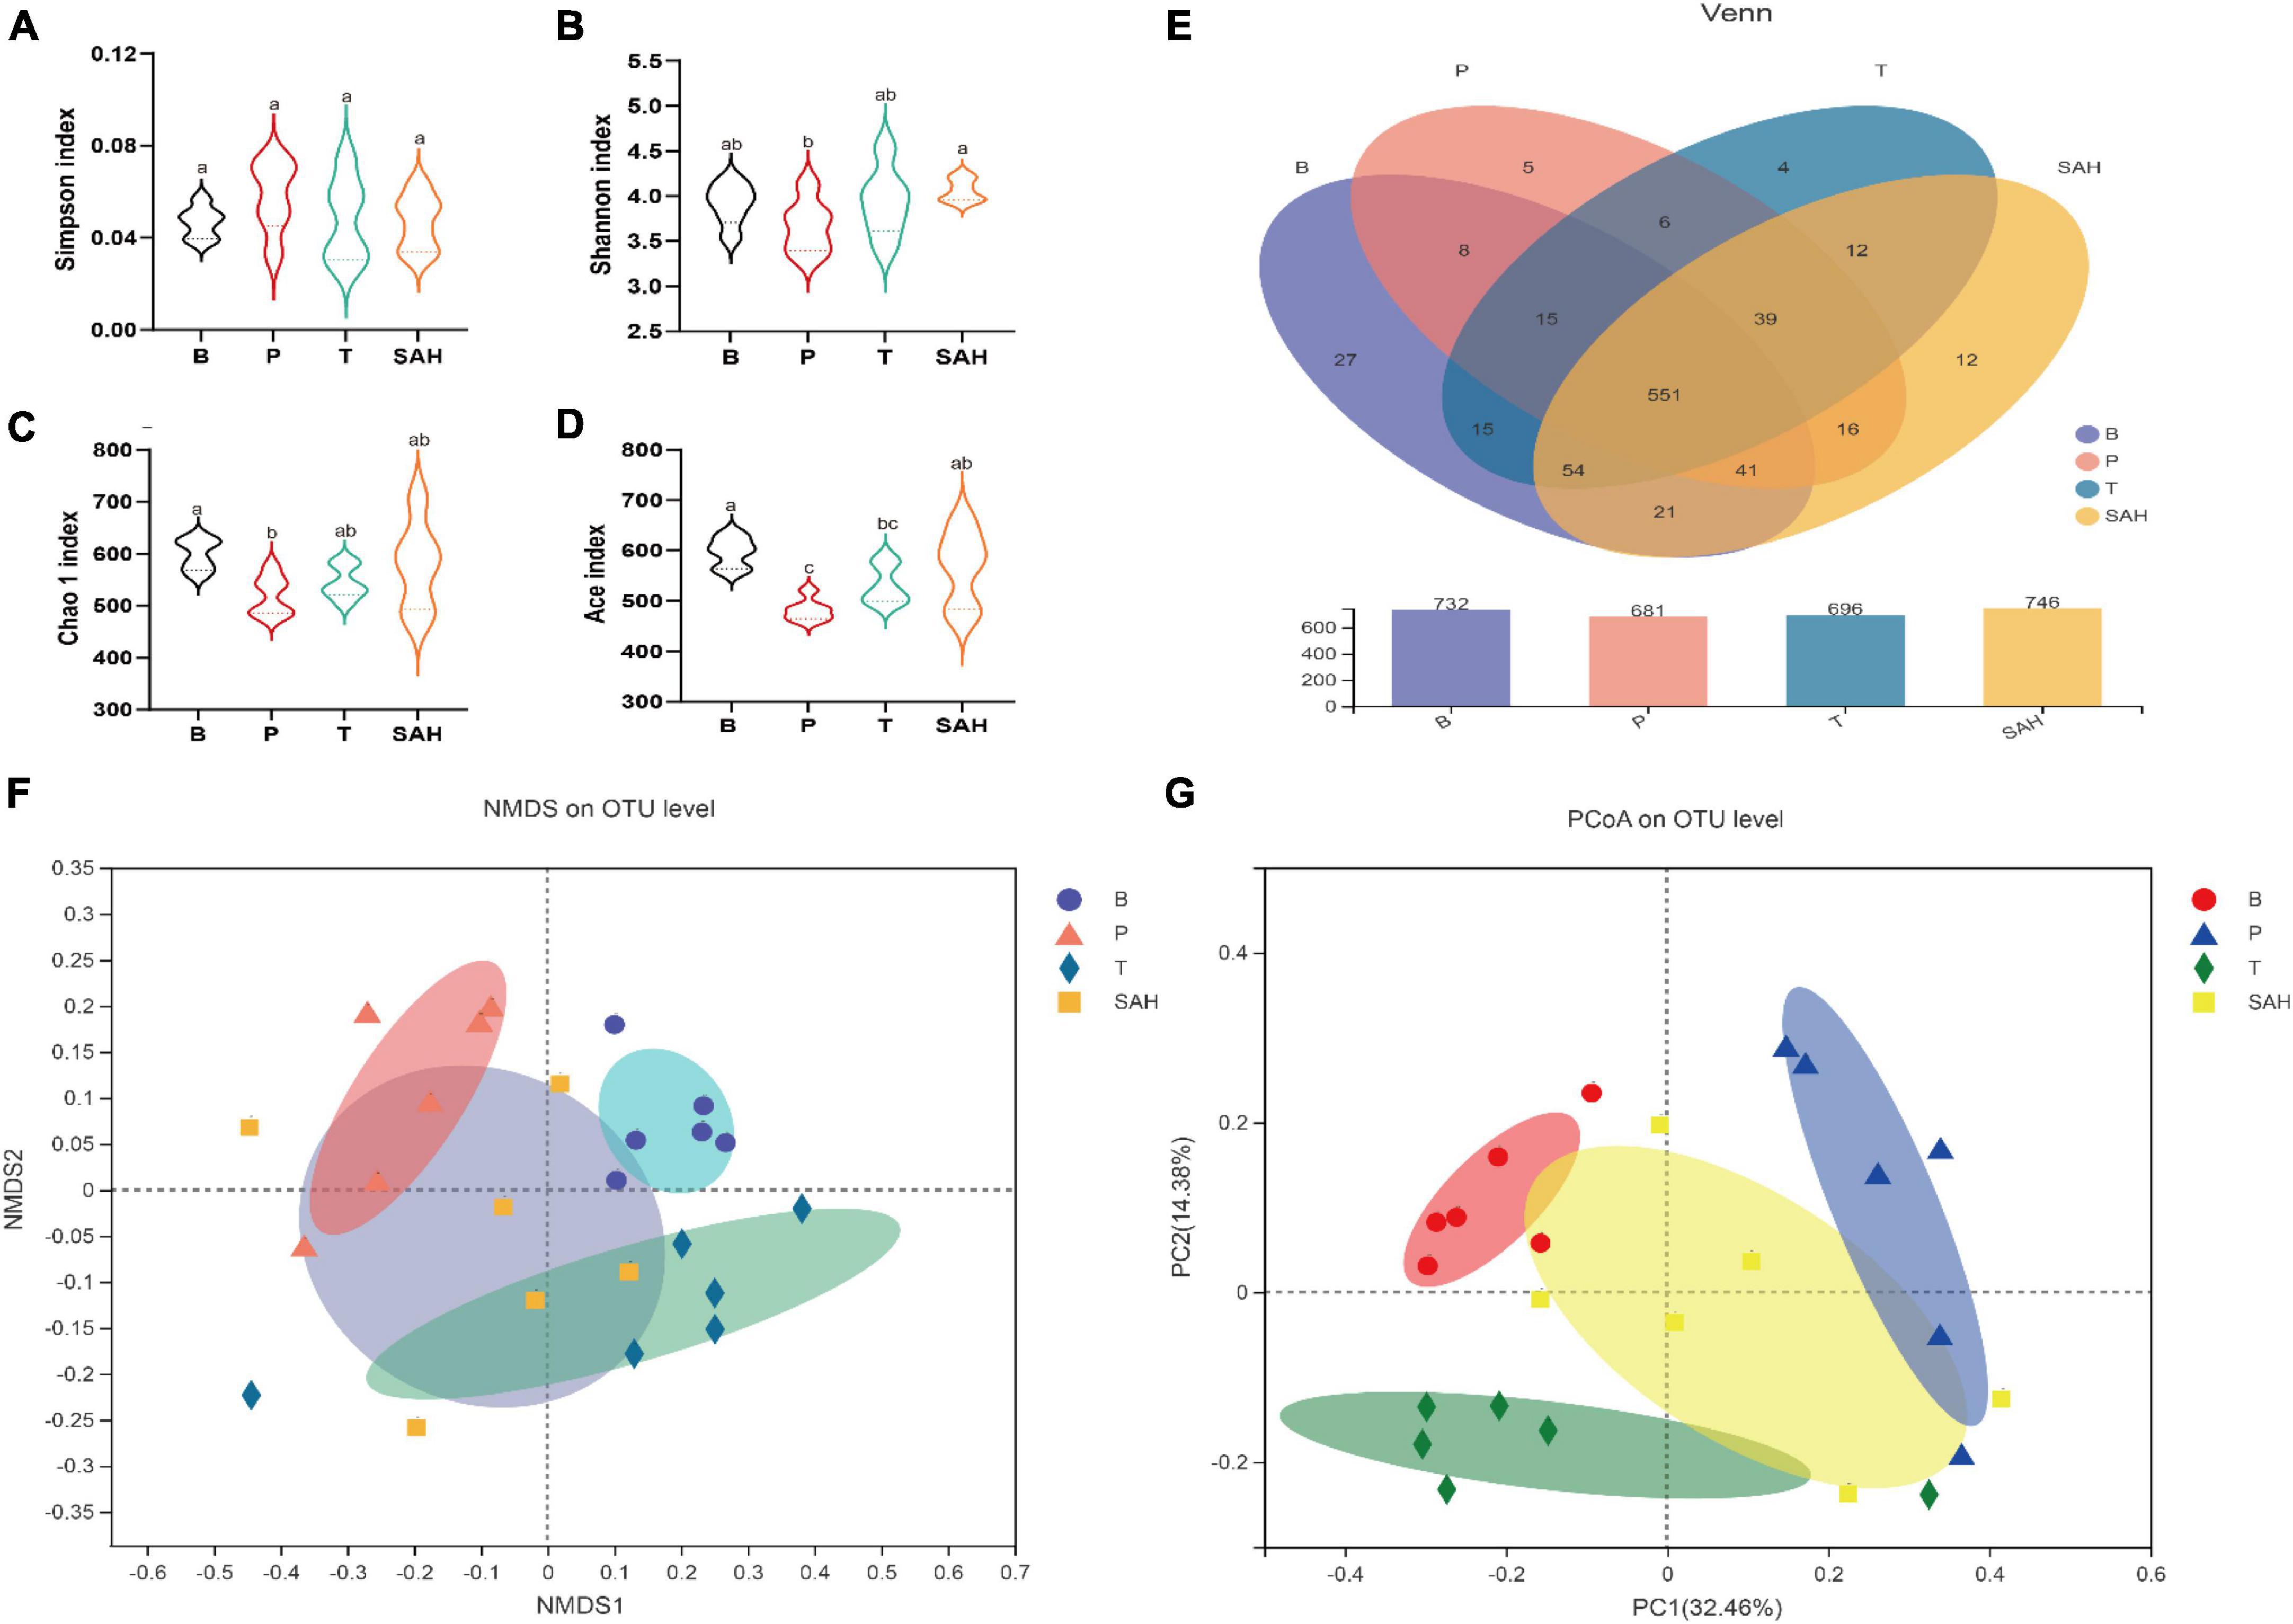
Figure 6. Sciadonic acid (SA) relieved gut microbiota disturbances caused by type 2 diabetes mellitus (T2DM). (A) Simpson index, (B) Shannon imdex, (C) Chao 1 index, (D) ace index, (E) venn diagram, (F) NMDS, and (G) PCoA analysis diagram. Data were presented as the mean ± SD (n = 6). Different letters represent a significant difference among multiple groups (P < 0.05). B, control group; P, diabetic model group; T, (HFD + 200 mg kg– 1 Met); SAH, (HFD + 280 mg kg– 1 SA).
To further assess the effect of SA on the intestinal flora, we analyzed the intestinal microbiota composition of each group at the phylum and genus levels. Bacteroidetes and Firmicutes were the main dominant phyla, accounting for more than 75% of the total microbiota. Compared to group B, the relative abundance of Firmicutes and Verrucomicrobiota in group P decreased by 7.67 and 68.20%, respectively, while the relative abundance of Bacteroidota and Desulfobacterota increased by 8.09 and 74.33%, respectively. The relative abundance of Firmicutes/Bacteroidota was 1.73. Compared to the P group, the Met intervention significantly increased the relative abundance of Firmicutes and Bacteroidota but decreased the relative abundance of Desulfobacterota and Verrucomicrobiota. After 4 weeks of SA gavage, the relative abundance of Firmicutes, Bacteroidota (F/B = 1.32), and Verrucomicrobiota increased by 4.11, 36.17, and 65.56%, respectively, while the relative abundance of Desulfobacterota and Actinobacteriota decreased by 71.59 and 59.03%, respectively (Figure 7A).
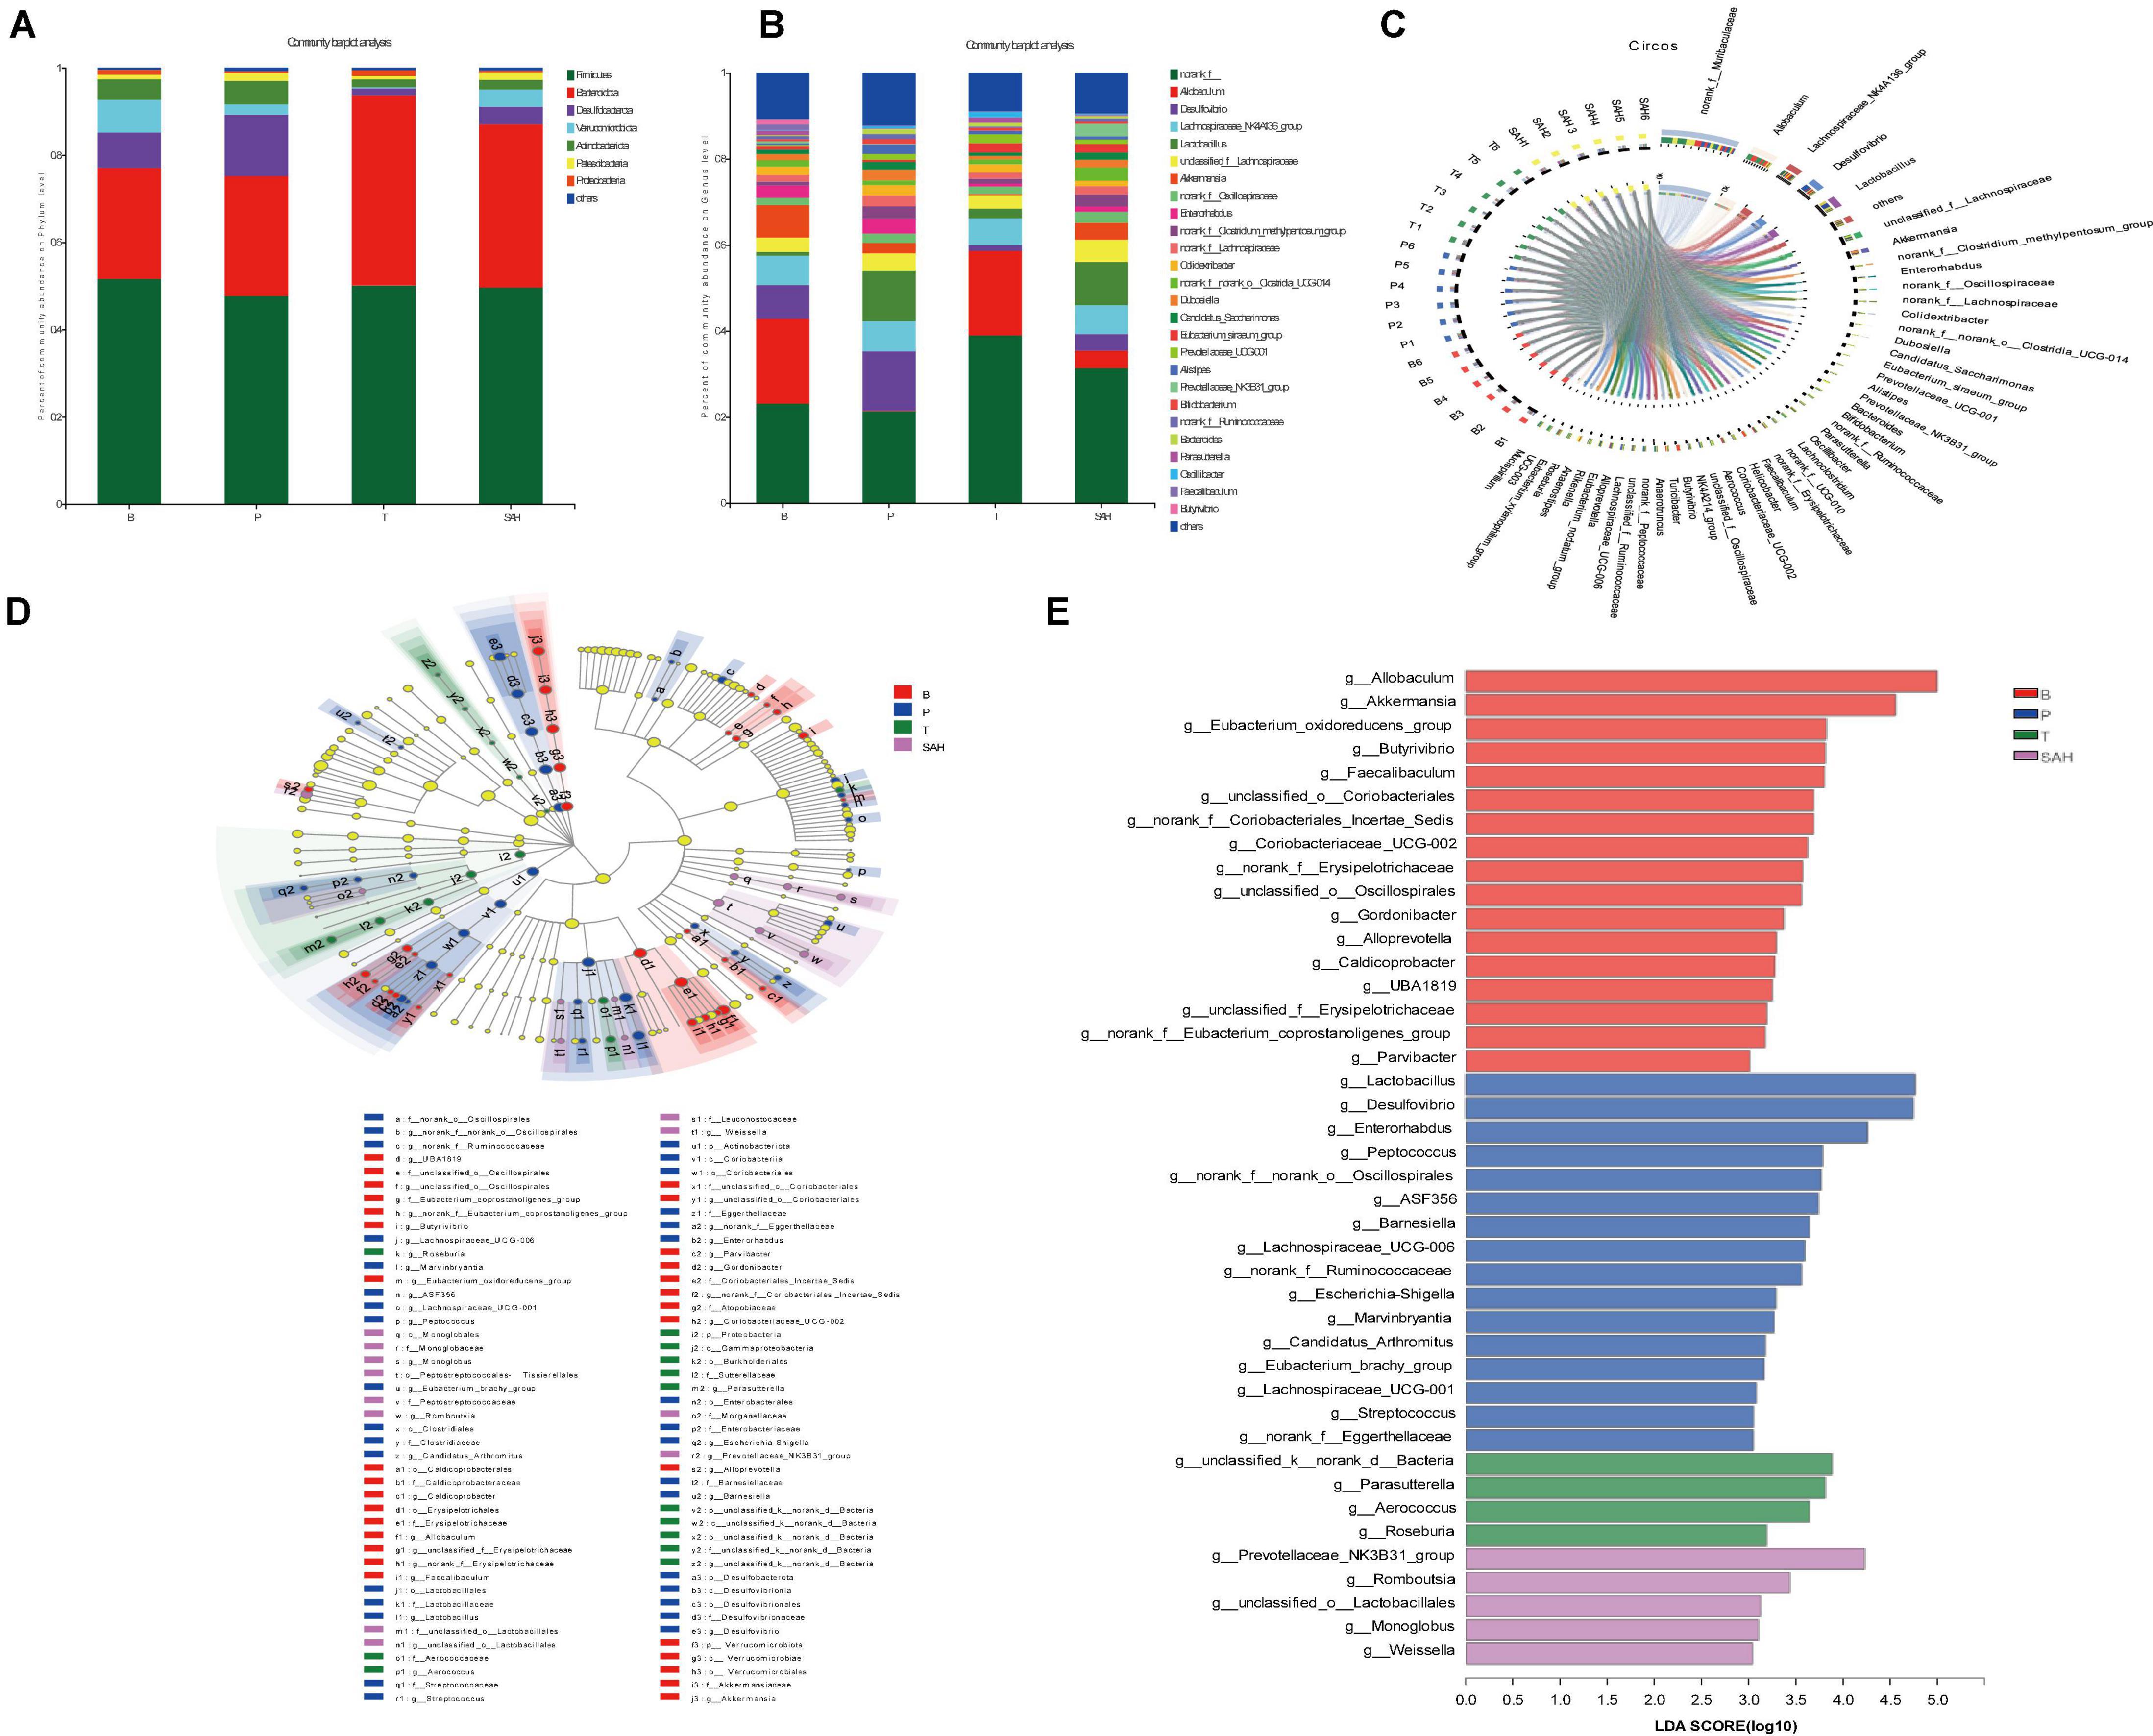
Figure 7. Sciadonic acid (SA) regulated intestinal flora composition in type 2 diabetes mellitus (T2DM) mice. (A) Percent community abundance diagram on phylum level, (B) percent community abundance diagram on genus level, (C) in Circo’s graphs, the left semicircle represents the genera composition, and the right semicircle indicated the distribution of each genus in the experimental groups, (D) lEfSe multi-level classification tree diagram, and (E) LDA discriminant histogram. Data were presented as the mean ± SD (n = 6). B, control group; P, diabetic model group; T, (HFD + 200 mg kg– 1 Met); SAH, (HFD + 280 mg kg– 1 SA).
To further investigate the differences in intestinal microbiota between the B, P, T, and SAH groups, the abundance of 26 groups at the genus level was analyzed (Figure 7B). Norank_f__Muribaculaceae, Allobaculum, the Lachnospiraceae_NK4A136_group, Desulfovibrio, and Lact obacillus were the most dominant genera in all groups (Figure 7C). The linear discriminant analysis effect size (LEfSe) (Figure 7D) and linear discriminant analysis (LDA) (Figure 7E) were used to analyze the differentially abundant taxa in the different groups. The microbial communities in groups B and SAH belonged mainly to Firmicutes and Bacteroidetes, but with different genus types. In particular, the B group mainly showed a significant selective enhancement of Allobaculum, Akkermansia, and the Eubacterium_oxidoreducens_group for the genus, while Lactobacillus, Desulfovibrio, and Enterorhabdus were the most represented bacteria in the T2DM group. The intervention markers of the SAH group were the Prevotellaceae_NK3B31_group and Romboutsia genera. Overall, these results suggested that SA altered the gut microbiome of T2DM mice.
The intestinal flora dysbiosis in T2DM mice was represented by the fact that norank_f__Muribaculaceae, Allobaculum, Akkermansia, norank_f__norank_o__Clostridia_UCG-014, the Eubacterium_siraeum_group, and Prevotellaceae_NK3B31_ group were lower in abundance, while Desulfovibrio, Enterorhabdus, the norank_f__Clostridium_methylpentosum_ group, Dubosiella, Alistipes, and Bacteroides were higher in abundance. Based on the significant alterations in intestinal flora caused by T2DM, we found that all nine genera could be reversed by Met and SA treatment, including significantly increased levels of norank_f__Muribaculaceae, Allobaculum, and the Eubacterium_siraeum_group, as well as significantly decreased levels of Desulfovibrio, Enterorhabdus, the norank_f__Clostridium_methylpentosum_group, Dubosiella, Alistipes, and Bacteroides. Besides, the relative abundance of Akkermansia, norank_f__norank_o__Clostridia_UCG-014, and the Prevotellaceae_NK3B31_group increased significantly after SA treatment (Figure 8).
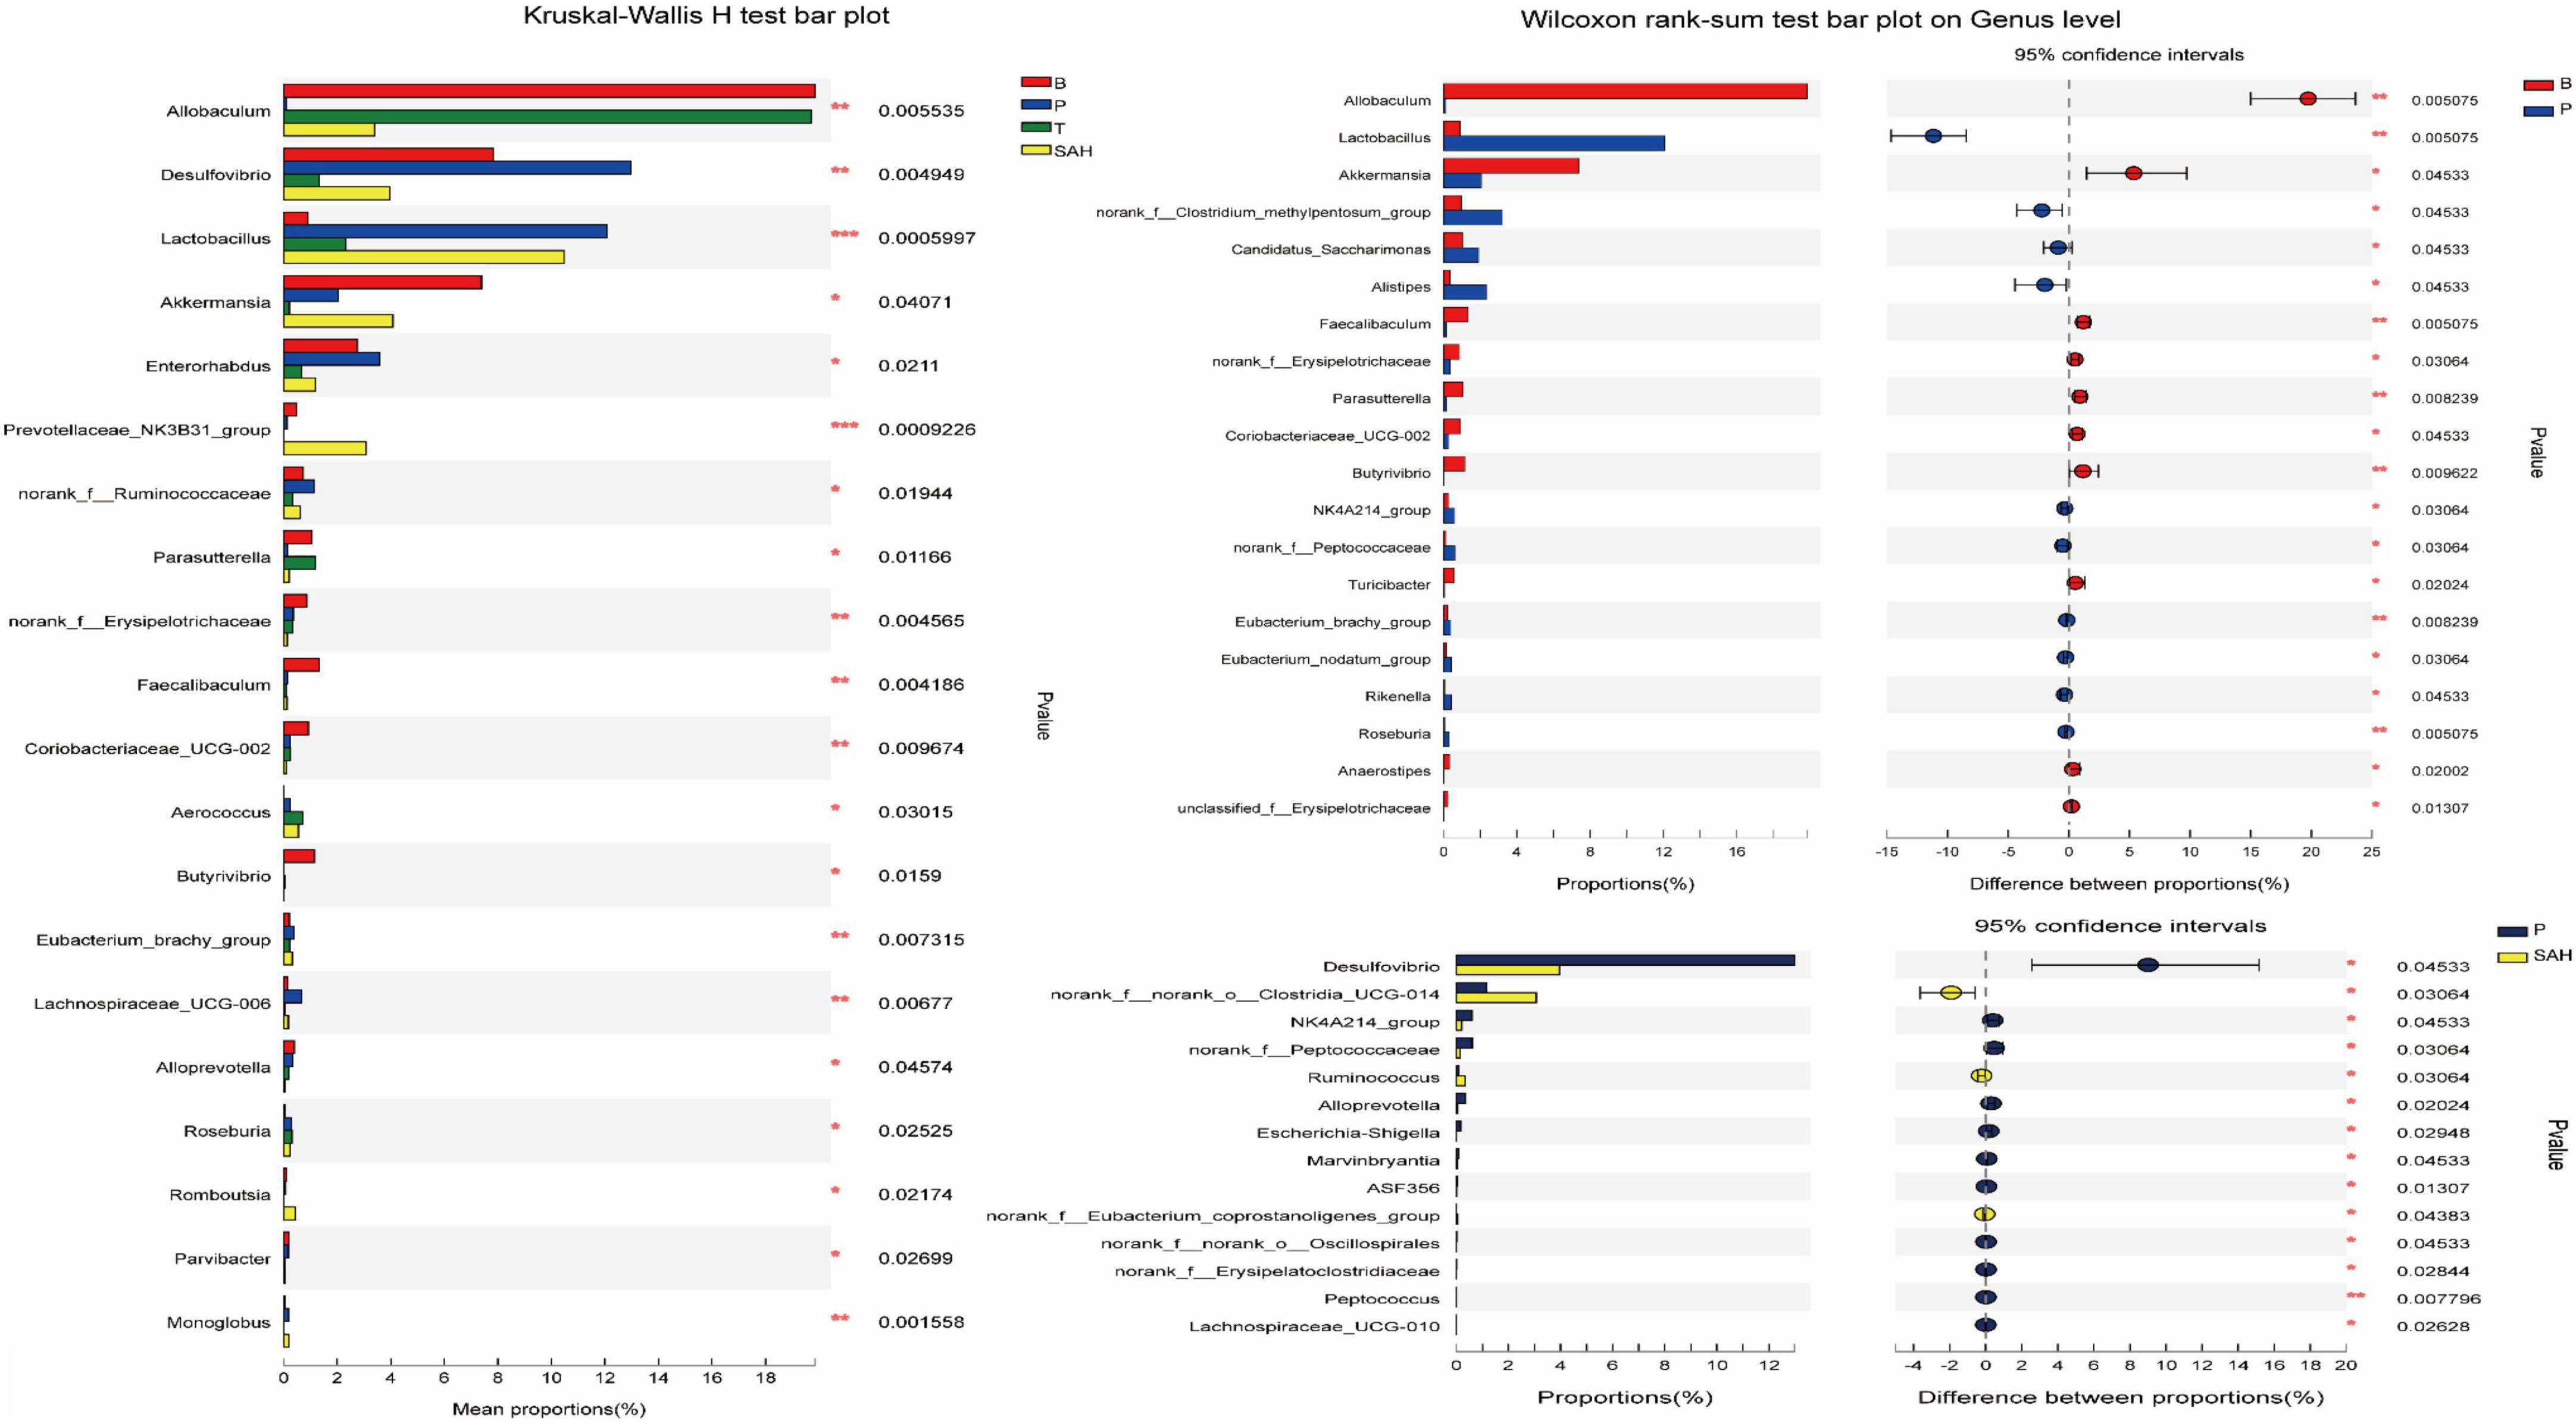
Figure 8. Comparisons between different groups at the genus level. y-axis indicates species name at a given taxonomic level, x-axis indicates mean relative abundance in different groups of species, different colors indicate different groups; rightmost P, *0.01 & P ≤ 0.05, **0.001 & P ≤ 0.01, ***P ≤ 0.001. Data were presented as the mean ± SD (n = 6). B, control group; P, diabetic model group; T, (HFD + 200 mg kg– 1 Met); SAH, (HFD + 280 mg kg– 1 SA).
The concentrations of acetic acid, propionic acid, isobutyric acid, butyric acid, isovaleric acid, and valeric acid are shown in Figure 9A. The levels of primary SCFAs, such as acetic acid, propionic acid, and butyric acid, were significantly lower in group P than in group B (P < 0.05). The levels of acetic acid, propionic acid, butyric acid, and isobutyric acid were significantly higher in the T group than in the P group (P < 0.05). Furthermore, the concentrations of acetic acid and propionic acid were significantly higher in the SAL and SAH groups than in the P group after an SA gavage (P < 0.05), and the concentrations of isobutyric acid, n-butyric acid, isovaleric acid, and n-valeric acid were slightly but not significantly increased.
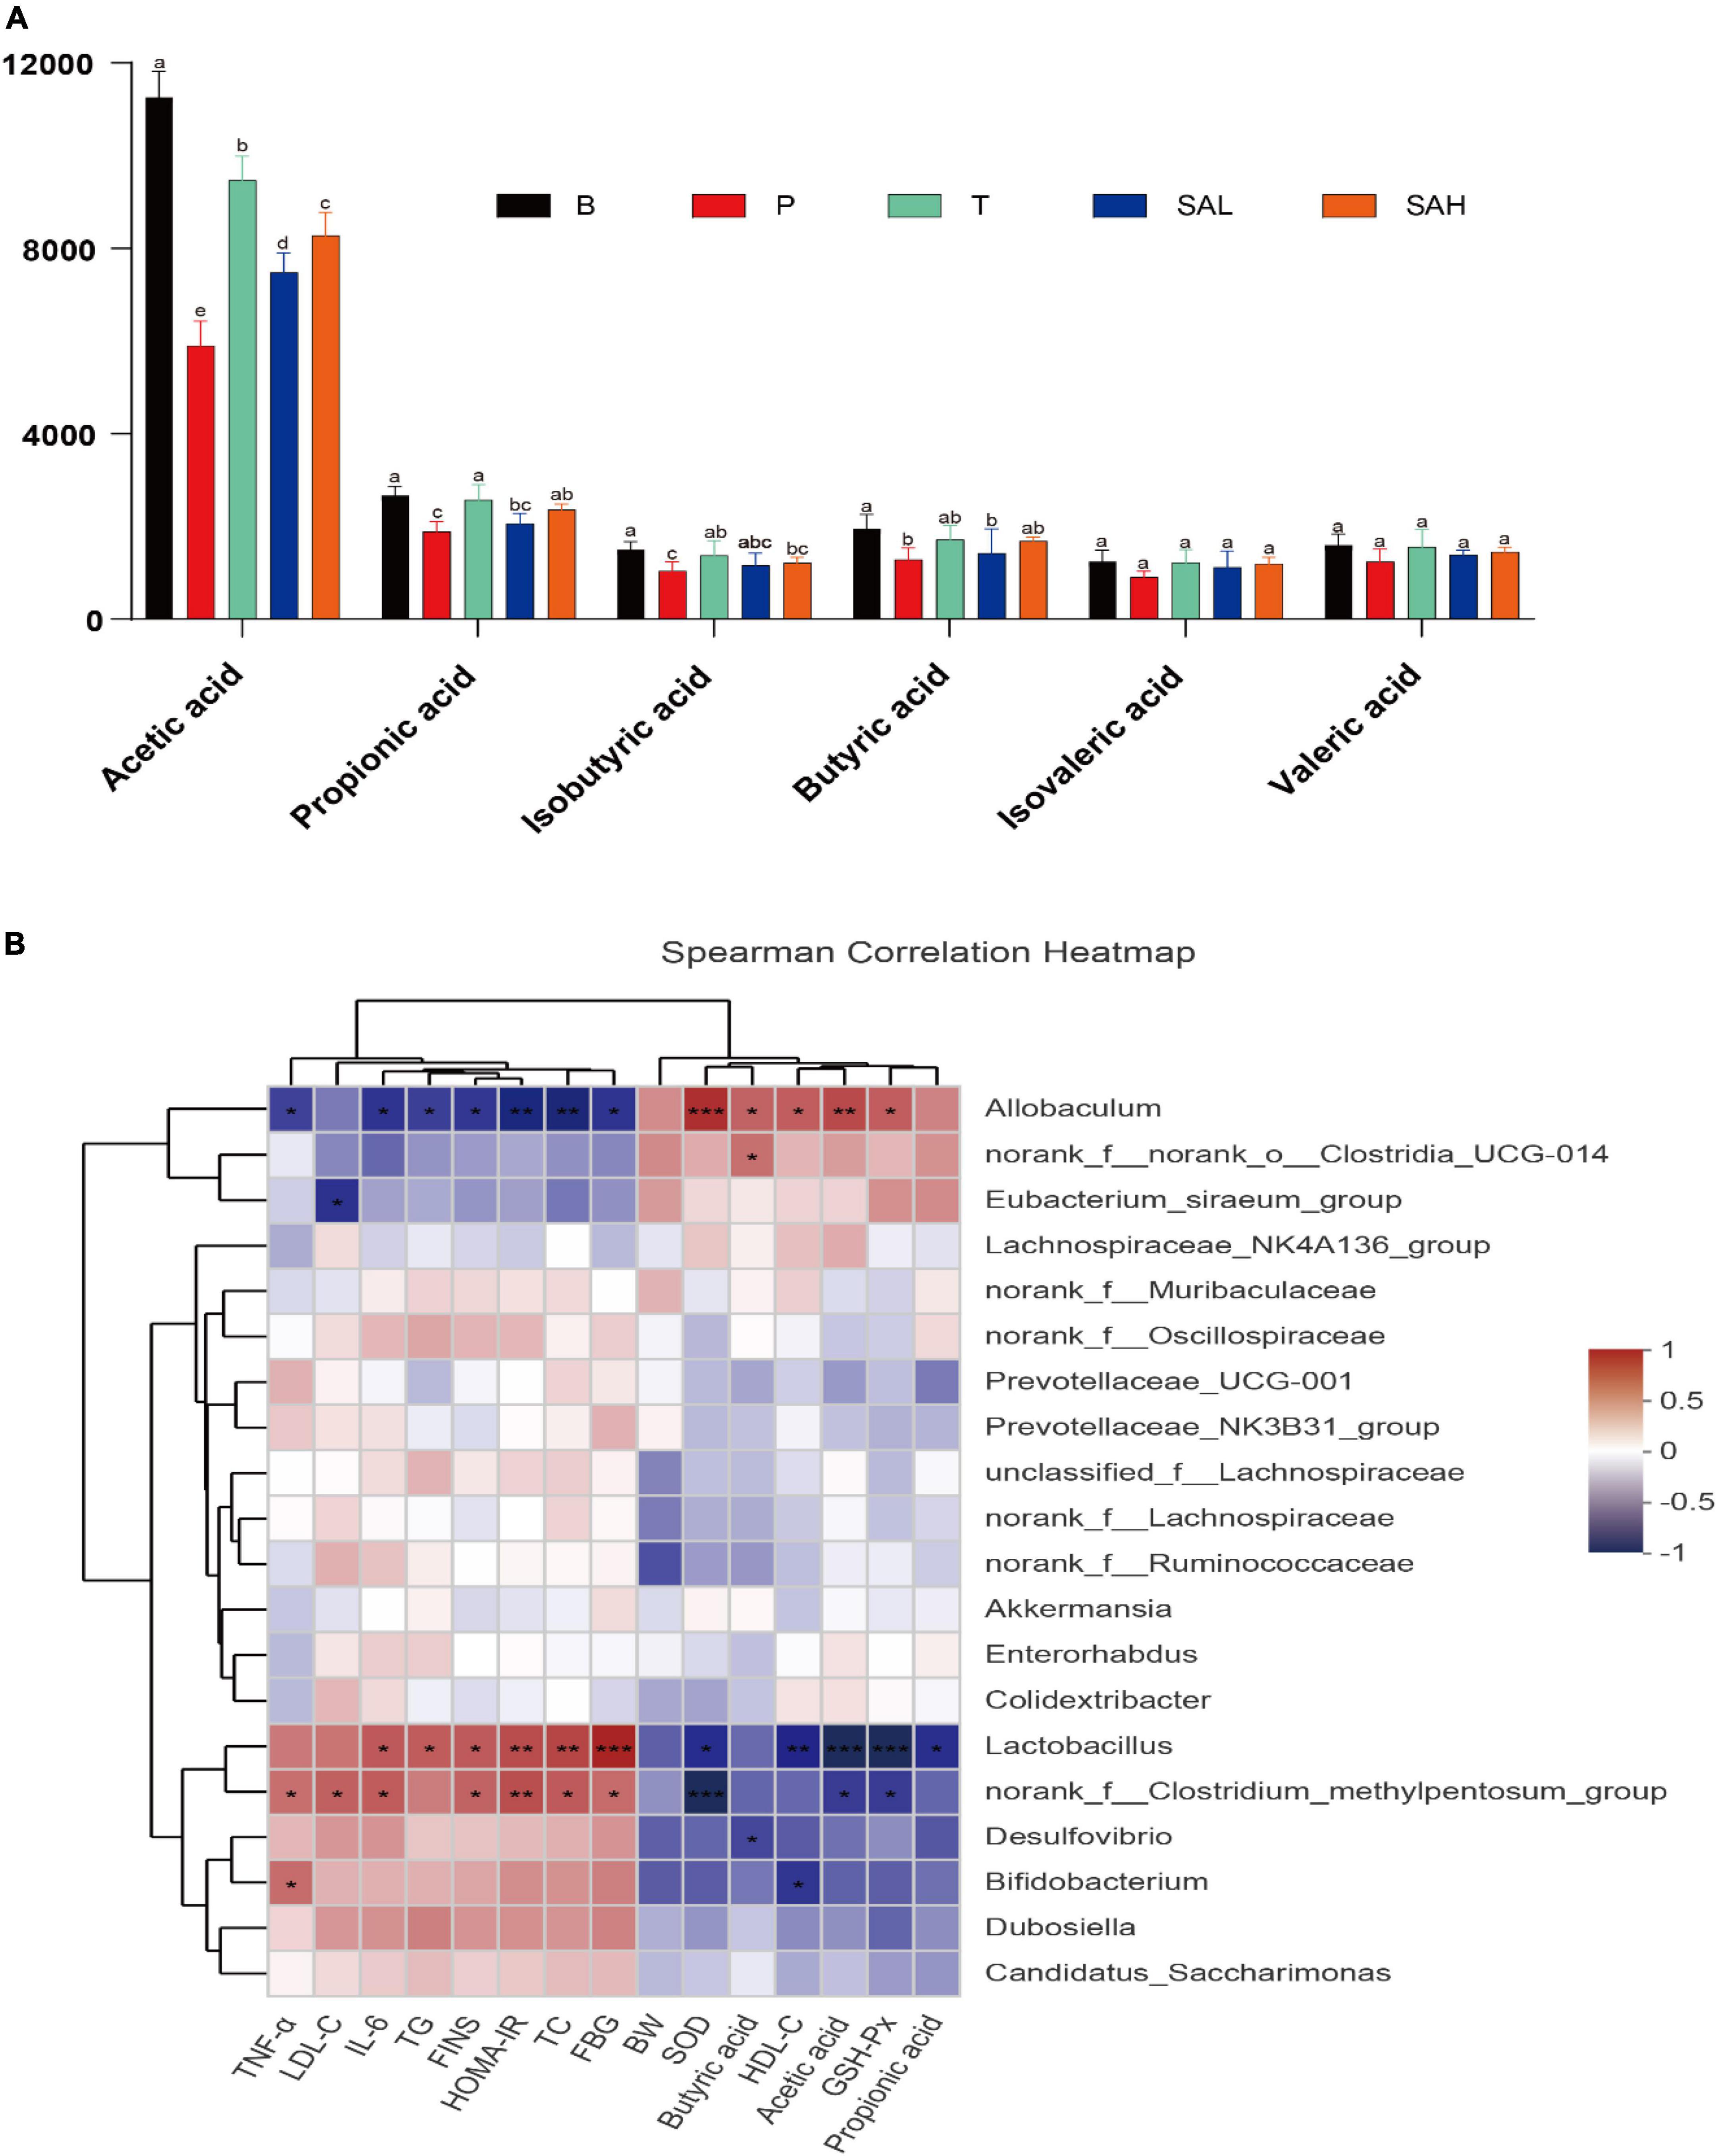
Figure 9. Correlation analysis between biochemical parameters and intestinal microbiota at the genus level. (A) SCFAs, (B) Spearman’s correlation analyses were used to analyze the relative abundance between the specific genus in each group. Data were presented as the mean ± SD (n = 6). Groups with different letters are significantly different (P < 0.05). B, control group; P, diabetic model group; T, (HFD + 200 mg kg– 1 Met); SAL, (HFD + 70 mg kg– 1 TGP); SAH, (HFD + 280 mg kg– 1 TGP).
Correlations between gut microbes and biochemical indicators in the samples were demonstrated by Spearman correlation analysis. As shown in Figure 9B, TNF-α, IL-6, LDL-C, TG, TC, FBG, FINS, and HOMA-IR biochemical indicators were positively correlated with Lactobacillus, the norank_f__Clostridium_methylpentosum_group, Desulfovibrio, Bifidobacterium, Dubosiella, and Candidatus_Saccharimonas, while they were negatively correlated with Allobaculum, norank_f__norank_o__Clostridia_UCG-014, and the Eubacterium_siraeum_ group. In addition, Akkermansia and Colidextribacter were negatively correlated with FINS and HOMA-IR. However, BW, HDL-C, SOD, GSH-Px, butyric acid, acetic acid, and propionic acid were positively correlated with Allobaculum, norank_f__norank_o__Clostridia_UCG-014, and the Eubacterium_siraeum_group, while they were negatively correlated with Lactobacillus, the norank_f__ Clostridium_methylpentosum_group, Desulfovibrio, and Bifidobacterium. These relationships suggest that biochemical indicators, metabolites, and gut microbiota can interact with each other.
T. grandis oil is a highly valuable oil product rich in a variety of unsaturated fatty acids, including oleic acid, linoleic acid, and SA. Previous studies have shown that T. grandis oil has anti-tumor and anti-hyperlipidemic properties (15). However, little has been reported in the literature about the effect of SA on the intestinal flora of patients with T2DM and the possible mechanisms of hypoglycemia. Moreover, further work is needed to obtain information about the interaction between SA and T2DM hosts in order to develop functional foods related to SA. In current study, we have demonstrated that SA improves glucose metabolism disorder via the regulation of PI3K/Akt pathway and intestinal microbiota -mediated glycogen synthesis and glucose metabolism in HFD/STZ-induced T2DM mice.
The results of the current investigation indicated that HFD/STZ-induced T2DM mice lost weight and had markedly elevated liver index, kidney index, and FBG levels, which may be caused by disturbances in lipid and glucose metabolism. The increased lipolysis, elevated levels of free fatty acids, and accumulation of intermediate lipid metabolites increased the glucose output, decreased peripheral glucose utilization, and impaired β-cell function (19). Further, mice in the P group lost 6.67% of their BW compared to that at the beginning of the study, and the trend of weight loss might intensify with the development of diabetes. However, after 4 weeks of gavage, we found that SA effectively inhibited weight loss and FBG elevation (Figures 1A, B) in a dose-dependent manner. This may be due to the fact that SA improved insulin sensitivity and reduced blood glucose levels in T2DM mice. Subsequent OGTT results also supported this notion, with high doses of SA significantly improving glucose tolerance in T2DM mice (Figures 1C, D), lowering blood insulin levels (Figure 1G), ameliorating insulin resistance (Figure 1H), and promoting glucose metabolism. Impaired glucose tolerance is an intermediate state in the transition from normal glucose tolerance to T2DM (20). In our experiments, we observed that the FBG of individual SA-treated T2DM mice was close to that of normal mice and that SA treatment could enhance glucose tolerance.
Hyperlipidemia is one of the characteristics of T2DM, mainly manifesting with significantly increased levels of TC, TG, and LDL-C but decreased levels of HDL-C. Increased levels of TC and TG tend to increase the risk of cardiovascular disease in patients with T2DM (21). SA could significantly reduce TC, TG, and LDL-C levels in the serum of T2DM mice, promote HDL-C production, and improve hyperlipidemia (Figures 2A–D). In addition, recent studies have demonstrated that oxidative stress disrupts cellular structures and manipulates signaling pathways, which are believed to be a key mechanism of insulin resistance (22). In the present study, SA significantly increased the of SOD levels and GSH-Px in the serum of T2DM mice and enhanced the antioxidant capacity (Figures 2E, F). Meanwhile, SA reduced IL-6 and TNF-α levels and attenuated the inflammatory response. It has been reported that IL-6 and TNF-α inhibit insulin receptor signaling in the liver of T2DM mice, thus reducing insulin sensitivity and impeding glucose uptake and utilization (23).
The results of H&E staining analysis showed that the liver tissues of T2DM mice were damaged, and the markers of liver function impairment (ALT and AST) were significantly increased, whereas the liver glycogen content was significantly decreased. This could be due to the oxidative stress and inflammatory response that impair liver function in T2DM mice, resulting in reduced hepatic glycogen synthesis and inability to properly take in and utilize glucose (Figure 3). Furthermore, the PI3K/Akt pathway is strongly associated with insulin resistance signaling, and changes in its expression have an important role in regulating glucose metabolism (24). RT-PCR and western blot analysis revealed that SA supplementation promoted the expression of IRS-2, PI3K, AKT, GLUT2, and PPARγ glucose metabolism-related genes in liver tissue, and inhibited GSK3β gene expression (Figure 4). In addition, SA supplementation activated the PI3K/Akt signaling pathway and significantly up-regulated the protein expression of p-PI3K/PI3K, p-AKT/AKT, and GLUT2 in the liver of hyperglycemic mice, thereby ameliorating hepatic metabolic disorders (Figure 5). GLUT2 expression plays a key role in glucose sensing and homeostasis, and its inactivation in the liver could impair glucose-stimulated insulin secretion (25). GSK3β was reported to be significantly increased in patients with T2DM and was positively correlated with insulin resistance (26). In addition, PPARγ is a ligand-activated nuclear receptor, and activation of PPARγ improves insulin sensitivity (27). In summary, SA could activate the PI3K/AKT/GLUT2 protein pathway, regulate glucose metabolism gene expression, enhance insulin sensitivity, and improve insulin resistance.
Numerous studies have demonstrated that the gut microbiota are associated with the development of T2DM and related complications, which can regulate glucose homeostasis to alleviate hyperglycemia (28). The results of gut microbiotic analysis indicated that SA significantly reduced the F/B ratio at the gate level, and the F/B ratio was reported to be negatively correlated with glucose levels and tolerance (29). Meanwhile, the relative abundance of Desulfobacterota and Actinobacteriota was significantly reduced. It was previously shown that the abundance of Desulfobacterota was positively correlated with BW and lipid concentration (30), which is consistent with the above results (Figure 1). Furthermore, the induction of T2DM mice using HFD/STZ caused a significant decrease in the abundance of norank_f__Muribaculaceae, Allobaculum, Akkermansia, norank_f__norank_o__Clostridia_UCG-014, the Eubacterium_siraeum_ group, and Prevotellaceae _NK3B31_group, while the abundance of Desulfov ibrio, Lactobacillus, Enterorhabdus, norank_f__Clostridium _methylpentosum_group, Dubosiella, Alistipes, and Bacteroides was significantly increased. At the genus level, supplementation with high doses of SA significantly reversed their abundance (Figure 7). Norank_f_Muribaculaceae are reportedly widespread in the intestinal flora and are functionally diverse in degrading carbohydrates (31). Recent studies have demonstrated that higher abundance of Muribaculaceae positively correlates with the activation of the PI3K/Akt signaling pathway (32). Allobaculum was identified as an active glucose assimilator, whose main metabolites are acetic acid and propionic acid (33) and which has a positive effect on the regulation of the intestinal flora ecosystem. Akkermansia maintains the integrity of the mucin layer and has anti-inflammatory and insulin resistance improving properties (28). However, SA significantly reduced the relative abundance of Desulfovibrio, Enterorhabdus, the norank_f__Clostridium_methylpentosum_group, Dubosiella, and Alistipes. Notably, Desulfovibrio, Enterorhabdus, and Dubosiella were positively correlated with intestinal inflammation and oxidative stress (34, 35), which is consistent with the experimental results showing a significant increase in IL-6 and TNF-α and a significant decrease in SOD and GSH-Px in T2DM mice (Figure 2).
Regulation of the intestinal flora and SCFA levels in T2DM mice had a positive effect on improving hyperglycemia (36). A correlation analysis indicated that the abundance of gut microflora was significantly correlated with metabolic parameters, including the lipid concentration, FBG, FINS, HOMA-IR, inflammatory markers, antioxidant enzymes, and SCFAs. Several studies have demonstrated that SCFAs activate the PI3K/AKT signaling pathway and alleviate T2DM (37–39). Therefore, we hypothesized that the modulatory effect of SA on glycolipid metabolism could be attributed to the reduced abundance of these harmful pathogenic bacteria and increased abundance of beneficial bacteria, promoting the production of SCFAs, and alleviate T2DM symptoms.
In our work, we found that administration of SA to HFD/STZ-induced T2DM mice significantly inhibited weight loss and the FBG level while increasing insulin sensitivity and improving insulin resistance. Furthermore, SA reduced TC, TG, and LDL-C levels and increased HDL-C levels, as well as reduced fat accumulation in liver tissues, enhanced glucose uptake and utilization by liver tissues, and promoted glycogen synthesis. Meanwhile, SA could activate the PI3K/AKT signaling pathway, promote glucose metabolism gene expression, and regulate blood glucose. Notably, the SA intervention altered the composition of the gut microbiota in T2DM mice and increased the levels of SCFAs, such as acetate, propionate, and butyrate. In conclusion, our experimental results showed that SA could produce hypoglycemic effects by regulating gut microbial structure and activating the PI3K/AKT signaling pathway. Our research supports the potential of SA as a therapeutic agent.
T. grandis cv. Merrillii was purchased from Zhuji (Zhejiang, China), and SA was extracted according to a conventional method (40). STZ and Met were obtained from Aladdin Reagent Int. (Shanghai, China). HFD feed was purchased from Suzhou Shuangsi Experimental Animal Feed Technology Co. (Suzhou, China). The other chemical reagents were of analytical grade.
Thirty male SPF C57BL/6 J mice (weighing 24 ± 2 g) aged 7 weeks were purchased from Hangzhou Ziyuan Experimental Animal Science and Technology Co., Ltd. (certificate number SCXK (zhe) 2019-0004, Hangzhou, China). All mice were housed in a non-pathogenic animal chamber maintained at 23–25°C, 50–60% relative humidity, and 12/12 h of dark/light illumination. After a week, the mice were randomly divided into two groups, a control group (B, n = 6) and an HFD group (n = 24). After 3 weeks of HFD feeding, the 24 mice were fasted overnight and intraperitoneally injected with 100 mg/kg BW of STZ (0.1 M cold citrate buffer, pH 4.5), whereas 0.1 M cold citrate buffer was administered to the control group. The blood glucose level of the mice was stable after a week. Subsequently, blood was taken from the mouse tail veins, and the level of fasting blood glucose (FBG) was measured. An FBG level > 11.1 mmol/L was considered to indicate T2DM (41), and the mice were used for further research.
The type 2 diabetic mice were randomly divided into four groups, with six animals in each group: a model group (P), a positive control group (T, 200 mg/kg BW Met), a low-dose group (SAL, 70 mg/kg BW SA), and a high-dose group (SAH, 280 mg/kg SA). The mice in the control and model groups were administered the same amount of distilled water every day for 4 weeks. BW, food intake, and FBG were measured weekly. All mice were fed a normal diet of regular chow. After 4 weeks of treatment, the mice were fasted overnight and were then killed under iso-flurane anesthesia. Blood samples were collected and centrifuged at 3,000 rpm for 10 min to obtain serum, which was stored at −80°C. Liver samples were collected and divided into two parts for hematoxylin & eosin (H&E) staining and western blot analysis. Cecal content was collected for the detection of short-chain fatty acids (SCFAs) and microorganisms. The formula for calculating the liver/kidney index is as follows:
During the experiment, blood was drawn from the tail vein of mice once a week after overnight fasting to detect FBG levels. After 3 weeks of gavage, all mice were fasted overnight and then given glucose (2 g/kg BW) dissolved in water (42). The blood glucose levels were measured using blood obtained from the tail vein at 0, 30, 60, 90, and 120 min with a blood glucometer (Sannuo, Beijing, China).
According to the kit instructions, the fasting serum insulin levels (FINS) were measured by using an insulin detection kit (Nanjing Jiancheng Bioengineering Co. Ltd., Nanjing, China). The insulin resistance (HOMA-IR) was calculated as follows (43):
The triglyceride (TG), total cholesterol (TC), high-density lipoprotein cholesterol (HDL-C), and LDL cholesterol (LDL-C) levels in the serum were determined using an ELISA kit (Nanjing Jiancheng Bioengineering Co. Ltd., Nanjing, China).
The serum levels of superoxide dismutase (SOD), glutathione peroxidase (GSH-Px), tumor necrosis factor-α (TNF-α), and interleukin-6 (IL-6) were measured according to the kit instructions. SOD and GSH-Px kits were purchased from Jiancheng Bioengineering Institute (Nanjing, China). TNF-α and IL-6 kits were obtained from Wuhan Boster Biological Technology., Ltd. (Wuhan, China).
The levels of alanine transaminase (ALT), AST, and hepatic glycogen (Gly) were measured following the instructions on the ELISA kits (Nanjing Jiancheng Bioengineering Co. Ltd., Nanjing, China).
Liver specimens from mice in each group were fixed in 4% formaldehyde, embedded in paraffin, and sectioned for H&E staining. The liver tissue changes were observed under a light microscope.
RT-PCR analysis was performed according to previously published research methods (44). Briefly, total RNA was extracted from mouse liver tissues using Trizol reagent (Tiangen Biotech Co., Ltd., Beijing, China) and quantified by optical density measurements at 260 and 280 nm using a spectrophotometer (Tiangen Biotech Co., Ltd., Beijing, China). cDNA was synthesized from RNA samples with a cDNA synthesis kit (Tiangen Biotech Co., Ltd., Beijing, China). Each sample was analyzed using qRT-PCR with the SYBR Green PCR Master Mix (Tiangen Biotech Co., Ltd., Beijing, China) and quantified utilizing the StepOnePlus RT-PCR detection system (Zhejiang Scientific Instruments and Materials I/E Co., Ltd.). β-Actin was used as a control housekeeping gene for calculation of the relative gene expression levels. The primer sequences used for PCR were synthesized by Shanghai Sangon Biotech Co., Ltd., China (Table 1).
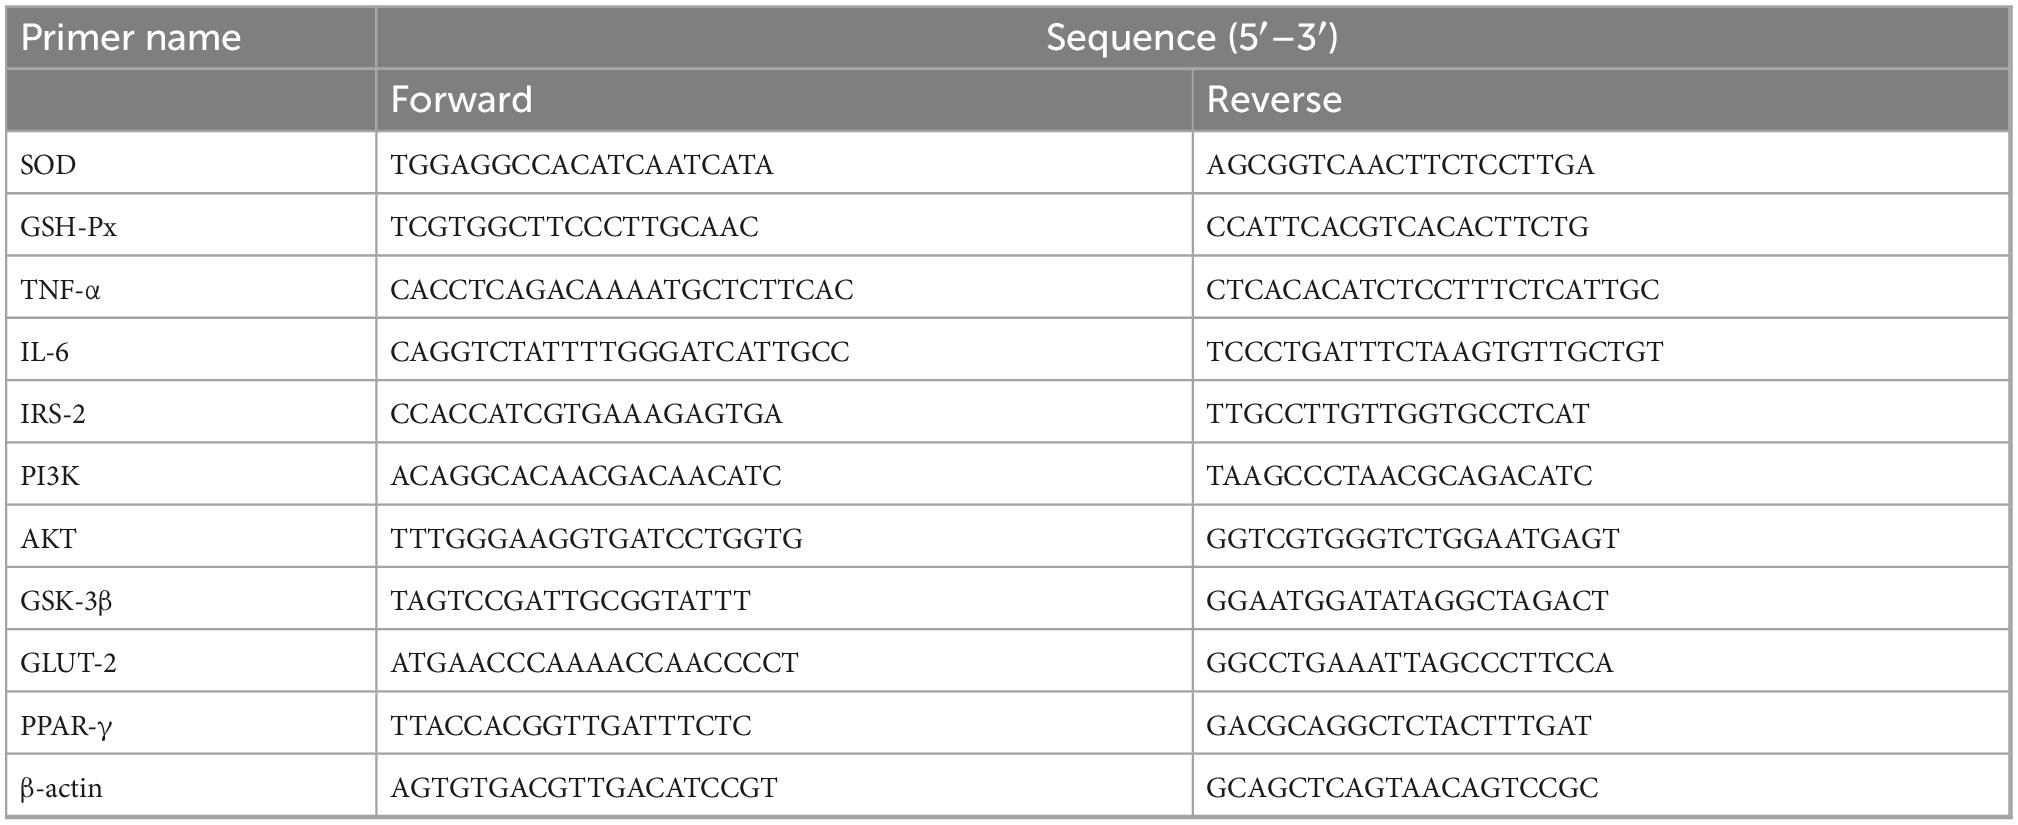
Table 1. Sequences of oligonucleotide primers used in qRT-PCR analysis.
Mouse liver tissues were crushed in liquid nitrogen, and total protein was extracted using a total protein extraction kit (containing a protease inhibitor cocktail), followed by total protein quantification utilizing a BCA quantitation kit. All proteins were separated using 8–12% SDS-PAGE gels and blotted on PVDF membranes. Next, the membranes were placed in T-TBS (with 5% BSA) and blocked for 1 h at room temperature. Then, the membranes were rinsed in T-TBS and incubated with primary and secondary antibodies. The relative expression of target proteins was calculated using GAPDH as an internal reference. Image J software was employed to analyze the densitometric values of the bands and to calculate the relative expression of the proteins of interest. The primary antibodies used in this study are shown in Table 2.
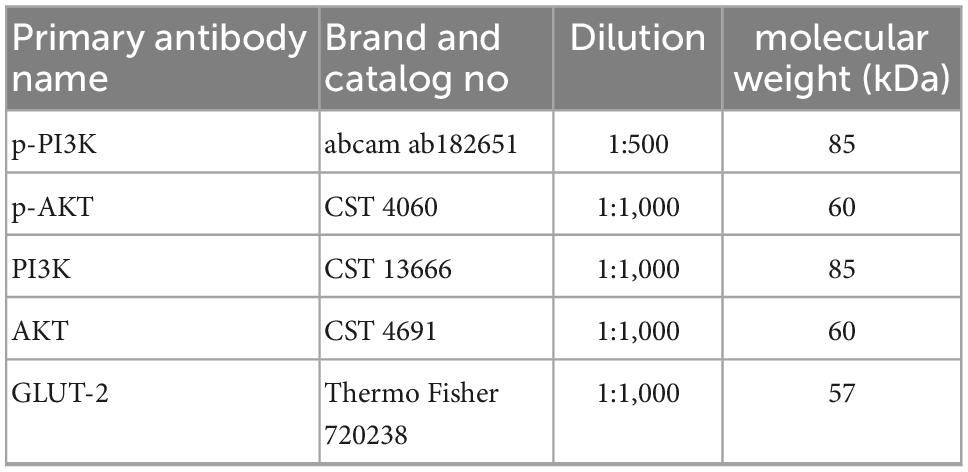
Table 2. Primary antibody information in western blotting experiments.
The SCFA content of mouse cecum was determined with Agilent 7,890A gas chromatography (GC). The detection system was equipped with an Agilent J&W GC column (30 m × 320 μm × 0.25 μm) and a flame ionization detector (FID). The conditions were as follows: the initial column temperature was maintained at 100°C for 1 min and then increased to 150°C at a rate of 2°C/min for 5 min. The injector and detector temperatures were maintained at 270°C and 280°C, respectively. Hydrogen, air, and nitrogen were used as supplementary gases at flow rates of 30 ml/min, 4 ml/min, and 5 ml/min, respectively. The constant column flow + tail blow flow rate was 31.5 ml/min. The sample volume was 1 μl, and the column flow rate was 2 ml/min.
DNA was extracted from mouse cecum feces using the QIAamp DNA Stool Mini Kit (QIAGEN, Inc., Shanghai, China), and the purity and concentration of the extracted DNA were determined with 1% agarose gel electrophoresis. The primer sequences F: 5′-ACTCCTACGGGAGGCAGCAG-3′ and R: 5′-GGACTACHVGGGTWTCTAAI-3′ were used to amplify the V3-V4 hyper-variable region of the bacterial 16S rRNA gene (45). The samples were then sequenced in parallel utilizing Illumina MiSeq according to the user manual. The resulting raw data files were manipulated and filtered with the QIIME2 (version 1.8.0) software package. Raw sequences were imported into fastp QC (0.19.61), and FLASH software (v1.2.112) was used for pair-end double-end sequence splicing and screening for sequence optimization. Sequences with >97% similarity were clustered and annotated to generate operational taxonomic units (OTUs) using UPARSE software (version 7.0). Alpha diversity and microbial taxon distribution analyses were performed with QIIME2 software.
To compare the mean differences among the groups, one-way analysis of variance (ANOVA) by Duncan’s multiple range test was used. All data were expressed as mean ± SD, and P < 0.05 was considered statistically significant. All statistical analyses were performed using SPSS 20 software (SPSS Inc., Chicago, IL, USA).
The datasets presented in this study can be found in online repositories. The names of the repository/repositories and accession number(s) can be found in this article/Supplementary material.
The animal study was reviewed and approved by the Institutional Animal Care and Use Committee of the Zhejiang Academy of Agricultural Sciences.
LC and GS conceived and designed the experiments. XX and CJ performed the experiments. HL, WH, JZ, SY, and CT analyzed the data. QJ wrote the manuscript. YF and ML helped perform the analysis and with constructive discussions. All authors read and approved the final manuscript.
This work was supported by the Foundation of the Key Research and Development Program of Zhejiang Province (No. 2021C02002), the Key Laboratory of Cancer Prevention and Therapy Combining Traditional Chinese and Western Medicine of Zhejiang Province (No. 202208CL), the Demonstration and Promotion Project of New Scientific and Technological Achievements of Zhejiang Academy of Agricultural Sciences (No. tg2022011), the Development of deep-processed products of Torreya and evaluation of functional active substances (No. 2021R06B88D02), and the Project of Science and Technology Program of Quzhou (No. 2021K34).
CT, YF, and JZ were employed by Xujing (Hangzhou) Biotechnology Research Institute Co., Ltd.
The remaining authors declare that the research was conducted in the absence of any commercial or financial relationships that could be construed as a potential conflict of interest.
All claims expressed in this article are solely those of the authors and do not necessarily represent those of their affiliated organizations, or those of the publisher, the editors and the reviewers. Any product that may be evaluated in this article, or claim that may be made by its manufacturer, is not guaranteed or endorsed by the publisher.
The Supplementary Material for this article can be found online at: https://www.frontiersin.org/articles/10.3389/fnut.2022.1053348/full#supplementary-material
1. Abdulwahab DA, El-Missiry MA, Shabana, S, Othman, AI, Amer ME Melatonin protects the heart and pancreas by improving glucose homeostasis, oxidative stress, inflammation and apoptosis in T2DM-induced rats. Heliyon. (2021). 7:e06474. doi: 10.1016/j.heliyon.2021.e06474
2. Zhao C, Yang C, Wai STC, Zhang Y, P Portillo M, Paoli P, et al. Regulation of glucose metabolism by bioactive phytochemicals for the management of type 2 diabetes mellitus. Crit Rev Food Sci Nutr. (2019) 59:830–47. doi: 10.1080/10408398.2018.1501658
3. Sun H, Saeedi P, Karuranga S, Pinkepank M, Ogurtsova K, Duncan BB, et al. IDF diabetes atlas: global, regional and country-level diabetes prevalence estimates for 2021 and projections for 2045. Diabetes Res Clin Pract. (2022) 183:109119. doi: 10.1016/j.diabres.2021.109119
4. Zaoui P, Hannedouche T, Combe C. [Cardiovascular protection of diabetic patient with chronic renal disease and particular case of end-stage renal disease in elderly patients]. Nephrol Ther. (2017) 13:S16–16.
5. Wijesuriya M, Joshepkumar T, Dharmawardhana T, Chandrasinghe S, Wijesuriya D. IDF21-0118 prevalence of complications amongst persons living with T2DM screened at national diabetes centre, Sri Lanka. Diabetes Res Clin Pract. (2022) 186:109712. doi: 10.1016/j.diabres.2022.109712
6. Singh A, Dwivedi S. Study of adverse drug reactions in patients with diabetes attending a tertiary care hospital in New Delhi, India. Indian J Med Res. (2017) 145:247–9. doi: 10.4103/ijmr.IJMR_109_16
7. Ke C, Morgan S, Smolina K, Gasevic D, Qian H, Khan N. Mortality and cardiovascular risk of sulfonylureas in South Asian, Chinese and other canadians with diabetes. Can J Diabetes. (2017) 41:150–5. doi: 10.1016/j.jcjd.2016.08.218
8. Airhart S, Cade W, Jiang H, Coggan A, Racette S, Korenblat K, et al. A diet rich in medium-chain fatty acids improves systolic function and alters the lipidomic profile in patients with type 2 diabetes: a pilot study. J Clin Endocrinol Metab. (2016) 101:504–12. doi: 10.1210/jc.2015-3292
9. Nunes ÂA, Buccini DF, dos Santos Jaques JA, Portugal LC, Guimarães RCA, Favaro SP, et al. Effect of dietary Acrocomia aculeata kernel oil rich in medium chain fatty acids on type 2 diabetic rats. J Funct Foods. (2020) 75:104295. doi: 10.1016/j.jff.2020.104295
10. Ni Q, Gao Q, Yu W, Liu X, Xu G, Zhang Y. Supercritical carbon dioxide extraction of oils from two Torreya grandis varieties seeds and their physicochemical and antioxidant properties. LWT Food Sci Technol. (2015) 60:1226–34.
11. Shi L-K, Mao J-H, Zheng L, Zhao C-W, Jin Q-Z, Wang X-G. Chemical characterization and free radical scavenging capacity of oils obtained from Torreya grandis Fort. ex. Lindl. and Torreya grandis Fort. var. Merrillii: a comparative study using chemometrics. Ind Crops Prod. (2018) 115:250–60. doi: 10.1016/j.indcrop.2018.02.037
12. Chen S, Dong M, Kita K, Shi Q, Cong B, Guo W, et al. Anti-proliferative and apoptosis-inducible activity of labdane and abietane diterpenoids from the pulp of Torreya nucifera in HeLa cells. Mol Med Rep. (2010) 3:673–8. doi: 10.3892/mmr_00000315
13. He Z, Zhu H, Li W, Zeng M, Wu S, Chen S, et al. Chemical components of cold pressed kernel oils from different Torreya grandis cultivars. Food Chem. (2016) 209:196–202. doi: 10.1016/j.foodchem.2016.04.053
14. Chen SJ, Huang WC, Yang TT, Lu JH, Chuang LT. Incorporation of sciadonic acid into cellular phospholipids reduces pro-inflammatory mediators in murine macrophages through NF-κB and MAPK signaling pathways. Food Chem Toxicol. (2012) 50:3687–95. doi: 10.1016/j.fct.2012.07.057
15. Wang H, Li Y, Wang R, Ji H, Lu C, Su X. Chinese Torreya grandis cv. Merrillii seed oil affects obesity through accumulation of sciadonic acid and altering the composition of gut microbiota. Food Sci Hum Wellness. (2022) 11:58–67. doi: 10.1016/j.fshw.2021.07.007
16. Wu S, Zuo J, Cheng Y, Zhang Y, Zhang Z, Wu M, et al. Ethanol extract of Sargarsum fusiforme alleviates HFD/STZ-induced hyperglycemia in association with modulation of gut microbiota and intestinal metabolites in type 2 diabetic mice. Food Res Int. (2021) 147:110550. doi: 10.1016/j.foodres.2021.110550
17. Vaidya V, Gangan N, Sheehan J. Impact of cardiovascular complications among patients with Type 2 diabetes mellitus: a systematic review. Expert Rev Pharmacoecon Outcomes Res. (2015) 15:487–97. doi: 10.1586/14737167.2015.1024661
18. Russell WR, Baka A, Björck I, Delzenne N, Gao D, Griffiths HR, et al. Impact of diet composition on blood glucose regulation. Crit Rev Food Sci Nutr. (2016) 56:541–90. doi: 10.1080/10408398.2013.792772
19. Solis-Herrera C, Triplitt C, Cersosimo E, DeFronzo RA. Pathogenesis of type 2 diabetes mellitus. In: Feingold KR, Anawalt B, Boyce A, Chrousos G, de Herder WW, Dhatariya K, et al. editors. Endotext. (South Dartmouth, MA: MDText.com, Inc) (2000).
20. Liu N, Chen X, Song J, Chen M, Gong P, Jia W, et al. Hypoglycemic effects of Auricularia auricula polysaccharides on high fat diet and streptozotocin-induced diabetic mice using metabolomics analysis. Food Funct. (2021) 12:9994–10007. doi: 10.1039/d1fo02022f
21. Zhang Y, Zhou G, Peng Y, Wang M, Li X. Anti-hyperglycemic and anti-hyperlipidemic effects of a special fraction of Luohanguo extract on obese T2DM rats. J Ethnopharmacol. (2020) 247:112273. doi: 10.1016/j.jep.2019.112273
22. Banik S, Ghosh A. The association of oxidative stress biomarkers with type 2 diabetes mellitus: a systematic review and meta-analysis. Health Sci Rep. (2021) 4:e389. doi: 10.1002/hsr2.389
23. Klover PJ, Mooney RA. Hepatocytes: critical for glucose homeostasis. Int J Biochem Cell Biol. (2004) 36:753–8. doi: 10.1016/j.biocel.2003.10.002
24. Li Y, Tang Y, Shi S, Gao S, Wang Y, Xiao D, et al. Tetrahedral framework nucleic acids ameliorate insulin resistance in type 2 diabetes mellitus via the PI3K/Akt pathway. ACS Appl Mater Interfaces. (2021) 13:40354–64. doi: 10.1021/acsami.1c11468
25. Thorens B. GLUT2, glucose sensing and glucose homeostasis. Diabetologia. (2015) 58:221–32. doi: 10.1007/s00125-014-3451-1
26. Hao Q, Zheng A, Zhang H, Cao H. Down-regulation of betatrophin enhances insulin sensitivity in type 2 diabetes mellitus through activation of the GSK-3β/PGC-1α signaling pathway. J Endocrinol Invest. (2021) 44:1857–68. doi: 10.1007/s40618-020-01493-1
27. Qu X, Guan P, Xu L, Liu B, Li M, Xu Z, et al. Riligustilide alleviates hepatic insulin resistance and gluconeogenesis in T2DM mice through multitarget actions. Phytother Res. (2022) 36:462–74. doi: 10.1002/ptr.7346
28. Cunningham AL, Stephens JW, Harris DA. Gut microbiota influence in type 2 diabetes mellitus (T2DM). Gut Pathog. (2021) 13:50. doi: 10.1186/s13099-021-00446-0
29. Zhu J, Wu M, Zhou H, Cheng L, Wei X, Wang Y. Liubao brick tea activates the PI3K-Akt signaling pathway to lower blood glucose, metabolic disorders and insulin resistance via altering the intestinal flora. Food Res Int. (2021) 148:110594. doi: 10.1016/j.foodres.2021.110594
30. Li Y, Huang J, Zhang S, Yang F, Zhou H, Song Y, et al. Sodium alginate and galactooligosaccharides ameliorate metabolic disorders and alter the composition of the gut microbiota in mice with high-fat diet-induced obesity. Int J Biol Macromol. (2022) 215:113–22. doi: 10.1016/j.ijbiomac.2022.06.073
31. Lagkouvardos I, Lesker TR, Hitch TCA, Gálvez EJC, Smit N, Neuhaus K, et al. Sequence and cultivation study of Muribaculaceae reveals novel species, host preference, and functional potential of this yet undescribed family. Microbiome. (2019) 7:28. doi: 10.1186/s40168-019-0637-2
32. Qi B, Ren D, Li T, Niu P, Zhang X, Yang X, et al. Fu brick tea manages HFD/STZ-induced type 2 diabetes by regulating the gut microbiota and activating the IRS1/PI3K/Akt signaling pathway. J Agric Food Chem. (2022) 70:8274–87. doi: 10.1021/acs.jafc.2c02400
33. Zhang M, Zhang X, Zhu J, Zhao D, Ma Y, Li D, et al. Bidirectional interaction of nobiletin and gut microbiota in mice fed with a high-fat diet. Food Funct. (2021) 12:3516–26. doi: 10.1039/d1fo00126d
34. Miao J, Guo L, Cui H, Wang L, Zhu B, Lei J, et al. Er-chen decoction alleviates high-fat diet-induced nonalcoholic fatty liver disease in rats through remodeling gut microbiota and regulating the serum metabolism. Evid Based Complement Alternat Med. (2022) 2022:1–18. doi: 10.1155/2022/6221340
35. Liu B, Ye D, Yang H, Song J, Sun X, Mao Y, et al. Two-sample mendelian randomization analysis investigates causal associations between gut microbial genera and inflammatory bowel disease, and specificity causal associations in ulcerative colitis or Crohn’s disease. Front Immunol. (2022) 13:921546. doi: 10.3389/fimmu.2022.921546
36. Yulong Z, Peng Y, Zhao L, Zhou G, Li X. Regulating the gut microbiota and SCFAs in the faeces of T2DM rats should be one of antidiabetic mechanisms of mogrosides in the fruits of Siraitia grosvenorii. J Ethnopharmacol. (2021) 274:114033. doi: 10.1016/j.jep.2021.114033
37. Xia T, Liu C-S, Hu Y-N, Luo Z-Y, Chen F-L, Yuan L-X, et al. Coix seed polysaccharides alleviate type 2 diabetes mellitus via gut microbiota-derived short-chain fatty acids activation of IGF1/PI3K/AKT signaling. Food Res Int. (2021) 150:110717. doi: 10.1016/j.foodres.2021.110717
38. Gong P, Xiao X, Wang S, Shi F, Liu N, Chen X, et al. Hypoglycemic effect of astragaloside IV via modulating gut microbiota and regulating AMPK/SIRT1 and PI3K/AKT pathway. J Ethnopharmacol. (2021) 281:114558. doi: 10.1016/j.jep.2021.114558
39. Yan X, Feng B, Li P, Tang Z, Wang L. Microflora disturbance during progression of glucose intolerance and effect of sitagliptin: an animal study. J Diabetes Res. (2016) 2016:2093171. doi: 10.1155/2016/2093171
40. Pédrono F, Boulier-Monthéan N, Boissel F, Ossemond J, Dupont D. Sciadonic acid derived from pine nuts as a food component to reduce plasma triglycerides by inhibiting the rat hepatic Δ9-desaturase. Sci Rep. (2020) 10:6223. doi: 10.1038/s41598-020-63301-3
41. Wang T, Li X, Zhou B, Li H, Zeng J, Gao W. Anti-diabetic activity in type 2 diabetic mice and α-glucosidase inhibitory, antioxidant and anti-inflammatory potential of chemically profiled pear peel and pulp extracts (Pyrus spp.). J Funct Foods. (2015) 13:276–88. doi: 10.1016/j.jff.2014.12.049
42. Zhong R, Chen L, Liu Y, Xie S, Li S, Liu B, et al. Anti-diabetic effect of aloin via JNK-IRS1/PI3K pathways and regulation of gut microbiota. Food Sci Hum Wellness. (2022) 11:189–98. doi: 10.1016/j.fshw.2021.07.019
43. Dhas Y, Banerjee J, Damle G, Mishra N. Association of vitamin D deficiency with insulin resistance in middle-aged type 2 diabetics. Clin Chim Acta. (2019) 492:95–101. doi: 10.1016/j.cca.2019.02.014
44. Ren C, Zhang Y, Cui W, Lu G, Wang Y, Gao H, et al. A polysaccharide extract of mulberry leaf ameliorates hepatic glucose metabolism and insulin signaling in rats with type 2 diabetes induced by high fat-diet and streptozotocin. Int J Biol Macromol. (2015) 72:951–9. doi: 10.1016/j.ijbiomac.2014.09.060
Keywords: sciadonic acid, type 2 diabetes mellitus, insulin signaling pathway, gut microbiota, short-chain fatty acids
Citation: Chen L, Jiang Q, Lu H, Jiang C, Hu W, Yu S, Xiang X, Tan CP, Feng Y, Zhang J, Li M and Shen G (2022) Antidiabetic effect of sciadonic acid on type 2 diabetic mice through activating the PI3K-AKT signaling pathway and altering intestinal flora. Front. Nutr. 9:1053348. doi: 10.3389/fnut.2022.1053348
Received: 25 September 2022; Accepted: 09 December 2022;
Published: 23 December 2022.
Edited by:
Lara Costantini, University of Tuscia, ItalyReviewed by:
Lin Shi, Shaanxi Normal University, ChinaCopyright © 2022 Chen, Jiang, Lu, Jiang, Hu, Yu, Xiang, Tan, Feng, Zhang, Li and Shen. This is an open-access article distributed under the terms of the Creative Commons Attribution License (CC BY). The use, distribution or reproduction in other forums is permitted, provided the original author(s) and the copyright owner(s) are credited and that the original publication in this journal is cited, in accordance with accepted academic practice. No use, distribution or reproduction is permitted which does not comply with these terms.
*Correspondence: Mingqian Li, ✉ bGltaW5ncWlhbjYxM0AxNjMuY29t; Guoxin Shen, ✉ Z3VveGluLnNoZW5AdHR1LmVkdQ==
Disclaimer: All claims expressed in this article are solely those of the authors and do not necessarily represent those of their affiliated organizations, or those of the publisher, the editors and the reviewers. Any product that may be evaluated in this article or claim that may be made by its manufacturer is not guaranteed or endorsed by the publisher.
Research integrity at Frontiers
Learn more about the work of our research integrity team to safeguard the quality of each article we publish.