- 1State Key Laboratory of Crop Stress Biology for Arid Areas, College of Agronomy, Northwest A&F University, Xianyang, China
- 2State Key Laboratory of Crop Cultivation and Farming System in Northwestern Loess Plateau, College of Agronomy, Northwest A&F University, Xianyang, China
- 3Rice Bio Park Research Section, Post-Harvest Technology and Food Science Research Division, Department of Agricultural Research, Naypyidaw, Myanmar
- 4State Key Laboratory of Crop Stress Biology in Arid Areas, College of Horticulture, Northwest A&F University, Xianyang, China
The cultivation of unique sorghum (resistant to abiotic stresses and re-recognized as healthy food) has attracted interest as an environmentally friendly minor cereal and may be a solution to food and nutritional security. However, information about how the use of selected sorghum grains affects nutritive values and its functional properties from sorghum flours is still lacking. To address this question, we selected six sorghum varieties (i.e., JinZa 34, LiaoZa 19, JinNuo 3, JiZa 127, JiNiang 2, and JiaXian) for the comprehensive analysis of the relationship among nutritional compositions, energy value contributions, and functional properties of sorghum grains. Results showed that Carr’s index (CI) and angle of repose (AR) of all sorghum flours indicated good flow and compressibility properties in terms of micrometric parameters. All sorghums were considered free of tannin. Based on the scatterplot analysis, the proportions of energy contributions due to protein, fat, and carbohydrate (CHO), were highly positively correlated with protein, fat, and CHO, respectively. The significantly different flours of six sorghum varieties resulted in different functional properties. The amylose content showed a highly negative association with light transmittance and water and oil absorption capacities. In addition, amylose had a highly positive relationship with water solubility (WS) and swelling power (SP). JinNuo 3 had the highest nutritional compositions [proximate, mineral, anti-nutritional values, and amino acid (AA) profiles] and functional properties indicating that it could be used as a brewing liquor. Our findings will provide a new opportunity to cultivate sorghum as an environment friendly minor cereal crop in dryland agro-ecosystems of arid and semi-arid regions of northern China for nutritional security, agriculture processing, and non-food industry in the future.
Introduction
Sorghum [Sorghum bicolor (L.) Moench], an environmentally friendly crop, is resistance to water and fertilizer efficient than other major cereal crops, such as maize, wheat, and rice (1). Sorghum is a multipurpose minor cereal crop, primarily used as food, feed, and forage, and as important raw materials for brewing liquor (2) and value-added food products (3). According to the public health point of view, sorghum provides many health benefits due to its antioxidant, anti-inflammatory, anti-proliferative, anti-diabetic, and anti-atherogenic properties (4). Its phenolic compounds can prevent many diseases including cancer, diabetes, digestive tract disease, and cardiovascular disease (5, 6).
Sorghum is widely grown in dryland agricultural systems in arid and semiarid specific zones of northern and northeastern parts of China. In those areas, the excessive consumption of water and over-application of inorganic fertilizers have led to serious action on environmental problems for sustainable agriculture (7). These characteristics limit the productivity and make dryland agro-ecosystems both inherently dynamic and vulnerable. It is clear that small-scale farming will continue to play an important role in providing livelihood security for people in those areas. To reduce the poverty and malnutrition it is therefore necessary to improve the productivity of current farming systems, and at the same time safeguard the generation of other ecosystem services, on which local people also depend (7, 8). Therefore, sorghum crop, which is an environmentally friendly minor cereal crop and recognized as healthy food, may be a solution. Nowadays, sorghum research is crucial for environmentally friendly crop and most promising candidate crop as a sorghum-based intercropping for agricultural sustainability (8, 9). Intercropping and sorghum ratooning are popular cultivation techniques among small-scale farmers around the globe (3, 10, 11). Ratooning is a system that grows shortly after cutting the main crop, and the second crop is harvested in the same cropping season. This method is a feasible harvesting practice (11, 12). Sorghum intercropping with some legumes has many economic returns (13–15), and the sorghum ratooning practice also has several advantages, such as no need for new seed and land preparation, covering of time of sowing, and high grain yield and quality (12). Zhou et al. (16) reported that sorghum ratoon crop has high contents of starch, protein, and tannin and low fat content after application of nitrogen fertilizer. This chemical composition indicates good quality for liquor production.
The cultivation of sorghum has decreased many years ago, but has attracted interest recently because of its highly nutritive grains, bioactive compounds, and starch versality (4, 17, 18). Many cereal scientists and food processors extensively studied the characteristics and physicochemical properties of sorghum starches (amylose and amylopectin), which can be adapted for agricultural processing and non-food industry (19–21). The literature reported that the contents of amylose in sorghum flour and starch affect the functional and physicochemical properties (22, 23). Yang et al. (24) reported that flours and starches of non-waxy proso and foxtail millets had higher amylose contents than those of waxy proso and foxtail millets. Potato flours and starches, which have higher amylose content that affects pasting properties than sweet potato flours and starches, have wider applications as functional flours with high nutritive values (25). Some studies also reported that in Tartary buckwheat, the four has the higher amylose content and other nutritional compositions than the starch, thus indicating its suitability for application in the food processing industry (26). However, limited information is available on nutritional compositions, quality traits, physical and functional properties, and anti-nutritional traits in industrial usage of sorghum flours.
The consumption and production of sorghum crops first need vigorous assessment of the ability and feasibility of particular cultivar to provide suitable yield, quality and nutritional value. Moreover, investigation of perceived functional properties is essential to assess the consequences of industrial processing on the crops like mechanical or thermal treatment. This could be due to insolubilization of denatured protein isolates by industrial treatment which may have either beneficial or deleterious impact on the nutritive values of the crops (17, 20, 21). Hence in the present study, sorghum seed flours, obtained from six Chinese sorghum cultivars i.e., JinZa 34, LiaoZa 19, JinNuo 3, JiZa 127, JiNiang 2, and JiaXian have been assayed with a view to evaluating their nutritional and functional properties. After purifying and milling the sorghum seeds, the flours obtained were evaluated for micrometric properties, proximate composition, energy values and contribution, mineral and amino acid (AA) composition, and anti-nutritional traits. Among different functional properties, SP, WS, WAC, OAC, light transmittance, and LGC of the sorghum flours have been assayed. In short, the present study was designed in with the hope of establishing the significance of sorghum as a major cereal grain crop in the human diet and finding the most beneficial cultivar in terms of nutritional value and industrial applicability. Moreover, our findings will provide a new opportunity to cultivate sorghum in dryland agro-ecosystems in arid and semi-arid regions of northern China and the application of sorghum flours in meeting the demand of consumer preference in the food industry.
Materials and methods
Materials
Six sorghum varieties JinZa 34 (JZ 34), LiaoZa 19 (LZ 19), JinNuo 3 (JN 3), JiZa 127 (JZ 127), JiNiang 2 (JN 2), and JiaXian (JX) were used in this study. These varieties were grown under similar planting conditions in an experimental field in Yulin, Shaanxi Province, China in 2021. Purified mature seeds (200 g) were rinsed and turned into flour via a high-speed grinder (FW-100D, XinBaoDe Instruments Ltd., Tianjin, China). Starches were extracted using alkaline steeping methods according to standard procedures of Zhang et al. (27) and Gao et al. (28).
Physical characteristics of sorghum varieties
Purified seeds were used for the determination of physical characteristics. Random grains were selected from a well-mixed sample and weighed by a digital weighing balance/SC-G Automatic Seed Test Instrument (Wan Shen Testing Company, Hangzhou, China) in three replications to measure the thousand-grain weight, and the mean value was recorded. Sorghum grain color and shape were recorded by visual classification. The grain size distribution, average diameter, and lognormal fitting function of sample grains were measured using the Fiji ImageJ software (ImageJ, US, NIH, Bethesda, MD, USA) and Origin 2018 (OriginLab Corporation, Northampton, MA 01060, USA). Bulk density (BD) was determined using a 10 ml graduated cylinder. A known weight of the sample was poured into the cylinder, and the volume was recorded. BD was calculated using the equation: BD (g/ml) = [mass of the sample (g)/volume of the sample (ml)] (29). The tapped density (TPD) of a sample was calculated using the equation: TPD (g/ml) = [mass of the sample (g)/volume of the sample (ml)] (29). The true density (TD) of the sample was calculated using the formula: TD (g/ml) = mass of the sample (g)/volume of sample displaced by the sand (ml) (29). The percentage of porosity (P) in sample was calculated using the formula: P (%) = (TD–BD)/TD × 100 (30).
Determination of micrometric properties
The Carr’s index (CI) of the sample was measured as reported by Menaka et al. (29). CI was calculated using the equation: CI = [(TPD–BD)/TPD] × 100. The Hausner’s ratio (HR) was calculated using the formula: HR = (TPD/BD) × 100 (29). To measure the angle of repose (AR), a mounted funnel was placed on a laboratory stand at a height of 10 cm from the bench to measure the AR. About 50 g sample was poured into the mounted funnel with the closed tip. The tip-plug was opened, and the sample flour was allowed to pass through the orifice. The height and diameter of the sample heap were measured. AR was calculated using the equation: AR (θ) = tan–1 (h/r), where h represents the height of conical powder heap, and r is the radius of the circular base (29).
Proximate composition and amylose content analyses of sorghum flours
The moisture, crude fiber, and ash contents were analyzed by standard methods of AOAC (31). Fat (F), protein (PT), and starch contents were determined by Soxhlet extractor, Kjeldahl method, and anthrone spectrophotometry method, respectively (23, 24). The content of carbohydrate (CHO) was calculated by difference: CHO = 100 – (%PT + %F + %moisture + %crude fiber + %ash) (32). The percentage of starch yield (SY) was calculated on dry matter basis of 100 g sample grains. SY was calculated using the following formula: SY (%) = (weight of starch/weight of whole grain) × 100 (30). The starch recovery percent (SR%) of sorghum flour was calculated using the equation: SR (%) = (weight of starch/weight of grain starch) × 100 (32). The amylose (AM) content was analyzed using the method of Yang et al. (33) with some modifications.
Determination of energy values and percentage of energy contribution
Energy values were determined by multiplying the results of PT, CHO, and F by 17, 17, and 37, respectively (20, 34). Each analysis of the sample was carried out in duplicate. The proportions of energy contributions from F, PT, and CHO to total energy (TE KJ/100 g) were calculated for each proximate composition type. In samples, the utilization of energy due to PT (UEDP%) was also calculated in accordance with the formula of Niyi et al. (35).
Determination of mineral and amino acid compositions
The analysis of minerals was carried out from the sample solution obtained by dry-ashing the samples at 550°C to constant weight. Sodium and potassium contents were measured using a flame photometer and the phosphorus content was determined by Vanadomolybdate method (20, 36). Other metals (calcium, magnesium, iron, manganese, and zinc) were measured using an atomic absorption spectrophotometer according to the method described by Adeyeye et al. (20). All determinations were measured in triplicate. The AA compositions of flour samples were determined by the pre-column derivatized AccQ.Tag Ultra method and using the reverse-phase HPLC system (37).
Determination of anti-nutritional factors
The condensed tannin contents of flour samples were determined following the modified vanillin/HCl assay described by Khoddami et al. (38). The absorbance was recorded at 500 nm, and the catechin standard solution was used as template for the condensed tannin assay. Total flavonoids were determined using the assay modified by Khoddami et al. (38) and Afify et al. (39). The reaction mixture was kept for 6 min and then mixed with 2 ml of 1 M NaOH, and the total volume was made up to 10 ml with distilled water. The absorbance and expressed results were 510 nm and μg catechin equivalent/g dry sample (μg/g), respectively (39). Total phenol contents were determined using the Folin-Ciocalteau assay (40, 41) with some modifications. Absorbance was measured at 760 nm. Total phenols were calculated on the basis of standard curves and expressed as mg gallic acid equivalents (GAE)/100 g grain (dry weight, DW).
Functional properties of sorghum flours
Swelling power (SP) and water solubility (WS) were determined at 90°C by using the methods described by Sindhu and Khatkar (26) and Uarrota et al. (42), respectively. The method of Sindhu and Khatkar (26) was used for the determination of water absorption capacity (WAC) and oil absorption capacity (OAC) of different sorghum flours. Exactly 1.5 g sample suspension was added with 10 ml distilled water, and the mixture was agitated with four times for 10 min. After resting periods of 10 min, sediment samples were centrifuged at 3,250 rpm for 25 min. The supernatant was decanted, and tubes were air dried and then weighed to determine WAC. Approximately 3 ml refined groundnut oil was poured into a known weight of 0.5 g sample, and the mixture was stirred for 1 min and kept for 30 min at room temperature. After 30 min, sample tubes were centrifuged at 3,200 rpm for 25 min. The volume of unabsorbed oil was determined for OAC. Light transmittance (%LT) of flour paste was determined by following the methods of Ghada et al. (19) and Yang et al. (23) with some modifications. The percentage of LT was measured using spectrophotometry (Blue Star B, Lab Tech Ltd., Beijing, China). The methods reported by Sindhu and Khatkar (26) and Thilagavathi et al. (43) were followed with slight modifications for the determination of the least gelation concentration (LGC). Solutions 5 ml of concentration of flour [8–30% (w/v)] in test tubes were placed in a water bath maintained at 90°C and kept overnight at 4°C for cooling. Gelation was recorded by inverting the test tubes for determination of LGC.
Data analysis
Data were analyzed using the IBM SPSS version 20.0 software (SPSS Inc. Chicago, IL, USA). All data were presented as mean ± standard deviation. Each test was carried out in triplicate. Data were subjected to one-way ANOVA and the Tukey’s multiple range test was performed to compare treatment means. A p-value of 0.05 was considered significant. The Pearson correlation was determined using one-way ANOVA on the SPSS version 22.00 and correlation heatmap created on Microsoft Excel 2016. Column bar and Scatterplot matrix graphs were produced using the Origin 2018 software.
Results and discussion
Physical characteristics and micrometric properties of sorghum grains
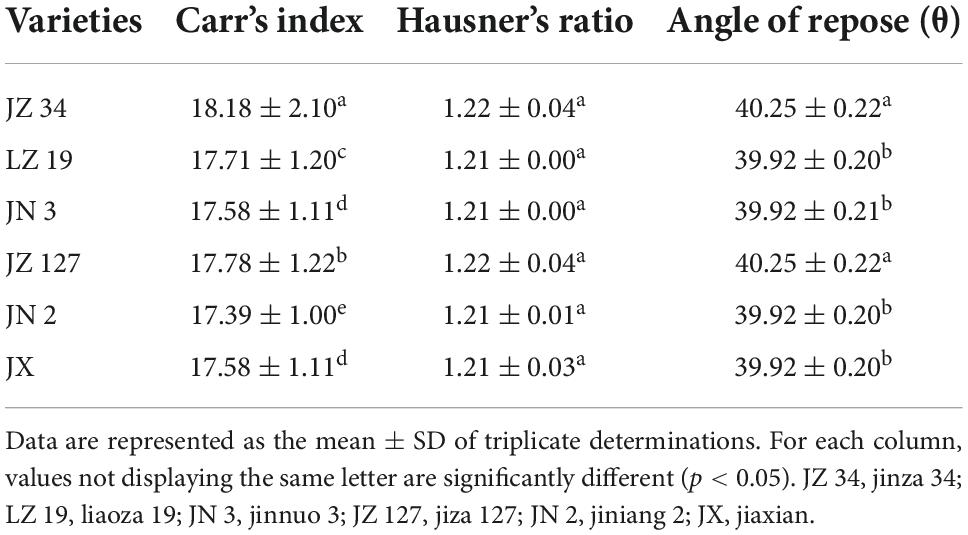
The physical characteristics of sorghum grains were assessed. Results are presented in Table 1. The physical properties of food are important as they are used in product design and development, process optimization, food quality control, and food process modeling (29). Deepa (30) reported that physical properties have unique characteristics a food material responds to physical treatment, including thermal, mechanical, electrical, optical, electromagnetic, and sonic process. The color and shape of all sorghum grains were white and round, respectively. The thousand grain weight had significantly differ (p < 0.05). The thousand-grain weights of JZ 34, LZ 19, JN 3, JZ 127, JN 2, and JX significantly differed (p < 0.05) and were 22.41, 31.85, 16.23, 35.80, 21.56, and 30.14 g, respectively. JZ 127 had the highest thousand grain weight. The highest values of BD, TPD, and TD were recorded in the LZ 19. In the present study, the TD of LZ 19 was significantly higher (p < 0.05) than BD and TPD, which might be due to the filling of void space and pores with sand while determining TD in the sand displacement method (30). Porosity, percentage of air between the particles that compared to a unit volume of particles (44). JZ 34 showed the highest P (44.61%). Deepa (30) stated that the difference in P among various samples is attributed to differences in their density values. Deepa (30) and Devi and Sharma (44) reported that high P resulted in high contact with atmospheric oxygen and high rate of auto-oxidation.
The Fiji ImageJ program is useful as magnetophoretic measurements in observing the physics of particle structure, scientific images (digital and scanning electron microscopy), and scattering-intensity data (9, 45, 46). Figure 1 shows the granule size distribution histogram and lognormal fitting of grain size. According to the Fiji ImageJ and Origin 2018 software results, the average grain sizes of JZ 34, LZ 19, JN 3, JZ 127, JN 2, and JX, were 3.80, 4.05, 3.87, 4.54, 3.83, and 3.87, respectively. The size of sorghum grains ranged from 2.8 to 5.2 mm. The average granule size of JZ 127 (4.54 mm) was larger than those of other varieties. The term micrometric represent to a study of well-derived properties of fine particle in science and technology, it is not only used in the development of pharmaceutical and material science (47), but in widely used in food science and technology for functional, pasting, and formulation (48). The micrometric properties including CI, HR, and AR, of sorghum flours were assessed. Results are shown in Table 2. The above three parameters determined the flow characteristics and compressibility of a powder. In the current study, the CI and AR of all sorghum flours indicated good flow and compressibility properties. Deepa (30) reported that CI (23%) and AR (50°) had good flow and compressibility properties. Our results were consistent into their findings. Among the six sorghum flours, JZ 34 had higher CI and AR values (p < 0.05). HR did not significantly differ (p > 0.05) in our findings. The good flow properties of granules and powders are important in products designed in compressed form like tablets, and capsules (47), and in the creation of new products, like films and coatings (48).
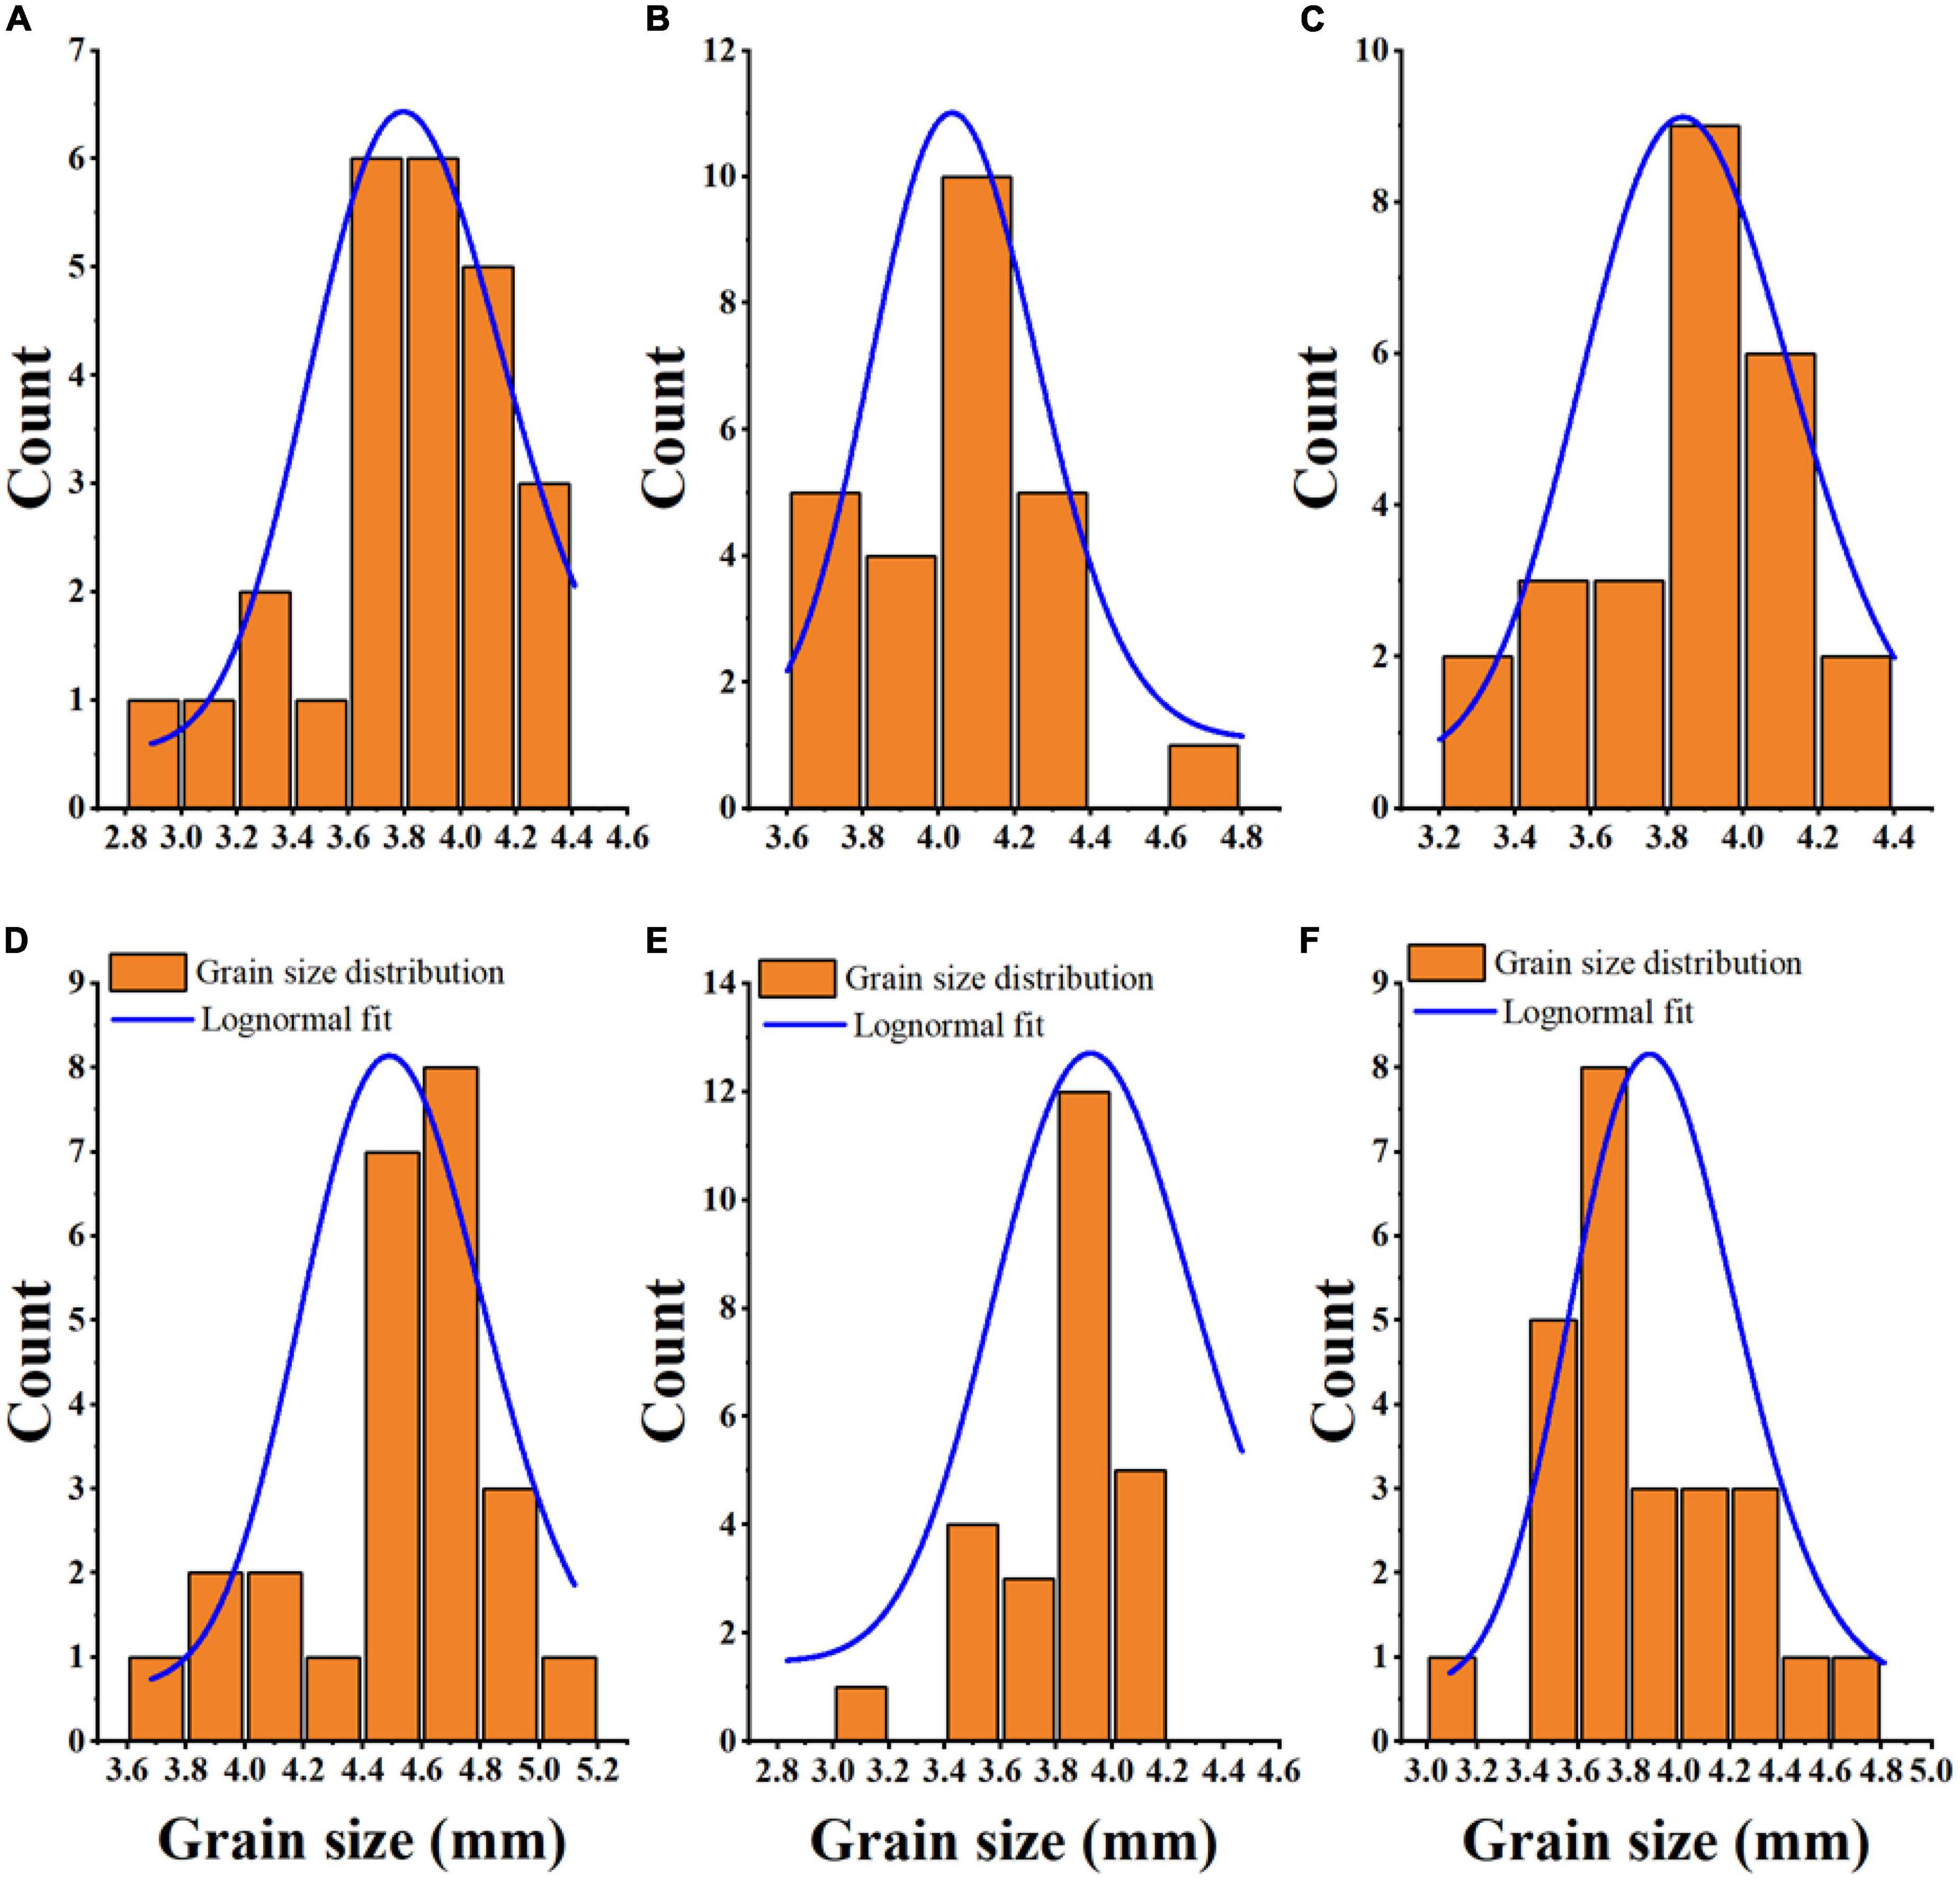
Figure 1. Grain size distribution and Lognormal fitting of six sorghum grains. JZ 34, jinza 34 (A); LZ 19, liaoza 19 (B); JN 3, jinnuo 3 (C); JZ 127, jiza 127 (D); JN 2, jiniang 2 (E); JX, jiaxian (F).
Proximate compositions and energy values of sorghum varieties
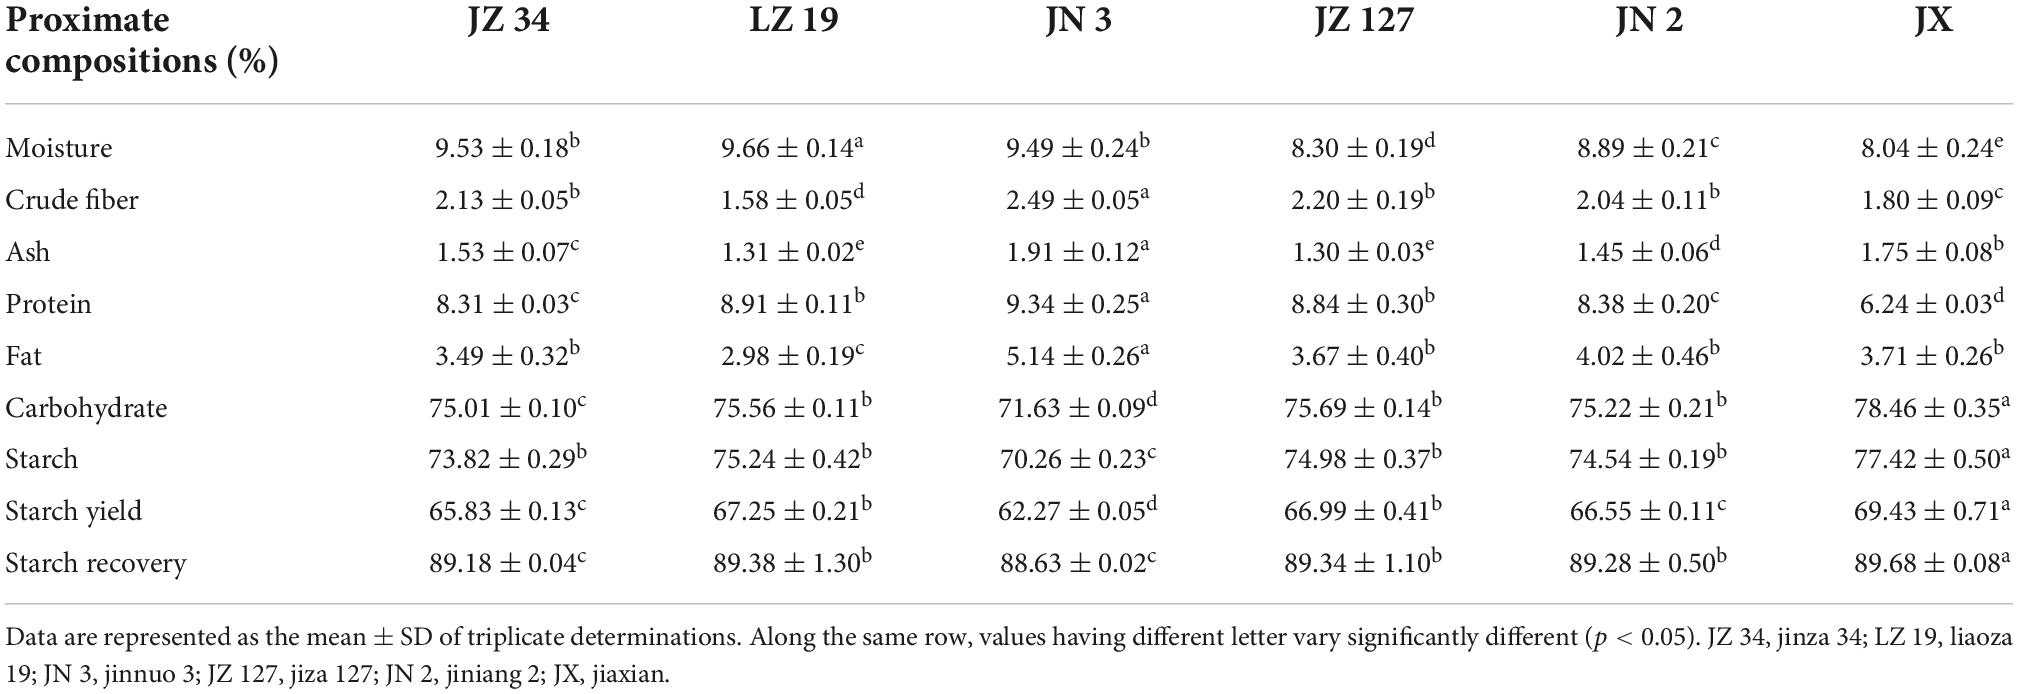
The proximate composition was significantly influenced by six sorghum varieties (Table 3). The highest values of crude fiber (2.49%), ash (1.91%), PT (9.34%), and F (5.14%) were recorded in JN 3. In this study, LZ 19 had the lowest crude fiber (1.58%) and F (2.98%) contents, whereas JX showed the lowest PT content (6.24%). Table 3 shows that JX contained considerably CHO content (78.46%), starch content (77.42%), SY (69.43%), and starch recovery (89.68%) than other sorghum varieties. In summary, our results showed that among sorghum varieties, JN 3 and JX had nutritional potential in terms of proximate composition.
Table 4 depicts the percentage of energy values contributed by PT (PEP%), F (PEF%), CHO (PEC%), and utilizable energy due to PT (UEDP%). PEP, PEF, PEC, and UEDP in sorghum flours were 9.07–10.13%, 7.13–12.14%, 77.73–84.57%, and 4.04–6.08%, respectively. The JN 3 with the highest concentrations of F and PT also had the highest proportions of energy contributions due to F (PEF, 12.14%), PT (PEP, 10.13%), and UEDP (6.08%). The energy contribution by CHO was highest in the JX sorghum sample (84.57%). The total energy (TE) values of JZ 34, LZ 19, JN 3, JZ 127, JN 2, and JX were 1545.57, 1546.25, 1577.80, 1566.67, 1569.94, and 1572.17 KJ, respectively. These results indicated that JN 3 and JX had the highest TE values than others. Adeyeye et al. (20) reported that proximate compositions, and energy values and contributions in raw sorghum were higher than those in steeped and germinated sorghum samples.
Scatterplot matrix analysis of some proximate parameters and energy values
The scatterplot matrices of PT, F, CHO, and energy values and its contributions (TE, PEP, PEF, PEC, and UEDP) are shown in Figure 2. PEP, PEF, and PEC were highly positively correlated with PT (r = 0.998), F (r = 0.999), and CHO (r = 0.952, p < 0.05), respectively. Based on scatterplot analysis, TE had a positive correlation with PEF (r = 0.428) and negative correlation with PEP (r = -0.456) and PEC (r = -0.073), respectively. Furthermore, UEDP had a strongly significant positive correlation with PEP (r = 1.000, p < 0.05).
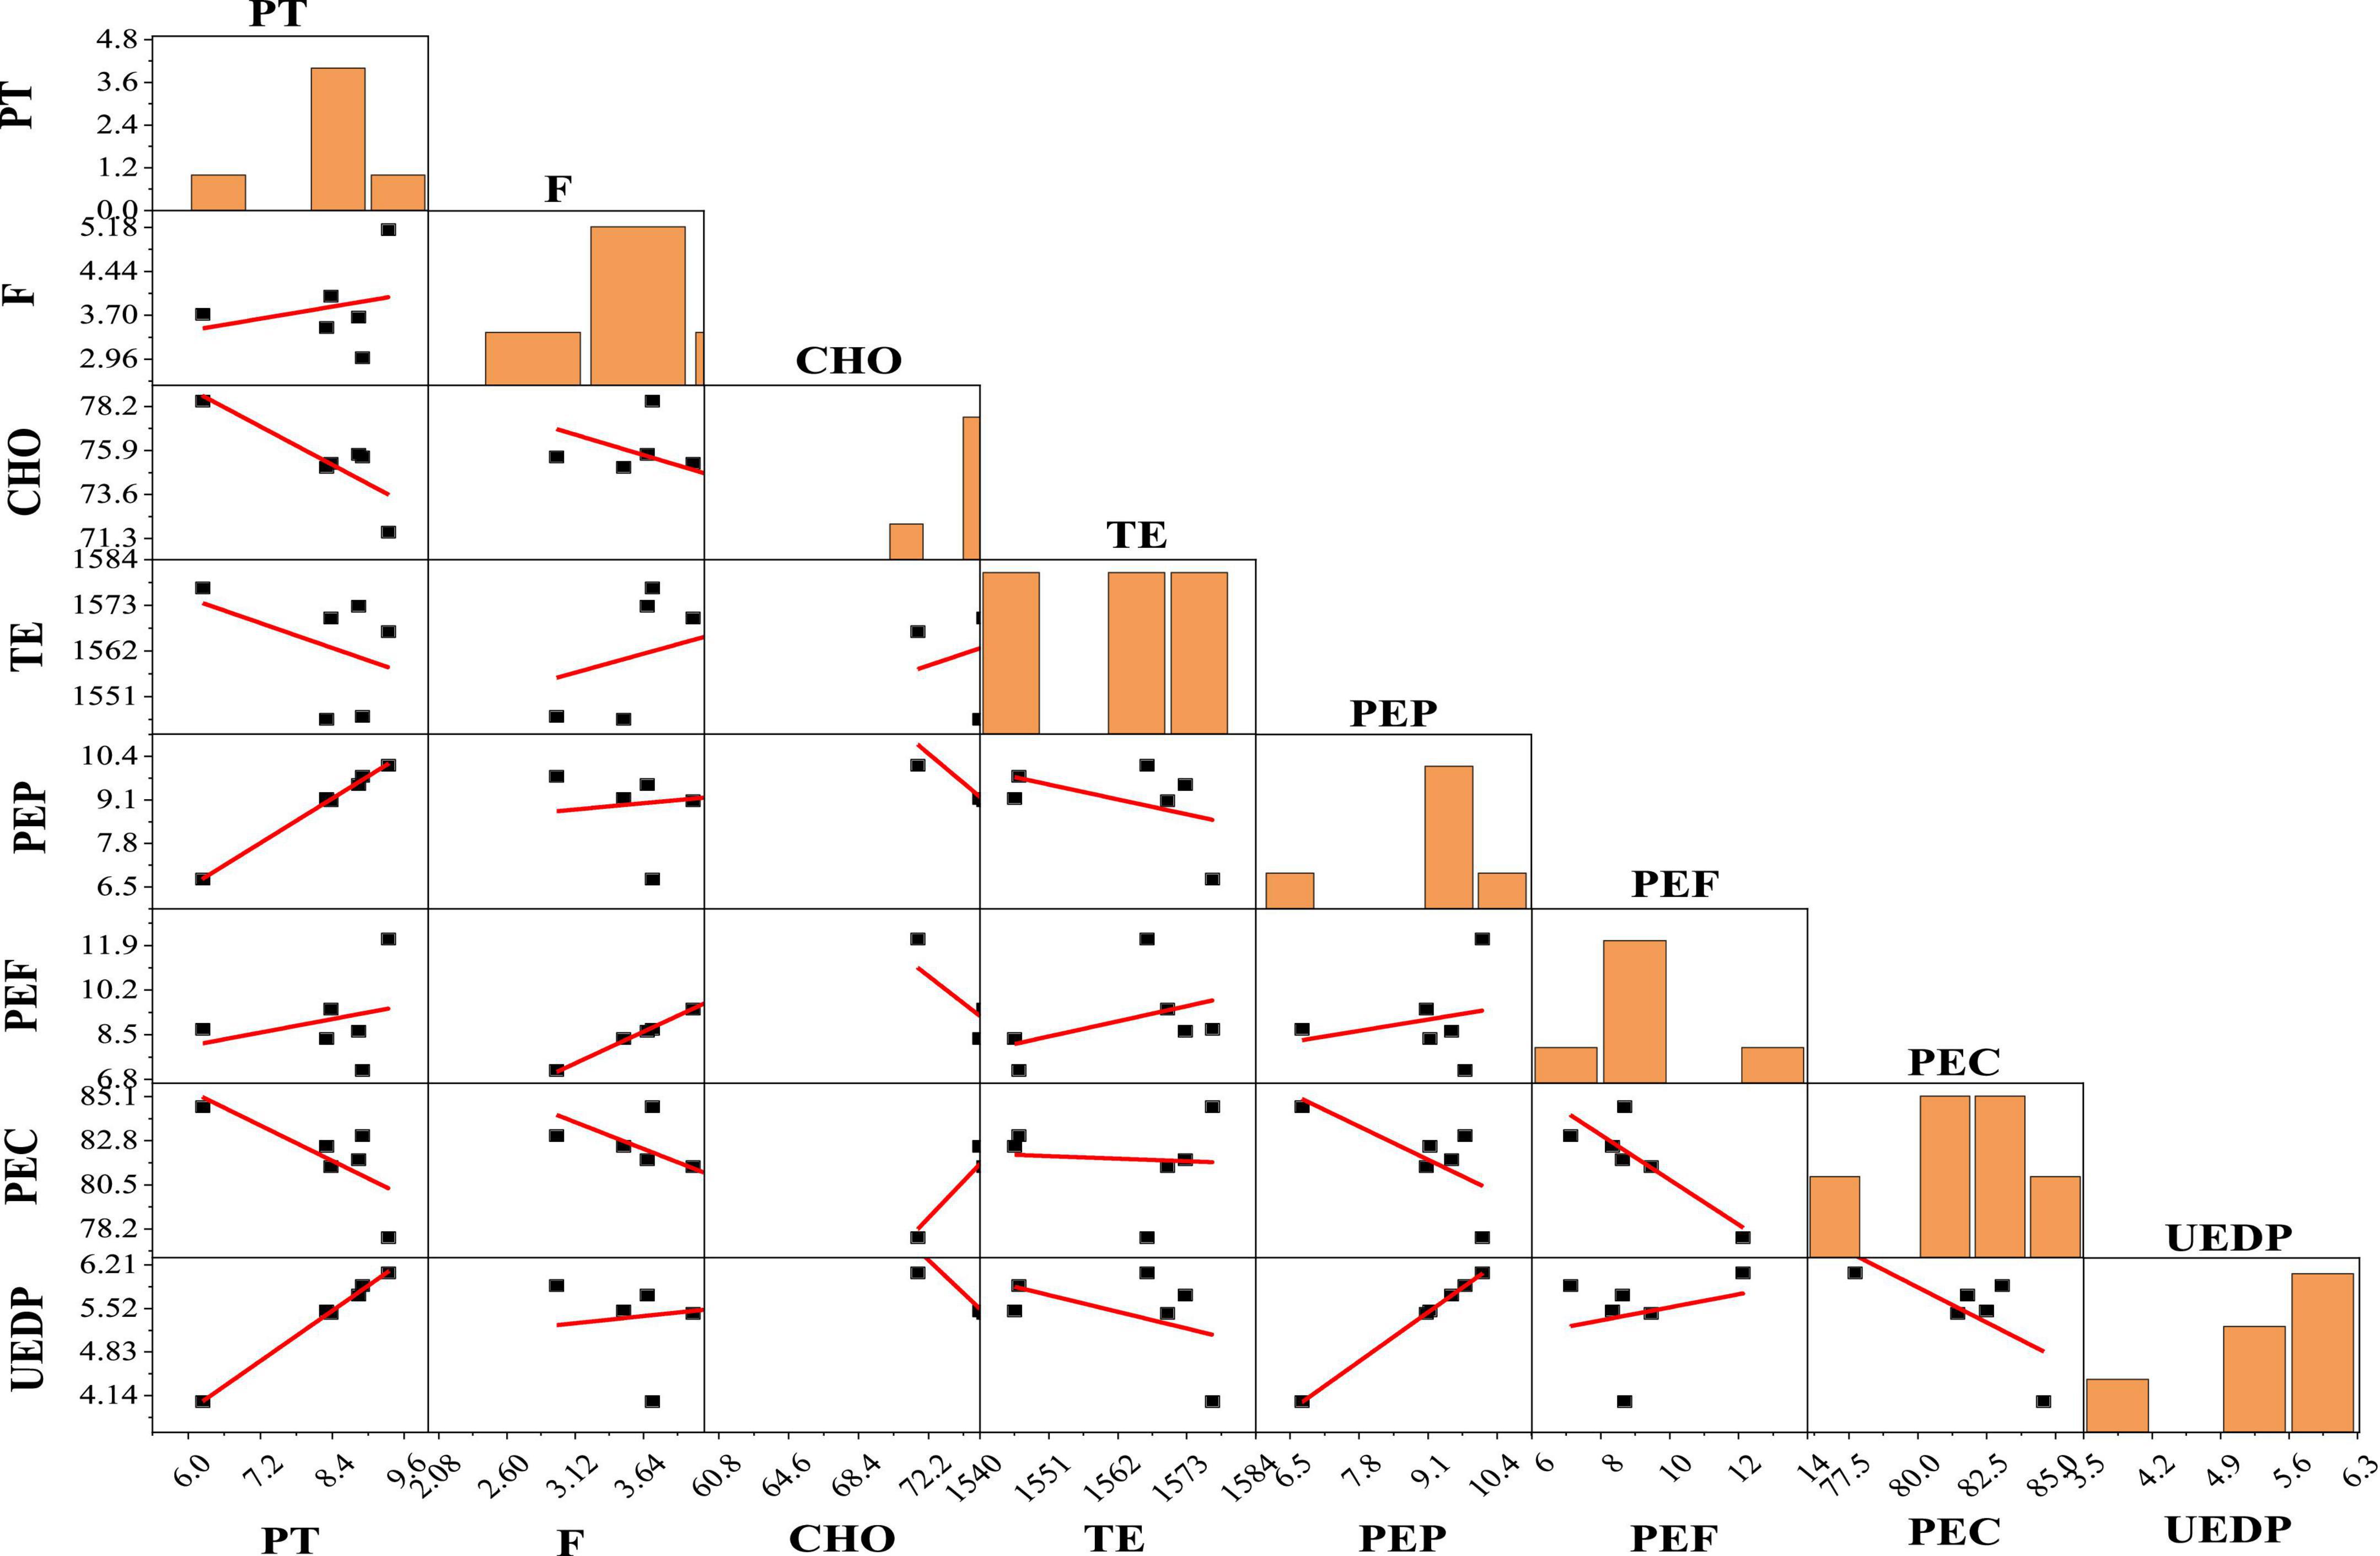
Figure 2. Scatterplot matrix analysis of protein (PT), fat (F), carbohydrate (CHO), and energy values contributions. TE, total energy; PEP, proportion of total energy due to protein; PEF, proportion of total energy due to fat; PEC, proportion of total energy due to carbohydrate; UEDP, utilizable energy due to protein.
Amylose analysis
The amylose content affects the physicochemical and functional properties of flour and starch (22, 26). The amylose contents of JZ 34, LZ 19, JN 3, JZ 127, JN 2, and JX were 15.61, 17.32, 8.00, 19.30, 8.00, and 15.68%, respectively (Figure 3). In our studies, JZ 127 had the highest amylose content (19.30%), whereas JN 3 (8.00%) and JN 2 (8.00%) had the lowest amylose content.
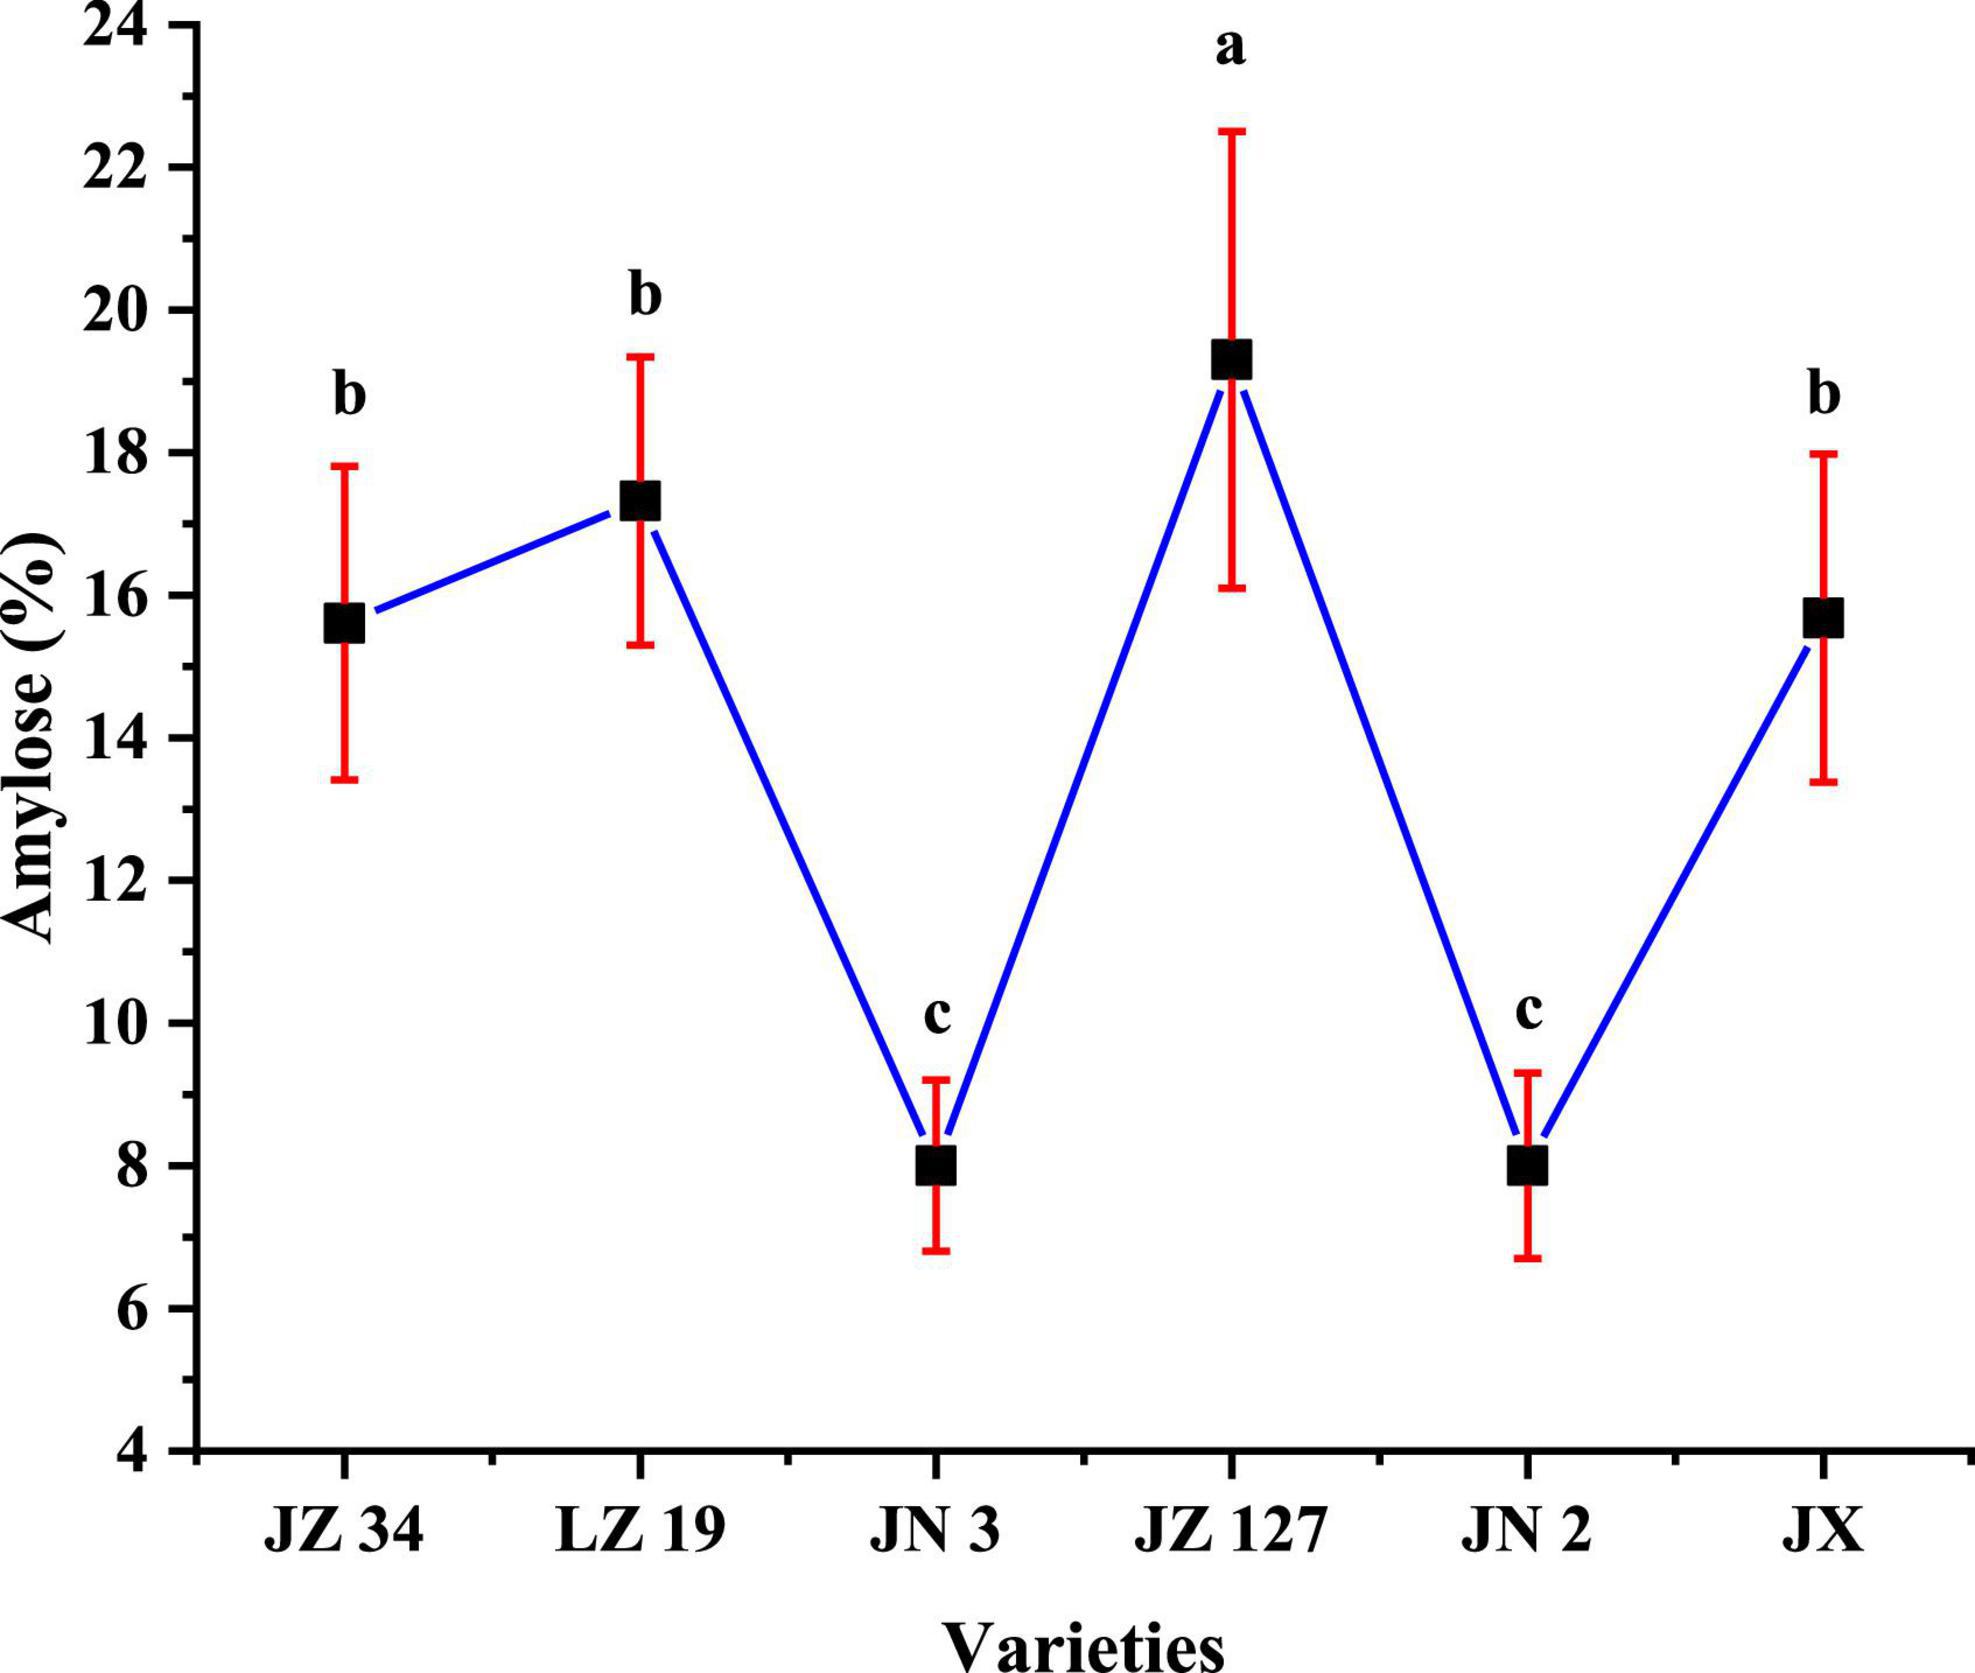
Figure 3. Amylose content of sorghum flours. JZ 34, jinza 34; LZ 19, liaoza 19; JN 3, jinnuo 3; JZ 127, jiza 127; JN 2, jiniang 2; JX, jiaxian. The data showed the mean of three replications, and error bars are standard deviations. Different letters (a–c) indicate there were significant differences (p < 0.05) in the LSD mean comparisons between the treatments mean.
Minerals and anti-nutritional quality traits of sorghum
In the present study, the different sorghum flours significantly affected the mineral contents (Table 5). However, the highest values of calcium (0.04%), phosphorus (0.35%), potassium (0.38%), sodium (0.05%), magnesium (0.19%), iron (50.00%), manganese (16.30%), and zinc (15.40%) were found in JN 3. Sorghum grains have higher mineral contents than other cereals, including rice (49), wheat (50), millet (51), and maize (52).
Anti-nutritional contents, such as tannin, flavonoids, and total phenols, are shown in Figure 4. Sorghum consists of two main anti-nutritional factors, namely, tannin and total phenols, which are located in the grain (53). The major anti-nutritional effects of tannins are reduction in feed intake, thus diminishing the digestibility and utilization of nutrients and adversely affecting the metabolism and toxicity in the livestock industry (53). Khoddami et al. (38) and Shen et al. (41) reported that the level of tannins present in sorghum can be the dominant factor that influences its nutritional value for food and non-food industries. In our studies, JN 3 flour had the highest tannin (1.46%), flavonoid (23.19 mg/g), and total phenol (5.57 mg/g) contents than other sorghum flours (Figures 4A–C). Tannin contents ranged from 0.01 to 2.12% (54) who studied 110 Chinese sorghum grains for determination of tannin contents by near-infrared reflectance spectroscopy (NIRS) and designated as tannin-free. The grains of all sorghums were observed free of tannin. Awika (55) stated that sorghums lacking a pigment testa are considered “free of tannin.” Different grain colors in the same species and growing environment (41, 56), result in differences in the total phenol contents of varieties.
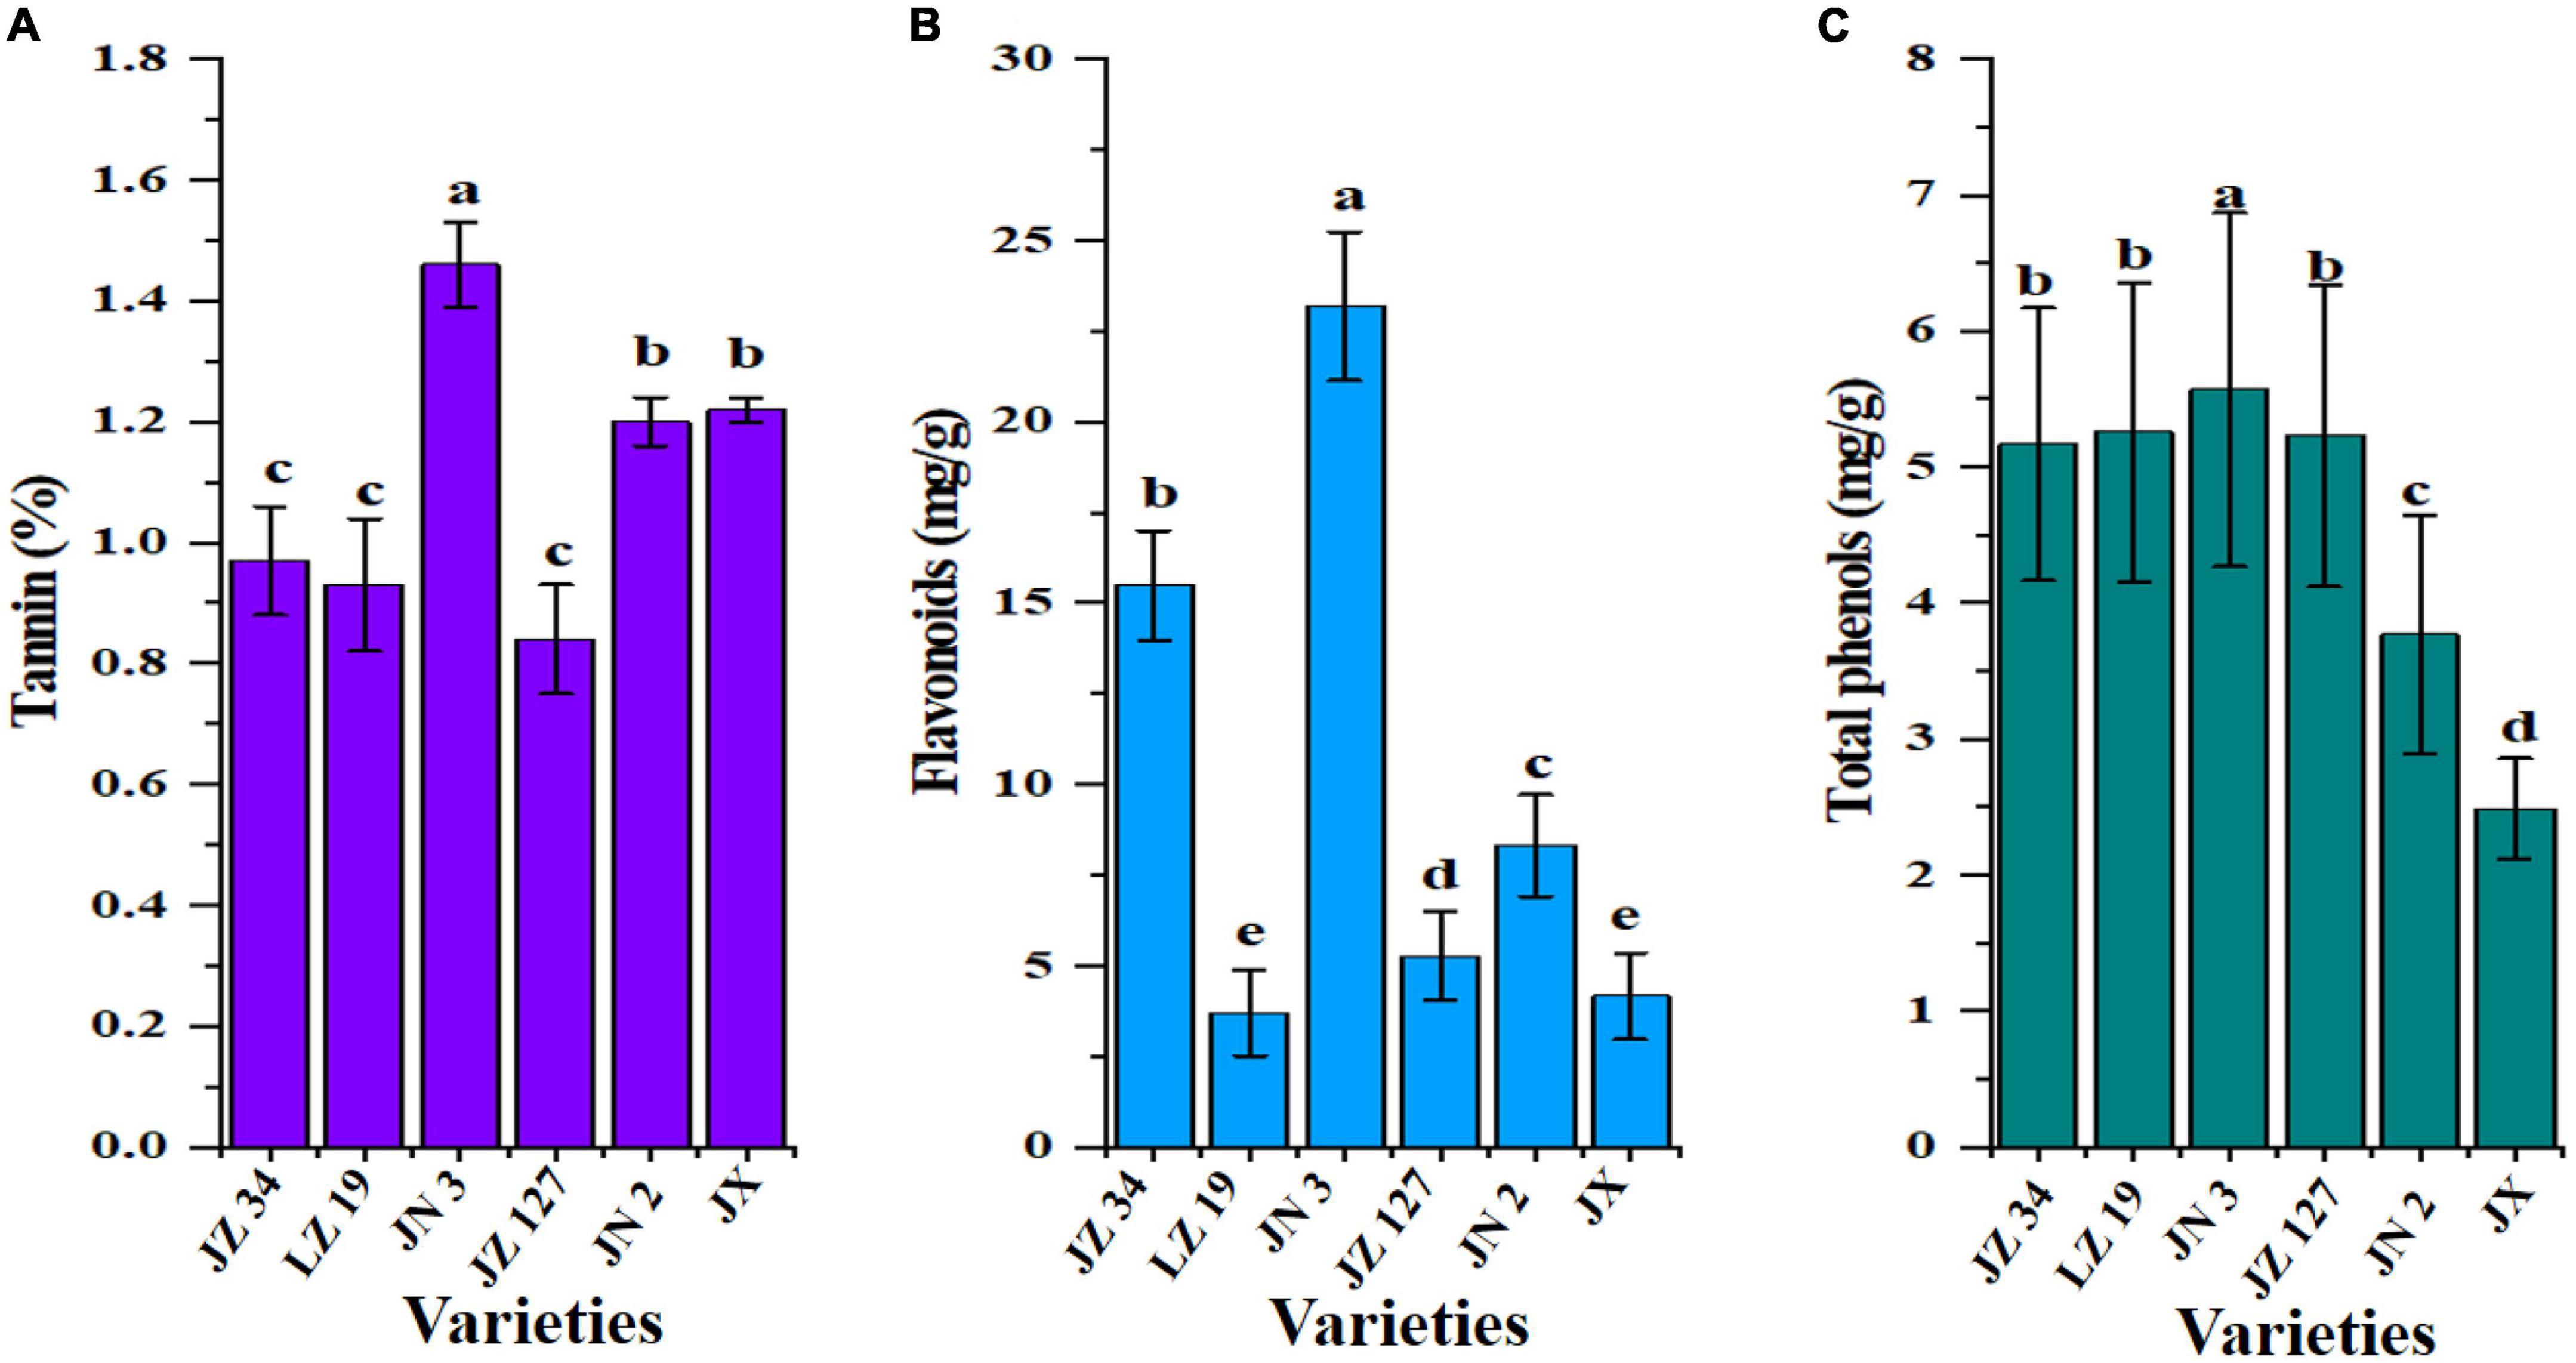
Figure 4. Anti-nutritional factors of six sorghum grains, tannin (A), flavonoids (B), and total phenols (C). JZ 34, jinza 34; LZ 19, liaoza 19; JN 3, jinnuo 3; JZ 127, jiza 127; JN 2, jiniang 2; JX, jiaxian. The data showed the mean of three replications, and error bars are standard deviations. Different letters (a–e) indicate there were significant differences (p < 0.05) in the LSD mean comparisons between the treatments mean.
Amino acid composition analysis
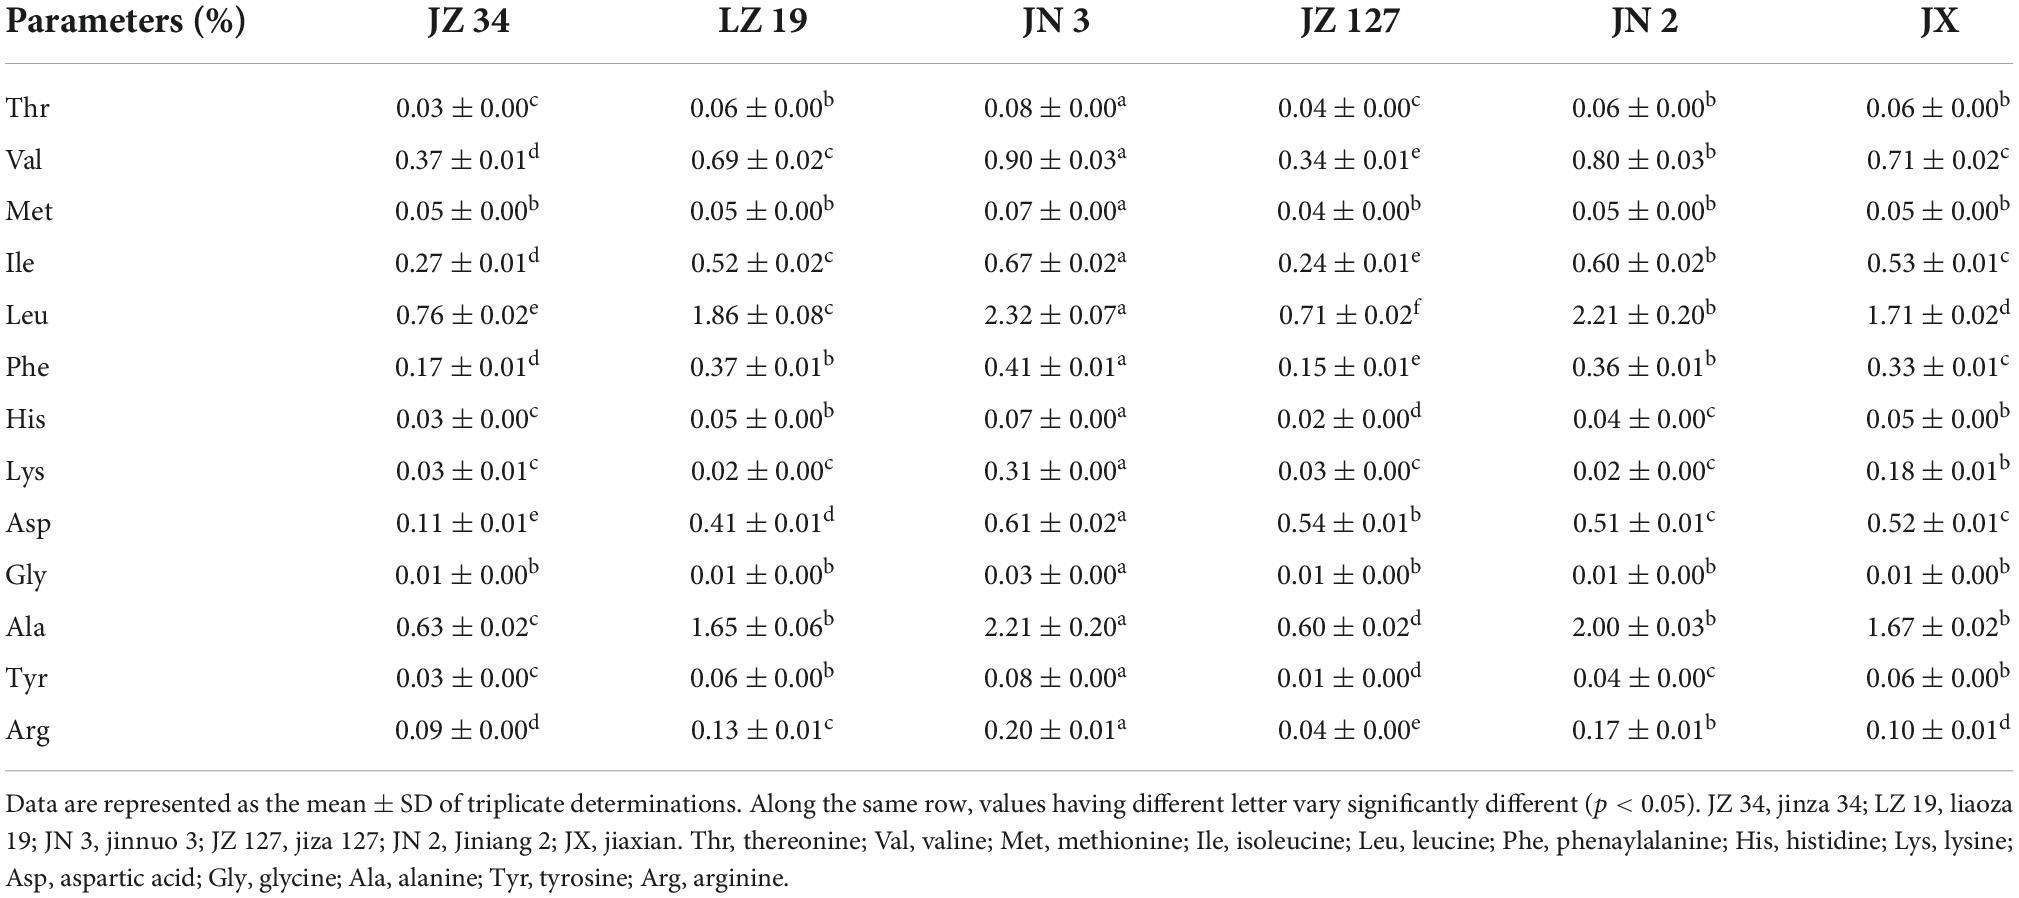
The AA contents of different sorghum varieties are summarized in Table 6. JN 3 had the highest essential contents of essential (Thr, Val, Met, Ile, Leu, and Phe), basic (Arg, His, and Lys), acidic (Asp), hydrophobic (Ala), and polar uncharged (Gly and Tyr) AAs. A high Arg content can be used for the treatment of cardiovascular diseases (57, 58). Lys is the first limiting AA in cereal grains, which are staple food (57). Li et al. (21) reported that Glu and Asp are the primary AAs of seed storage PT, and are acidic AA. A high concentration of hydrophobic AA (Ala) affected the functional properties of PTs and provided the dense internal structure of PT form, thus improving its thermal stability (59, 60). In summary, our result showed that JN 3 sorghum grain had remarkable potential for nutritional supplement in industrial food applications.
Functional properties
Among other sorghum grains, JN 2 had the highest LT (34.01%, Figure 5A). Sindhu and Khatkar (26) reported that the AM content affects the transmittance value of paste, which can be responsible for the difference in the turbidity of sorghum flour in the current study. JN 2 had the highest LT (34.01%) and decreased AM content, and these findings were consistent with some studies pointing out that an increase in AM content will decreases the transparency of flour paste (61). The WAC is the ability of the flour to maintain water against gravity and is improved by PT and CHO by supporting hydrophilic parameters, like polar and charged side chains (26). The WAC of different sorghum varieties ranged from 103.43 to 132.86%, and among the samples, JN 2 had the highest WAC (132.86%, Figure 5B). In the food industry, the role of OAC is the interaction between the non-polar AA side chains and hydrocarbon chains of lipid to determine mouthfeel and flavor retention of products (62). As shown in Figure 5C, JN 2 had high OAC (140.52%), whereas JZ 34 had the lowest OAC (111.09%).
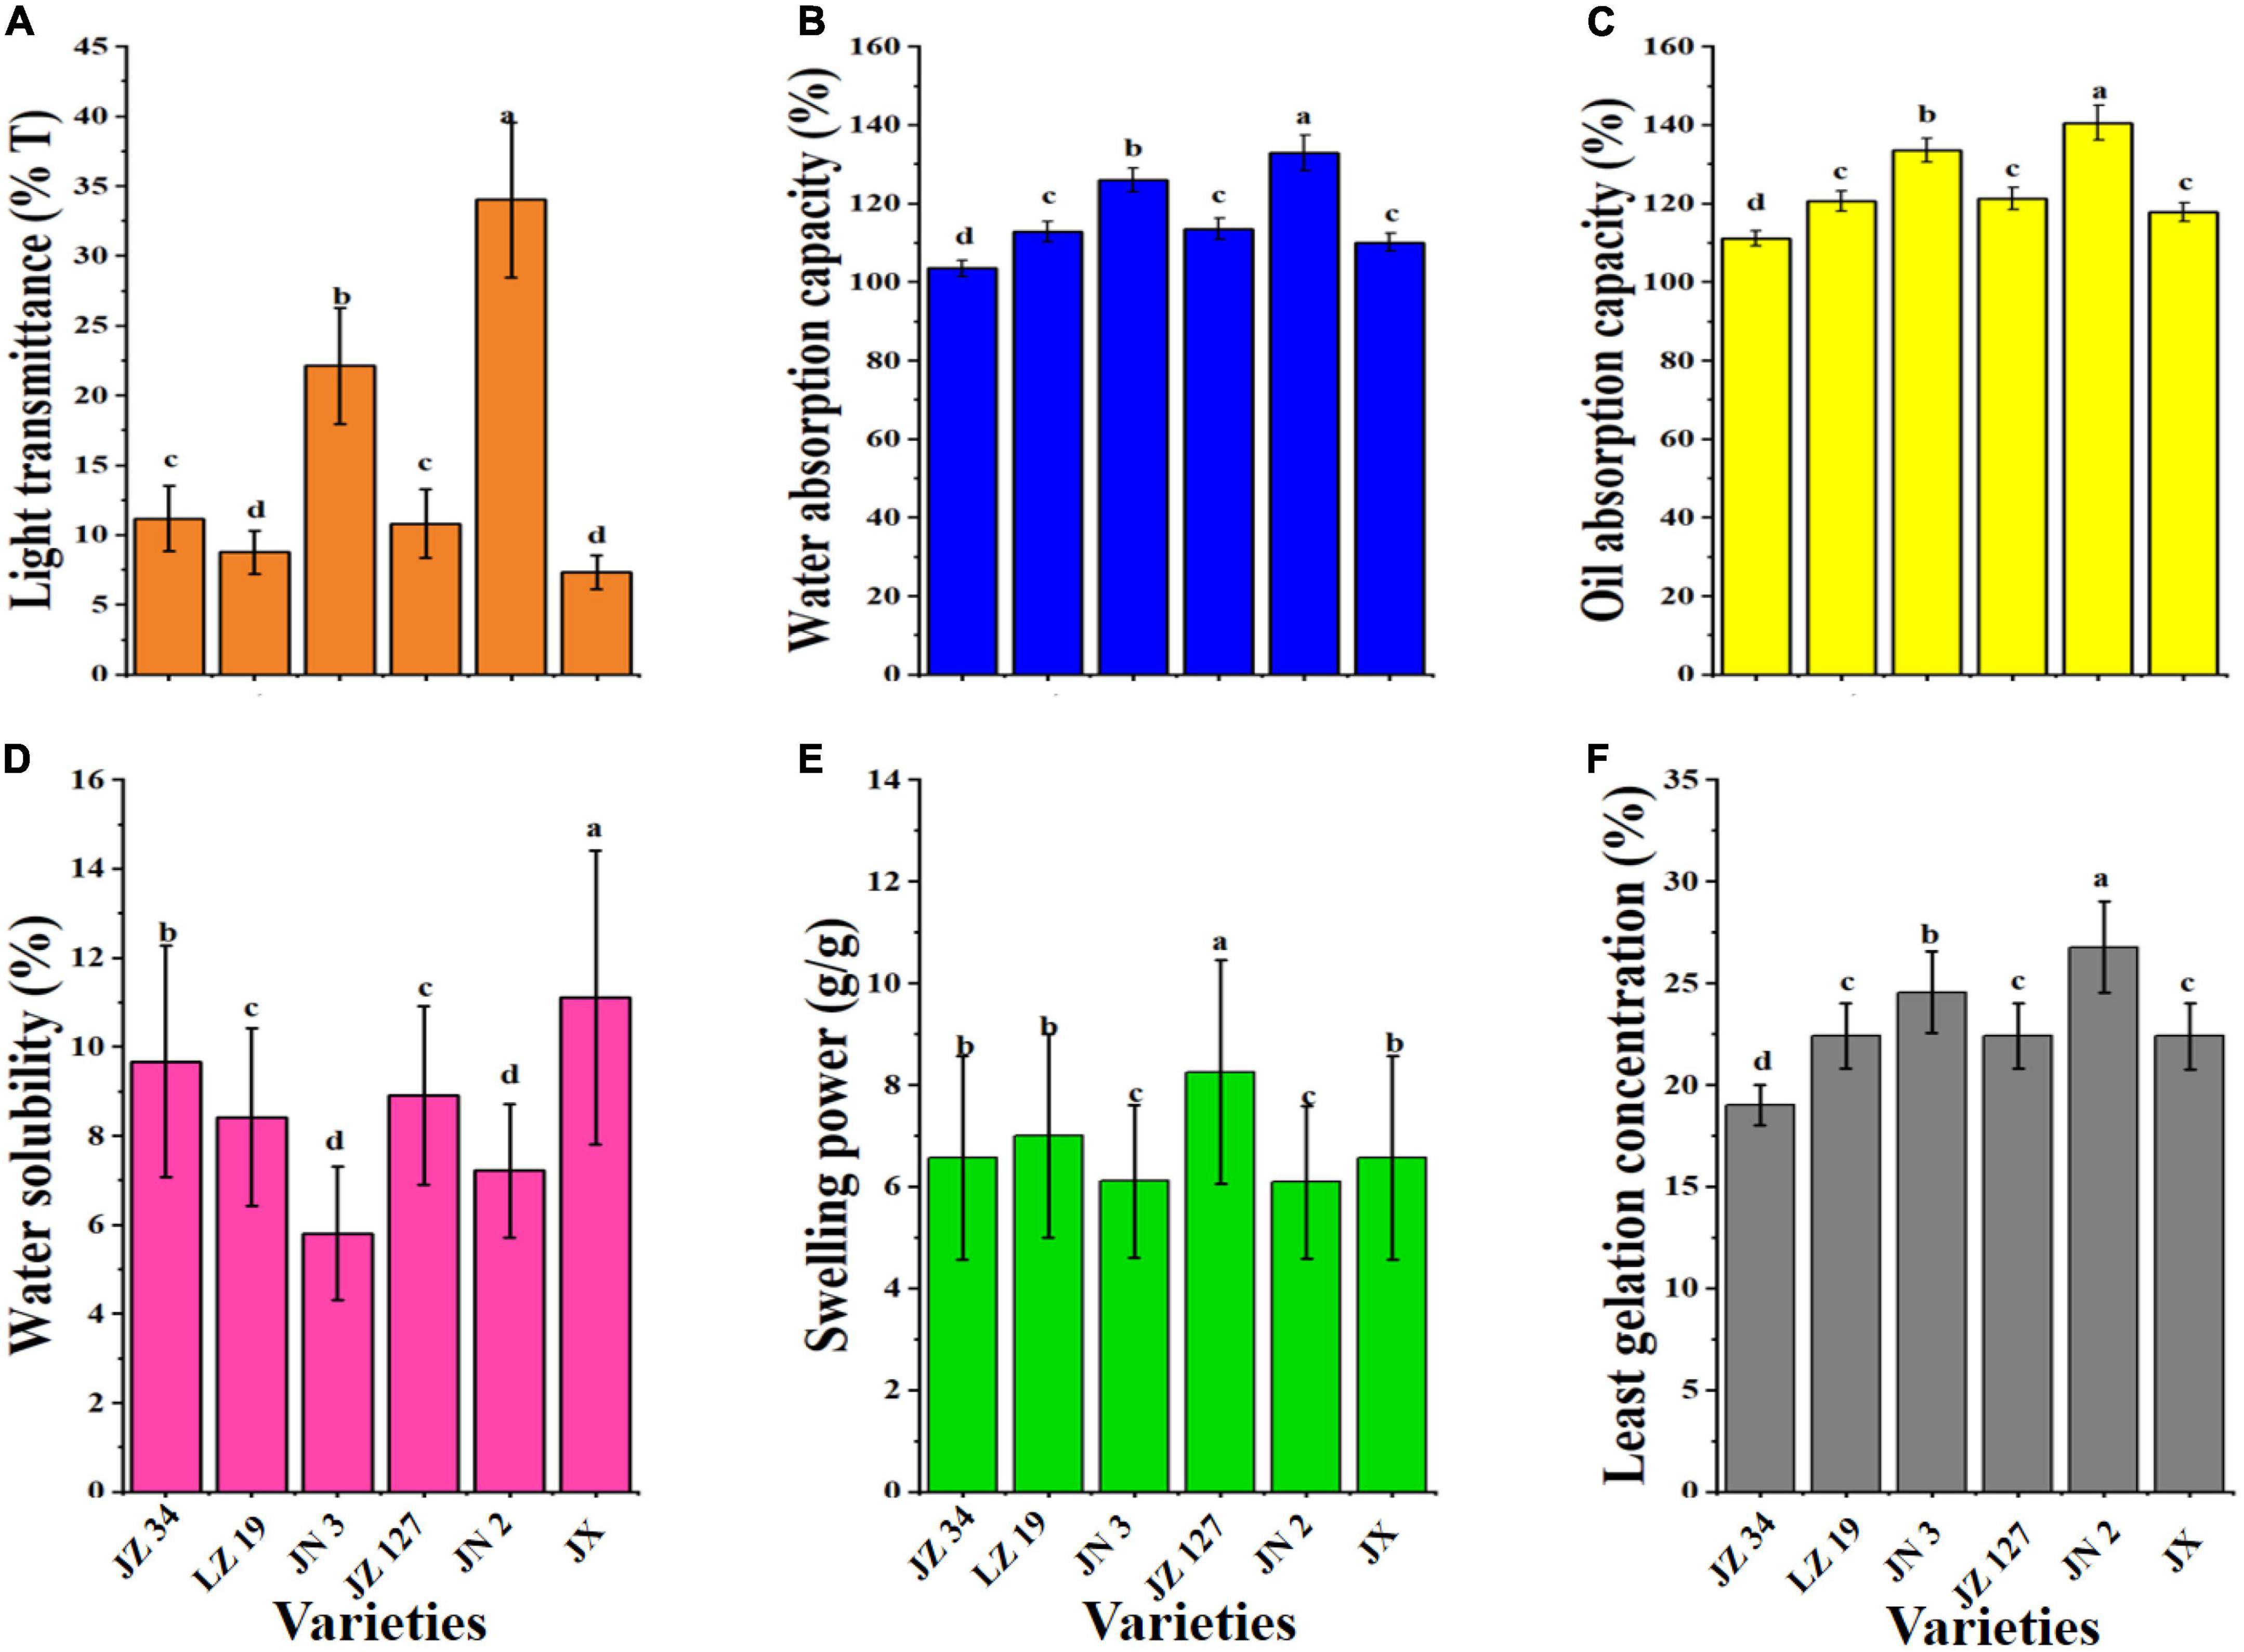
Figure 5. Functional properties of sorghum grains. Light transmittance (A), water absorption capacity (B), oil absorption capacity (C), water solubility (D), swelling power (E), and least gelation concentration (F). JZ 34, jinza 34; LZ 19, liaoza 19; JN 3, jinnuo 3; JZ 127, jiza 127; JN 2, jiniang 2; JX, jiaxian. The data showed the mean of three replications, and error bars are standard deviations. Different letters (a–d) indicate there were significant differences (p < 0.05) in the LSD mean comparisons between the treatments mean.
The functions of SP and WS are the disruption and breakage of hydrogen bonds between water molecules and AM and amylopectin (63). JX had the highest WS (11.11%), and JN 2 had the lowest WS (7.22%, Figure 5D). Figure 5E shows that JZ 127 had the highest SP (8.25 g/g) compared with other treatments. In our study, among sorghum varieties, SP and WS were different, which might be due to the AM content (9, 26). Uarrota et al. (42) and Yang et al. (23) reported that AM inhibits the SP and WS in the physicochemical properties of cereal starch. The LGC is the amount of starch and gelation of pasting properties (26). The LGC of JZ 34, LZ 19, JN 3, JZ 127, JN 2, and JX were 19.00, 22.42, 24.55, 22.40, 26.77, and 22.39%, respectively (Figure 5F). In our studies, JN 2 had the highest LGC (26.77%), whereas JZ 34 had the lowest LGC (19.00%). LGC could be added as composite food for curd formation and could be used as additives of food materials for forming gel in food products (64). The low LGC of flour is required for improved gelling formation of PT ingredients, and resulting in increased SP of the flour (65, 66).
Correlation heatmap analysis
The Pearson correlation results of amylose, starch, physical properties, micrometric properties, and functional properties of six sorghum grains are presented in Figure 6. BD was positively correlated with TPD (r = 0.996) and TD (r = 0.997). TD had a strong positive correlation with TPD (r = 0.998), whereas CI had highly positive association with P (r = 0.813). AR had a strongly significant positive correlation with HR (r = 1.000). WAC had a highly positive correlation with LT (r = 0.909). By contrast, WAC was negatively correlated with CI (r = -0.819). OAC had a highly negative correlation with CI (r = -0.819) and a highly positive association with LT (r = 0.909). Furthermore, OAC had a strongly significant positive correlation with WAC (r = 1.000). LGC was strongly and negatively correlated with CI (r = -0.933). Moreover, LGC was strongly and positively correlated with WAC (r = 0.967) and OAC (r = 0.967). AM showed a highly negative association with LT (r = -0.873), WAC (r = -0.817), and OAC (r = -0.817). In addition, AM had a highly positive relationship with WS (r = 0.714) and SP (r = 0.824).
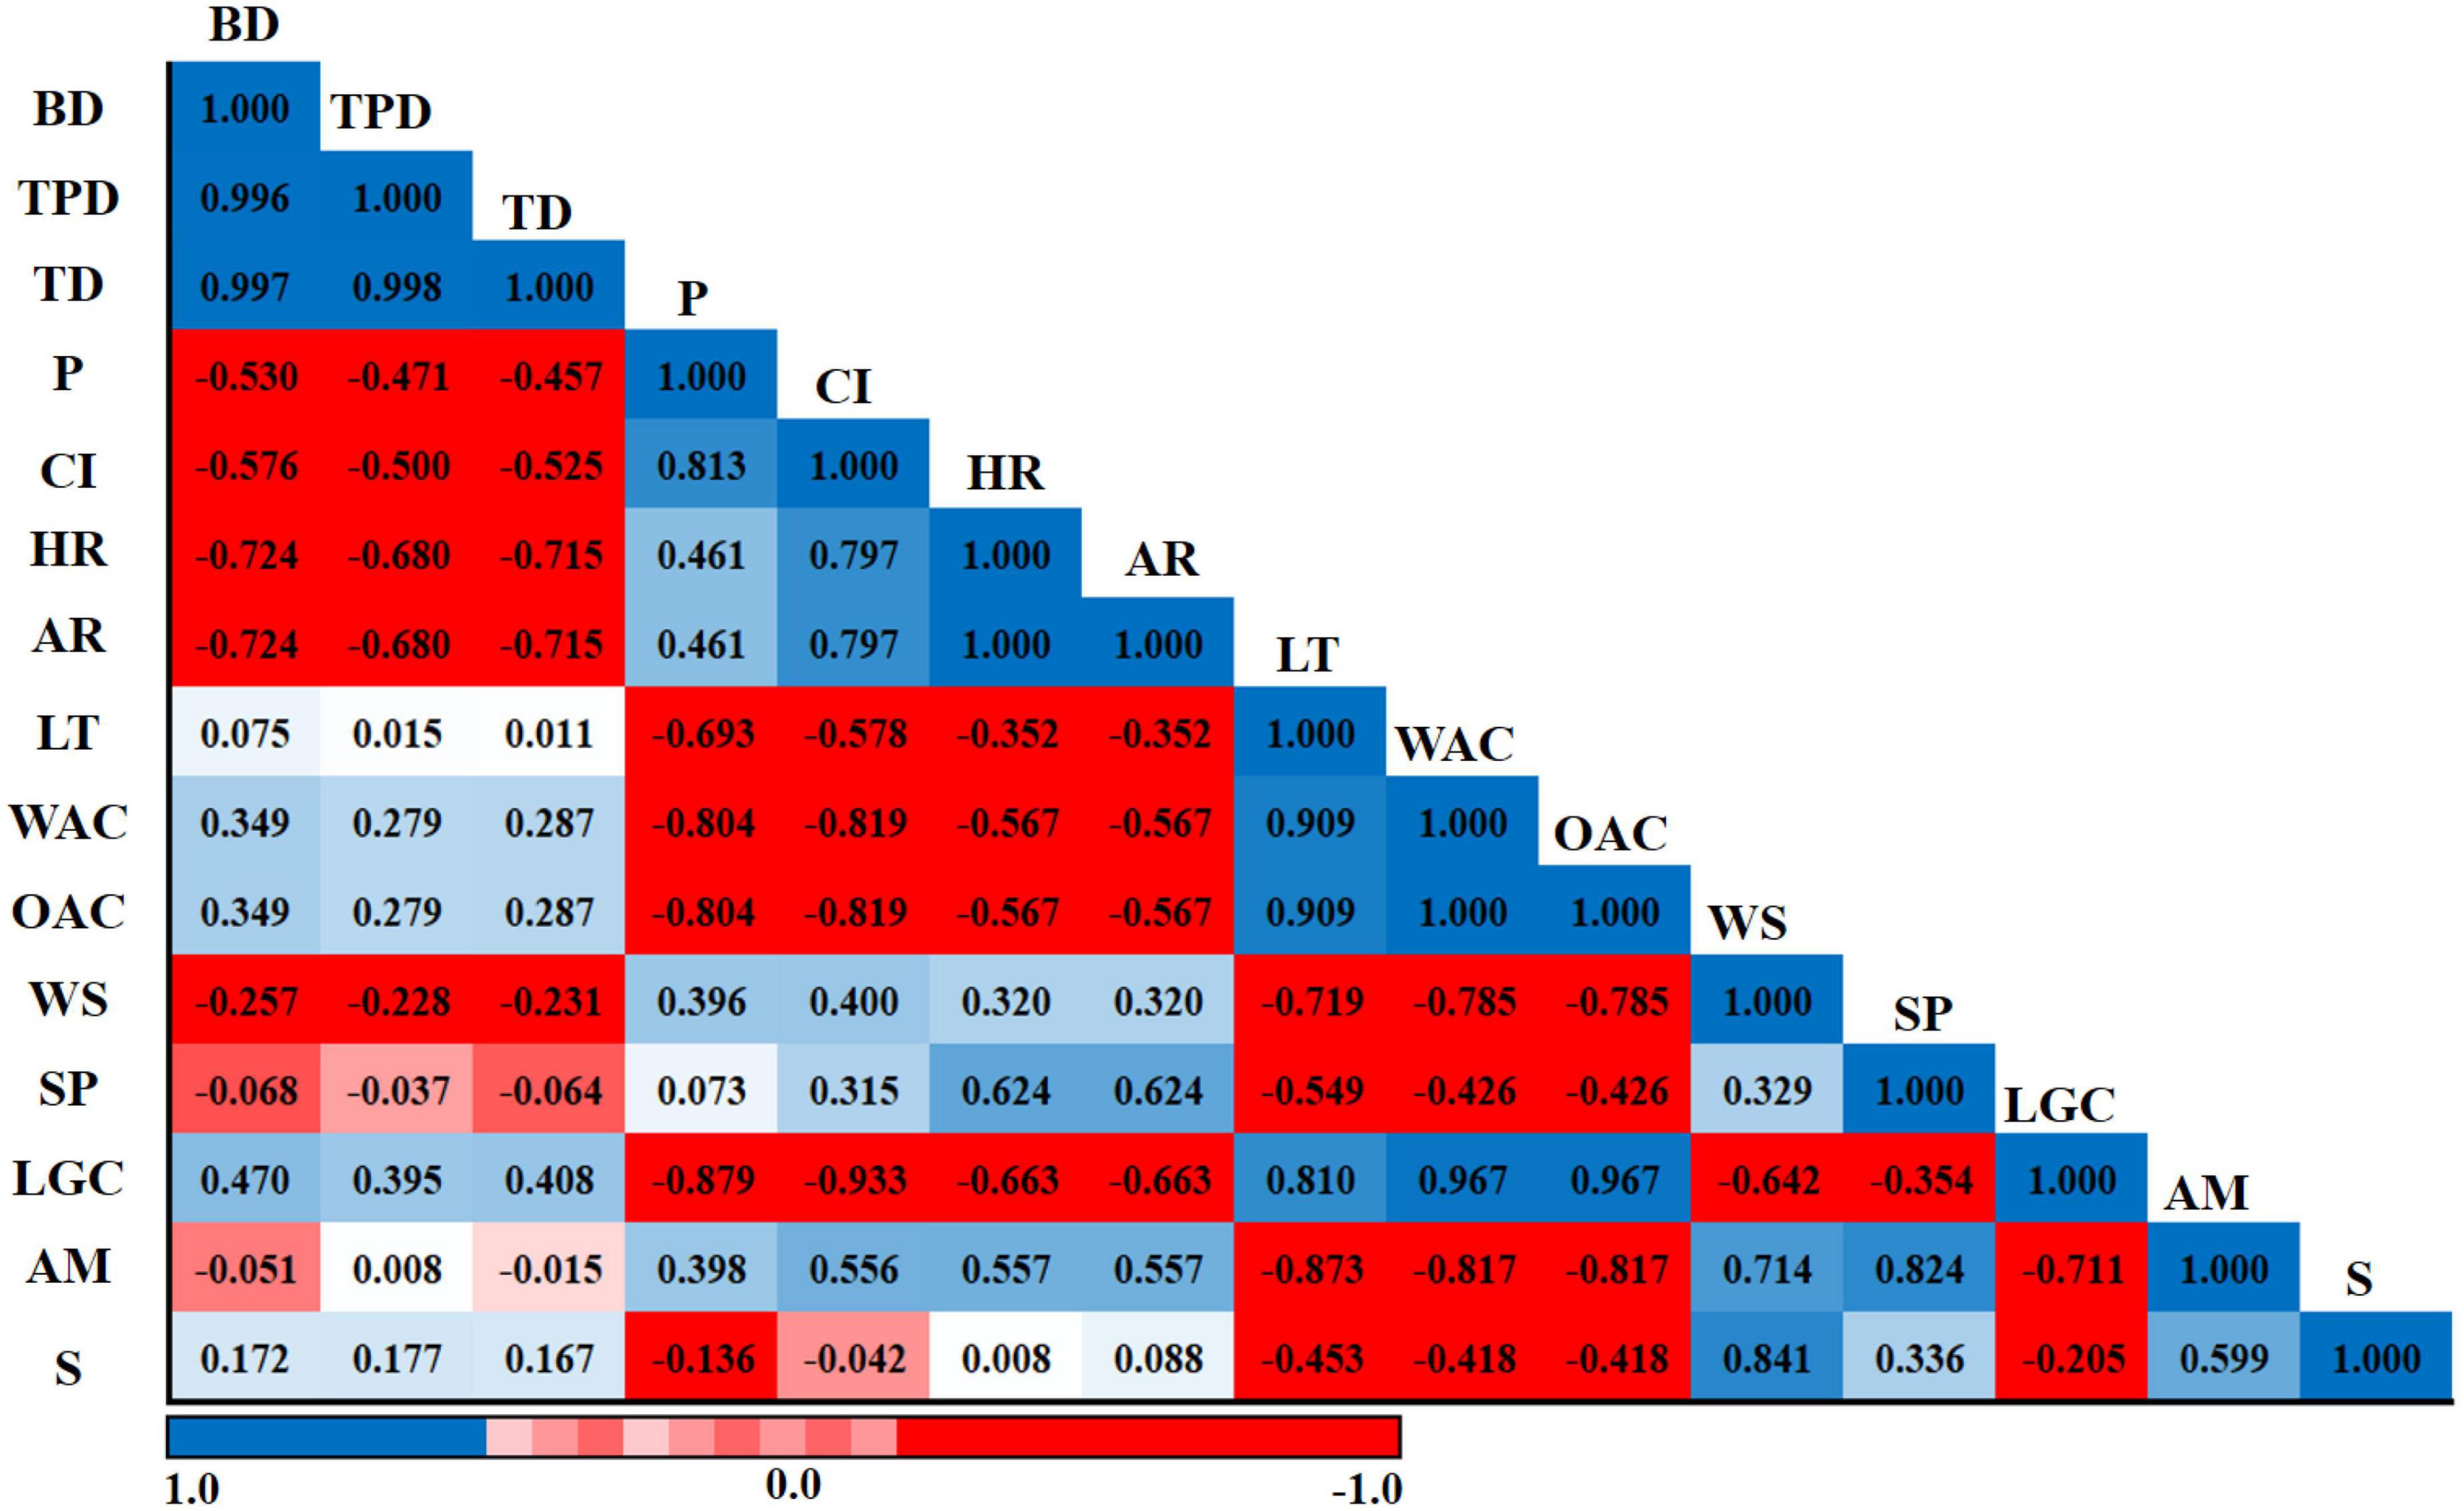
Figure 6. Pearson’s correlation coefficients of amylose, starch, physical properties, micrometric properties, and functional properties of six sorghum grains. BD, bulk density; TPD, tapped density; TD, true density; P, porosity; CI, Carr’s index; HR, Hausner’s ratio; AR, angle of repose; LT, light transmittance; WAC, water absorption capacity; OAC, oil absorption capacity; WS, water solubility; SP, swelling power; LGC, least gelation concentration; AM, amylose; S, starch. The numbers in each field represent the correlation extent; the color represents significant correlation (p < 0.05); the deeper the color of the field, the more significant the correlation (p < 0.01). The blue color means a positive correlation, and the red color means a negative correlation.
Conclusion
We studied the physical properties, nutritive quality, and functional properties of six different sorghum varieties. The flour of JN 127 had the highest amylose content. The physical properties of LZ 19 were better than those of other sorghum grains, and JZ 34 had the best micrometric properties. JX produced higher SY and was suitable as a frozen food thickener or food additive and raw material for porridge, couscous, and mayonnaise. All sorghums were free of tannin. Among the six sorghum grains, JN 3 had the highest proximate, mineral, and AA compositions and energy contributions. The six sorghum grains had differences in functional properties, including LT, WAC, OAC, WS, SP, and LGC of flours as composite flours products in sorghum for healthy food. Our results indicated that JN 3 could be utilized for brewing sorghum grain and liquor flavor and could be effective materials for functional foods to improve health. Our assessments in future will stimulate the utilization of sorghum as a potential crop in dryland sustainable agro-ecosystems and rural livelihood nutritional security in arid and semiarid regions of northern China.
Data availability statement
The original contributions presented in this study are included in the article/supplementary material, further inquiries can be directed to the corresponding author.
Author contributions
MH: conceptualization, investigation, methodology, data, software, writing—original draft preparation, and writing—review and editing. BF: writing—review and editing, supervision, funding acquisition, project administration, and resources. HW and LT: investigation and methodology. VY: writing—review and editing. All authors have read and approved the final version of the manuscript.
Funding
This research was funded by the National Key Research and Development Program of China (2019YFD1000700 and 2019YFD1000702), the National Millet Crops Research and Development System (CARS-06-13.5-A26), Minor Grain Crops Research and Development System of Shaanxi Province (2009-2021), and the Shaanxi Province Agricultural Collaborative Innovation and Extension Alliance Project (LMZD201803).
Acknowledgments
We express our special gratitude to the funding source for their financial assistance and thankful to the reviewers for their valuable comments on the manuscript.
Conflict of interest
The authors declare that the research was conducted in the absence of any commercial or financial relationships that could be construed as a potential conflict of interest.
Publisher’s note
All claims expressed in this article are solely those of the authors and do not necessarily represent those of their affiliated organizations, or those of the publisher, the editors and the reviewers. Any product that may be evaluated in this article, or claim that may be made by its manufacturer, is not guaranteed or endorsed by the publisher.
References
1. Diao X. Production and genetic improvement of minor cereals in China. Crop J. (2017) 5:103–14. doi: 10.1016/j.cj.2016.06.004
2. Liu C, Gong X, Zhao G, Soe Htet MN, Jia Z, Yan Z, et al. Liquor flavor is associated with the physicochemical property and microbial diversity of fermented grains in waxy and non-waxy sorghum (Sorghum bicolor) during fermentation. Front Microbiol. (2021) 12:618458. doi: 10.3389/fmicb.2021.618458
3. Duvvada SK, Maitra S. Sorghum-based intercropping system for agricultural sustainability. Indian J Nat Sci. (2020) 10:20306–13. doi: 10.3390/plants11121574
4. Xu J, Wang W, Zhao Y. Phenolic compounds in whole grain sorghum and their health benefits. Foods. (2021) 10:1921. doi: 10.3390/foods10081921
5. Cardoso LD, Pinheiro M, Martino SS, Pinheiro-Sant’Ana HS, Pinheiro-Sant’Ana HM. Sorghum (Sorghum bicolor L.): nutrients, bioactive compounds, and potential impact on human health. Criti Rev Food Sci Nutr. (2017) 57:372–90.
6. Yun X, Zhang PZ, Robyn DW, Fang ZX. Sorghum grain: from genotype, nutrition, and phenolic profile to its health benefits and food applications. Compr Rev Food Sci Food Saf. (2019) 18:2025–46. doi: 10.1111/1541-4337.12506
7. Liang D, Lu X, Zhuang M, Shi G, Hu C, Wang S, et al. China’s greenhouse gas emissions for cropping systems from 1978 -2016. Sci Data. (2021) 8:171.
8. Somu G, Meena N, Shashikumar C, Shivaray N, Druvakumar M, Kanavi MSP, et al. Evaluation of sorghum based intercropping system for yield maximization in sorghum. Ind J Pure App Biosci. (2020) 8:145–9. doi: 10.18782/2582-2845.7982
9. Soe Htet MN, Wang H, Tian L, Yadav V, Samoon HL, Feng B. Integrated starches and physicochemical characterization of sorghum cultivars for an efficient and sustainable intercropping model. Plants. (2022) 11:1574.
10. Feng L, Raza MA, Chen Y, Khalid MHB, Meraj TA, Ahsan F, et al. Narrow-wide rowplanting pattern improves the light environmental and seed yields of intercrop species in relay intercropping system. PLoS One. (2019) 14:e0212885. doi: 10.1371/journal.pone.0212885
11. Zhou Y, Li ZB, Zhang YQ, Wu Y, Huang J. Effects of planting density and nitrogen rate in main season on ratooning yield of sorghum. J China Agric Univ. (2021) 26:43–53. doi: 10.11841/j.issn.1007-4333.2021.08.05
12. Mourtzinis S, William JW, Conley SP. Feasibility of a grain sorghum ratoon cropping system in Southeastern Missouri. Crop Forage Turfgrass Manag. (2016) 2:1–7. doi: 10.2134/cftm2015.0215
13. Raza MA, Feng LY, Iqbal N, Ahmed M, Chen YK, Khalid MHB, et al. Growth and development of soybean under changing light environments in relay intercropping system. PeerJ. (2019) 7:e7262. doi: 10.7717/peerj.7262
14. Bhagat GJ, Giri DG, Pagar PC, Hadole SS. Effect of integrated nutrient management on yield attributes, yield and economics of sorghum base intercropping systems. Int J Curr Microbiol App Sci. (2020) 9:563–9.
15. Arshad M, Nawaz R, Ahmad S, Shah GA, Faiz F, Ahmad N, et al. Growth yield and nutritional performance of sweet sorghum and legumes in sole and intercropping influenced by type of legume, nitrogen level and air quality. Pol J Environ Stud. (2020) 29:533–43. doi: 10.15244/pjoes/104461
16. Zhou Y, Huang J, Li Z, Wu Y, Zhang J, Zhang Y. Yield and quality in main and ratoon crops of grains sorghum under different nitrogen rates and planting densities. Front Plant Sci. (2022) 12:778663. doi: 10.3389/fpls.2021.778663
17. Zhu F. Structure, physicochemical properties, modifications, and uses of sorghum starch. Compr Rev Food Sci Food Saf. (2014) 13:597–610. doi: 10.1111/1541-4337.12070
18. Xiong Y, Zhang P, Luo J, Johnson S, Fang Z. Effect of processing on the phenolic contents, antioxidant activity and volatile compounds of sorghum grain tea. J Cereal Sci. (2019) 85:6–14. doi: 10.1016/j.jcs.2018.10.012
19. Ghada AA, Ola SI, Mona MAA. Physico-chemical characteristics of starches from different cereal grains. Am J Food Scie Technol. (2017) 5:125–34.
20. Adeyeye EI, Adesina AJ, Olaleye AA. Chemical and functional evaluations of raw, steeped and germinated sorghum bicolor. Anal Chem Ind J. (2018) 19:114.
21. Li C, Yang J, Yao L, Qin F, Hou G, Chen B, et al. Characterisation, physicochemical and functional properties of protein isolates from Amygdalus pedunculata Pall seeds. Food Chem. (2020) 311:125888. doi: 10.1016/j.foodchem.2019.125888
22. Sang Y, Bean S, Seib PA, Pederrsen J, Shi YC. Structure and functional properties of sorghum starches differing in amylose content. J Agric Food Chem. (2008) 56:6680–5. doi: 10.1021/jf800577x
23. Yang QH, Zhang WL, Luo Y, Li J, Gao JF, Yang P, et al. Comparison of structural and physicochemical properties of starches from five coarse grains. Food Chem. (2019) 288:283–90. doi: 10.1016/j.foodchem.2019.02.134
24. Yang QH, Zhang WL, Li J, Gong XW, Feng BL. Physicochemical properties of starches in proso (non-waxy and waxy) and foxtail millets (non-waxy and waxy). Molecules. (2019) 24:1743. doi: 10.3390/molecules24091743
25. Wang H, Yang Q, Gao L, Gong X, Qu Y, Feng B. Functional and physicochemical properties of flours and starches from different tuber crops. Int J Biol Macromol. (2020) 148:324–32. doi: 10.1016/j.ijbiomac.2020.01.146
26. Sindhu R, Khatkar BS. Physicochemical and functional properties of starch and flour of tartary buckwheat (Fagopyrum tataricum) grains. Int J Eng Res Technol. (2016) 5:315–20. doi: 10.17577/IJERTV5IS060432
27. Zhang XD, Feng JJ, Wang H, Zhu JC, Zhong YY, Liu IS, et al. Bivariate flow cytometric analysis and sorting of different types of maize starch grains. Cytometry A. (2018) 93:213–21. doi: 10.1002/cyto.a.23261
28. Gao JF, Kreft I, Chao GM, Wang Y, Liu XJ, Wang L, et al. Tartary buckwheat (Fagopyrum tataricum Gaertn.) starch, a side product in functional food production, as a potential source of retrograded starch. Food Chem. (2016) 190:552–8. doi: 10.1016/j.foodchem.2015.05.122
29. Menaka T, Nagaraja G, Yogesh DB, Sunil KUS, Prakash L. Physicochemical properties of flour and isolated starch from jack fruit seeds (Artocarpus heterophyllus L.). J Pharm Sci. (2011) 1:58–63.
30. Deepa M. Characterization of Native and Nano Sorghum Starch and its Application as an Edible Coating Base. Ph.D. thesis, Department of food science and nutrition, Periyar University, Tamilnadu, India (2015).
31. AOAC. Official Methods of Analysis. 17th ed. Gaithersburg, MD: The Association of Official Analytical Chemists (2000).
32. Udachan I, Iranna S, Sahoo AK, Hend GM. Extraction and characterization of sorghum (Sorghum bicolor L. Moench) starch. Int Food Res J. (2012) 19:315–9.
33. Yang QH, Zhang PP, Qu Y, Gao XL, Liang JB, Yang P, et al. Comparison of physicochemical properties and cooking edibility of waxy and nonwaxy proso millet (Panicum miliaceum L.). Food Chem. (2018) 257:271–8. doi: 10.1016/j.foodchem.2018.03.009
34. Rajput RD, Paithane VA, Taware AS, Patil RP. A comparative study on the proximate and mineral composition of non-leguminous fodder crops. Biosci Discov. (2017) 8:890–1.
35. Niyi OH, Jonathan AA, Ibukun AO. Comparative assessment of the proximaten mineral composition and mineral safety index of peel, pulp, and seeds of cucumber (Cucumis sativus). Open J Appl Sci. (2019) 9:691–701. doi: 10.4236/ojapps.2019.99056
36. AOAC. Official Methods of Analysis. 19th ed. Arlington, VA: The Association of Official Analytical Chemists (2012).
37. Shen P, Gao Z, Xu M, Ohm JB, Chen B. The impact of hempseed dehulling on chemical composition, structure properties and aromatic profile of hemp protein isolate. Food Hydrocoll. (2020) 106:105889. doi: 10.1016/j.foodhyd.2020.105889
38. Khoddami A, Mohammadrezaei M, Roberts TH. Effects of sorghum malting on colour, major classes of phenolics and individual anthocyanins. Molecules. (2017) 22:1713. doi: 10.3390/molecules22101713
39. Afify AM, El-Beltagi HS, Abd El-Salam SM, Omran AA, El-Salam SMA, Omran AA. Biochemical changes in phenols, flavonoids, tannins, vitamin E, β-carotene and antioxidant activity during soaking of three white sorghum varieties. Asian Pac J Trop Biomed. (2012) 2:203–9. doi: 10.1016/S2221-1691(12)60042-2
40. Margraf T, Karnopp AR, Rosso ND, Granato D. Comparison between folin-ciocalteu and prussian blue assays to estimate the total phenolic content of juices and teas using 96-well microplates. J Food Sci. (2015) 80:C2397–403. doi: 10.1111/1750-3841.13077
41. Shen S, Huang R, Li C, Wu W, Chen H, Shi J, et al. Phenolic compositions and antioxidant activities differ significantly among sorghum grains with different applications. Molecules. (2018) 23:1203. doi: 10.3390/molecules23051203
42. Uarrota VG, Amante ER, Demiate IM, Vieira F, Delgadillo I, Maraschin M. Physicochemical, thermal, and pasting properties of flours and starches of eight Brazilian maize landraces (Zea mays L.). Food Hydrocoll. (2013) 30:614–24. doi: 10.1016/j.foodhyd.2012.08.005
43. Thilagavathi T, Kanchana S, Banumathi P, Hemalatha G, Vanniarajan C, Sundar M, et al. Physico-chemical and functional characteristics of selected millets and pulses. Indian J Sci Technol. (2015) 8:147–55. doi: 10.17485/ijst/2015/V8IS7/70075
44. Devi U, Sharma GK. Effect of processing and storage on the physico-chemical properties of dry peas (Pisum sativum L.). J Food Sci Technol. (2007) 44:212–5.
45. Daung AT, Vo TT, Le VP. Analyzing 2D structure images of piezoelectric ceramic using ImageJ. Int J Mater Chem. (2014) 4:88–91. doi: 10.5923/j.ijmc.20140404.02
46. Rishi, Rana N. Particle size and shape analysis using Imagej with customized tools for segmentation of particles. Int J Eng Res Technol. (2015) 4:247–50.
47. Maheshwari R, Todke P, Kuche K, Raval N, Tekade RK. Micromeritics in pharmaceutical product development: dosage form design considerations. Adv Pharm Product Develop Res. (2018) 1:599–635. doi: 10.1016/B978-0-12-814423-7.00017-4
48. Eke-Ejiofor J, Oparaodu FO. Chemical, functional and pasting properties of flour from three millet varieties. Res J Food Nutr. (2019) 3:15–21.
49. Oko AO, Ugwu SI. The proximate and mineral compositions of five major rice varieties in Abakaliki, South-Eastern Nigeria. Int J Plant Physiol Biochem. (2011) 3:25–7. doi: 10.5897/IJPPB.9000045
50. Choi I, Kang CS, Hyun JN, Choon K, Lee CK, Park KG. Mineral compositions of korean wheat cultivars. Prev Nutr Food Sci. (2013) 18:214–7. doi: 10.3746/pnf.2013.18.3.214
51. Devi PB, Vijayabharathi R, Sathyabama S, Malleshi NG, Priyadarisini VB. Health benefits of finger millet (Eleusine coracana L) polyphenols and dietary fiber: a review. J Food Sci Technol. (2014) 51:1021–40. doi: 10.1007/s13197-011-0584-9
52. Sulaiman SA, Kassum AL, Sanusi SN. Proximate analysis and mineral compositions of different cereal grain varieties available in Kano state, Nigeria. Int J Food Sci Nutr. (2020) 5:108–12.
53. Etuk EB, Okeudo NJ, Esonu BO, Udedibie ABI. Antinutritional factors in sorghum: chemistry, mode of action and effects on livestock and poultry. Online J Anim Feed Res. (2012) 2:113–9.
54. Wang Y, Li J, Wang B, Zhang Y, Geng J, Li XW, et al. Effective quantification of tannin content in sorghum grains using Near-infrared Spectroscopy (NIS). Int J Anim Sci Technol. (2021) 5:7–12. doi: 10.11648/j.ijast.20210501.12
55. Awika J. Sorghum Phenols as an Antioxidants. Master Thesis, Texas A & M University, College Station, Texas, TX (2000).
56. Hahn DH, Rooney LW, Earp CF. Tannins and phenols of sorghum. Cereal Foods World. (1984) 29:776–9.
57. Joint WHO/FAO/UNU Expert Consultation. Protein and amino acid requirements in human nutrition. World Health Organ Tech Rep Ser. (2007) 935:1–265.
58. Yetunde OE, Olufunmilayo S, Omoba Victor NE. Biochemical and nutritional compositions of two accessions of Amaranthus cruentus seed flour. Am J Food Sci Technol. (2018) 6:145–50. doi: 10.12691/ajfst-6-4-3
59. Deng Y, Huang L, Zhang C, Xie P, Cheng J, Wang X, et al. Physicochemical and functional properties of Chinese quince seed protein isolate. Food Chem. (2019) 283:539–48. doi: 10.1016/j.foodchem.2019.01.083
60. Wang H, Li D, Wan C, Luo Y, Yang Q, Gao X, et al. Improving the functionality of proso millet protein and its potential as a functional food ingredient by applying nitrogen fertilizer. Foods. (2021) 10:1332. doi: 10.3390/foods10061332
61. Chao G, Gao J, Liu R, Wang L, Li C, Wang Y, et al. Starch physicochemical properties of waxy proso millet (Panicum miliaceum L.). Starch. (2014) 66:1005–12. doi: 10.1002/star.201400018
62. Karl FT. The Technology of Wafers and Waffles and Adjuncts II. Cambridge, MA: Academic Press (2019). 325–411 p. doi: 10.1016/B978-0-12-809437-2.00010-1
63. Lin LS, Cai CH, Gilbert G, Li EP, Wang J, Wei CX. Relationships between amylopectin molecular structures and functional properties of different-sized fractions of normal and high-amylose maize starches. Food Hydrocoll. (2016) 52:359–68. doi: 10.1016/j.foodhud.2015.07.019
64. Kaushal P, Kumar V, Sharma HK. Comparative study of physicochemical, functional, anti-nutritional and pasting properties of taro (Colocasia esculenta), rice (Oryza sativa), pegion pea (Cajanus cajan) flour and their blends. LWT Food Sci Technol. (2012) 48:59–68. doi: 10.1016/j.lwt.2012.02.028
65. Chandra S, Singh S, Kumari D. Evaluation of functional properties of composite flours and sensorial attributes of composite flour biscuits. J Food Sci Technol. (2015) 52:3681–8. doi: 10.1007/s13197-014-1427-2
Keywords: sorghum varieties, nutritive values, quality traits, micrometric properties, functional properties
Citation: Htet MNS, Feng B, Wang H, Tian L and Yadav V (2022) Comparative assessment of nutritional and functional properties of different sorghum genotypes for ensuring nutritional security in dryland agro-ecosystem. Front. Nutr. 9:1048789. doi: 10.3389/fnut.2022.1048789
Received: 20 September 2022; Accepted: 27 October 2022;
Published: 09 November 2022.
Edited by:
Raghavendra Singh, Indian Institute of Pulses Research (ICAR), IndiaReviewed by:
Muhammad Imran Ghani, Guizhou University, ChinaBilal Ahmad, Northwest University, China
Copyright © 2022 Htet, Feng, Wang, Tian and Yadav. This is an open-access article distributed under the terms of the Creative Commons Attribution License (CC BY). The use, distribution or reproduction in other forums is permitted, provided the original author(s) and the copyright owner(s) are credited and that the original publication in this journal is cited, in accordance with accepted academic practice. No use, distribution or reproduction is permitted which does not comply with these terms.
*Correspondence: Baili Feng, ZmVuZ2JhaWxpQG53c3VhZi5lZHUuY24=
 Maw Ni Soe Htet
 Baili Feng
 Honglu Wang1
 Vivek Yadav
