 Yuanlong Hu
 Xiaojie Wang2,3
 Jiaming Huan
 Yuan Li
 Yunlun Li
95% of researchers rate our articles as excellent or good
Learn more about the work of our research integrity team to safeguard the quality of each article we publish.
Find out more
ORIGINAL RESEARCH article
Front. Nutr. , 02 December 2022
Sec. Clinical Nutrition
Volume 9 - 2022 | https://doi.org/10.3389/fnut.2022.1048448
This article is part of the Research Topic Molecular Mechanisms in Diet-Mediated Inflammatory Diseases View all 9 articles
Background/Aim: Optimized dietary patterns have been considered an important determinant of delaying aging in cardiometabolic disease (CMD). Dietary pattern with high-level dietary inflammatory potential is a key risk factor for cardiometabolic disease, and has drawn increasing attention. The aim of this study was to investigate whether dietary pattern with high dietary inflammatory potential was associated with aging acceleration in cardiometabolic disease.
Materials and methods: We analyzed the cross-sectional data from six survey cycles (1999–2000, 2001–2002, 2003–2004, 2005–2006, 2007–2008, and 2009–2010) of the National Health and Nutritional Examination Surveys (NHANES). A total of 16,681 non-institutionalized adults and non-pregnant females with CMD were included in this study. Dietary inflammatory index (DII) was used to assess the dietary inflammatory potential. The two age acceleration biomarkers were calculated by the residuals from regressing chronologic age on Klemera-Doubal method biological age (KDM BioAge) or Phenotypic Age (PhenoAge), termed “KDMAccel” and “PhenoAgeAccel.” A multivariable linear regression accounting for multistage survey design and sampling weights was used in different models to investigate the association between DII and aging acceleration. Four sensitivity analyses were used to ensure the robustness of our results. Besides, we also analyzed the anti-aging effects of DASH-type dietary pattern and “Life’s Simple 7”.
Results: For 16,681 participants with CMD, compared with the first tertile of DII after adjusting for all potential confounders, the patients with second tertile of DII showed a 1.02-years increase in KDMAccel and 0.63-years increase in PhenoAgeAccel (KDMAccel, β = 1.02, 95% CI = 0.64 to 1.41, P < 0.001; PhenoAgeAccel, β = 0.63, 95% CI = 0.44 to 0.82, P < 0.001), while the patients with the third tertile of DII showed a 1.48-years increase in KDMAccel and 1.22-years increase in PhenoAgeAccel (KDMAccel, β = 1.48, 95% CI = 1.02 to 1.94, P < 0.001; PhenoAgeAccel, β = 1.22, 95% CI = 1.01 to 1.43, P < 0.001). In addition, DASH-type dietary pattern was associated with a 0.57-years reduction in KDMAccel (β = −0.57, 95% CI = −1.08 to −0.06, P = 0.031) and a 0.54-years reduction in PhenoAgeAccel (β = −0.54, 95% CI = −0.80 to −0.28, P < 0.001). The each one-unit increase in CVH score was associated with a 1.58-years decrease in KDMAccel (β = −1.58, 95% CI = −1.68 to −1.49, P < 0.001) and a 0.36-years in PhenoAgeAccel (β = −0.36, 95% CI = −0.41 to −0.31, P < 0.001).
Conclusion: Among CMD, the dietary pattern with high dietary inflammatory potential was association with aging acceleration, and the anti-aging potential of DASH-type dietary pattern and “Life’s Simple 7” should also be given attention, but these observations require future prospective validation.
The spectrum of cardiometabolic disease (CMD) initiates with insulin resistance, and eventually progresses to cardiovascular diseases (CVD) or diabetes mellitus (DM), following metabolic syndrome (MetS) and prediabetes (1). The cardiometabolic disease represents a major disease burden globally, and it is the leading cause of death and disability worldwide (2–4). Accelerated aging was considered as a key driver of pathological progression for cardiometabolic disease (5–8). Epidemiological evidence suggested that age acceleration defined by the epigenetic clock was positively associated with increased cardiometabolic risk factors and cardiovascular disease risk (9–11). Several additional studies based on shortened leukocyte telomere length also confirmed that age acceleration was causally associated with coronary heart disease susceptibility (12), coronary artery calcification risk (13), and glycemic progression in type 2 DM (14). Several advancements toward anti-aging therapies have been made in the maintenance of cardiometabolic health (15, 16).
Inflammation serves as a core pillar of aging (17). Aging is accompanied by the development of chronic low-grade systemic inflammation, termed “inflammaging” (18) or “senoinflammation” (19), and the decrease of the adaptive immune response, termed “immunosenescence.” In the context of immunosenescence, the reinforced stimulation of the innate immune response leads to expansion of the senescence-associated secretory phenotype (SASP), which was the main source of “inflammaging” or “senoinflammation” (20, 21). Substantial evidence suggests chronic low-grade systemic inflammation is an independent risk factor for age-related cardiometabolic disease (22–24). Thus, control of inflammation is considered a key intervention for anti-aging and treatment of cardiometabolic disease (25).
Due to degeneracy and evolutionary conservation between immune and metabolic pathways, dietary patterns with nutrient excess and processing defects can trigger inflammatory responses (18, 26–28). The excess intakes of energy, carbohydrate, and dietary fat were considered as the main source of dietary inflammatory potential. It is well-established that calorie restriction (29), low-fat diet (30), and low-carbohydrate diet (31) decreased low-grade systematic inflammation in patients with cardiometabolic disease. Previous clinical evidence suggests the significant effect of dietary patterns with high dietary inflammatory potential on an increased risk of cardiovascular disease (CVD), cardiovascular events, and related mortality (32–34). Besides, dietary inflammatory potential affects glucose and lipid metabolism negatively in both adults and children (35–37). However, it is unclear whether dietary inflammatory potential has a positive effect on aging acceleration for cardiometabolic disease.
Based on the above analysis, the following hypothesis is proposed: dietary inflammatory potential promoted accelerated aging of cardiometabolic disease. Herein, we designed an observational U.S. population-based study to verify the above hypothesis.
The National Health and Nutrition Examination Survey (NHANES) began in the early 1960s and survey the health and nutritional status of the U.S. population through a complex, stratified, multistage probability cluster sampling design (38, 39). This study included a total of 16,681 non-institutionalized adults and non-pregnant females with cardiometabolic disease (CMD) from six NHANES survey cycles (1999–2000, 2001–2002, 2003–2004, 2005–2006, 2007–2008, and 2009–2010). NHANES was approved by the Institutional Review Board of NCHS (Protocol #98-12 and Protocol #2005-061).
In this study, the cardiometabolic disease was defined as stages 2 to 4 of the Cardiometabolic Disease Staging (CMDS) system, which includes metabolic syndrome, prediabetes, diabetes mellitus, and cardiovascular disease (1). Metabolic syndrome was defined according to Adult Treatment Panel III (ATP III) (40). Cardiovascular disease was ascertained by self-reported coronary heart disease, angina, congestive heart failure, heart attack, or stroke. DM was identified by fasting glucose ≥ 126 mg/dl, 2-h oral glucose tolerance test (OGTT) glucose ≥ 200 mg/dl, self-reported DM, or currently taking anti-diabetic medication. Prediabetes was identified by fasting glucose ≥ 100 mg/dl or 2-h OGTT glucose ≥ 140 mg/dl.
We used two methods to quantify biological aging (BioAge) measures, including the Klemera-Doubal method biological age (KDM BioAge) (41) and Phenotypic Age (PhenoAge) (42). The BioAge R package2 allows the user to parametrize KDM and PhenoAge algorithms using custom sets of biomarkers, then project these algorithms onto new datasets (43). We used a biomarker set provided by the developers of the BioAge R package to calculate KDM BioAge and PhenoAge, including albumin, alkaline phosphatase, c-reactive protein, total cholesterol, creatinine, HbA1c, systolic blood pressure, blood urea nitrogen, uric acid, lymphocyte percent, mean cell volume, and white blood cell count (43). The residuals from regressing chronologic age on biological age were adopted to reflect the aging acceleration, termed “KDMAccel” and “PhenoAgeAccel” (44). Detailed calculation formulas of biological aging and aging acceleration were provided in the Supplementary methods 2.1, 2.2.
The overall effects of diet on chronic inflammation were quantified using the Dietary Inflammatory Index (DII), as previously described (45). In this study, 28 available daily nutrients data derived from the NHANES dataset were used to calculate the DII, including alcohol, β-carotene, caffeine, carbohydrate, cholesterol, energy, protein, total fat, dietary fiber, folic acid, mono-unsaturated fatty acids (MUFA), niacin, n-3 fatty acids, n-6 fatty acids, polyunsaturated fatty acid (PUFA), riboflavin, saturated fat, thiamin, vitamin A, vitamin B6, vitamin B12, vitamin C, vitamin D, vitamin E, magnesium, selenium, iron, and zinc. Detailed calculation for DII was described in the Supplementary method 2.3. DII from lowest to highest indicates the dietary inflammatory potential on a contiguous scale from maximal anti-inflammatory to maximal pro-inflammatory (45).
In addition, the “Life’s Simple Seven” and Dietary Approaches to Stop Hypertension (DASH) type dietary pattern was recommended as a dietary goal of ideal cardiovascular health by the American Heart Association (46). A DASH score was calculated according to prior work by Mellen et al. (47). Dietary pattern with a DASH score greater than or equal to 4.5 were defined as DASH type dietary pattern. To measure “Life’s Simple Seven,” the ideal cardiovascular health score (CVH score) was calculated based on the method created by Foraker, et al. (48). Higher CVH scores means better cardiovascular health level.
The collection of respondents’ food intake was conducted by 24-h dietary recall interview format, of which the computer-assisted dietary interview system (CADI) was used until 2002, and the Automated Multiple-Pass Method (AMPM) was used thereafter. It should be noted that the collection of data in the NHANES survey cycles “1999–2000” and “2001–2002” were based on single 24-h dietary recall by a structured face-to-face interview. Since 2002, a second collection was conducted by telephone interview 3 to 10 days following the first collection (38). Dietary intake was converted to nutrient intake based on the USDA’s Food and Nutrient Database for Dietary Studies (FNDDS). For two 24-h recalls, the mean daily nutrient intake was used to analyze. Extreme energy intake was considered as under- or over-reporting to be excluded, including extreme low (800 kcal/day in male and 600 kcal/day in female) and high (8,000 kcal/day in male and 6,000 kcal/day in female) value (49).
The variables that influenced the effect of DII on biological age acceleration were considered covariates, and the variables to calculate KDM BioAge and PhenoAge were excluded. Nineteen variables were included as covariates in the final analysis, including age, sex, ethnicity, smoking status, household income, body mass index (BMI), dietary energy intake, comorbidity burden, CMDS, diabetes mellitus (DM), metabolic syndrome (MetS), hyperlipidemia, chronic kidney disease (CKD), asthma, hypertension, cardiovascular disease (CVD), anti-hypertensive drug use, and anti-hyperlipidemic drug use.
The patients with CKD were identified by the KDIGO (Kidney Disease: Improving Global Outcomes) Clinical Practice Guideline for the Management of Glomerular Diseases (50). Hypertension was identified by average systolic blood pressure (SBP) > 140 mmHg, average diastolic blood pressure (DBP) ≥ 90 mmHg, or currently taking anti-hypertensive medication. The Charlson comorbidity index (CCI) was used to assess comorbidity burden for each individual, which was the sum of the weights of each comorbidity (51, 52). Comorbidities were identified by asking “Have you ever been told that you have the illness” for the calculation of CCI, except for DM. DM was identified according to the definition in this study. Detailed comorbidity weights were provided in the Supplementary method 2.4.
Dietary inflammatory index (DII) was analyzed as categorized variables and re-analyzed as continuous. DII was classified into three groups according to the tertile points. DASH type dietary pattern was analyzed as categorized variables, and CVH score was analyzed as continuous. All analyses were weighted by the survey R package (version 4.1-1) to account for the complex sampling design. For main analyses, participants with missing values were excluded.
A linear regression model was applied to examine the linear relationships between exposure (DII, DASH, and CVH score) and aging acceleration. The multivariable linear regression was used to adjust for potential confounders. Multivariable linear regression models were built with three levels of adjustment: model 1 adjusted for age, sex, ethnicity, and household income; model 2 adjusted for sex, dietary energy intake, and BMI; model 3 adjusted for age, sex, ethnicity, household income, smoking status, BMI, total energy intake, CCI, CVD, hypertension, DM, MetS, hyperlipidemia, asthma, CKD, anti-hypertensive drug use, and anti-hyperlipidemic drug use. Trend tests were performed by entering the median value of each tertile of DII as a continuous variable in the linear regression models. Besides, we exported the possible non-linear effect of DII on aging acceleration using a multivariable linear regression model with a restricted cubic splines (RCS) model.
We conducted four sensitivity analyses to ensure the robustness of our results. Firstly, to evaluate whether using logistic regression analyses instead of linear regression models would change overall conclusions, the “KDMAccel” and “PhenoAgeAccel” were divided into two categories: accelerated aging (KDMAccel > 0 or PhenoAgeAccel > 0) and non-accelerated aging (KDMAccel ≤ 0 or PhenoAgeAccel ≤ 0), then we re-examined the association of DII with aging acceleration. Secondly, In the absence of consideration of complex sampling designs, we reanalyzed the association between DII and aging acceleration. Thirdly, in order to potential bias from missing values, we imputed the missing value by random forest-based missForest algorithm using the missForest R package (version 1.4) (53). Fourthly, subgroup analyses were performed by age (< 60 and ≥ 60 years), sex, ethnicity, household income, BMI (< 30 and ≥ 30 kg/m2), smoking status, CCI (0 and > 0), CMDS, dysglycemia, hyperlipidemia, MetS, hypertension, and CVD, and the Wald test was used to test the cross-product interaction term.
All analyses were performed in R (version 4.1.2, R Core Team) using RStudio (version 2022.07.1 Build 554, RStudio, PBC, Boston, MA). A two-sided P-value < 0.05 was considered statistically significant in all analyses.
A total of 16,681 participants with cardiovascular disease were included in the analysis (Figure 1), which represented 114.7 million non-institutionalized residents of the United States (Supplementary Table 1). Of them, 48.2% were male, and 51.8% were female. Their average age was 53.1 ± 17.7 years (Table 1). We calculated two biological age measures, the KDM BioAge and PhenoAge, both of which were significantly positively correlated with chronological age (Supplementary Table 1 and Supplementary Figure 1). Considering the complex sampling design, the average KDM and PhenoAge were 45.62 ± 18.05 and 47.07 ± 17.27, respectively (Supplementary Table 1). The mean intakes for nutrient components used to calculating DII were described in Supplementary Table 2. Only 11.8% of participants followed a DASH-type eating pattern, and the average CVH score was 7.35 ± 2.14 (Table 1).
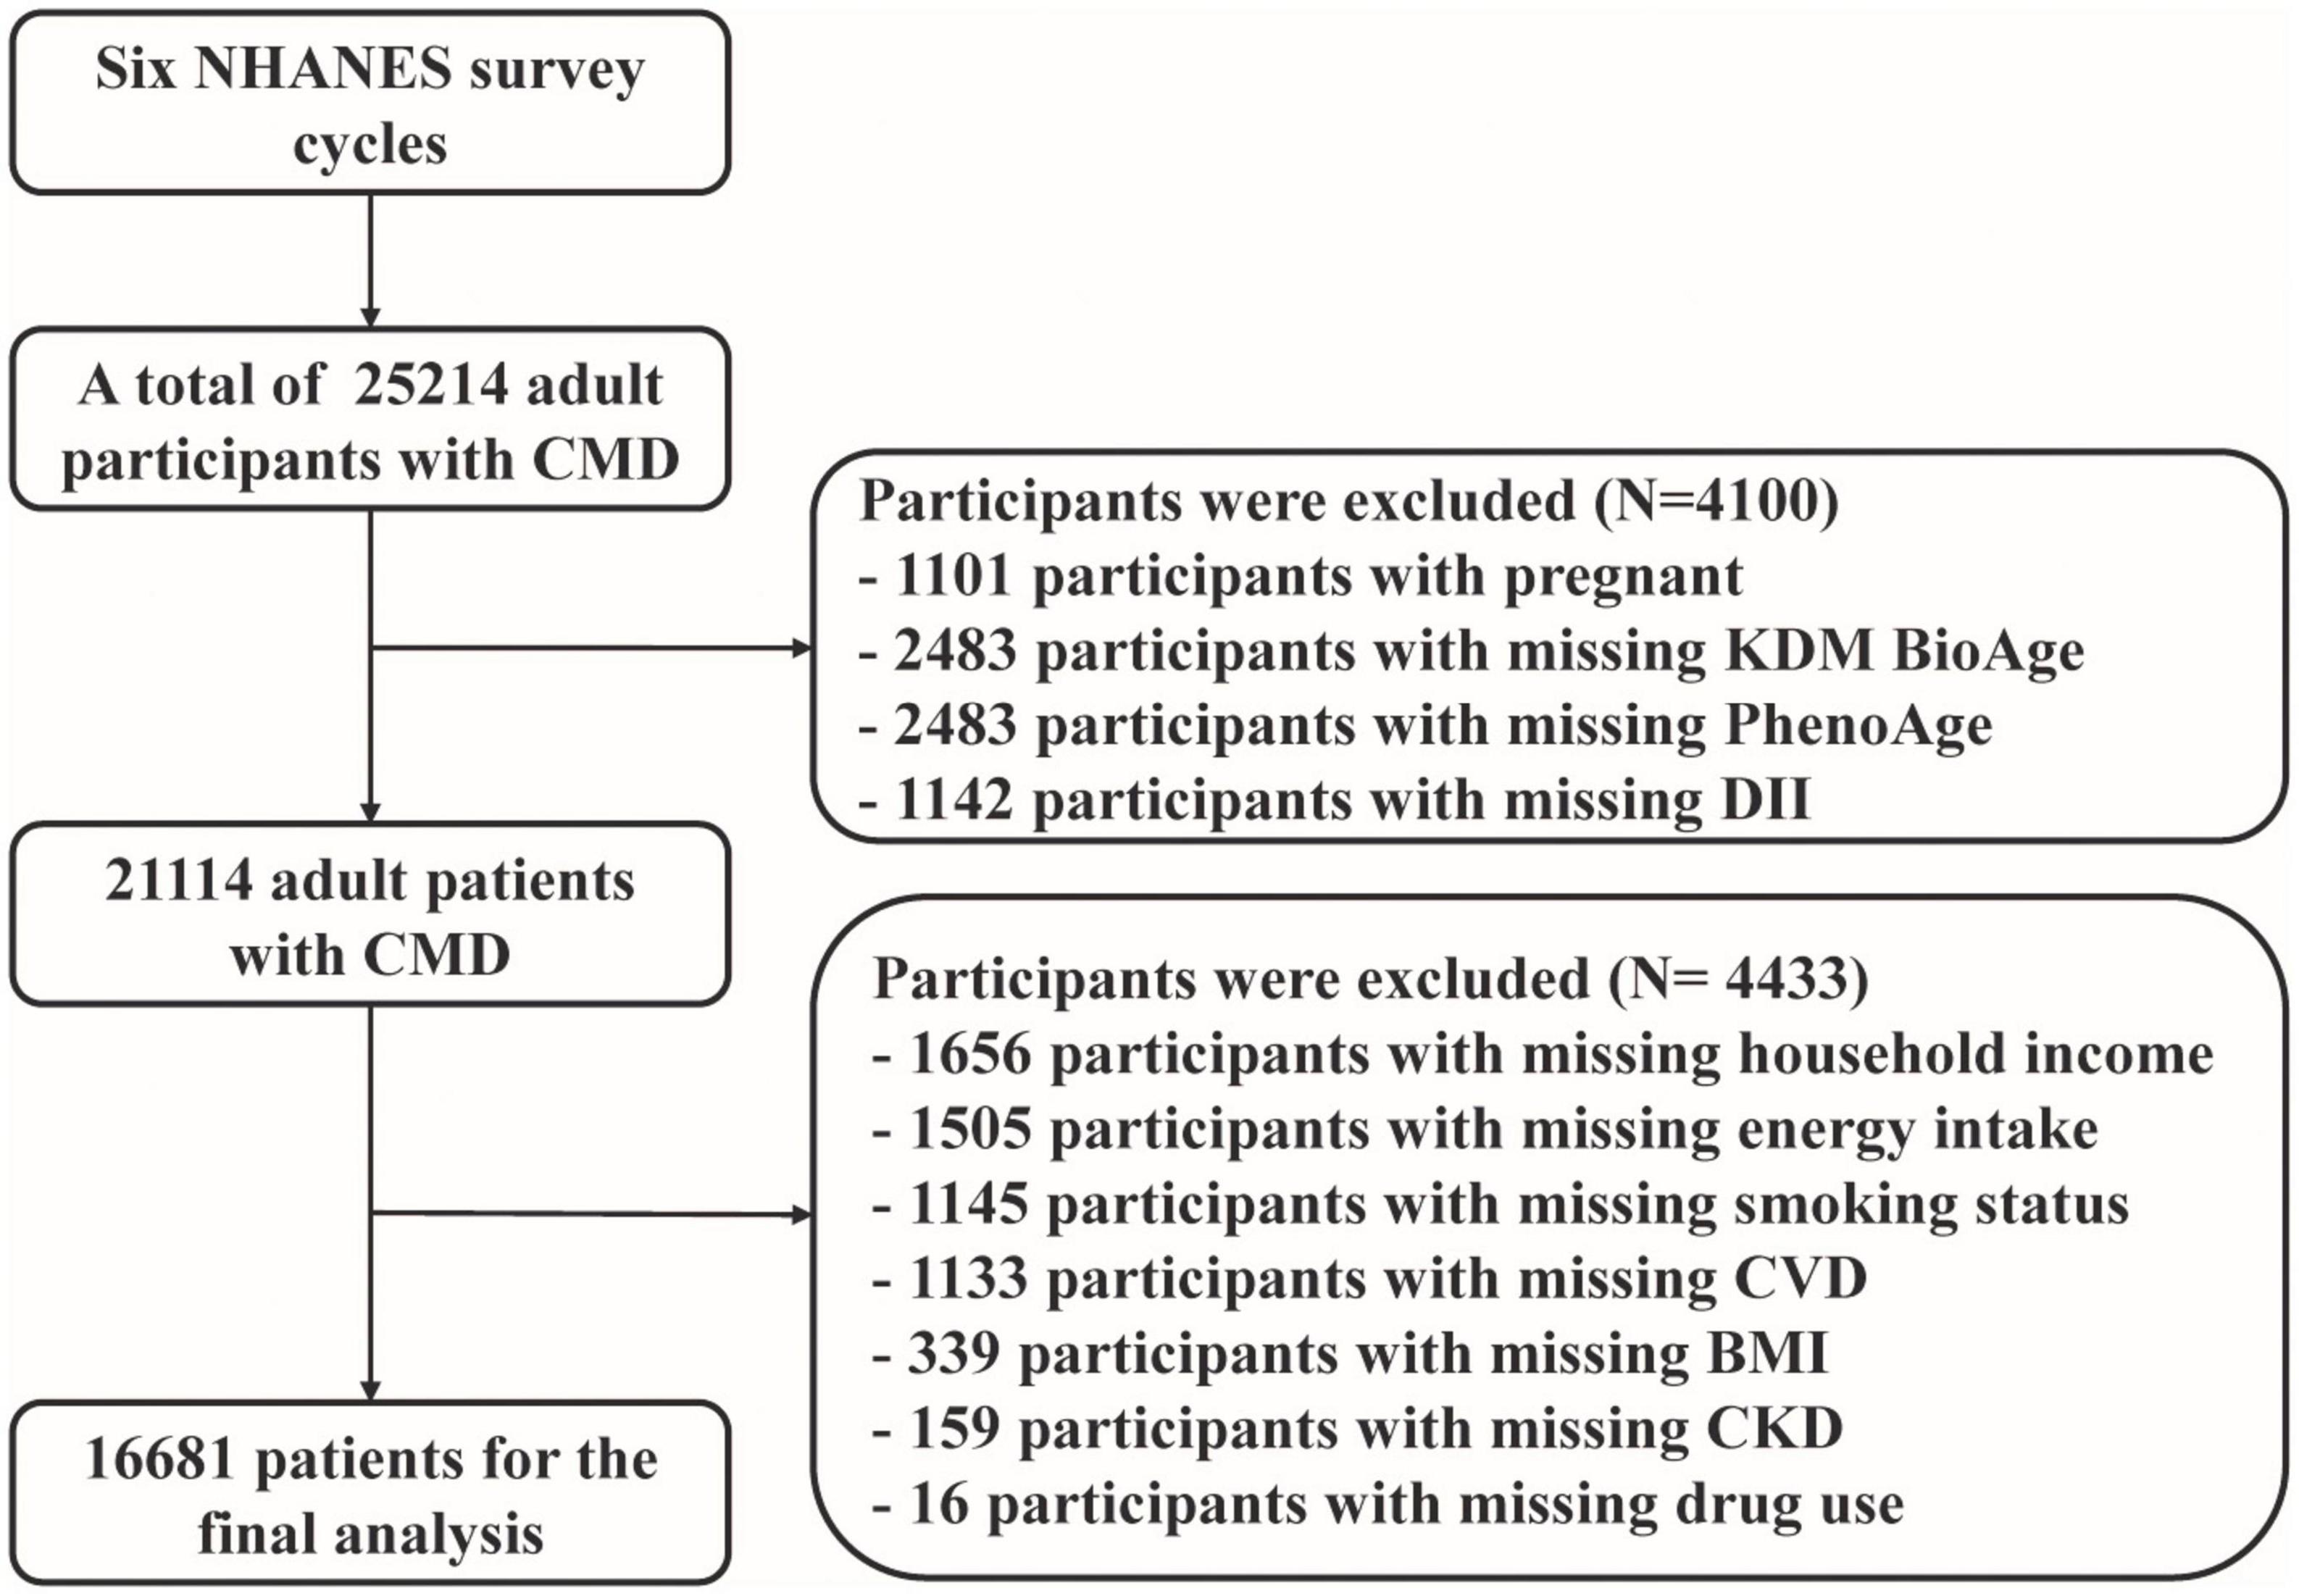
Figure 1. Flowchart of conforms the analytic sample.
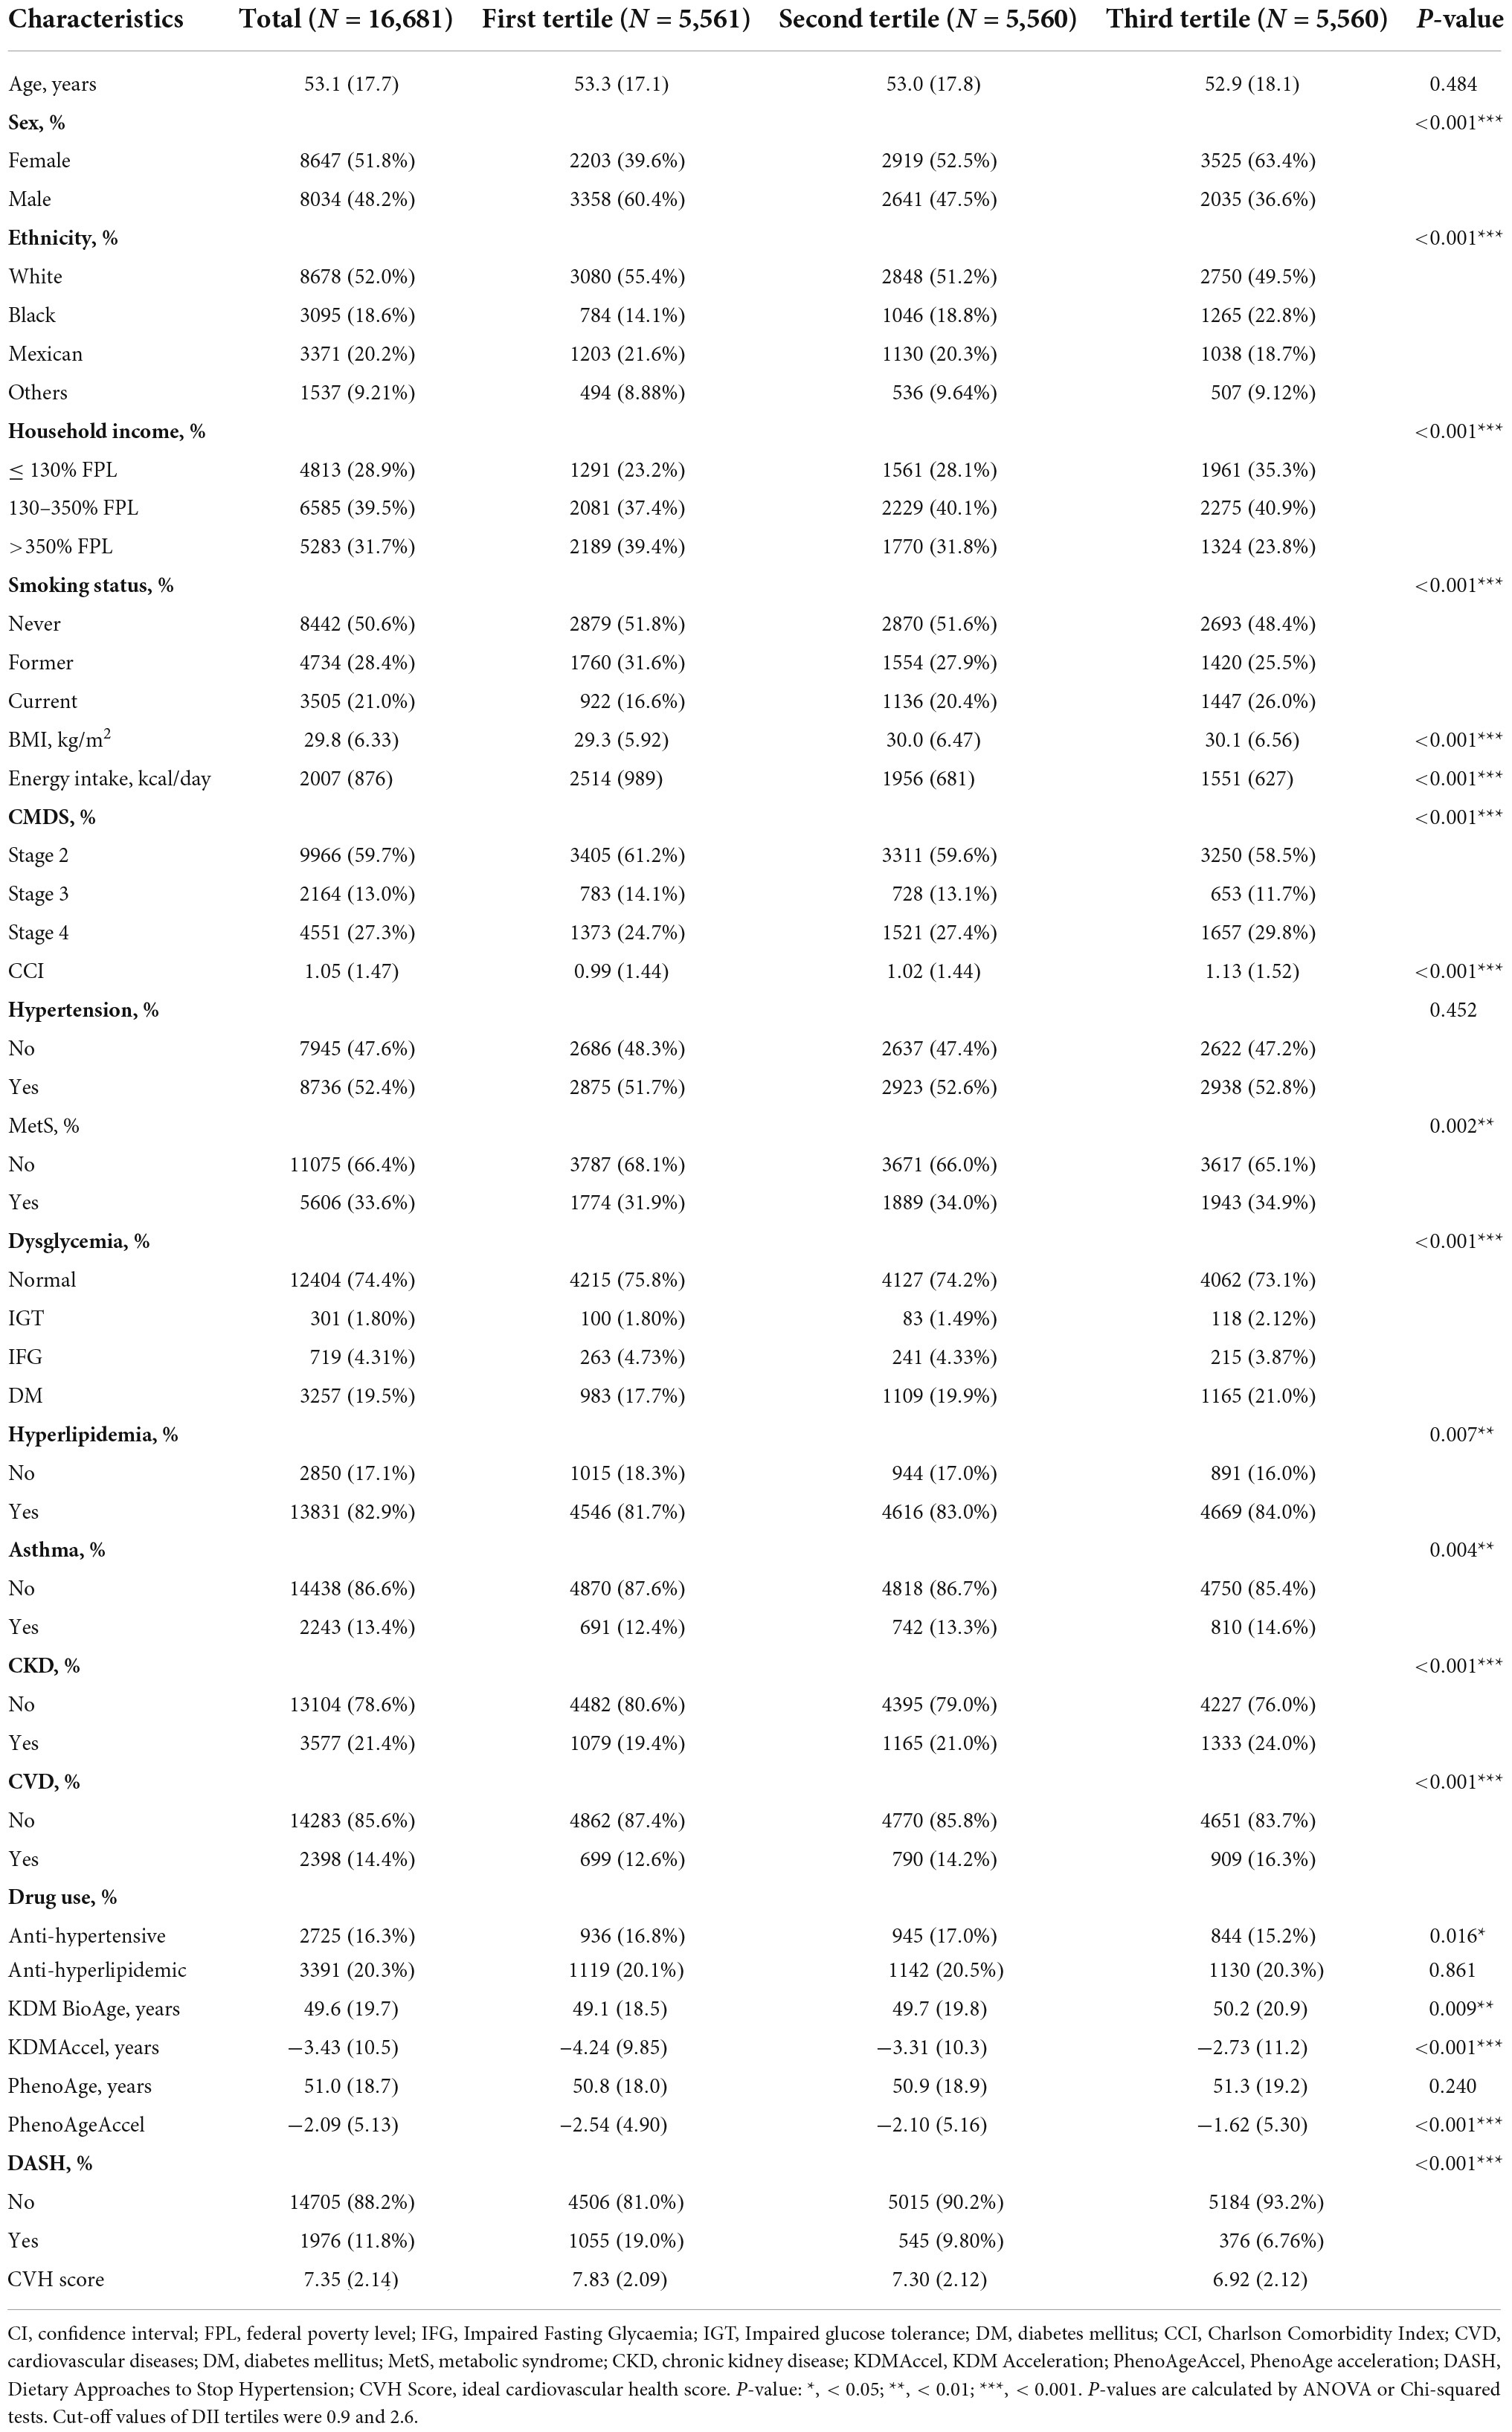
Table 1. Characteristics of participants across the tertiles of the dietary inflammatory index.
Taking the complex survey design into account, univariate analysis showed that DII was significantly positively associated with KDMAccel or PhenoAgeAccel, either using the raw continuous or the categorized (tertile) measures (Figure 2 and Supplementary Table 3). Compared with the first tertile, the patients with the second tertile of DII gained 0.87 years increase in the KDMAccel (β = 0.87, 95% CI = 0.41 to 1.33, P < 0.001) and 0.46 years increase in the PhenoAgeAccel (β = 0.46, 95% CI = 0.24 to 0.67, P < 0.001), while patients with the third tertile of DII gained 1.26 years increase in the KDMAccel (β = 1.26, 95% CI = 0.77 to 1.75, P < 0.001) and 0.93 years increase in the PhenoAgeAccel (β = 0.93, 95% CI = 0.70 to 1.15, P < 0.001). For continuous DII measures, each one unit increase in DII was associated with a 0.33-years increase in KDMAccel (β = 0.33, 95% CI = 0.22 to 0.44, P < 0.001) and a 0.24-years increase in PhenoAgeAccel (β = 0.24, 95% CI = 0.19 to 0.29, P < 0.001).
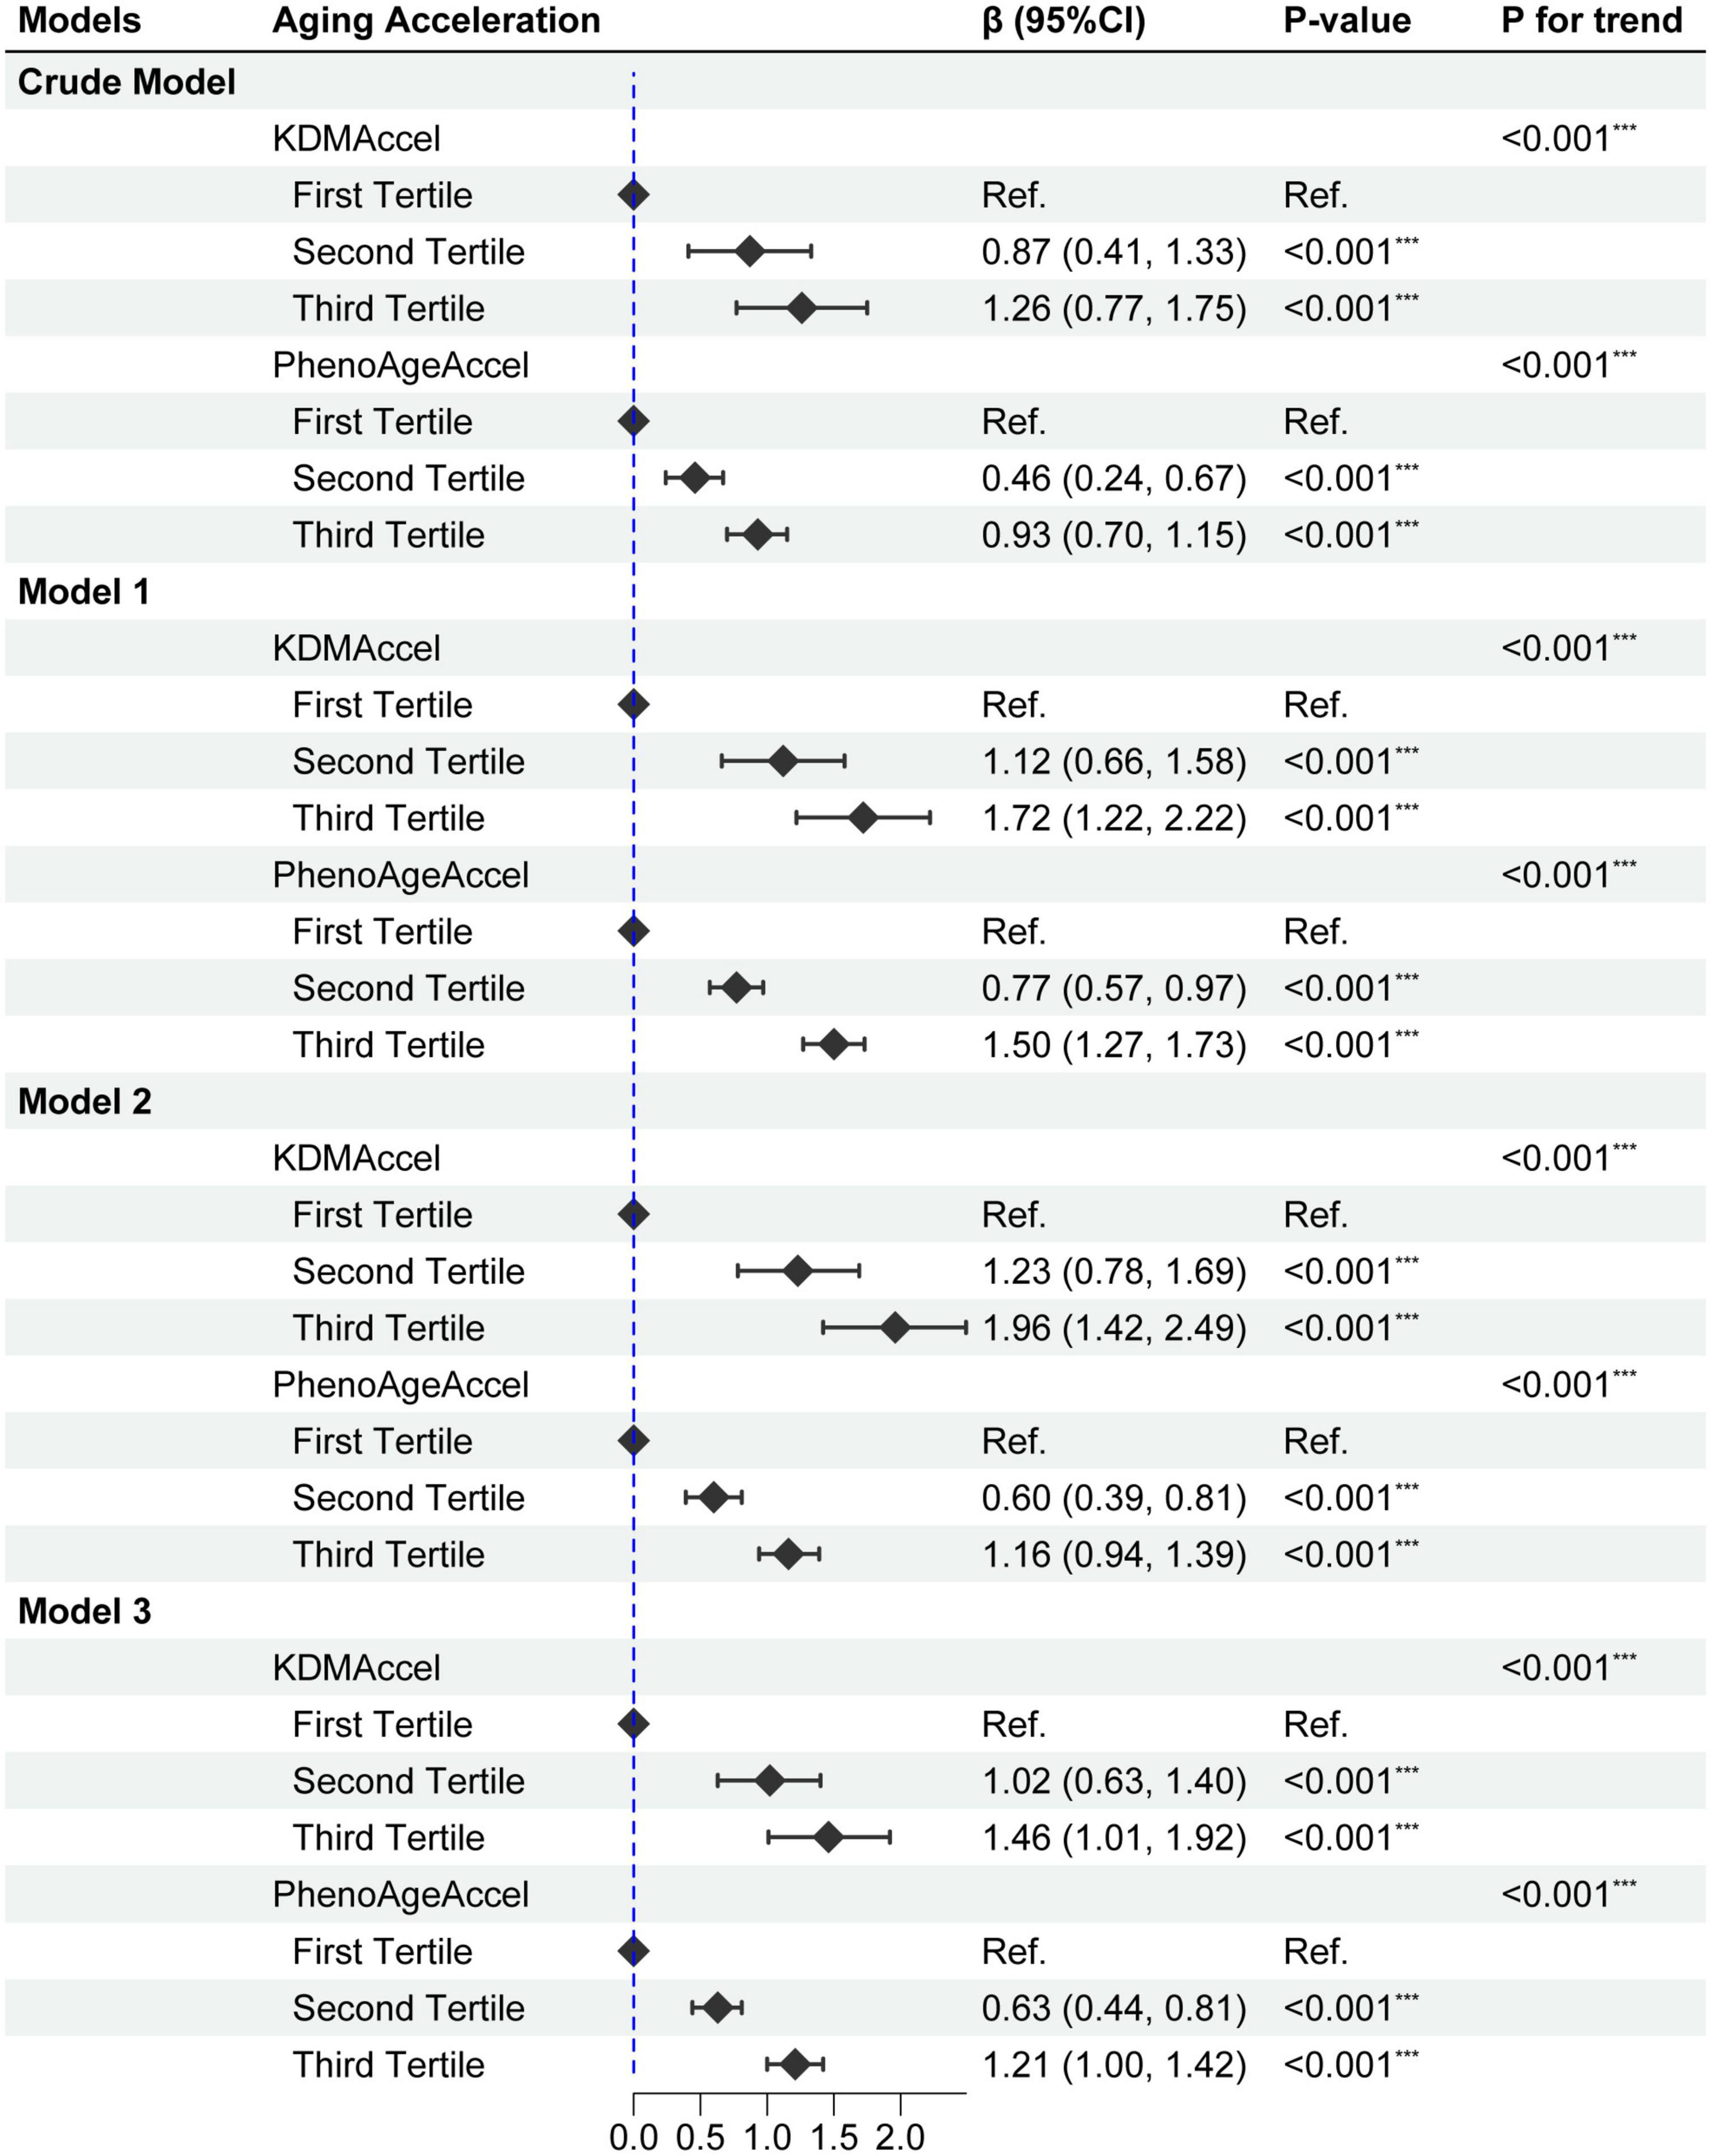
Figure 2. Forest plot for the effect of dietary inflammatory index (DII) on aging acceleration. Model 1 adjusted for age, sex, ethnicity, and household income; Model 2 adjusted for sex, BMI, and total energy intake; Model 3 adjusted age, sex, ethnicity, household income, smoking status, BMI, total energy intake, CCI, CVD, hypertension, dysglycemia, MetS, hyperlipidemia, asthma, CKD, anti-hypertensive drug use, and anti-hyperlipidemic drug use. P-value: ***, < 0.001.
Subsequently, after correcting for all potential confounding variables, adjusted results were congruent with the unadjusted results either using the raw continuous or the categorized measures (Figure 2 and Supplementary Table 4). Compared with the first tertile, the patients with the second tertile of DII gained 1.02-years more KDMAccel (KDMAccel, β = 1.02, 95% CI = 0.64 to 1.41, P < 0.001) and 0.63-years more PhenoAgeAccel (PhenoAgeAccel, β = 0.63, 95% CI = 0.44 to 0.82, P < 0.001), while the patients with the third tertile of DII gained 1.48-years more KDMAccel (KDMAccel, β = 1.48, 95% CI = 1.02 to 1.94, P < 0.001) and 1.22-years more PhenoAgeAccel (β = 1.22, 95% CI = 1.01 to 1.43, P < 0.001). For continuous DII measures, each one unit increase in DII was associated with a 0.38-years increase in KDMAccel (β = 0.38, 95% CI = 0.29 to 0.48, P < 0.001) and a 0.32-years increase in PhenoAgeAccel (β = 0.32, 95% CI = 0.27 to 0.36, P < 0.001). Besides, the RCS model did not suggest any non-linear dose-response associations between DII and two biomarkers of aging acceleration (Figure 3).
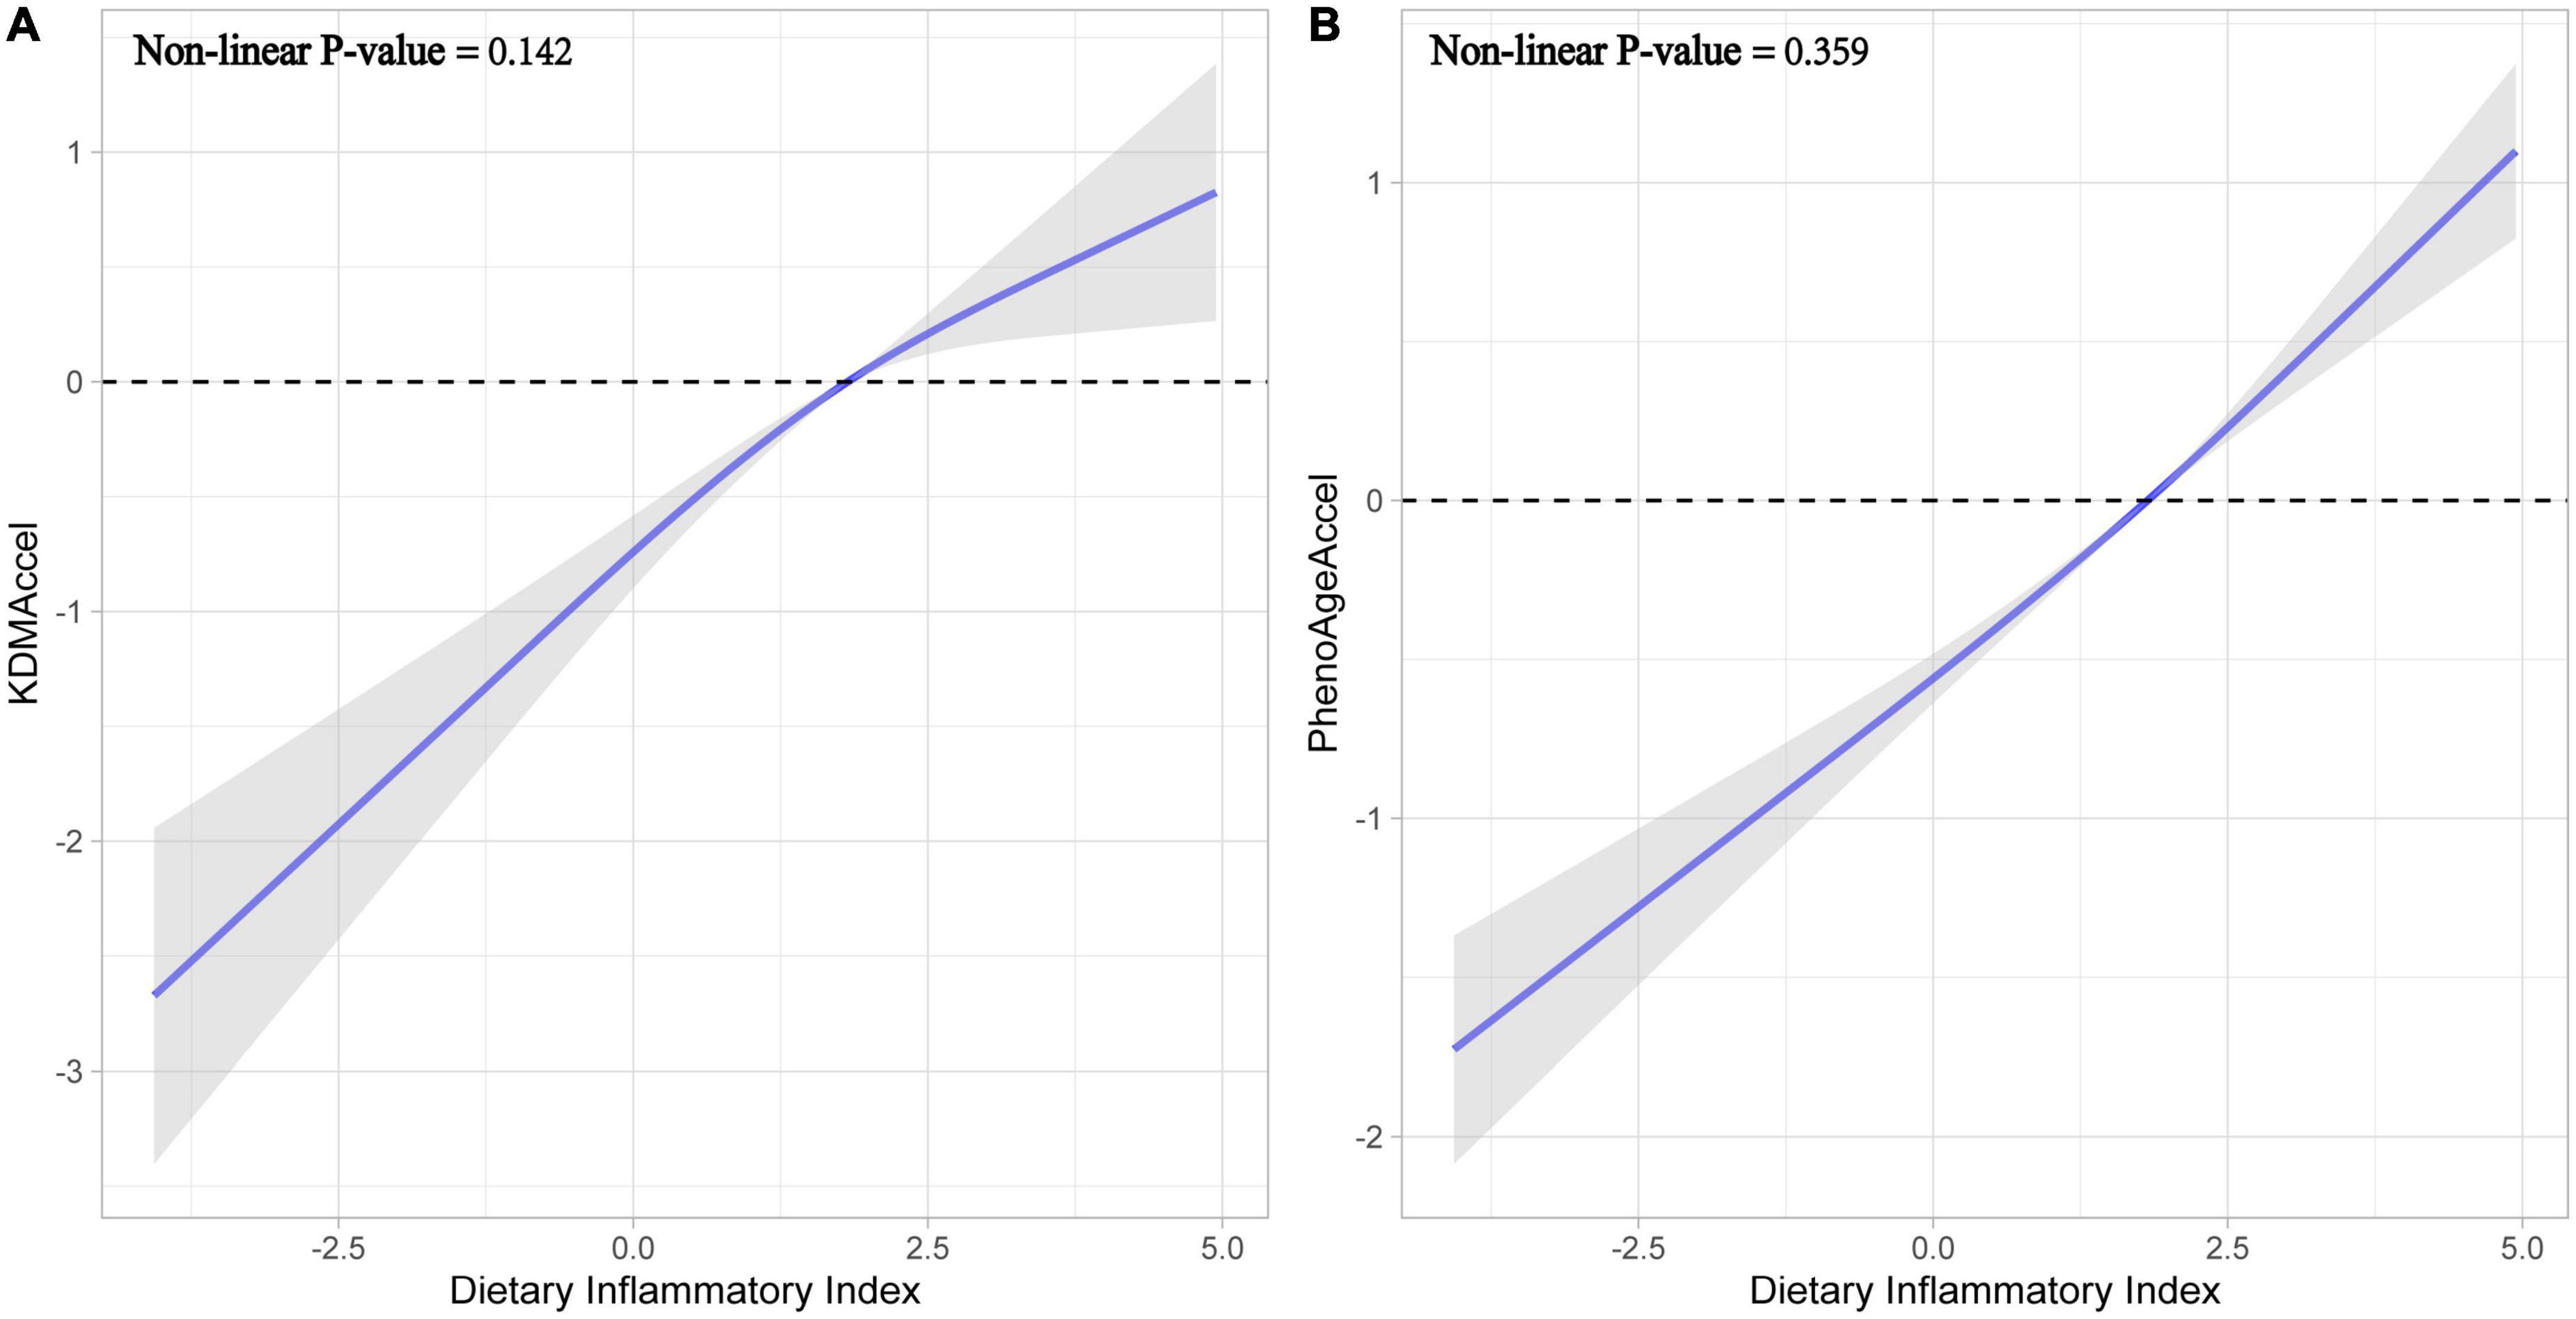
Figure 3. Fitting curves for restricted cubic splines models. (A) Effect of dietary inflammatory index on KDMAccel. (B) Effect of dietary inflammatory index on PhenoAgeAccel.
Additionally, we also analyzed the effect of DASH-type dietary pattern and CVH score on KDMAccel and PhenoAgeAccel. DASH-type dietary pattern was associated with a 0.57-years reduction in KDMAccel (β = −0.57, 95% CI = −1.08 to −0.06, P = 0.031) and a 0.54-years reduction in PhenoAgeAccel (β = −0.54, 95% CI = −0.80 to −0.28, P < 0.001) after adjusting for all potential confounders (Supplementary Figure 2). The each one-unit increase in CVH score was associated with a 1.58-years decrease in KDMAccel (β = −1.58, 95% CI = −1.68 to −1.49, P < 0.001) and a 0.36-years in PhenoAgeAccel (β = −0.36, 95% CI = −0.41 to −0.31, P < 0.001) after adjusting for all potential confounders (Supplementary Figure 3).
We used four different ways to perform sensitivity analyses to determine the robustness of the results. The results of subgroup analyses showed that the direction of the accelerated aging effect was consistent with main analyses across subgroups (Supplementary Tables 5–7). It is important to note that the hypertension and CVD showed an interaction with DII on the KDMAccel (hypertension, P for interaction < 0.001; CVD, P for interaction < 0.001) and PhenoAgeAccel (hypertension, P for interaction = 0.002; CVD, P for interaction < 0.001). The associations were stronger in individuals with CVD or hypertension (Supplementary Tables 5–7).
The association of DII with aging acceleration was reanalyzed in each of the following three cases: data without taking sampling weight into account (Supplementary Table 8), imputed data using the missForest methods (Supplementary Table 9), and the KDMAccel and PhenoAgeAccel redefined as categorical data based on whether it is more than 0 (Supplementary Table 10). The results of all cases showed that DII was significantly positively associated with the aging acceleration, which was similar to the main analysis.
This analysis in a nationally representative U.S. adult population with cardiometabolic disease revealed three main findings. First, we determined that the dietary pattern with higher DII was associated with faster biological aging. Second, the “Life’s Simple Seven” and DASH-type dietary pattern demonstrated a significant slowing effect on the speed of aging. Third, the low-DII dietary pattern was more beneficial for patients with cardiovascular disease or hypertension. The above result was simultaneously validated in the analysis with KDMAccel and PhenoAgeAccel as outcome variables. In addition, we continued with three sensitivity analyses, and the results of this analysis were in agreement with the results of the main analysis, which strengthened our confidence in the above results.
For this study, the primary challenge facing to us is how to measure the accelerated aging effect. The most common clinical outcomes in current anti-aging clinical studies mainly include age-related diseases and aging-related biomarkers (54, 55). Distinguishing from chronological age, biological age as a biomarker of aging is a promising surrogate endpoint for anti-aging therapies in clinical research, such as KDM BioAge and PhenoAge (56, 57). In two studies based on NHANES data, KDM BioAge and PhenoAge were confirmed to be robust predictors of mortality (58–60). Thus, KDM BioAge and PhenoAge are suited for measuring the accelerated aging effect in cardiometabolic disease. Although KDM BioAge and PhenoAge are significantly correlated, the recent genome-wide association study linked KDM BioAge and PhenoAge to different aspects of the aging process (61), which tend to reflect cardiometabolic risk and inflammaging, respectively. High-DII dietary pattern was a risk factor for cardiovascular metabolic risk and systemic inflammation. Therefore, KDM BioAge and PhenoAge are suitable tools for measuring aging acceleration in patients with cardiometabolic disease.
Our study based on the NHANES dataset found that a dietary pattern with higher dietary inflammatory potential was associated with a faster aging acceleration in patients with cardiometabolic disease. In addition to KDM BioAge and PhenoAge, other aging-related biomarkers also provided evidence for the effect of high DII on accelerated aging, such as telomere shortening and frailty. Telomere shortening is a biomarker of cardiovascular aging, which is the cause of replicative cellular senescence and the risk factor of cardiovascular disease (62). The evidence from the PREDIMED-NAVARRA (PREvención con DIeta MEDiterránea-NAVARRA) trial also suggested that a high-level dietary inflammatory index promoted telomere shortening in 520 participants with high cardiovascular disease risk (63). However, previous research suggested that telomere length was not significantly related to KDM BioAge (56, 64). Frailty is also an aging-related biomarker (65), which represents poor prognosis in cardiovascular disease (66). Three clinical studies suggested that a high-DII dietary pattern was associated with an increased risk of frailty (67–69). Taking all findings of the above studies on different aging markers together, high levels of dietary inflammatory potential can contribute to the acceleration of the aging process.
In the subgroup analysis, patients with cardiovascular disease or hypertension appeared to be more sensitive to the pro-aging accelerating effects of high-DII dietary patterns. We speculated that the reason was accelerated aging as the critical contributing factor leading to CVD and hypertension (60, 70). It was suggested that the low-DII dietary pattern provided a novel and promising dietary nutritional strategy for the treatment of CVD and hypertension.
Our study suggested that DASH-type dietary pattern and “Life’s Simple 7” could also have beneficial effects on aging in patients with cardiometabolic disease. The “Life’s Simple 7” and DASH type dietary pattern were defined by the American Heart Association as the ideal lifestyle and clinical factors. Two previous observational studies suggested that the individuals who follow “Life’s Simple 7” exhibited slower aging speeds among populations free of CVD from the Women’s Health Initiative (WHI) and Taiwan Biobank (TWB) (71, 72). In addition, the findings of the Framingham Heart Study Offspring Cohort showed that the DASH-type dietary pattern was associated with a lower acceleration of epigenetic age (73). The DASH-type dietary pattern has an anti-inflammatory effect (74, 75). Our findings were also in agreement with previous studies, in particular, our study provided results in the cardiometabolic disease population, stressing the importance of a DASH-type dietary pattern for aging.
Our findings have clinical implications for cardiometabolic disease. Anti-aging therapies have emerged as a new hope for the treatment of cardiometabolic disease. Optimized dietary pattern plays a major role in affecting aging and cardiometabolic health, which has long been recognized as the most potent, feasible, and safest intervention to delay aging (76). In this context, a new question urgently needs to be addressed: what dietary patterns or lifestyles can provide the benefits of slowing aging for patients with cardiometabolic diseases? Calorie restriction is a typical example of a dietary pattern with anti-aging effects (76), which has been shown to reduce cardiometabolic risk by clinical evidence from substantial randomized controlled studies (77, 78). Our study suggested that dietary inflammatory potential is a key concern and consideration in developing dietary patterns for patients with cardiometabolic disease, especially among CVD and hypertension patients. And, the anti-aging potential of DASH-type dietary pattern and “Life’s Simple 7” should also be given attention in the treatment and prevention of cardiometabolic disease.
A lot of limitations should be noted in our study. Firstly, missing data could lend to selection bias. We performed a sensitivity analysis for reanalyzing the imputed data, which supports the robustness of our study. Secondly, the inclusion of only the U.S. population in our study limits the generalization of our findings to other populations. Thirdly, our study was based on a cross-sectional NHANES dataset, which limited causal inferences. We hope that future controlled randomized controlled studies, prospective cohort studies, or mendelian randomization studies are needed to confirm our results. Fourth, the history of disease and medication were collected by self-reporting in the NHANES, which might bring selection bias to our results. Besides, the survey for dietary intake based on 24-h recall was subject to recall bias. Fifth, the measurement of aging acceleration remains somewhat different for different biological age markers, so we applied two different biological age markers and the results of both readily corroborate each other, which increases the robustness of our findings.
In summary, our study demonstrates that the dietary pattern with a higher DII was associated with faster aging acceleration in patients with cardiometabolic disease, which should receive more attention. Besides, the DASH-type dietary pattern and “Life’s Simple Seven” showed an anti-aging effect. The low-DII dietary pattern, DASH type dietary pattern, and “Life’s Simple Seven” could be recommended as potential strategies to slow the pace of aging in cardiometabolic disease populations.
Publicly available datasets were analyzed in this study. This data can be found here: https://www.cdc.gov/nchs/nhanes/index.htm.
YH conducted analyses and wrote the manuscript. XW, JH, LZ, LL, and YaL collected and assembled the data. YH and YlL conceived of the study design. All authors have contributed to the interpretation of the results, have critically revised the content of the manuscript, and agreed to be accountable for all aspects of the work.
This work was supported by the National Natural Science Foundation of China (Grant no. 81974566), Special Funds of Taishan Scholar Project (Grant no. ts201712042), Jinan “University 20” Project (Grant no. 2020GXRC017), Health of Shandong Provincial Commission Chinese and Western Medicine Combined Prevention and Treatment of Common Diseases and Frequently-occurring Diseases Project (Grant no. 2019-11), and Qilu Traditional Chinese Medicine Advantageous Specialty Cluster.
The authors declare that the research was conducted in the absence of any commercial or financial relationships that could be construed as a potential conflict of interest.
All claims expressed in this article are solely those of the authors and do not necessarily represent those of their affiliated organizations, or those of the publisher, the editors and the reviewers. Any product that may be evaluated in this article, or claim that may be made by its manufacturer, is not guaranteed or endorsed by the publisher.
The Supplementary Material for this article can be found online at: https://www.frontiersin.org/articles/10.3389/fnut.2022.1048448/full#supplementary-material
1. Guo F, Moellering D, Garvey W. The progression of cardiometabolic disease: validation of a new cardiometabolic disease staging system applicable to obesity. Obesity (Silver Spring). (2014) 22:110–8. doi: 10.1002/oby.20585
2. Gbd 2019 Risk Factors Collaborators. Global burden of 87 risk factors in 204 countries and territories, 1990-2019: a systematic analysis for the Global burden of disease study 2019. Lancet. (2020) 396:1223–49. doi: 10.1016/S0140-6736(20)30752-2
3. Roth G, Mensah G, Johnson C, Addolorato G, Ammirati E, Baddour L, et al. Global burden of cardiovascular diseases and risk factors, 1990-2019: update from the GBD 2019 study. J Am Coll Cardiol. (2020) 76:2982–3021. doi: 10.1016/j.jacc.2020.11.010
4. Miranda J, Barrientos-Gutiérrez T, Corvalan C, Hyder A, Lazo-Porras M, Oni T, et al. Understanding the rise of cardiometabolic diseases in low- and middle-income countries. Nat Med. (2019) 25:1667–79. doi: 10.1038/s41591-019-0644-7
5. Palmer A, Gustafson B, Kirkland J, Smith U. Cellular senescence: at the nexus between ageing and diabetes. Diabetologia. (2019) 62:1835–41. doi: 10.1007/s00125-019-4934-x
6. Buford T. Hypertension and aging. Ageing Res Rev. (2016) 26:96–111. doi: 10.1016/j.arr.2016.01.007
7. Wang J, Bennett M. Aging and atherosclerosis. Circ Res. (2012) 111:245–59. doi: 10.1161/CIRCRESAHA.111.261388
8. Tsai Y, Chuang L, Lee Y, Chiu C. How does diabetes accelerate normal aging? An examination of ADL, IADL, and mobility disability in middle-aged and older adults with and without diabetes. Diabetes Res Clin Pract. (2021) 182:109114. doi: 10.1016/j.diabres.2021.109114
9. Ammous F, Zhao W, Ratliff S, Mosley T, Bielak L, Zhou X, et al. Epigenetic age acceleration is associated with cardiometabolic risk factors and clinical cardiovascular disease risk scores in African Americans. Clin Epigenetics. (2021) 13:55. doi: 10.1186/s13148-021-01035-3
10. Huang R, Lillycrop K, Beilin L, Godfrey K, Anderson D, Mori T, et al. Epigenetic age acceleration in adolescence associates with BMI, inflammation, and risk score for middle age cardiovascular disease. J Clin Endocrinol Metab. (2019) 104:3012–24. doi: 10.1210/jc.2018-02076
11. Roetker N, Pankow J, Bressler J, Morrison A, Boerwinkle E. Prospective study of epigenetic age acceleration and incidence of cardiovascular disease outcomes in the ARIC study (Atherosclerosis Risk in Communities). Circ Genom Precis Med. (2018) 11:e001937. doi: 10.1161/CIRCGEN.117.001937
12. Telomeres Mendelian Randomization Collaboration. Association between telomere length and risk of cancer and non-neoplastic diseases: a mendelian randomization study. JAMA Oncol. (2017) 3:636–51. doi: 10.1001/jamaoncol.2016.5945
13. Mwasongwe S, Gao Y, Griswold M, Wilson J, Aviv A, Reiner A, et al. Leukocyte telomere length and cardiovascular disease in African Americans: the Jackson heart study. Atherosclerosis. (2017) 266:41–7. doi: 10.1016/j.atherosclerosis.2017.09.016
14. Cheng F, Luk A, Shi M, Huang C, Jiang G, Yang A, et al. Shortened leukocyte telomere length is associated with glycemic progression in type 2 diabetes: a prospective and mendelian randomization analysis. Diabetes Care. (2022) 45:701–9. doi: 10.2337/dc21-1609
15. Weiss E, Albert S, Reeds D, Kress K, McDaniel J, Klein S, et al. Effects of matched weight loss from calorie restriction, exercise, or both on cardiovascular disease risk factors: a randomized intervention trial. Am J Clin Nutr. (2016) 104:576–86. doi: 10.3945/ajcn.116.131391
16. Perry C, Gadde K. The role of calorie restriction in the prevention of cardiovascular disease. Curr Atheroscler Rep. (2022) 24:235–42. doi: 10.1007/s11883-022-00999-8
17. Kennedy B, Berger S, Brunet A, Campisi J, Cuervo A, Epel E, et al. Geroscience: linking aging to chronic disease. Cell. (2014) 159:709–13. doi: 10.1016/j.cell.2014.10.039
18. Franceschi C, Garagnani P, Parini P, Giuliani C, Santoro A. Inflammaging: a new immune-metabolic viewpoint for age-related diseases. Nat Rev Endocrinol. (2018) 14:576–90. doi: 10.1038/s41574-018-0059-4
19. Chung H, Kim D, Lee E, Chung K, Chung S, Lee B, et al. Redefining chronic inflammation in aging and age-related diseases: proposal of the senoinflammation concept. Aging Dis. (2019) 10:367–82. doi: 10.14336/AD.2018.0324
20. Lasry A, Ben-Neriah Y. Senescence-associated inflammatory responses: aging and cancer perspectives. Trends Immunol. (2015) 36:217–28. doi: 10.1016/j.it.2015.02.009
21. Fulop T, Larbi A, Dupuis G, Le Page A, Frost E, Cohen A, et al. Immunosenescence and inflamm-aging as two sides of the same coin: friends or foes? Front Immunol. (2017) 8:1960. doi: 10.3389/fimmu.2017.01960
22. Xu M, Chen R, Liu L, Liu X, Hou J, Liao J, et al. Systemic immune-inflammation index and incident cardiovascular diseases among middle-aged and elderly Chinese adults: the Dongfeng-Tongji cohort study. Atherosclerosis. (2021) 323:20–9. doi: 10.1016/j.atherosclerosis.2021.02.012
23. Sharif S, Van der Graaf Y, Cramer M, Kapelle L, de Borst G, Visseren F, et al. Low-grade inflammation as a risk factor for cardiovascular events and all-cause mortality in patients with type 2 diabetes. Cardiovasc Diabetol. (2021) 20:220. doi: 10.1186/s12933-021-01409-0
24. Diederichsen M, Diederichsen S, Mickley H, Steffensen F, Lambrechtsen J, Sand N, et al. Prognostic value of suPAR and hs-CRP on cardiovascular disease. Atherosclerosis. (2018) 271:245–51. doi: 10.1016/j.atherosclerosis.2018.01.029
25. Donath M, Meier D, Böni-Schnetzler M. Inflammation in the pathophysiology and therapy of cardiometabolic disease. Endocr Rev. (2019) 40:1080–91. doi: 10.1210/er.2019-00002
26. Hotamisligil G, Erbay E. Nutrient sensing and inflammation in metabolic diseases. Nat Rev Immunol. (2008) 8:923–34. doi: 10.1038/nri2449
27. Franceschi C, Garagnani P, Vitale G, Capri M, Salvioli S. Inflammaging and “Garb-aging.”. Trends Endocrinol Metab. (2017) 28:199–212. doi: 10.1016/j.tem.2016.09.005
28. Barrea L, Di Somma C, Muscogiuri G, Tarantino G, Tenore G, Orio F, et al. Nutrition, inflammation and liver-spleen axis. Crit Rev Food Sci Nutr. (2018) 58:3141–58. doi: 10.1080/10408398.2017.1353479
29. Hernández-Saavedra D, Moody L, Xu G, Chen H, Pan Y. Epigenetic regulation of metabolism and inflammation by calorie restriction. Adv Nutr. (2019) 10:520–36. doi: 10.1093/advances/nmy129
30. Davis N, Crandall J, Gajavelli S, Berman J, Tomuta N, Wylie-Rosett J, et al. Differential effects of low-carbohydrate and low-fat diets on inflammation and endothelial function in diabetes. J Diabetes Complications. (2011) 25:371–6. doi: 10.1016/j.jdiacomp.2011.08.001
31. Jonasson L, Guldbrand H, Lundberg A, Nystrom F. Advice to follow a low-carbohydrate diet has a favourable impact on low-grade inflammation in type 2 diabetes compared with advice to follow a low-fat diet. Ann Med. (2014) 46:182–7. doi: 10.3109/07853890.2014.894286
32. Shivappa N, Godos J, Hébert J, Wirth M, Piuri G, Speciani A, et al. Dietary inflammatory index and cardiovascular risk and mortality-a meta-analysis. Nutrients. (2018) 10:E200. doi: 10.3390/nu10020200
33. da Silva A, Felício M, Caldas A, Miranda Hermsdorff H, Bersch-Ferreira Â, Torreglosa C, et al. Pro-inflammatory diet is associated with a high number of cardiovascular events and ultra-processed foods consumption in patients in secondary care. Public Health Nutr. (2021) 24:3331–40. doi: 10.1017/S136898002000378X
34. Asadi Z, Yaghooti-Khorasani M, Ghazizadeh H, Sadabadi F, Mosa-Farkhany E, Darroudi S, et al. Association between dietary inflammatory index and risk of cardiovascular disease in the Mashhad stroke and heart atherosclerotic disorder study population. IUBMB Life. (2020) 72:706–15. doi: 10.1002/iub.2172
35. Mazidi M, Shivappa N, Wirth M, Hebert J, Mikhailidis D, Kengne A, et al. Dietary inflammatory index and cardiometabolic risk in US adults. Atherosclerosis. (2018) 276:23–7. doi: 10.1016/j.atherosclerosis.2018.02.020
36. Wang Y, Armijos R, Xun P, Weigel M. Dietary inflammatory index and cardiometabolic risk in ecuadorian women. Nutrients. (2021) 13:2640. doi: 10.3390/nu13082640
37. Suhett L, Hermsdorff H, Cota B, Ribeiro S, Shivappa N, Hébert J, et al. Dietary inflammatory potential, cardiometabolic risk and inflammation in children and adolescents: a systematic review. Crit Rev Food Sci Nutr. (2021) 61:407–16. doi: 10.1080/10408398.2020.1734911
38. Ahluwalia N, Dwyer J, Terry A, Moshfegh A, Johnson C. Update on NHANES dietary data: focus on collection, release, analytical considerations, and uses to inform public policy. Adv Nutr. (2016) 7:121–34. doi: 10.3945/an.115.009258
39. National Center for Health Statistics. NHANES Questionnaires, Datasets, and Related Documentation. (2022). Available online at: https://wwwn.cdc.gov/nchs/nhanes/Default.aspx (Accessed May 7, 2022).
40. Expert Panel on Detection, Evaluation, and Treatment of High Blood Cholesterol in Adults. Executive summary of the third report of the National Cholesterol Education Program (NCEP) expert panel on detection, evaluation, and treatment of high blood cholesterol in adults (Adult Treatment Panel III). JAMA. (2001) 285:2486–97. doi: 10.1001/jama.285.19.2486
41. Klemera P, Doubal S. A new approach to the concept and computation of biological age. Mech Ageing Dev. (2006) 127:240–8. doi: 10.1016/j.mad.2005.10.004
42. Levine M, Lu A, Quach A, Chen B, Assimes T, Bandinelli S, et al. An epigenetic biomarker of aging for lifespan and healthspan. Aging (Albany NY). (2018) 10:573–91. doi: 10.18632/aging.101414
43. Kwon D, Belsky DW. A toolkit for quantification of biological age from blood chemistry and organ function test data: BioAge. Geroscience. (2021) 43:2795–808. doi: 10.1007/s11357-021-00480-5
44. Kresovich JK, Garval EL, Martinez Lopez AM, Xu Z, Niehoff NM, White AJ, et al. Associations of body composition and physical activity level with multiple measures of epigenetic age acceleration. Am J Epidemiol. (2021) 190:984–93. doi: 10.1093/aje/kwaa251
45. Shivappa N, Steck S, Hurley T, Hussey J, Hébert J. Designing and developing a literature-derived, population-based dietary inflammatory index. Public Health Nutr. (2014) 17:1689–96. doi: 10.1017/S1368980013002115
46. Lloyd-Jones D, Hong Y, Labarthe D, Mozaffarian D, Appel L, Van Horn L, et al. Defining and setting national goals for cardiovascular health promotion and disease reduction: the American Heart Association’s strategic impact goal through 2020 and beyond. Circulation. (2010) 121:586–613. doi: 10.1161/CIRCULATIONAHA.109.192703
47. Mellen P, Gao S, Vitolins M, Goff D Jr. Deteriorating dietary habits among adults with hypertension: DASH dietary accordance, NHANES 1988-1994 and 1999-2004. Arch Intern Med. (2008) 168:308–14. doi: 10.1001/archinternmed.2007.119
48. Foraker R, Abdel-Rasoul M, Kuller L, Jackson R, Van Horn L, Seguin R, et al. Cardiovascular health and incident cardiovascular disease and cancer: the women’s health initiative. Am J Prev Med. (2016) 50:236–40. doi: 10.1016/j.amepre.2015.07.039
49. Hankinson A, Daviglus M, Bouchard C, Carnethon M, Lewis C, Schreiner P, et al. Maintaining a high physical activity level over 20 years and weight gain. JAMA. (2010) 304:2603–10. doi: 10.1001/jama.2010.1843
50. Kidney Disease: Improving Global Outcomes (Kdigo) Glomerular Diseases Work Group. KDIGO 2021 clinical practice guideline for the management of glomerular diseases. Kidney Int. (2021) 100:S1–276. doi: 10.1016/j.kint.2021.05.021
51. Möller S, Bliddal M, Rubin K. Methodical considerations on adjusting for Charlson comorbidity index in epidemiological studies. Eur J Epidemiol. (2021) 36:1123–8. doi: 10.1007/s10654-021-00802-z
52. Charlson M, Carrozzino D, Guidi J, Patierno C. Charlson comorbidity index: a critical review of clinimetric properties. Psychother Psychosom. (2022) 91:8–35. doi: 10.1159/000521288
53. Stekhoven D, Bühlmann P. MissForest–non-parametric missing value imputation for mixed-type data. Bioinformatics. (2012) 28:112–8. doi: 10.1093/bioinformatics/btr597
54. Couteur D, Barzilai N. New horizons in life extension, healthspan extension and exceptional longevity. Age Ageing. (2022) 51:afac156. doi: 10.1093/ageing/afac156
55. Partridge L, Fuentealba M, Kennedy B. The quest to slow ageing through drug discovery. Nat Rev Drug Discov. (2020) 19:513–32. doi: 10.1038/s41573-020-0067-7
56. Belsky D, Moffitt T, Cohen A, Corcoran D, Levine M, Prinz J, et al. Eleven telomere, epigenetic clock, and biomarker-composite quantifications of biological aging: do they measure the same thing? Am J Epidemiol. (2018) 187:1220–30. doi: 10.1093/aje/kwx346
57. Jylhävä J, Pedersen N, Hägg S. Biological age predictors. EBioMedicine. (2017) 21:29–36. doi: 10.1016/j.ebiom.2017.03.046
58. Liu Z, Kuo P, Horvath S, Crimmins E, Ferrucci L, Levine M. A new aging measure captures morbidity and mortality risk across diverse subpopulations from NHANES IV: a cohort study. PLoS Med. (2018) 15:e1002718. doi: 10.1371/journal.pmed.1002718
59. Ma Q, Li B, Yang L, Zhang M, Feng X, Li Q, et al. Association between phenotypic age and mortality in patients with multivessel coronary artery disease. Dis Markers. (2022) 2022:4524032. doi: 10.1155/2022/4524032
60. Chan M, Arnold M, Offer A, Hammami I, Mafham M, Armitage J, et al. Biomarker-based biological age in UK Biobank: composition and prediction of mortality and hospital admissions. J Gerontol A Biol Sci Med Sci. (2021) 76:1295–302. doi: 10.1093/gerona/glab069
61. Kuo C, Pilling L, Liu Z, Atkins J, Levine M. Genetic associations for two biological age measures point to distinct aging phenotypes. Aging Cell. (2021) 20:e13376. doi: 10.1111/acel.13376
62. De Meyer T, Nawrot T, Bekaert S, De Buyzere M, Rietzschel E, Andrés V. Telomere length as cardiovascular aging biomarker: JACC review topic of the week. J Am Coll Cardiol. (2018) 72:805–13. doi: 10.1016/j.jacc.2018.06.014
63. García-Calzón S, Zalba G, Ruiz-Canela M, Shivappa N, Hébert J, Martínez J, et al. Dietary inflammatory index and telomere length in subjects with a high cardiovascular disease risk from the PREDIMED-NAVARRA study: cross-sectional and longitudinal analyses over 5 y. Am J Clin Nutr. (2015) 102:897–904. doi: 10.3945/ajcn.115.116863
64. Hastings W, Shalev I, Belsky D. Comparability of biological aging measures in the National health and nutrition examination study, 1999-2002. Psychoneuroendocrinology. (2019) 106:171–8. doi: 10.1016/j.psyneuen.2019.03.012
65. Diebel L, Rockwood K. Determination of biological age: geriatric assessment vs biological biomarkers. Curr Oncol Rep. (2021) 23:104. doi: 10.1007/s11912-021-01097-9
66. Farooqi M, Gerstein H, Yusuf S, Leong D. Accumulation of deficits as a key risk factor for cardiovascular morbidity and mortality: a pooled analysis of 154 000 individuals. J Am Heart Assoc. (2020) 9:e014686. doi: 10.1161/JAHA.119.014686
67. Laclaustra M, Rodriguez-Artalejo F, Guallar-Castillon P, Banegas J, Graciani A, Garcia-Esquinas E, et al. The inflammatory potential of diet is related to incident frailty and slow walking in older adults. Clin Nutr. (2020) 39:185–91. doi: 10.1016/j.clnu.2019.01.013
68. Millar C, Dufour A, Shivappa N, Habtemariam D, Murabito J, Benjamin E, et al. A proinflammatory diet is associated with increased odds of frailty after 12-year follow-up in a cohort of adults. Am J Clin Nutr. (2022) 115:334–43. doi: 10.1093/ajcn/nqab317
69. Kim D, Park Y. Association between the dietary inflammatory index and risk of frailty in older individuals with poor nutritional status. Nutrients. (2018) 10:E1363. doi: 10.3390/nu10101363
70. Lind L, Ingelsson E, Sundström J, Siegbahn A, Lampa E. Methylation-based estimated biological age and cardiovascular disease. Eur J Clin Invest. (2018) 48:e12872. doi: 10.1111/eci.12872
71. Pottinger T, Khan S, Zheng Y, Zhang W, Tindle H, Allison M, et al. Association of cardiovascular health and epigenetic age acceleration. Clin Epigenetics. (2021) 13:42. doi: 10.1186/s13148-021-01028-2
72. Lo Y, Lin W. Cardiovascular health and four epigenetic clocks. Clin Epigenetics. (2022) 14:73. doi: 10.1186/s13148-022-01295-7
73. Kim Y, Huan T, Joehanes R, McKeown N, Horvath S, Levy D, et al. Higher diet quality relates to decelerated epigenetic aging. Am J Clin Nutr. (2022) 115:163–70. doi: 10.1093/ajcn/nqab201
74. Phillips C, Harrington J, Perry I. Relationship between dietary quality, determined by DASH score, and cardiometabolic health biomarkers: a cross-sectional analysis in adults. Clin Nutr. (2019) 38:1620–8. doi: 10.1016/j.clnu.2018.08.028
75. Millar S, Navarro P, Harrington J, Shivappa N, Hébert J, Perry I, et al. Dietary score associations with markers of chronic low-grade inflammation: a cross-sectional comparative analysis of a middle- to older-aged population. Eur J Nutr. (2022) 61:3377–90. doi: 10.1007/s00394-022-02892-1
76. Longo V, Anderson R. Nutrition, longevity and disease: from molecular mechanisms to interventions. Cell. (2022) 185:1455–70. doi: 10.1016/j.cell.2022.04.002
77. Huffman K, Parker D, Bhapkar M, Racette S, Martin C, Redman L, et al. Calorie restriction improves lipid-related emerging cardiometabolic risk factors in healthy adults without obesity: distinct influences of BMI and sex from CALERIETM a multicentre, phase 2, randomised controlled trial. EClinicalMedicine. (2022) 43:101261. doi: 10.1016/j.eclinm.2021.101261
Keywords: dietary inflammatory potential, dietary inflammatory index, aging acceleration, biological aging, cardiometabolic disease
Citation: Hu Y, Wang X, Huan J, Zhang L, Lin L, Li Y and Li Y (2022) Effect of dietary inflammatory potential on the aging acceleration for cardiometabolic disease: A population-based study. Front. Nutr. 9:1048448. doi: 10.3389/fnut.2022.1048448
Received: 19 September 2022; Accepted: 18 November 2022;
Published: 02 December 2022.
Edited by:
Enrico Dainese, University of Teramo, ItalyReviewed by:
Manlio Vinciguerra, International Clinical Research Center (FNUSA-ICRC), CzechiaCopyright © 2022 Hu, Wang, Huan, Zhang, Lin, Li and Li. This is an open-access article distributed under the terms of the Creative Commons Attribution License (CC BY). The use, distribution or reproduction in other forums is permitted, provided the original author(s) and the copyright owner(s) are credited and that the original publication in this journal is cited, in accordance with accepted academic practice. No use, distribution or reproduction is permitted which does not comply with these terms.
*Correspondence: Yunlun Li, bGkueXVubHVuQDE2My5jb20=
Disclaimer: All claims expressed in this article are solely those of the authors and do not necessarily represent those of their affiliated organizations, or those of the publisher, the editors and the reviewers. Any product that may be evaluated in this article or claim that may be made by its manufacturer is not guaranteed or endorsed by the publisher.
Research integrity at Frontiers
Learn more about the work of our research integrity team to safeguard the quality of each article we publish.