
94% of researchers rate our articles as excellent or good
Learn more about the work of our research integrity team to safeguard the quality of each article we publish.
Find out more
ORIGINAL RESEARCH article
Front. Nutr., 28 October 2022
Sec. Food Chemistry
Volume 9 - 2022 | https://doi.org/10.3389/fnut.2022.1007164
This article is part of the Research TopicFlavor Chemistry of Food: Mechanism, Interaction, New AdvancesView all 24 articles
 Xiaojie Zhou1,2,3,4
 Wenhua Zhou1,3Xiaojie He2,4Yaxin Deng2,4Liangyi Li1,3Ming Li2,4Xuzhong Feng4,5Lin Zhang1,3*Liangzhong Zhao2,4*
Red Sour Soup (RSS) is a traditional fermented food in China. After two rounds of fermentation, sour soup has a mellow flavor. However, the microbial composition and flavor formation processes in post-fermentation in RSS are unclear. This study investigates the bacteria composition of RSS during the post-fermentation stage (0–180 days) using high-throughput sequencing. The results show that lactic acid bacteria (LAB) are dominant during the post-fermentation process, and their abundance gradually increases with fermentation time. Additionally, gas chromatography-mass spectrometry was used to detect volatile flavor compounds in the post-fermentation process. Seventy-seven volatile flavor compounds were identified, including 24 esters, 14 terpenes, 9 aromatic hydrocarbons, 9 alkanes, 6 heterocyclic compounds, 3 alcohols, 3 acids, 3 ketones, 2 phenols, 2 aldehydes, 1 amine, and 1 other. Esters and aromatic hydrocarbons are the main volatile compounds in RSS during the post-fermentation process. Orthogonal partial least squares screening and correlation analysis derived several significant correlations, including 48 pairs of positive correlations and 19 pairs of negative correlations. Among them, Acetobacter spp., Clostridium spp. and Sporolactobacillus spp. have 15, 14, 20 significant correlation pairs, respectively, and are considered the most important bacterial genera post-fermentation. Volatile substances become abundant with increasing fermentation time. LAB are excessive after more than 120 days but cause a drastic reduction in volatile ester levels. Thus, the post-fermentation time should be restricted to 120 days, which retains the highest concentrations of volatile esters in RSS. Overall, these findings provide a theoretical basis to determine an optimal post-fermentation time duration, and identify essential bacteria for manufacturing high-quality starter material to shorten the RSS post-fermentation processing time.
In China, fermentation has more than 3,000 years of history, and there are representative traditional fermented foods with unique characteristics for different regions or ethnic groups (1–3). Sour soup is a well-known traditional fermented food with a thousand years of history originating from a minority group in Guizhou of Kaili, China (4). It has been used as a condiment due to its unique flavor and high nutritional value. It can promote digestion, regulate intestinal flora, improve free radical scavenging and enhance immunity (5). Sour soup is categorized as Red Sour Soup (RSS) and white sour soup due to the differences in raw materials and fermentation process (6). RSS is mainly made of fresh red pepper and tomato, fermented for a few months by spontaneous fermentation without starter material (7). RSS’s widely used production technology includes two anaerobic fermentation stages: pre-fermentation and post-fermentation (8). Pre-fermentation is the separate fermentation process of tomato and pepper in a jar for 3 to 12 months. Post-fermentation is a mixture of pre-fermented tomatoes and peppers in proportion, with an appropriate number of auxiliary materials added, such as rice milk, and then put into a jar for fermentation for 1 to 6 months.
Like other fermented vegetables, the fermentation process of RSS involves complex microbial communities. Many studies demonstrated that the fermented food flavor is mainly attributed to the contribution of microbial communities in succession (2, 3, 9). When investigating the flavor components of commercial sour soup, it was found that predominantly volatile flavor compounds are esters and terpenoids (10–12). Esters are mainly derived from raw materials and the metabolites of microorganisms, while terpenoids mainly come from the raw material itself. Lactobacillus, Weissella and yeast were previously detected in RSS, with lactic acid bacteria (LAB) playing a leading role (13). LAB secretes large amounts of lactic acid, which not only participate in the reaction to produce abundant esters to enrich the volatile flavor but also generates extreme environmental pressure to inhibit the growth of miscellaneous bacteria and improve product quality. Additionally, some studies have found that fungi and bacteria played a role in the fermentation of sour soups. But, the presence of fungi seemed to incur the risk of some toxins that could produce an unpleasant flavor (9). However, the microbiota succession of RSS during post-fermentation and its relationship with the specific flavor of RSS remains unclear.
Various methods were undertaken to study bacterial diversity, including microbial isolation and cultivation, polymerase chain reaction-denaturing gradient gel electrophoresis (PCR-DGGE), and DNA cloning libraries (14–16). However, the conventional methods of microorganism investigation take time and have low sensitivity. In contrast, the high-throughput sequencing method has the advantages of short sequencing time and high sequencing flux, allowing it to determine the full diversity of microbial flora (17, 18). Headspace solid-phase microextraction coupled with gas chromatography-mass spectrometry (HS-SPME-GC-MS) with high sensitivity has been widely chosen to determine volatile compounds in samples (19, 20). Recently, these techniques have been used to detect microbial and flavor compounds in traditionally brewed foods (21, 22). Orthogonal partial least squares discriminant analysis (OPLS-DA) and Pearson correlation analysis have been widely applied to investigate the relationship between microorganisms and flavor substances in fermented foods (23, 24).
Currently, some studies explored the dynamic changes of microbial communities and flavor substances and the correlation between bacterial communities and flavor substances in RSS (8, 11, 12). However, most researchers focus on the kinds of bacteria and flavor compounds in RSS during the pre-fermentation process (7–9, 12). The correlation between bacterial successions and the production of volatile aromatic substances during the post-fermentation is unclear. This study performs HS-SPME-GC-MS to evaluate the correlation between bacterial communities and volatile aromatic substances in four different post-fermentation stages (0–180 days) of RSS. The results will enable the characterization of condiment fermentation mechanisms, while providing a theoretical framework for directional regulation of RSS.
The RSS samples were provided by Kaili Lianghuan Biotechnology Co., Ltd (Guizhou, China). The RSS was manufactured according to Li et al. (8). The sample production process was: (1) mix pepper and distilled water with a ratio of 1:2 (wt/wt). Once smashed, add 30 g/kg of salt, followed by storage in fermenting jars for 30 days. (2) Fresh tomato was directly chopped and ground into a colloid sauce, 30 g/kg salt was added, and fermented in jars for 30 days. (3) Mix the finished fermentation products of (1) and (2) in a ratio of 1:3, then add 1% (wt/wt) rice milk, and transfer into the jar. The fermentation tank was then loaded, and the product was fermented for 180 days. Four groups of samples were collected at the appropriate fermentation time points (0 days, 60 days, 120 days, and 180 days) with six replicates per group. The test samples were from batches with different post-fermentation times and labeled sequentially as F-A (0 days), F-B (60 days), F-C (120 days) and F-D (180 days). Samples were prepared by mixing equal amounts of the mixture from five points, consisting of the four corners and the midpoint of the fermentation tank: upper (1 sample), middle (2 samples), left (1 sample), right (1 sample) and bottom (1 sample). The mixed samples were collected in sterilized sampling bottles. Twenty-four samples were collected in sterilized vials, transported on dry ice to the laboratory, and stored at –80°C for analysis.
The total DNA from each 5 mL sample of sour soup was extracted using the E.Z.N.A.® Soil DNA Kit (Omega Bio-Tek, Norcross, GA, United States) following instructions provided by the manufacturer. Agarose gel electrophoresis was performed to check DNA quality, and a NanoDrop 2000 UV-vis spectrophotometer (Thermo Scientific, Wilmington, USA) was used to measure the final DNA concentration and purity. Using a thermocycler PCR system (GeneAmp 9700, ABI, USA), primers 338F (5′-ACTCCTACGGGAGGCAGCAG-3′) and 806R (5′-GGACTACHVGGGTWTCTAAT-3′) were used to amplify the V3-V4 hypervariable regions of the bacterial 16S rDNA gene [Lin et al. (10)]. For the PCR reaction, the following program was used: 3 min of denaturation at 95°C, 27 cycles of 30 s each at 95°C, 30 s for annealing at 55°C, and 45 s for elongation at 72°C, followed by a final extension at 75°C for 5 min. This reaction was performed in triplicate in a 20 μL mixture containing 4 μL of 5 × FastPfu Buffer, 2 μL of 2.5 mmol/L dNTPs, 0.8 μL of each primer (5 μmol/L), 0.4 μL of FastPfu Polymerase and 10 ng of template DNA. The AxyPrep DNA Gel Extraction Kit (Axygen Biosciences, Union City, CA, USA) was used to extract PCR products from a 2% agarose gel and purify them further. The QuantiFluor™-ST system (Promega, USA) was used to quantify the DNA according to the manufacturer’s protocol. Purified amplicons were sequenced on an Illumina MiSeq platform (Illumina, San Diego, USA) using equimolar pooling and paired-end sequencing (2 × 300 bp). Quantitative library concentrations were measured using a Qubit v.3.0 Fluorometer (Invitrogen, Carlsbad, CA, USA). The library was quantified to 10 nmol/L. Illumina MiSeq (Illumina, San Diego, CA, USA) was used for the PE250/FE300 paired-end sequencing, and data were read using MiSeq Control Software (Illumina, San Diego, CA, USA).
Volatile organic compounds (VOCs) of RSS samples were analyzed using HS-SPME-GC/MS according to previously reported methods (8) with some modifications. Samples (1 g) of RSS were immediately transferred to Agilent headspace vials (Agilent, Palo Alto, CA, USA) with a NaCl-saturated solution to inhibit enzyme reactions. Crimp-top caps with TFE-silicone septa (Agilent) were used to seal the vials. Each vial was incubated at 60°C for 10 min. Following this, a 65 μm carboxen-polydimethylsiloxane fiber (Supelco, Bellefonte, PA, USA) was inserted in the sample’s headspace for 20 min at 60°C. To extract the VOCs from the fiber coating, the injection port of a high-performance gas chromatography instrument (Model 7890B, Agilent) was heated to 250°C for 5 min in splitless mode after sampling. The identification and quantification of VOCs were undertaken using an Agilent Model 7890B GC and a 7000D mass spectrometer (Agilent), equipped with a 30 m × 0.25 mm × 1.0 μm DB-5MS (5% phenyl-polymethylsiloxane) capillary column. Helium (99.999% purity) was used as the carrier gas at a linear velocity of 1.0 mL/min. The injector temperature was maintained at 250°C and the detector at 280°C. The oven temperature was programmed from 40°C (maintained for 5 min) to 280°C (maintained for 5 min) with a rate of 6°C/min. Spectra were recorded at 70 eV using electron impact ionization mode (EI) and scanned in an m/z range of 30–350 amu at 1 s intervals. The temperatures of the quadrupole mass detector, ion source and transfer line were set at 150, 230, and 280°C, respectively. The volatile compounds were identified by comparing the mass spectra with the MetWare data system library.1
Sequence clustering was performed using VSEARCH (v. 1.9.6) (the similarity level was set to 97%). Silva 132 was used as the 16S rRNA reference database. Species classification analysis of the operational taxonomic units (OTUs) was carried out using the RDP Classifier (Ribosomal Database Program) Bayesian algorithm. The alpha diversity indices were calculated based on the OTU analysis results. Principal component analysis (PCA) and Pearson’s correlation were performed with selected signals obtained through chromatogram processing in SPSS 22.0 (SPSS 22.0 for Windows, SPSS, Chicago, Illinois, USA).
Based on the 97% similarity of OTUs, Figure 1 shows the rarefaction curve of the bacterial community. Approximately 8,000 sequences provided sufficient coverage of all taxa in the four groups, and the number of observed OTUs stabilized beyond this point.
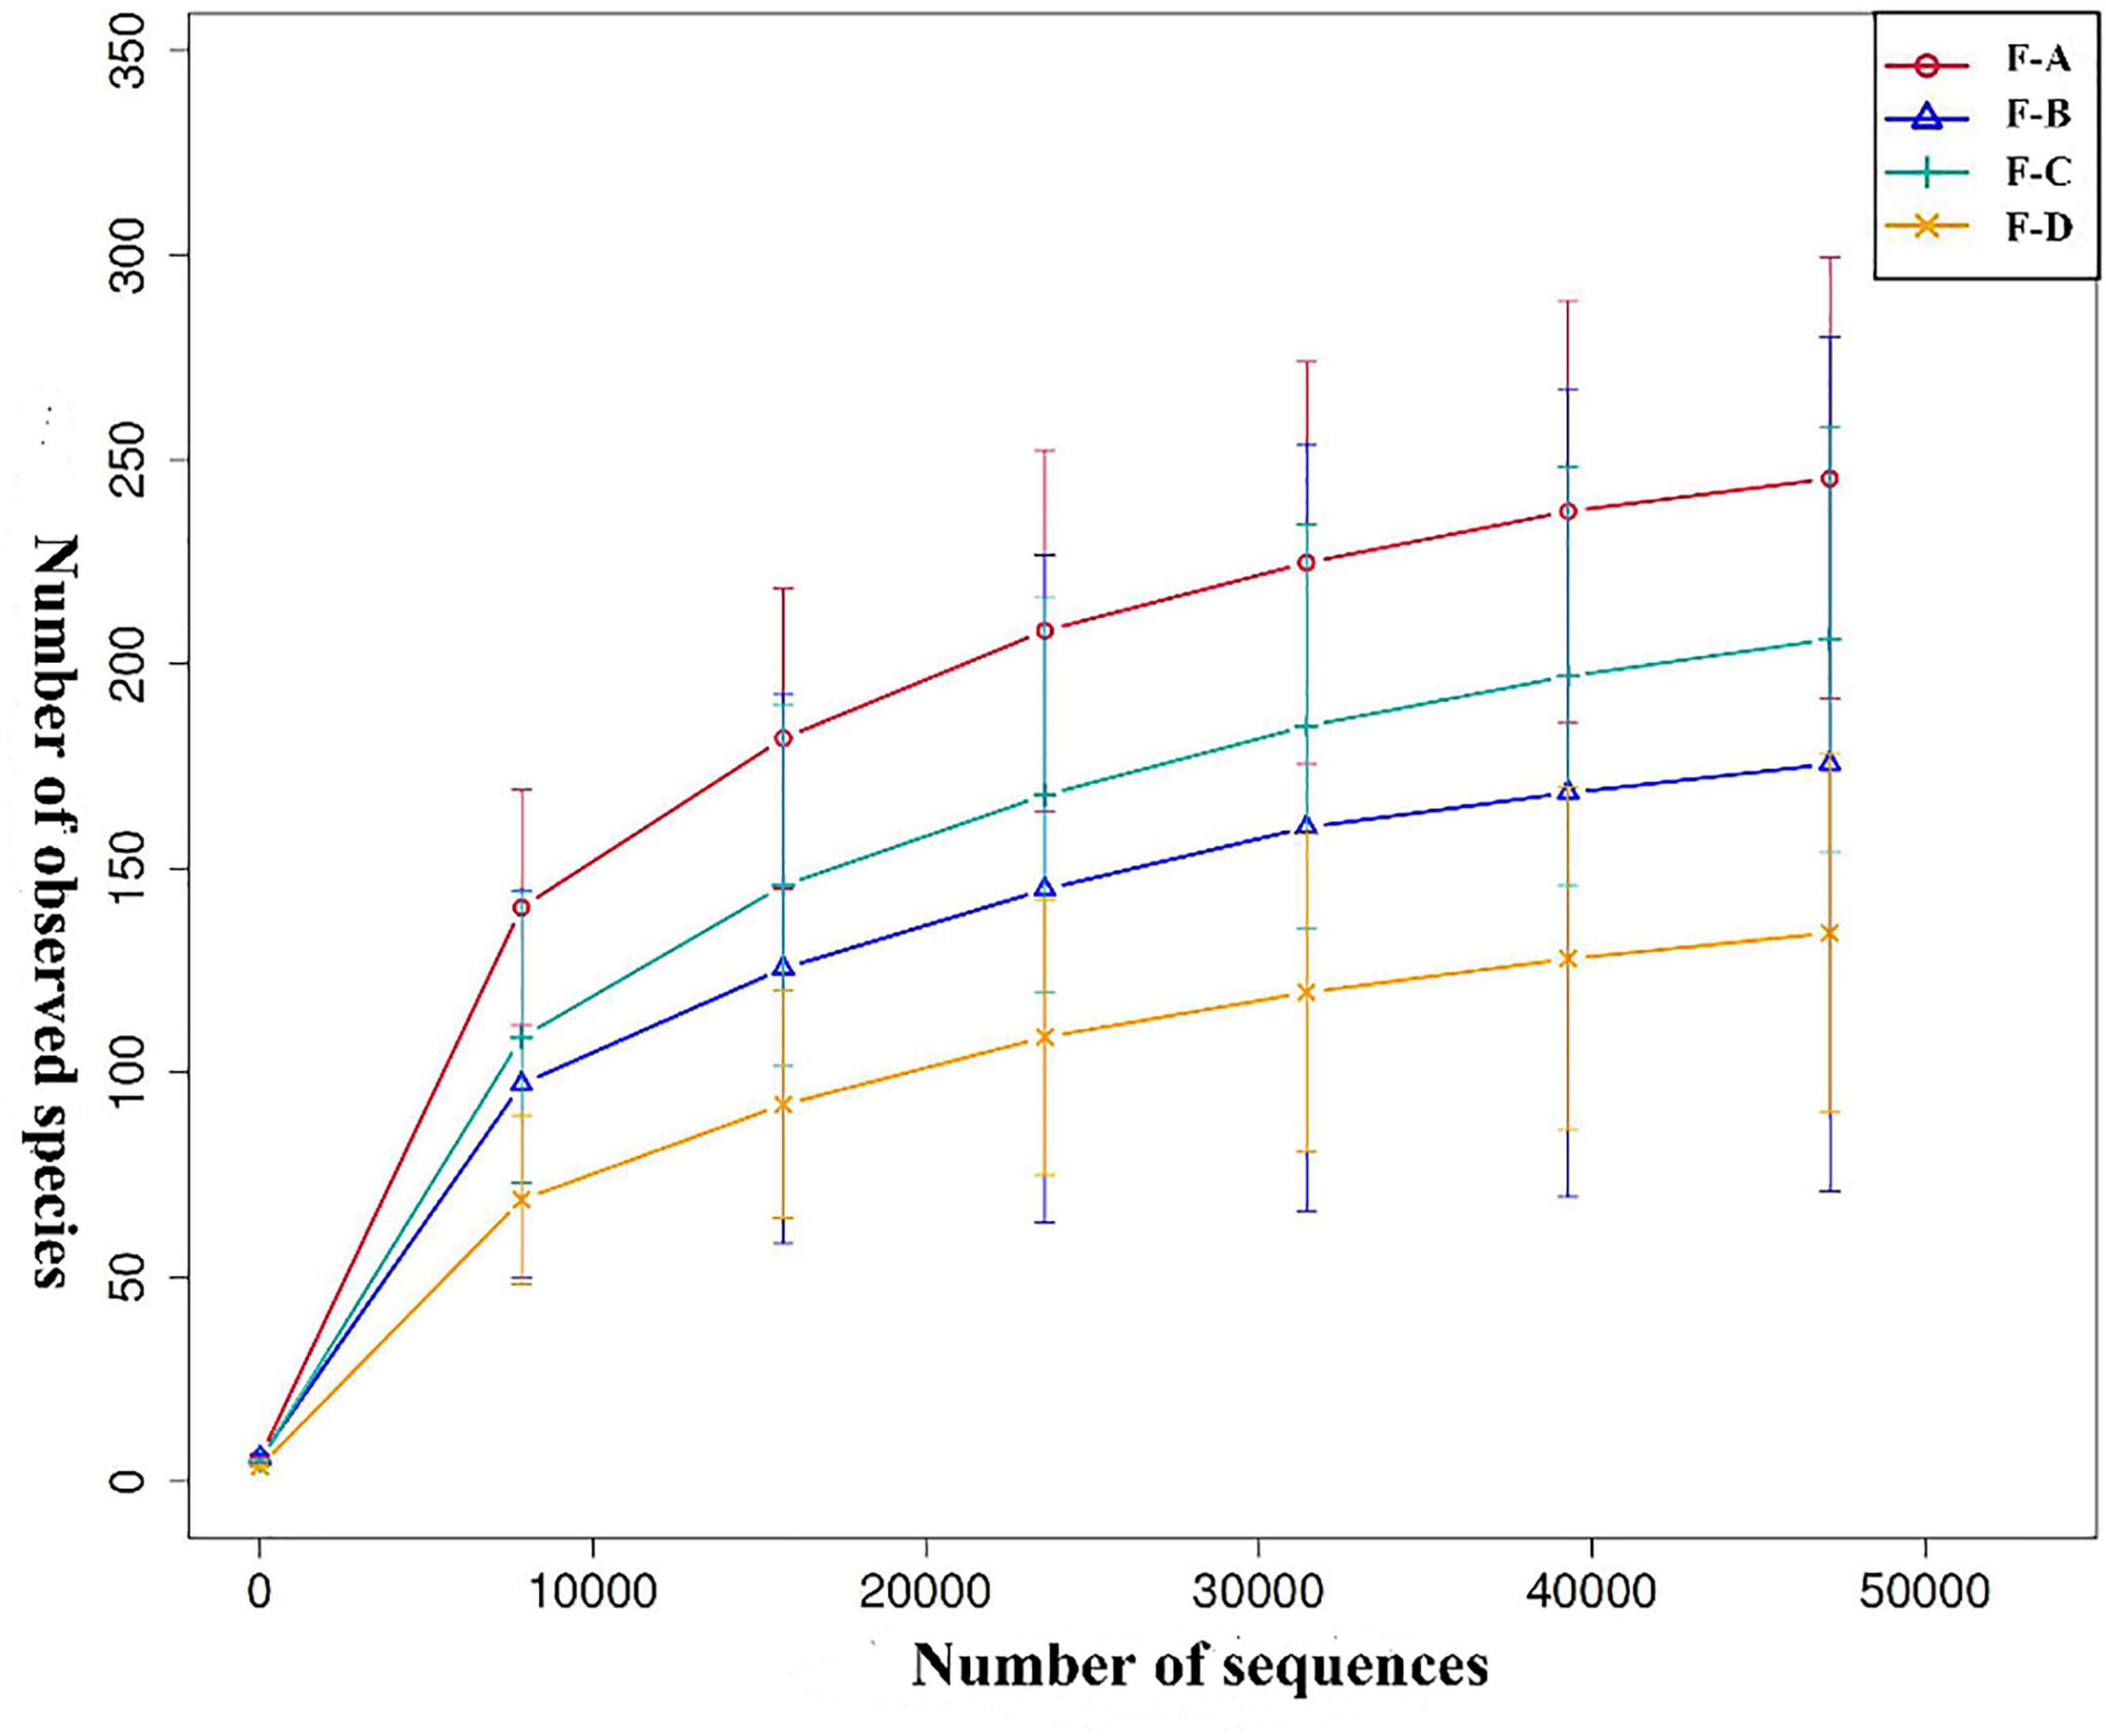
Figure 1. Rarefaction curve analysis of different sour soup samples at different post-fermentation stages. Each line of a different color represents data from each sample group. F-A, F-B, F-C and F-D refer to the sour soup samples fermented for 0 days, 60 days, 120 days, and 180 days, respectively. The abscissa denotes the number of sequences, and the ordinate denotes the number of observed OTUs.
Under the 97% similarity threshold of OTUs, the alpha diversity indices of four sample groups were used to assess differences in the abundance and diversity of bacteria. The observed species, Shannon, Simpson, ACE, Chao1 and Good’s coverage indices are shown in Table 1. The results indicate that the Good’s coverage index of each group is equal to 1, indicating that the sequencing depth of all samples was sufficient to provide a reliable overall representation of the bacteria. The highest value of observed species is found in group F-C (120 days), followed by groups F-A (0 days) and F-D (180 days), and finally, F-B (60 days). Similar trends are found in the Chao1 and ACE indices. These results indicate that at 120 days of fermentation, the RSS has the highest bacterial richness. The Shannon and Simpson indices decrease gradually with increasing fermentation time, illustrating that the diversity of bacteria in RSS decreases with fermentation time.
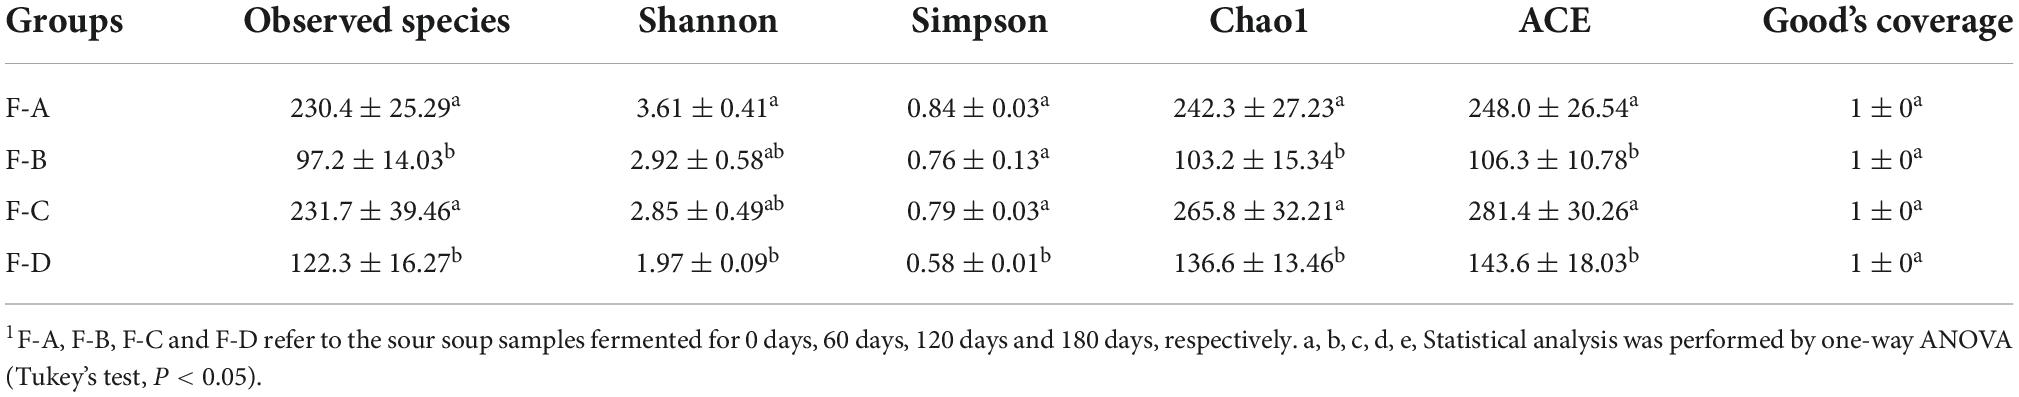
Table 1. Sequencing data and alpha diversity analysis.
From Figure 2, the values of OTUs in RSS are significantly different at the four post-fermentation stages. The standard and unique OTUs drawn are represented using Venn diagrams, which more intuitively show the uniqueness and overlap of sample OTUs composition. The total OTUs in the F-A, F-B, F-C and F-D groups are 766, 645, 685 and 371, respectively. Figure 2 showed that their shared OTUs were 342, 315, 200, 238, 176, and 212 in the intersection of F-A and F-B, F-A and F-C, F-A and F-D, F-B and F-C, F-B and F-D, F-C and F-D, respectively. At the initial stage of post-fermentation (0–60 days), the number of intersectional OTUs was 342 (Figure 2A). Surprisingly, that gradually decreases to 315 and 200 when the fermentation time increases to 120 and 180 days (Figures 2B,C). According to Figures 2D–F, the uniqueness of OTUs mainly occurs between the 120 days and 180 days samples. At the other fermentation times, there are minimal changes in the uniqueness of OUTs.
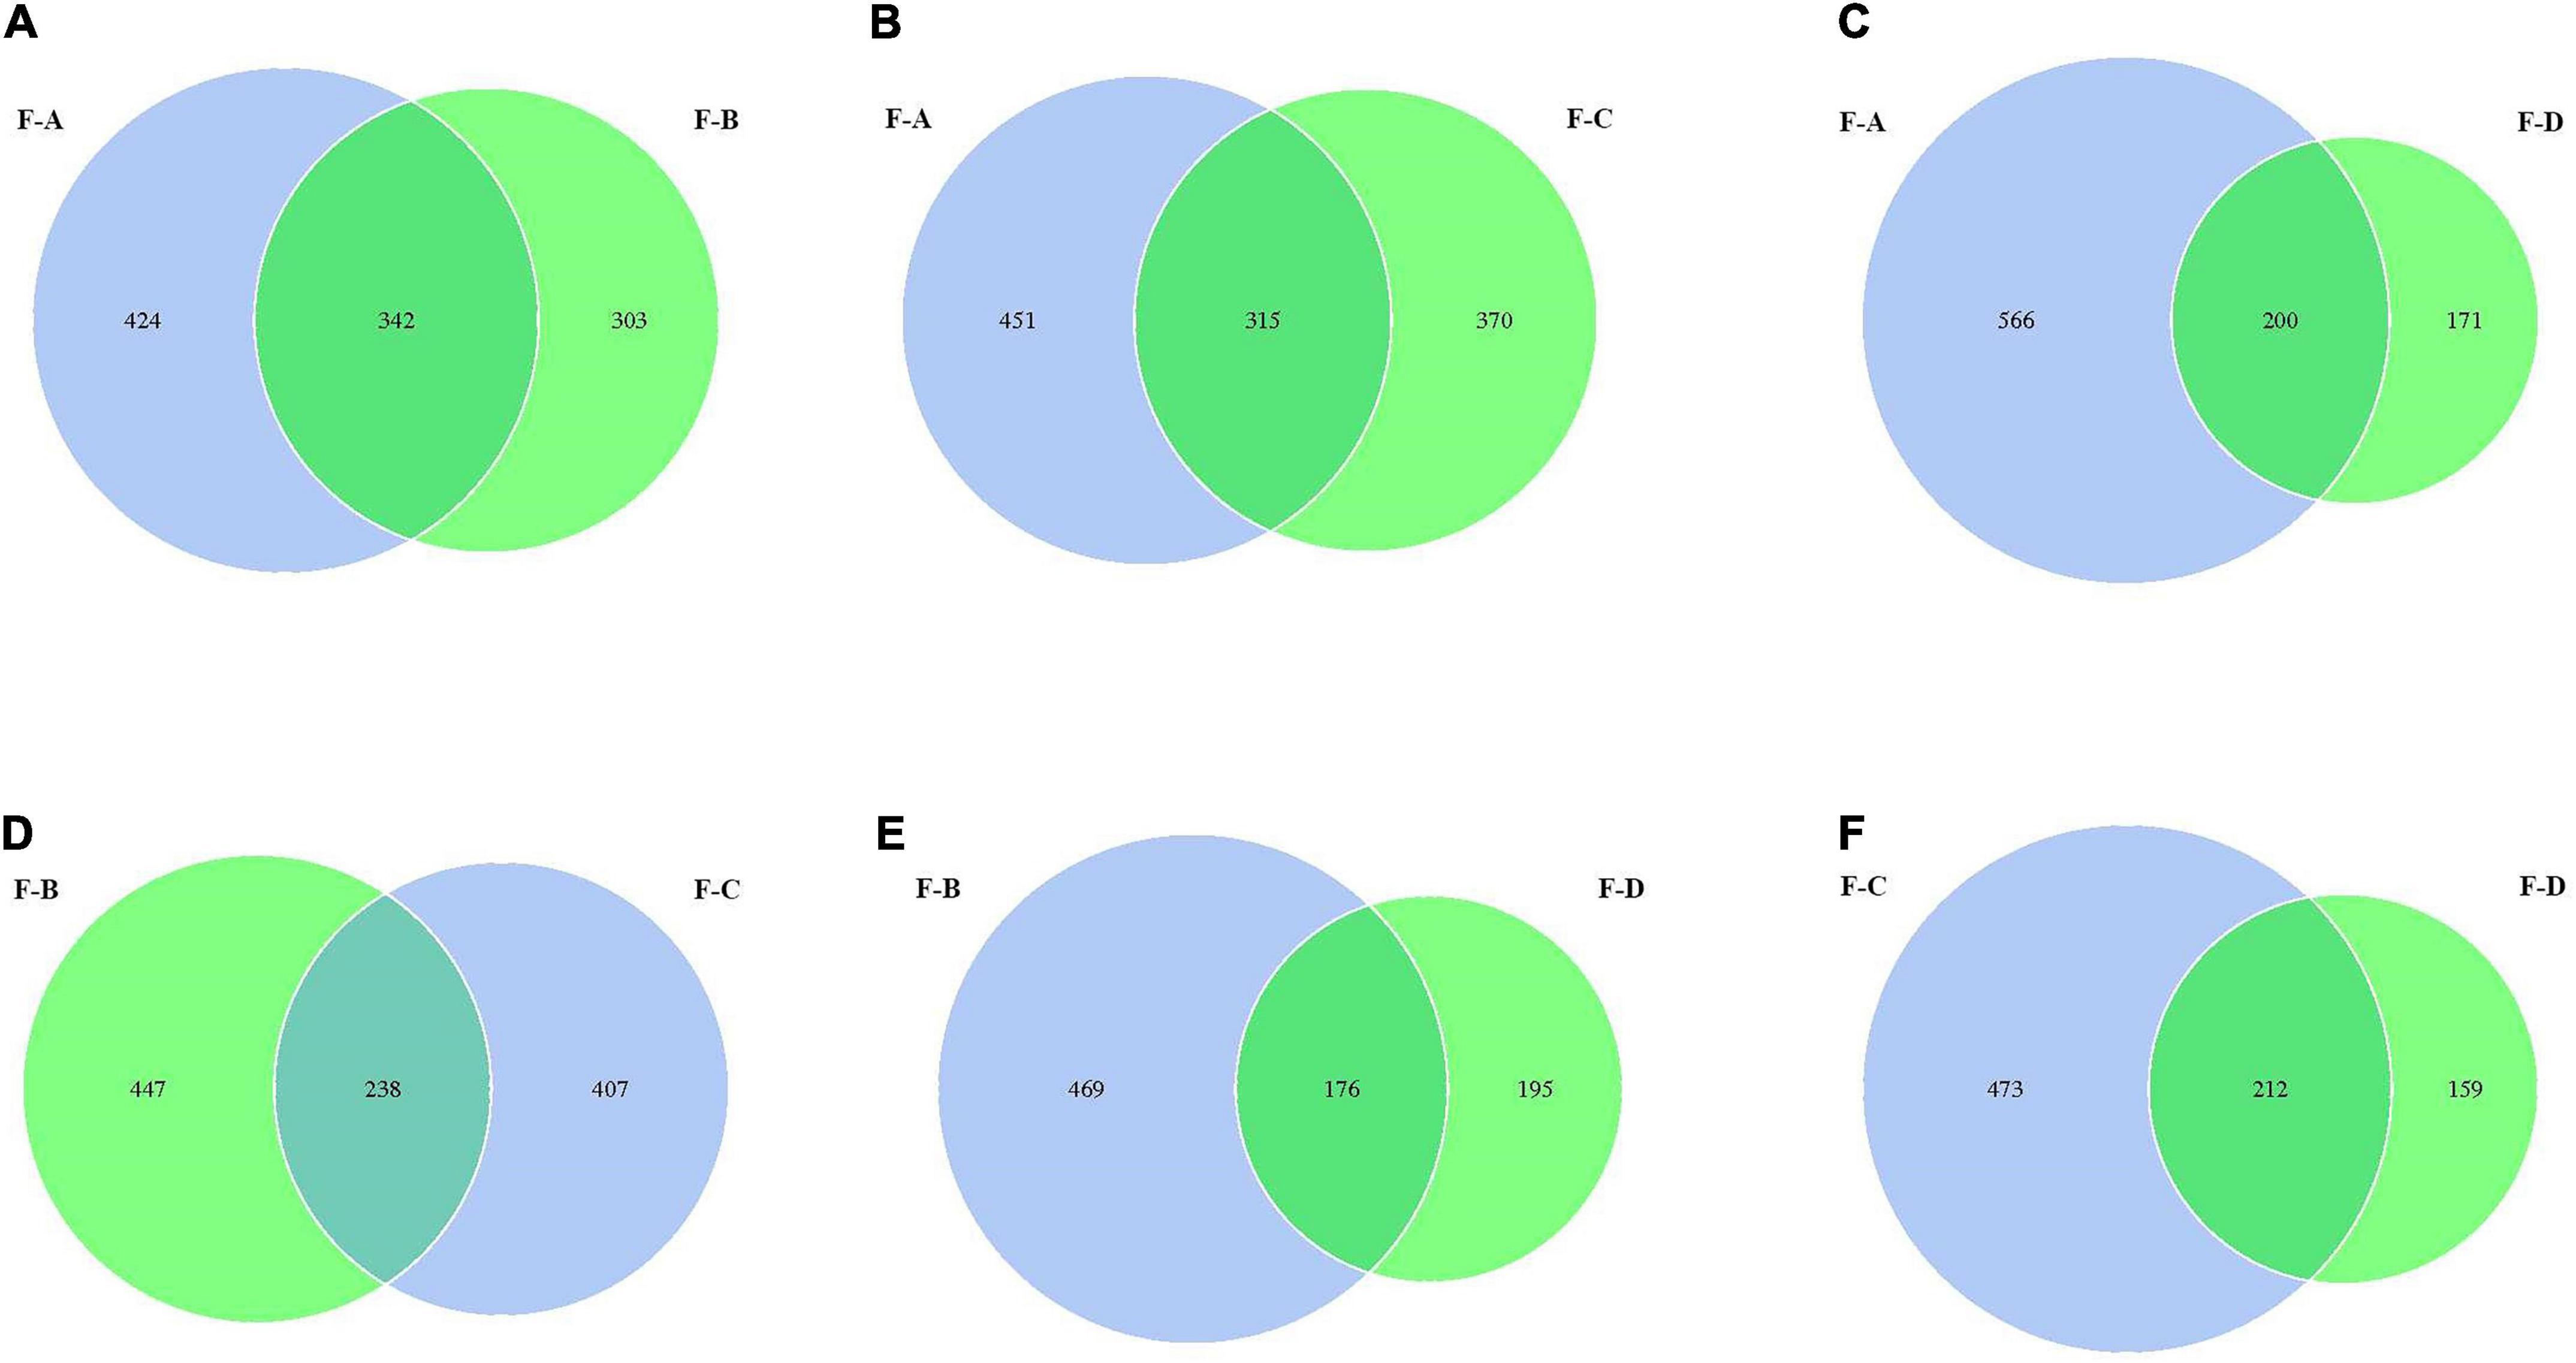
Figure 2. The Venn analysis of the bacterial composition in red sour soup based on OUT levels. Each circle represents a sample, the numbers of circles and overlapping parts represent the number of OTUs shared between samples, and the numbers without overlapping parts represent the number of unique OTUs of samples.
The phylum and genus of the bacteria were distinguished based on the OTUs level to investigate the bacterial compositions in detail. More than 30 phyla and 364 genera are detected in RSS samples during post-fermentation, and the top 10 most abundant groups are shown in (Figure 3). Firmicutes (72.94–99.18%), Proteobacteria (0.16–23.16%) and Actinobacteriota (0.11–7.39%) are the dominant phyla in the fermentation process of sour soup, accounting for more than 90% (Figure 3A). Interestingly, Firmicutes decrease at 120 days and then increase with increasing fermentation time. Proteobacteria and Actinobacteriota exhibited a gradually decreasing trend during the post-fermentation process. Miscellaneous bacteria gradually decrease during fermentation, indicating that increasing the fermentation time can reduce the miscellaneous bacteria content.
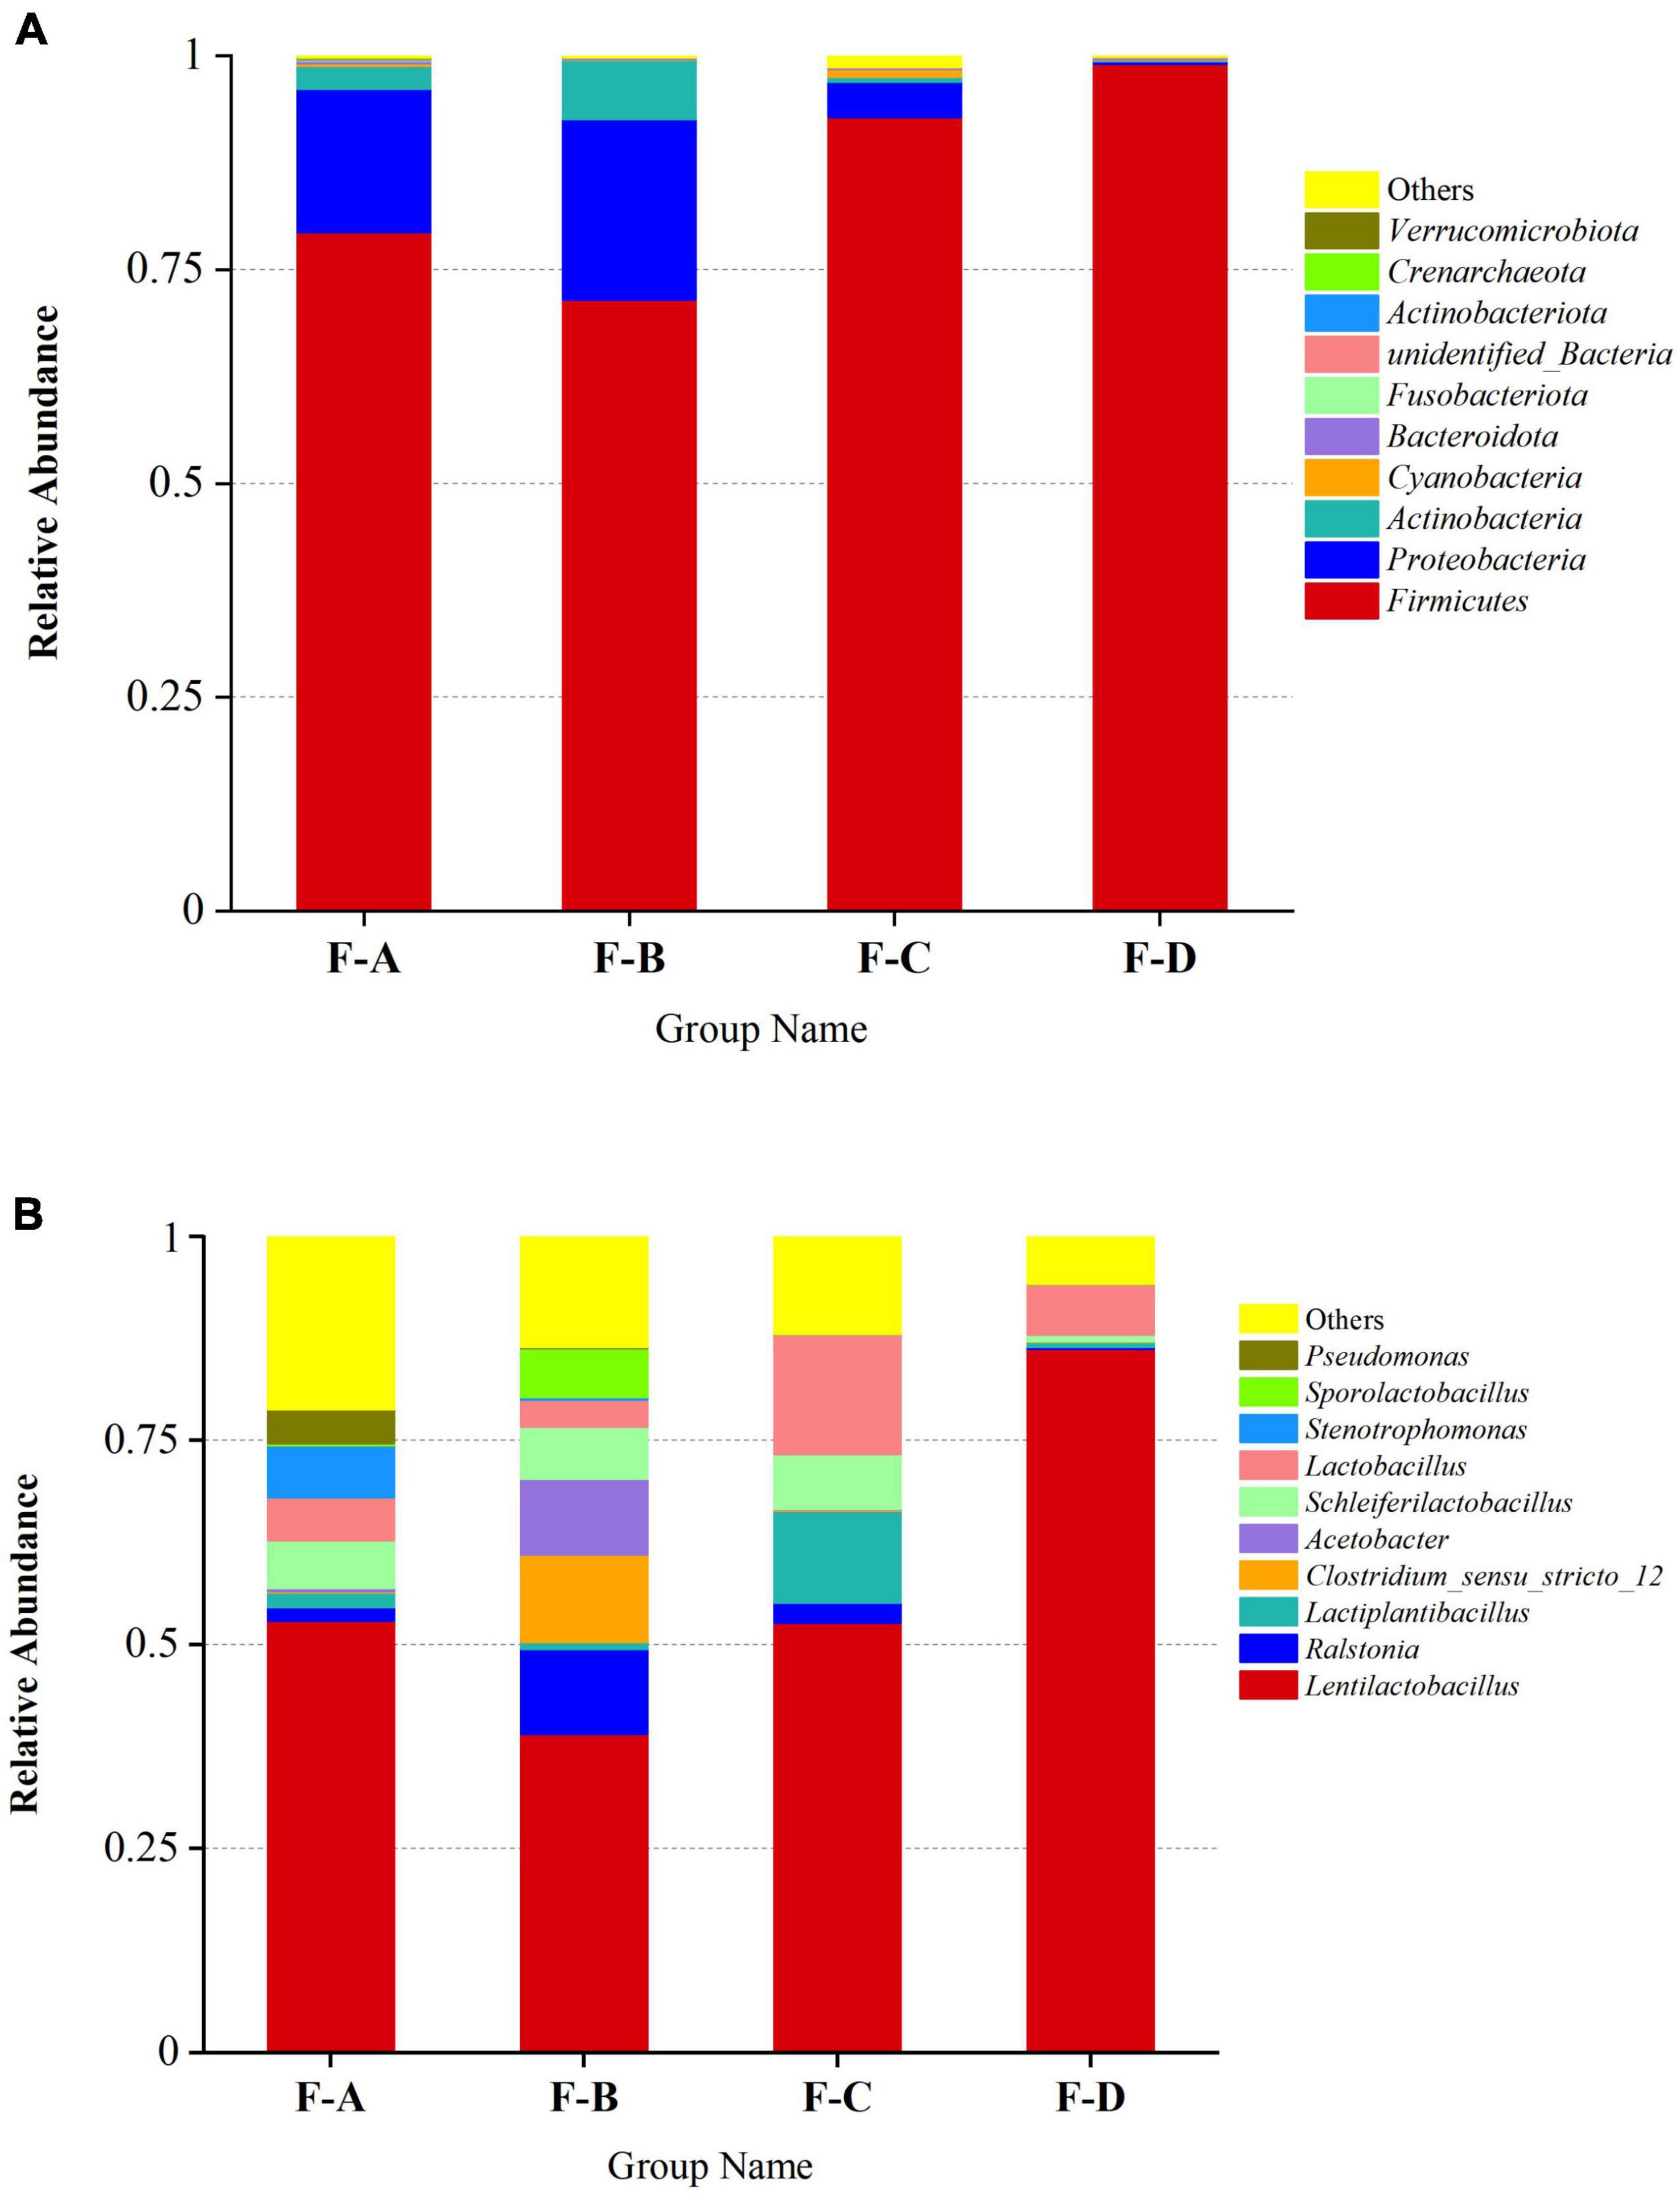
Figure 3. Relative abundance of bacteria in RSS samples at the phylum (A) and genus (B) levels at different post-fermentation stages. F-A, F-B, F-C and F-D refer to the sour soup samples fermented for 0 days, 60 days, 120 days, and 180 days, respectively. Each column represents a sample group containing a variety of bacteria.
At the genus level (Figure 3B), the main genera were detected at a high abundance (≥ 1% in at least one sample), including Lactobacillus spp., Ralstonia spp., Clostridium spp., Acetobacter spp., Stenotrophomonas spp., Pseudomonas spp., Propionibacterium spp., Pediococcus spp., Halomonas spp., and Aliidiomarina spp. Among them, LAB are the dominant bacteria (60–98%), consisting of Lentilactobacillus spp., Lactiplantibacillus spp., Schleiferilactobacillus spp., Lactobacillus spp., Sporolactobacillus spp., Pediococcus spp., Limosilactobacillus spp., Loigolactobacillus spp., Levilactobacillus spp., Lacticaseibacillus spp., Companilactobacillus spp., Liquorilactobacillus spp., Ligilactobacillus spp. and others, especially Lentilactobacillus spp. (39.02–86.23%). The levels of these bacteria decrease at 60 days (60.35%) and then increase with increasing post-fermentation time (120–180 days). The second-most abundant is Ralstonia spp., accounting for 0.17–10.41%. The content of Ralstonia spp. was high at the beginning of post-fermentation, especially at 60 days of fermentation (10.41%), and sharply decreased to 0.12–0.02% during the later stages. The levels of Acetobacter spp. and Clostridium spp. significantly increased after 60 days of fermentation time, accounting for 9.23% and 10.73%, respectively, but were lower at other fermentation points. The content of Stenotrophomonas spp. was high during the initial post-fermentation stage (0 days, 6.44%) but gradually decreased with fermentation and disappeared entirely at 180 days.
The Kyoto Encyclopedia of Genes and Genomes (KEGG) is an integrated database resource for associating genomic sequences with biological functions. Figure 4 shows the dynamic change of microbial function predicted for RSS during post-fermentation. Figure 4A shows the composition of level 1 KEGG pathways in bacteria from samples during different post-fermentation stages. The functionality of the bacteria in RSS is mainly for metabolic activity, including carbohydrates, amino acids, energy, nucleotide, cofactor, vitamin, terpenoid substances and poly ketone metabolism. The most important metabolic pathways are carbohydrates and amino acid metabolism. Second, glycan and other secondary metabolites that are involved in synthesis and metabolism (Supplementary Figure 1). These metabolic activities provide the unique flavor of RSS.
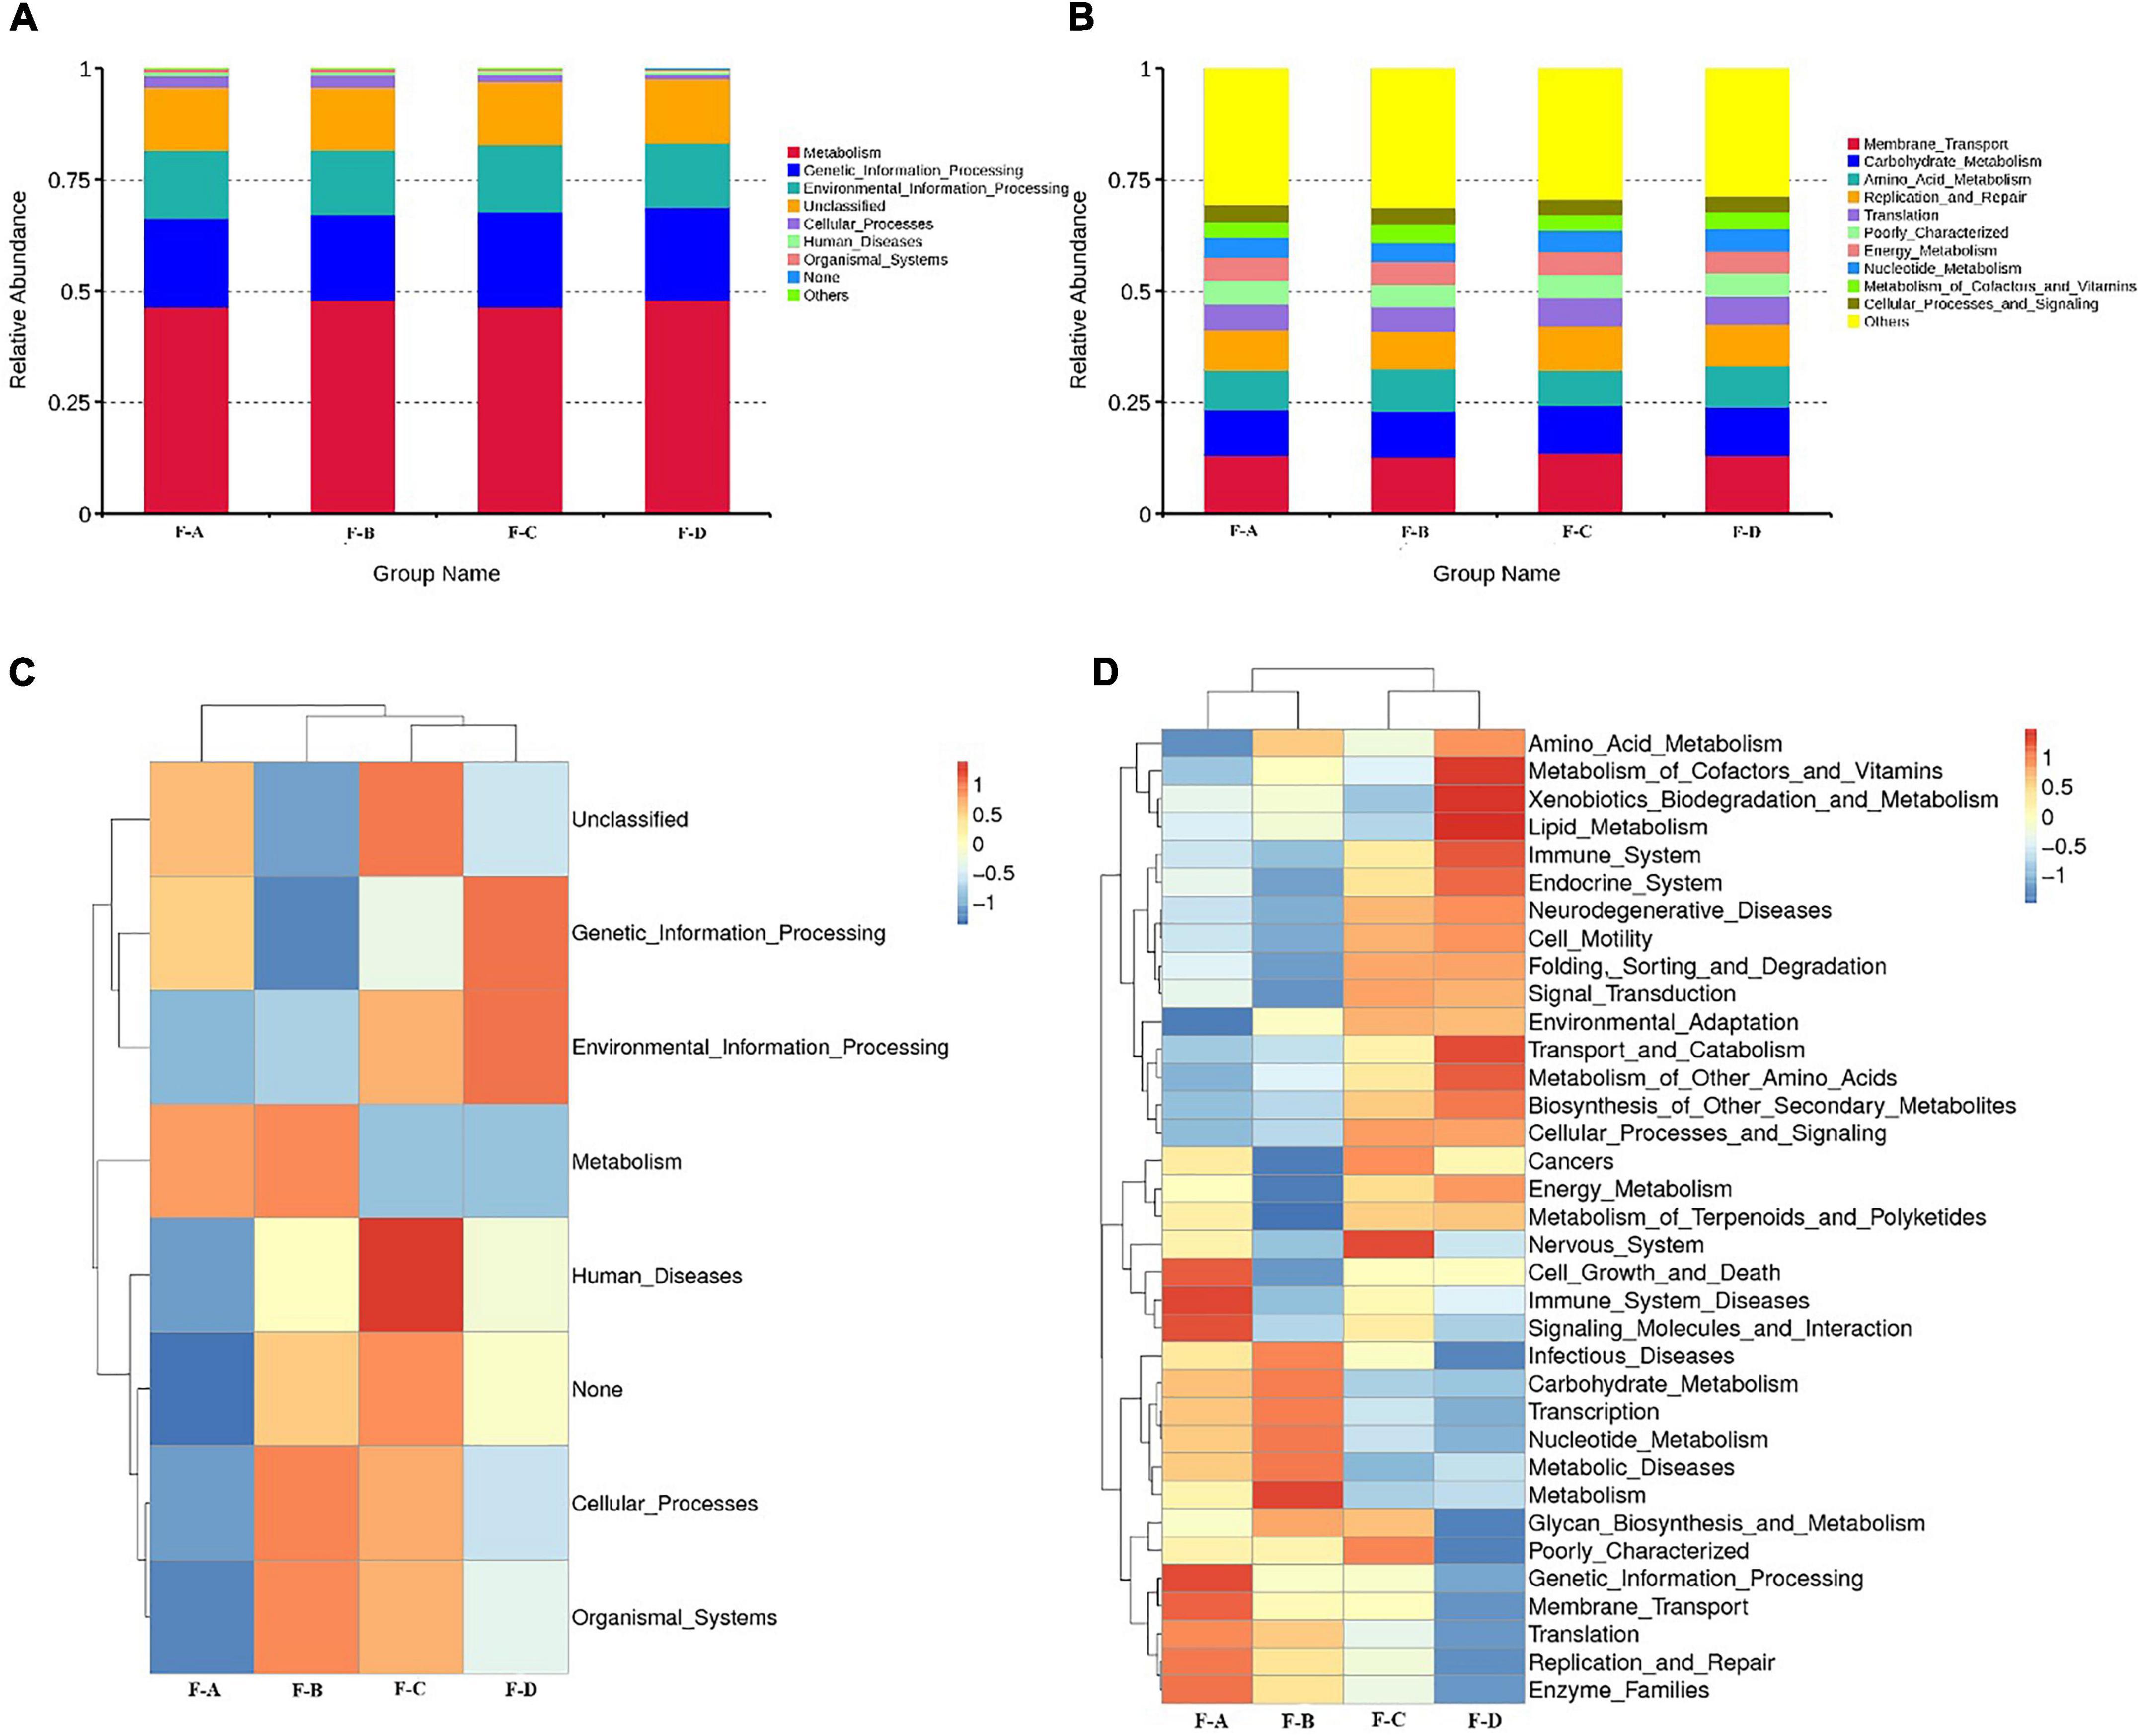
Figure 4. Abundance of Primary Function of bacteria at level 1 (A), level 2 (B), and cluster heatmap of Primary Function of bacteria at the level 1 (C), and level 2 (D) by Picrust in RSS samples.
As shown in Figure 4D, the intensity of carbohydrate metabolism increases gradually with the post-fermentation time. It reaches the maximum at 180 days, which may be related to the abundance of LAB (25). Much evidence shows that the function of carbohydrate metabolism is mainly assigned to LAB in the vegetable fermentation process, and carbohydrate metabolism contributes to the survival of LAB in various environments (26–28). The metabolism of carbohydrates through glycolytic and citrate cycle pathways can produce acids and substrates for amino acid metabolism, as well as some by-products (29). The intermediate pyruvate is also a core compound in producing organic acids, ethanol and esters (30). Finally, the intensity of amino acid metabolism reaches a peak value at 60 days. The metabolic activity of terpenes decreased with fermentation time. Secondly, the abundance of gene annotations related to genetic information and environment process was high, and both reached the highest value at 120 days. Genetic annotations related to human disease have also been detected. However, with increasing fermentation times, the abundance of genetic annotations related to human disease gradually decreased and reached the lowest level at 180 days, consistent with decreasing miscellaneous bacteria content (Table 1).
Flavor substances are one of the critical indices to evaluate the quality of fermented foods. In the fermentation process, various substrates can be converted into distinctive metabolites through biocatalytic reactions of microorganisms, causing unique flavors in RSS. Thus, the RSS samples at four stages of the fermentation process between 0 and 180 days were investigated using HSPE-GC-MS. Table 2 shows a total of 77 kinds of volatile flavor compounds were detected in RSS samples, including 24 esters, 14 terpenes, 9 aromatic hydrocarbons, 9 alkanes, 6 heterocyclic compounds, 3 alcohols, 3 acids, 3 ketones, 2 phenols, 2 aldehydes, 1 amine, and 1 classified as other.
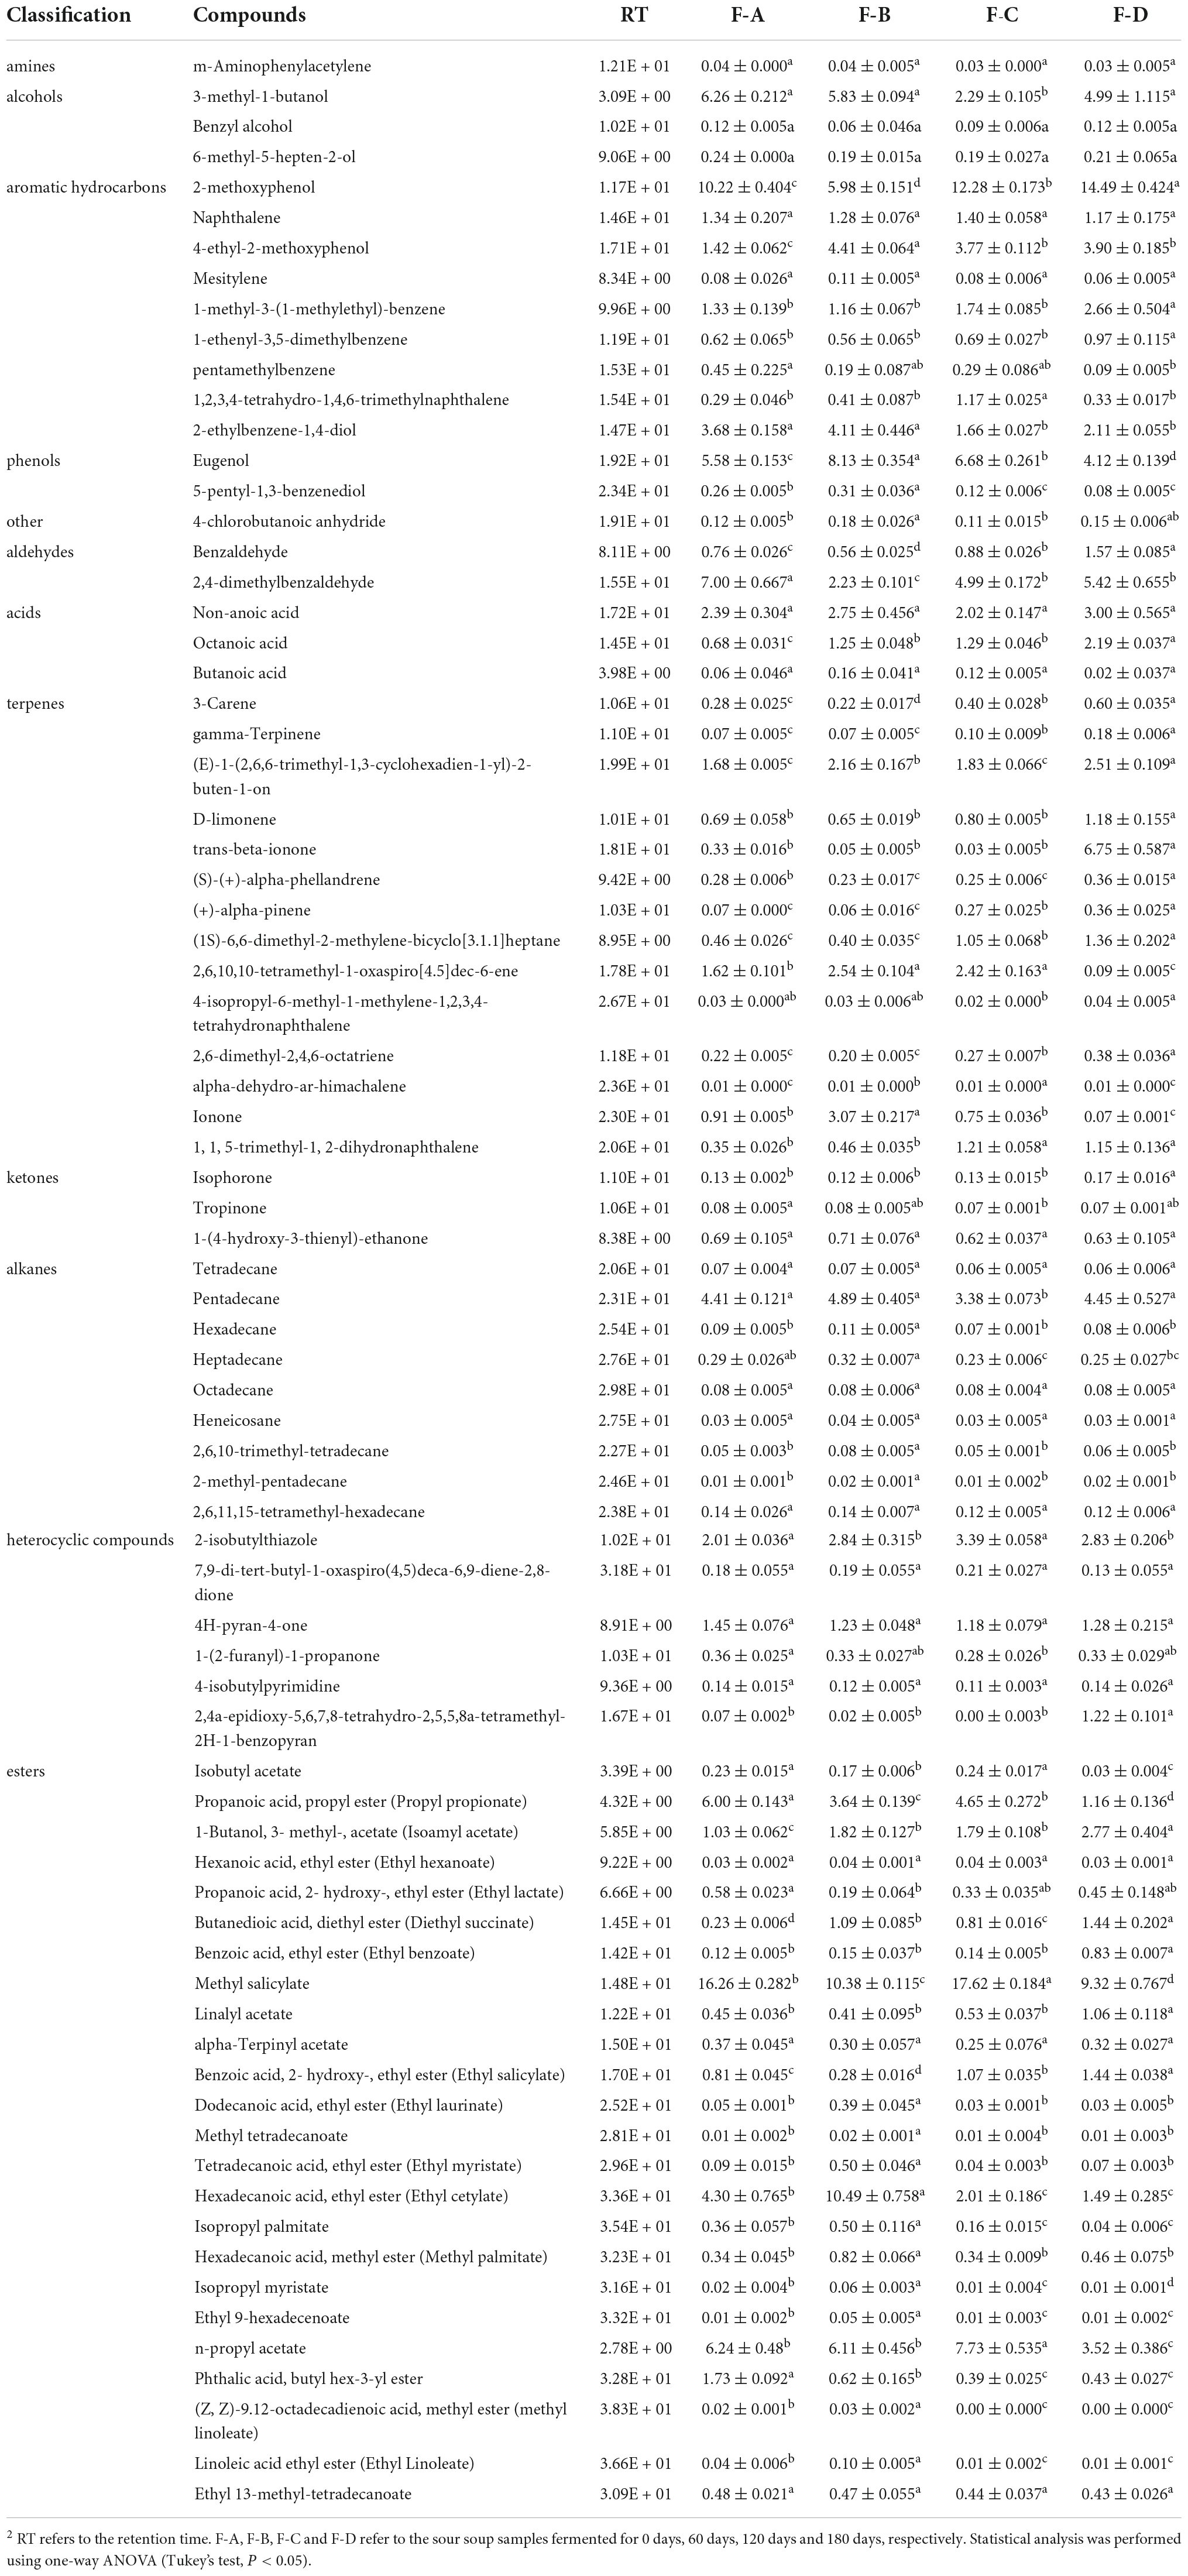
Table 2. Aroma compounds detected by GC-MS in different samples.
Figure 5 shows that esters are the dominant volatile substances in RSS during the post-fermentation process. The percentage of esters between 0 and 120 days of post-fermentation was insignificant, but it dramatically decreased to 25.36% from approximately 39.80% at 180 days. Furthermore, aromatic hydrocarbons (18.19–25.79%), terpenoids (6.99–15.01%), and heterocyclic compounds (4.21–5.92%) increased gradually during post-fermentation. Alcohols (2.57–6.08%) and alkanes (4.03–5.74%) suddenly decreased at 120 days of fermentation, while aldehydes (2.79–7.76%) suddenly decreased at 60 days and recovered to higher levels at 180 days (6.99%). Phenolic substances (4.20–8.44%) peaked at 60 days (8.44%), initially increased with fermentation time (0–60 days) and then decreased significantly (60–180 days).
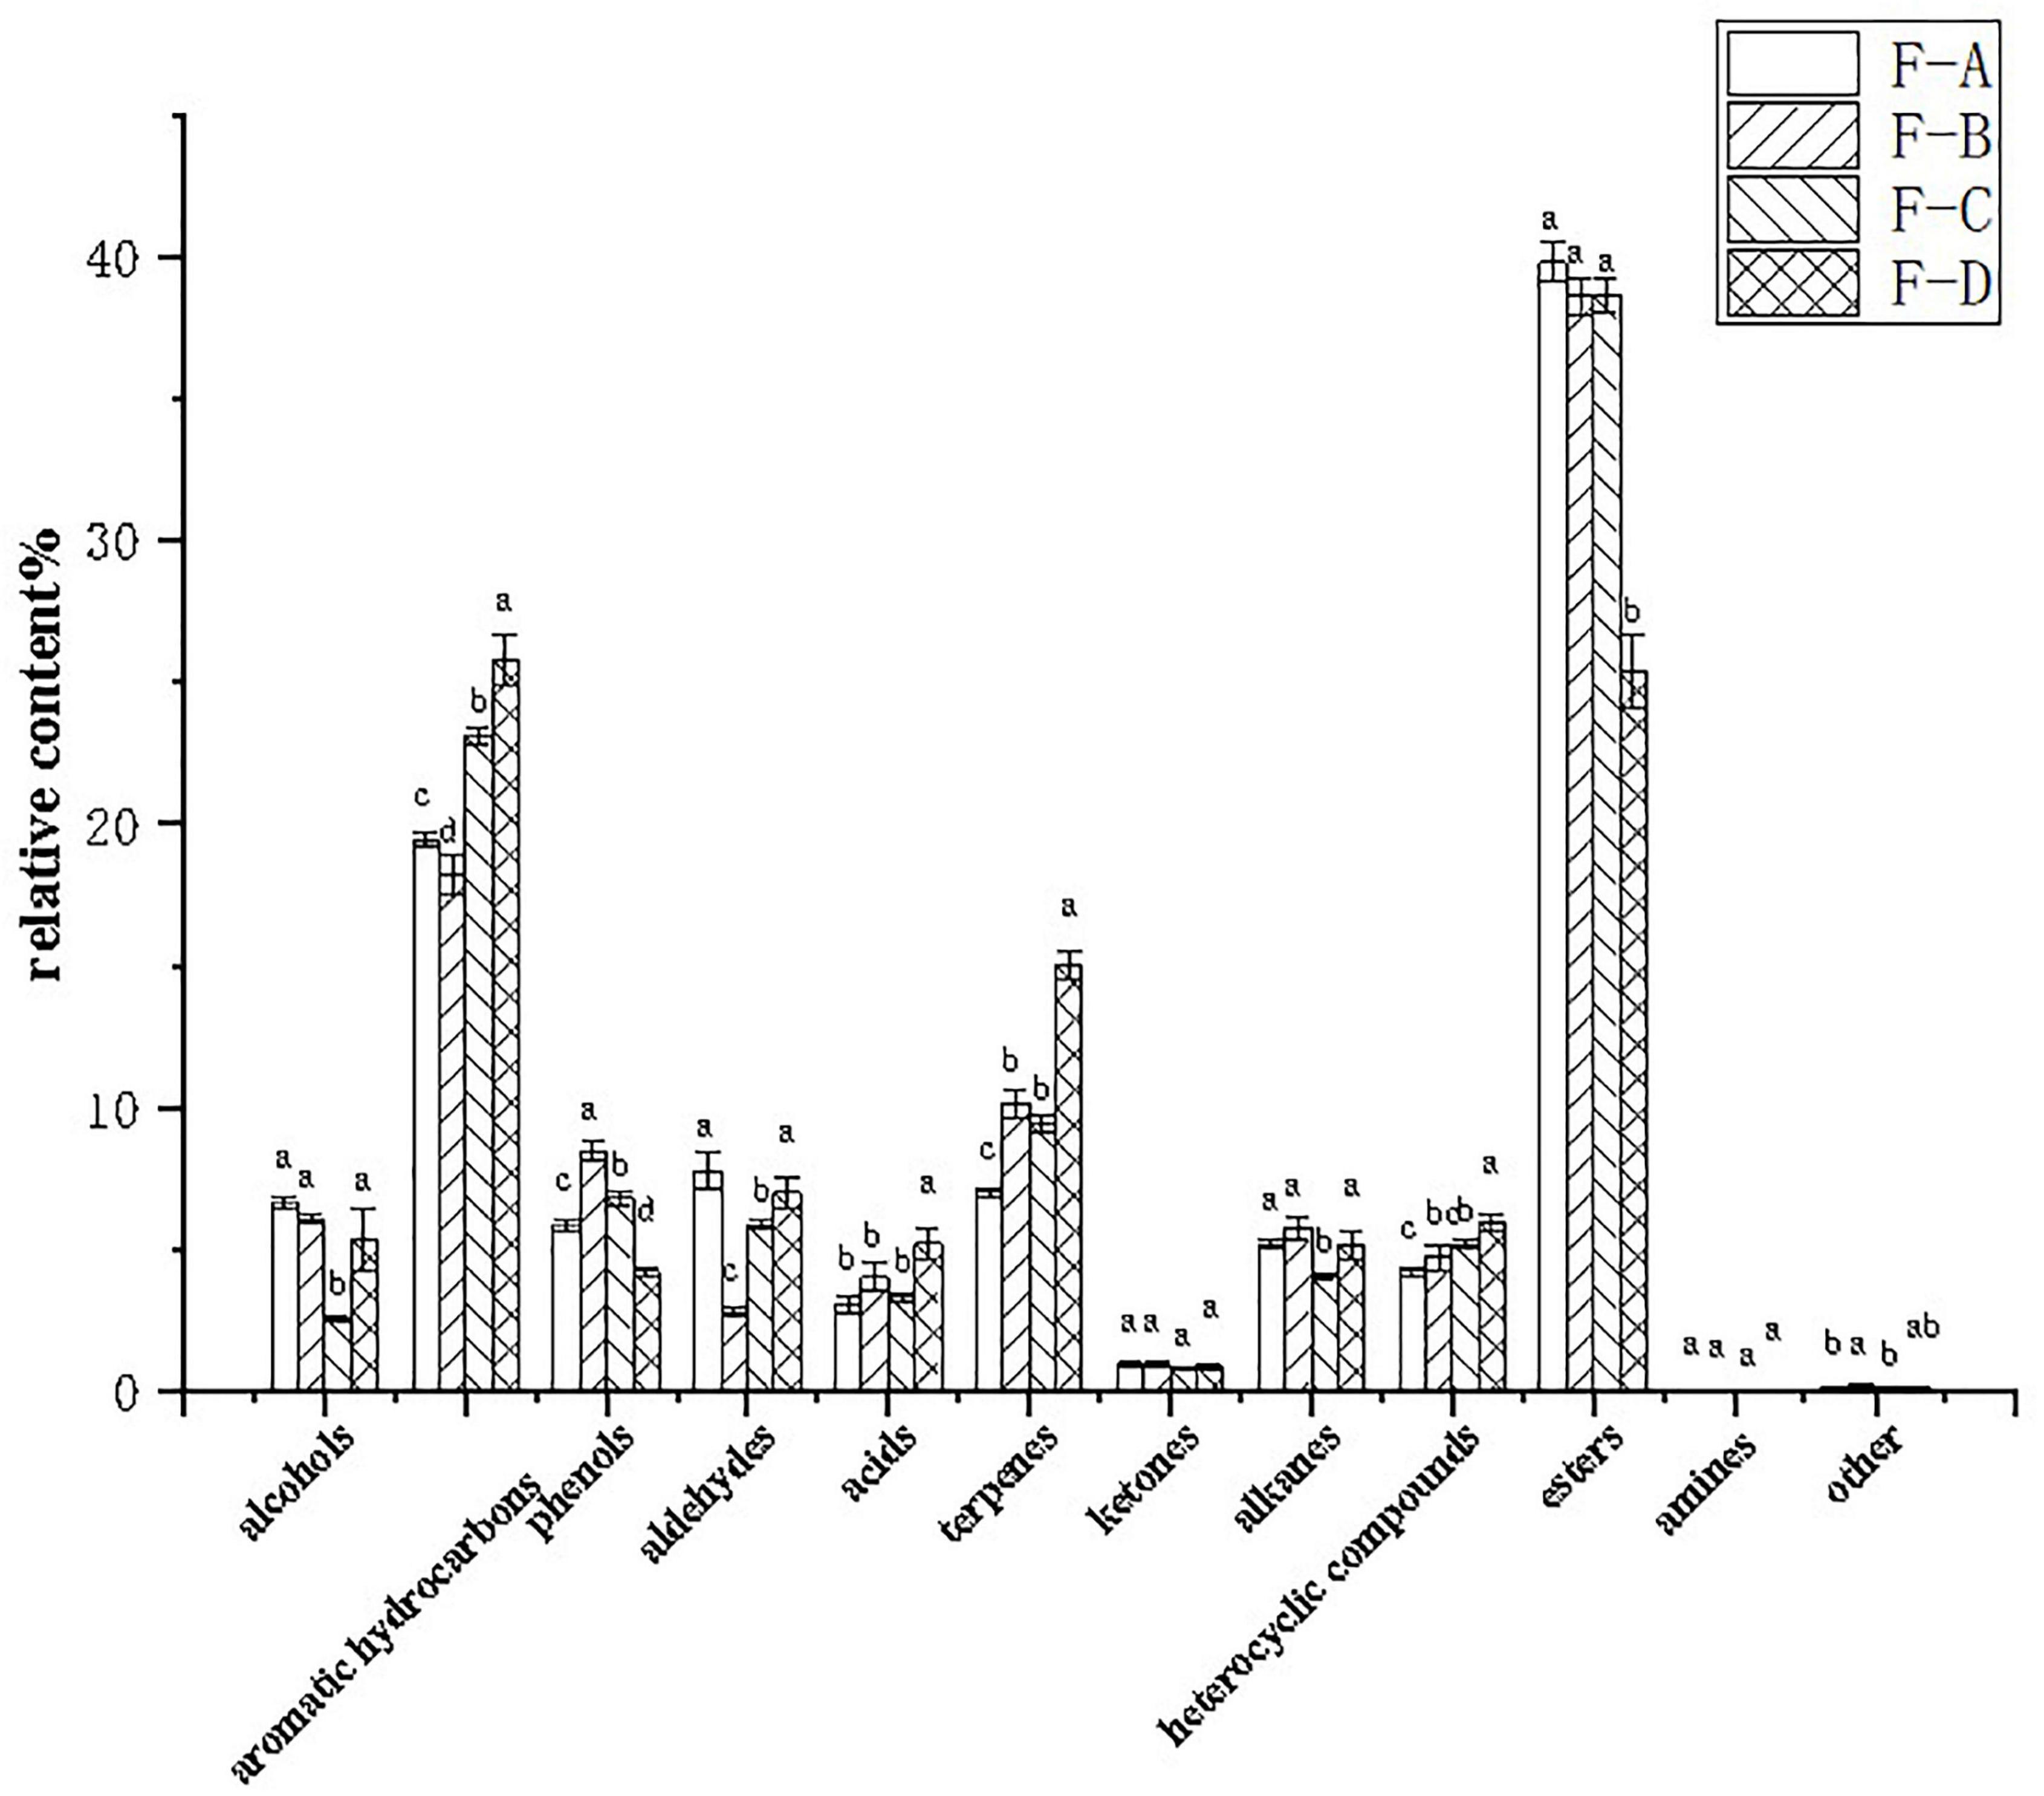
Figure 5. Relative percentages of volatile compounds in RSS samples at different post-fermentation stages. F-A, F-B, F-C, and F-D refer to the sour soup samples fermented for 0 days, 60 days, 120 days and 180 days, respectively. Each column represents a variety of substances in each sample. Statistical analysis was performed by one-way ANOVA (Tukey’s test, P < 0.05).
Esters are abundant in the RSS fermentation process and usually have floral and fruity smells (12, 31). The high esters content includes propanoic acid propyl ester (propyl propionate), 1-butanol 3-methyl-acetate (isoamyl acetate), methyl salicylate, hexadecanoic acid ethyl ester (ethyl cetylate), n-propyl acetate, methyl salicylate and butyl hex-3-yl ester phthalic acid. Propyl propionate and butyl hex-3-yl ester phthalic acid levels decrease over time, while isoamyl acetate and benzoic acid, 2- hydroxy-, ethyl ester (Ethyl salicylate) increase with post-fermentation time. Ethyl cetylate and n-propyl acetate initially showed an increasing trend but then decreased, peaking at 60 and 120 days of fermentation, respectively. Finally, methyl salicylate had a decreasing trend before 60 days and then increased up to the 120-day point.
The aromatic hydrocarbon compounds also account for many of the total volatile compounds. Among them, 2-methoxyphenol, naphthalene, 4-ethyl-2-methoxyphenol, 1-methyl-3-(1-methylethyl)-benzene and 2-ethylbenzene-1,4-diol occurred at high percentages. 2-methoxyphenol exhibited a decreasing trend before 60 days and then increased, while it was inverse to 4-ethyl-2-methoxyphenol. The concentration of 1-methyl-3-(1-methylethyl)-benzene increased during the post-fermentation time, while that of 2-ethylbenzene-1,4-diol was the opposite. Terpenes are often derived from plants, and the most abundant terpenes included (E)-1-(2,6,6-trimethyl-1,3-cyclohexadien-1-yl)-2-buten-1-one, D-limonene, trans-beta-ionone, (1S)-6, 6-dimethyl-2-methylene-bicyclo[3.1.1]heptane, 2,6,10,10-tetramethyl-1-oxaspiro[4.5]dec-6-ene, and ionone. (E)-1-(2,6,6- trimethyl-1,3-cyclohexadien-1-yl)-2-buten-1-one fluctuated with post-fermentation and reached a peak at 180 days. Meanwhile, D-limonene, trans-beta-ionone and (1S)-6,6-dimethyl-2-methylene-bicyclo[3.1.1]heptane increased with fermentation time. 2,6,10,10-tetramethyl-1-oxaspiro[4.5]dec-6-ene first increased and then decreased. Other substances present at high contents included 2-isobutylthiazol, 4H-pyran-4-one, 3-methyl-1-butanol and pentadecane.
Principal component analysis (PCA) analysis was undertaken to compare the differences of volatile substances in RSS with different fermentation days. As shown in Figure 6, different samples were distinguished, and parallel samples were pooled. According to the first principal component, F-A and F-B were close together, indicating they were similar and clustered into one category. Taking the second principal component into account, all samples were relatively close. Therefore, the differences between these samples can primarily be explained using the first principal component. As can be seen from the overall distance, the changes in volatile substances were relatively small in the early stage of post-fermentation (0–60 days) and became more extensive in the later stage of post-fermentation (120–180 days).
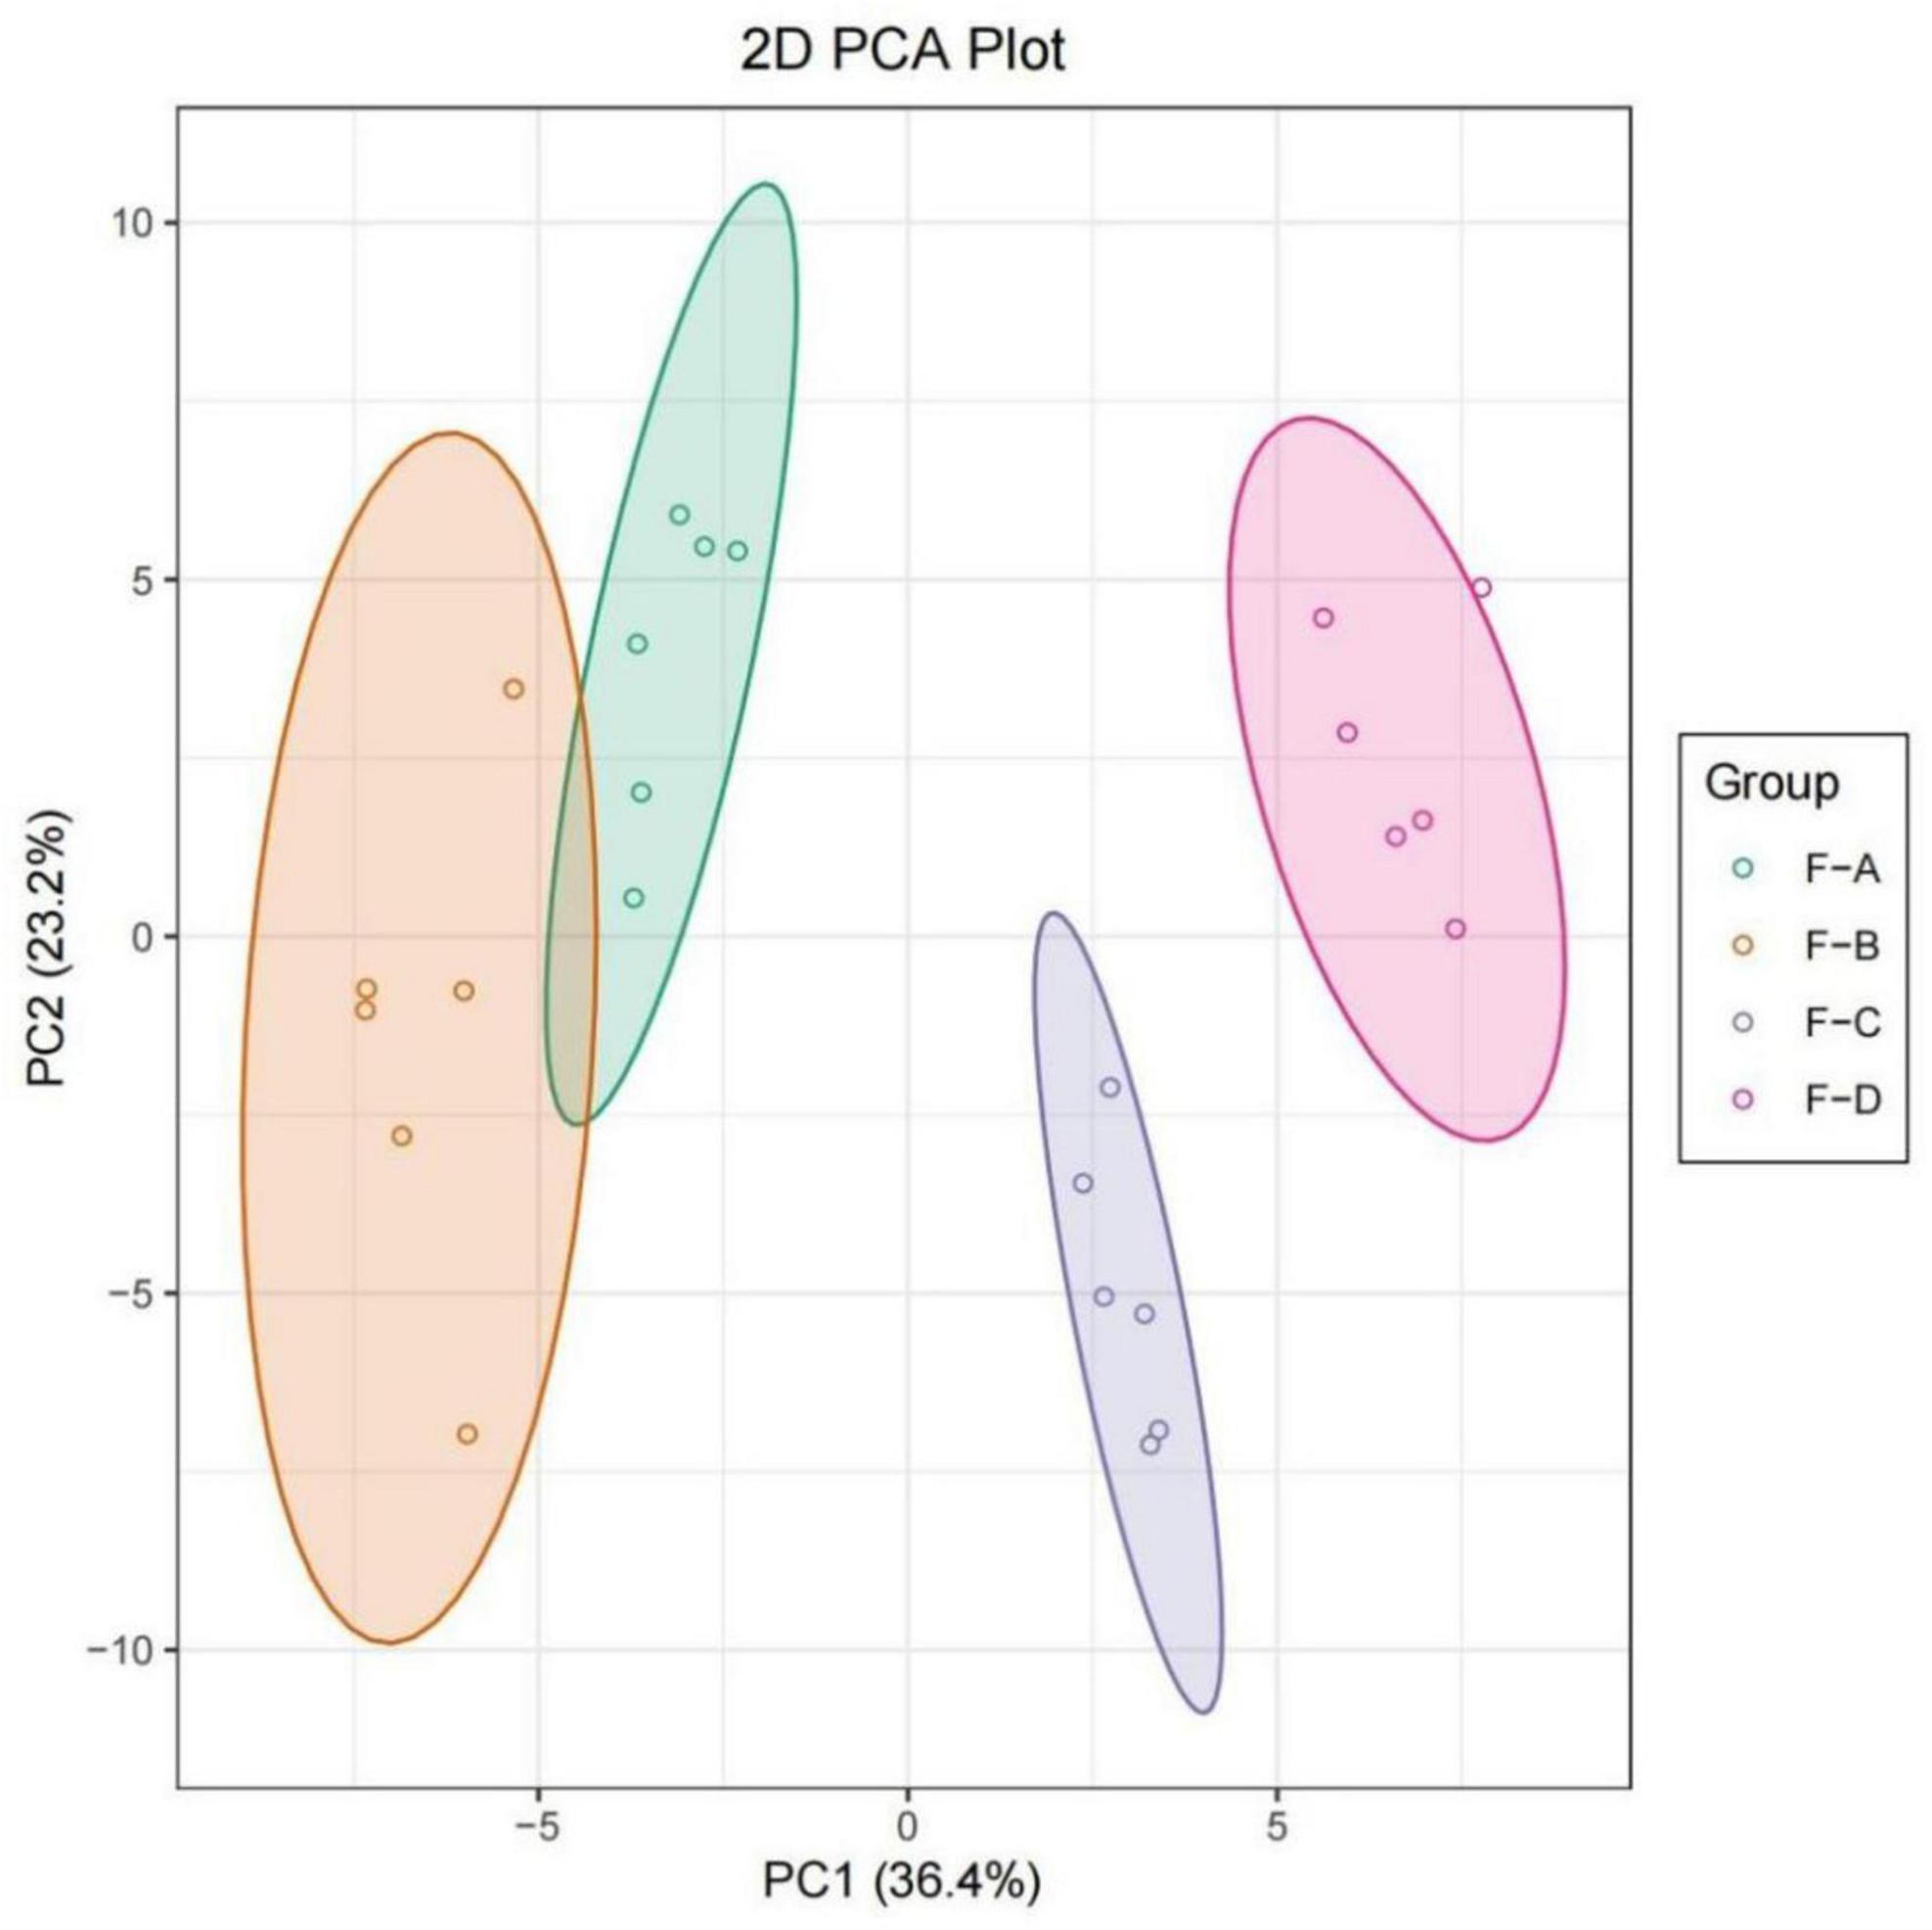
Figure 6. PCA plot based on HS-SPME-GC/MS results for RSS from different post-fermentation stages. F-A, F-B, F-C and F-D refer to the sour soup samples fermented for 0 days, 60 days, 120 days, and 180 days, respectively.
Pearson correlation analysis was employed to evaluate the relationship between the dominant bacteria and the predominant volatile components in RSS. OPLS was applied to screen the critical volatile components with variable importance in projection (VIP) values greater than 1. Pearson correlation analysis was undertaken for RSS’s top 10 most abundant bacteria and the main volatile compounds. Cytoscope software was used to portray the results through a visualization network. As shown in Figure 7, 67 significant correlations are identified. Acetobacter spp., Clostridium spp. and Sporolactobacillus spp. have over ten significant correlations, especially Sporolactobacillus spp., and all three bacteria are primarily correlated with esters. Acetobacter mainly correlated with benzoic acid, 2- hydroxy-, ethyl ester (ethyl salicylate), (Z, Z)-9.12-octadecadienoic acid, methyl ester (methyl linoleate), hexadecanoic acid, methyl ester (methyl palmitate), methyl tetradecanoate, dodecanoic acid, ethyl ester (ethyl laurinate), hexadecanoic acid, ethyl ester (ethyl cetylate), tetradecanoic acid, ethyl ester (ethyl myristate), isopropyl myristate, linoleic acid ethyl ester (ethyl linoleate) and ethyl 9-hexadecenoate. Clostridium spp. mainly correlate with benzoic acid, 2- hydroxy-, ethyl ester (ethyl salicylate), (Z, Z)-9.12-octadecadienoic acid, methyl ester (methyl linoleate), hexadecanoic acid, methyl ester (methyl palmitate), methyl tetradecanoate, hexadecanoic acid, ethyl ester (ethyl cetylate), dodecanoic acid, ethyl ester (ethyl laurinate), tetradecanoic acid, ethyl ester (ethyl myristate), isopropyl myristate, linoleic acid ethyl ester (ethyl linoleate), and ethyl 9-hexadecenoate. Sporolactobacillus spp. mainly correlate with benzoic acid, 2- hydroxy-, ethyl ester (ethyl salicylate), (Z, Z)-9.12-octadecadienoic acid, methyl ester (methyl linoleate), hexadecanoic acid, methyl ester (ethyl cetylate), methyl tetradecanoate, hexadecanoic acid, ethyl ester (ethyl cetylate), dodecanoic acid, ethyl ester (ethyl laurinate), tetradecanoic acid, ethyl ester (ethyl myristate), isopropyl myristate, linoleic acid ethyl ester (ethyl linoleate) and ethyl 9-hexadecenoate. Acetobacter, Clostridium spp. and Sporolactobacillus spp. also correlate with 2-methoxyphenol, 2,4-dimethyl-benzaldehyde, and hexadecane.
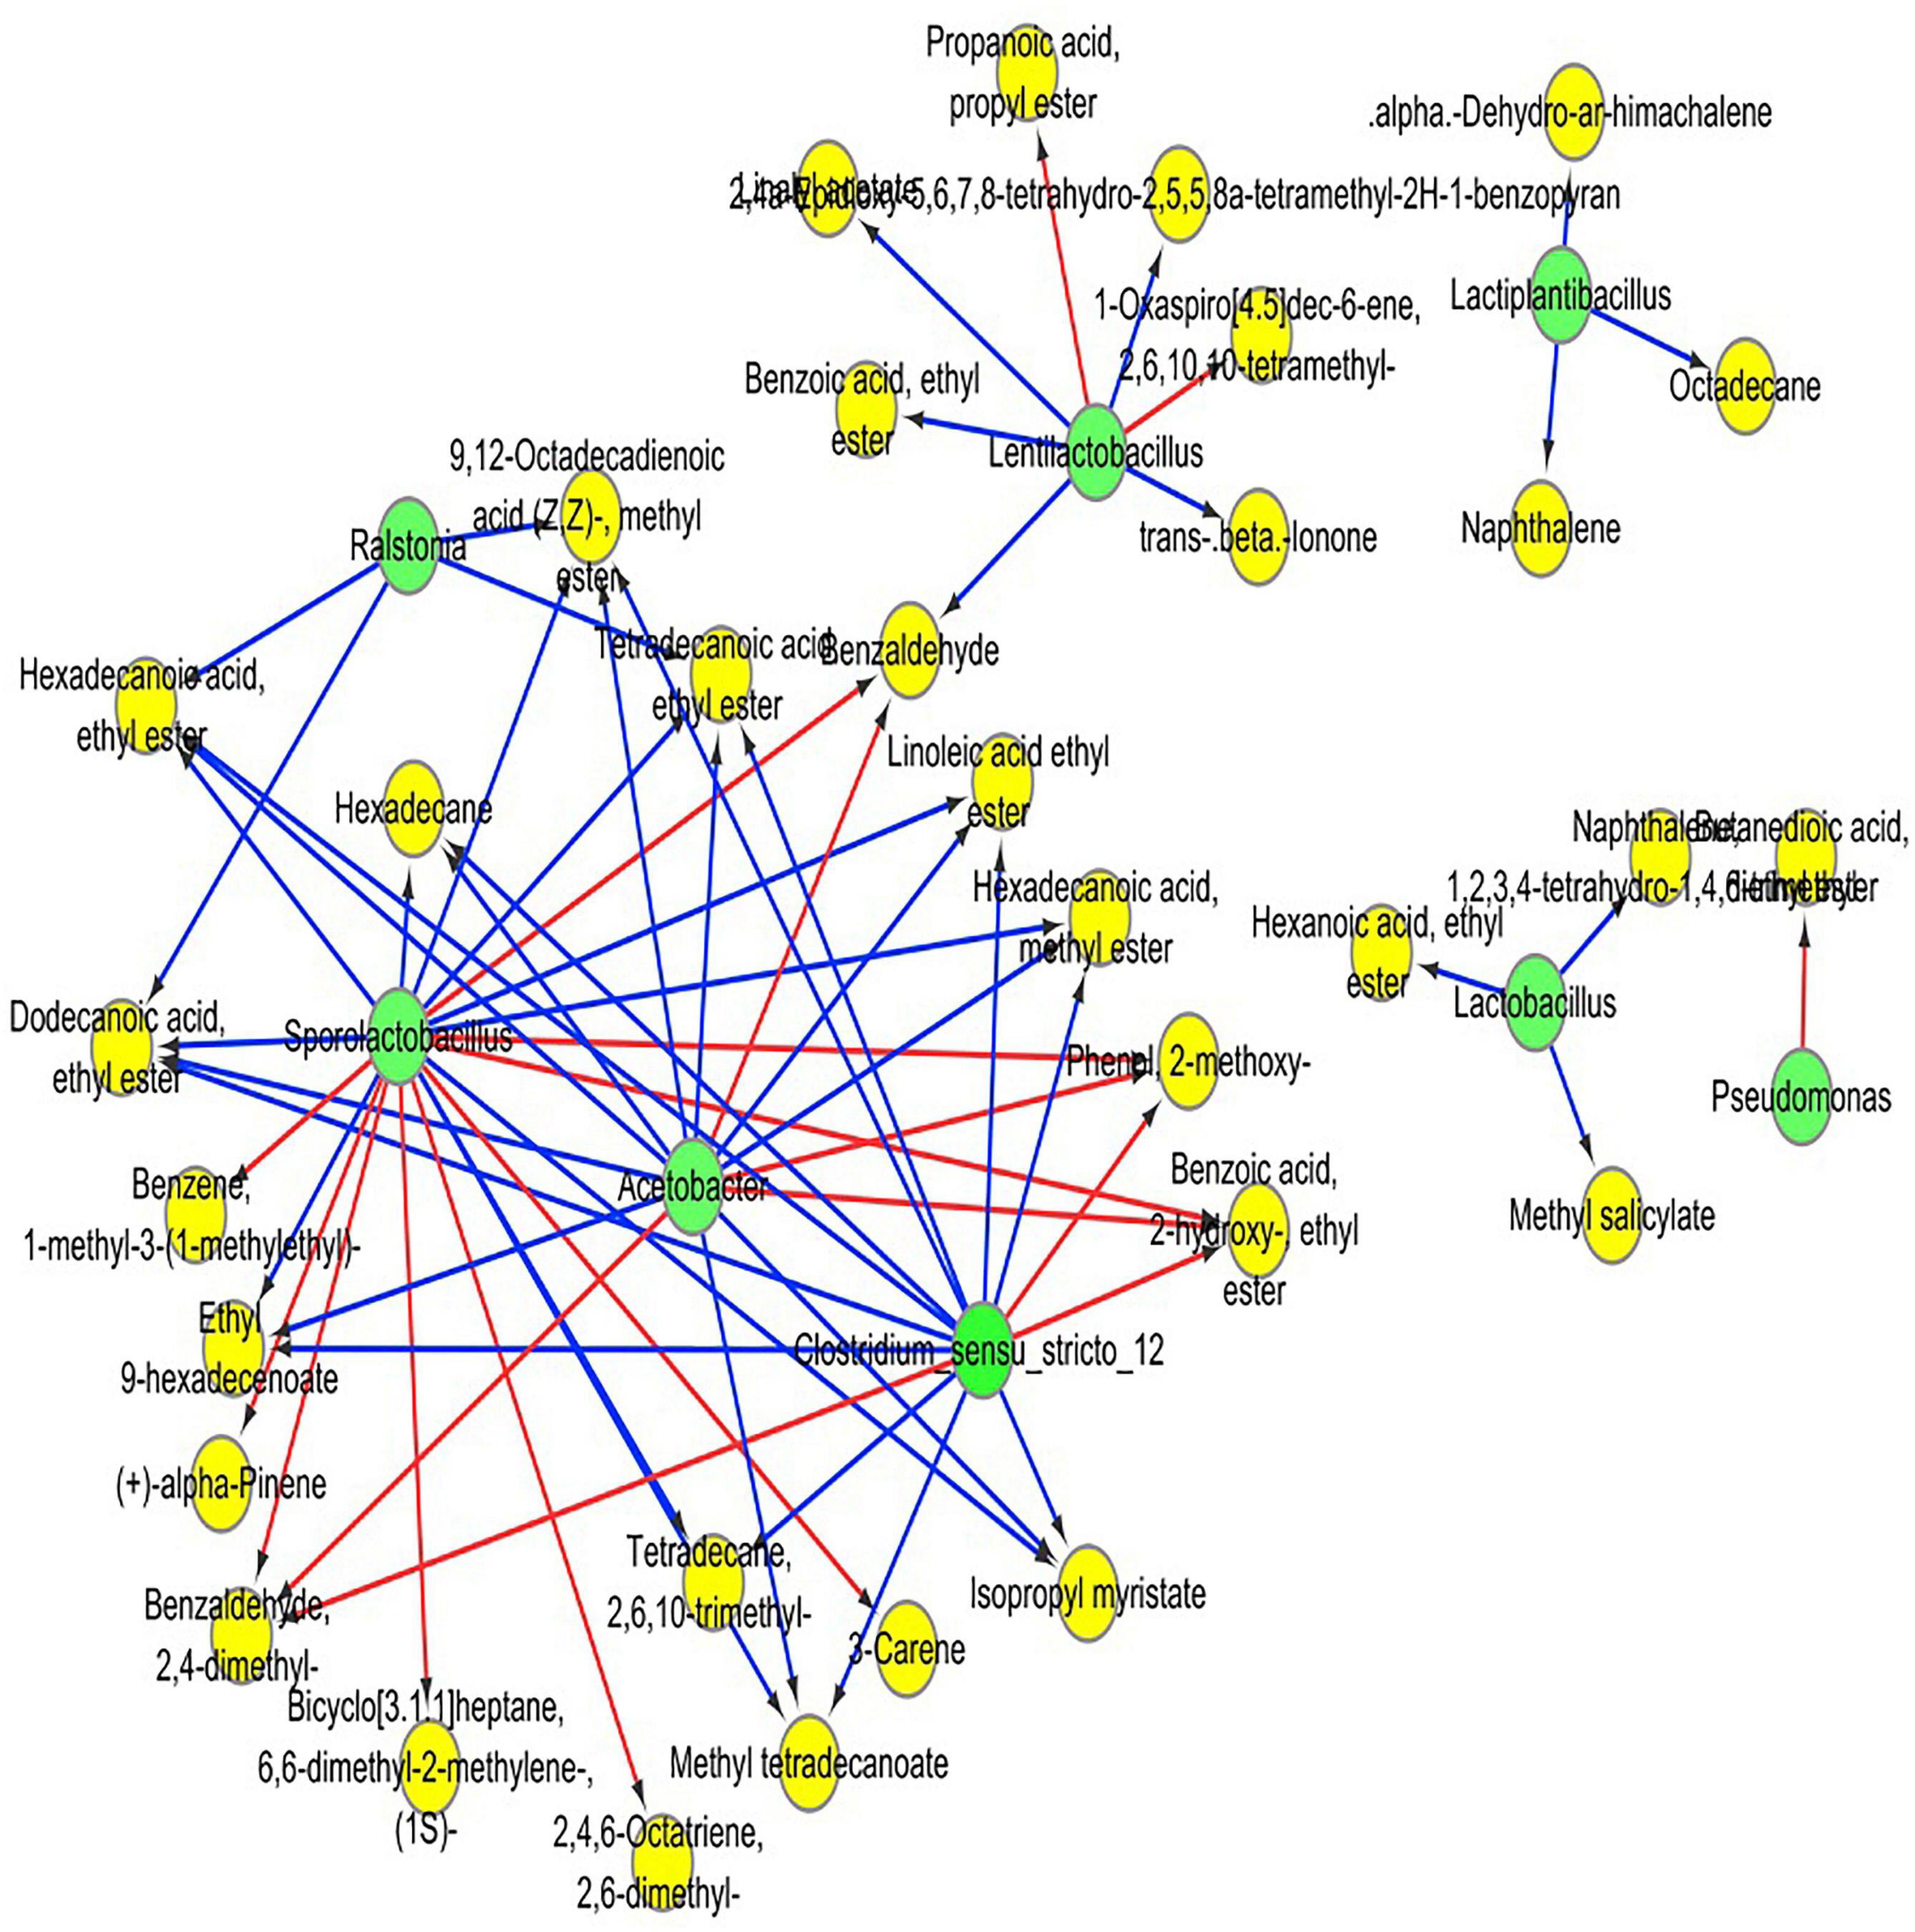
Figure 7. Heatmap of correlation analysis between dominant bacteria and some highly differential volatile components, based on Pearson’s correlation coefficients. The red line shows a positive correlation, and the blue line shows a negative correlation. Green circles indicate microorganisms, and yellow circles indicate volatile substances.
Red sour soup (RSS) is a traditional Chinese fermented food with a history of several thousand years (32). Its fermentation process relies mainly on LAB, acetic acid bacteria and Clostridium spp., which produce a refreshingly sour taste. As reported in previous studies, naturally fermented sour soup has more flavor after a longer fermentation time (more than 87 days) (33). However, for practical purposes, commercial production generally shortens the production period to 1–2 months by adding dominant strains (34, 35). This study aims to investigate the effect of fermentation time on the quality of RSS, the microbial composition and volatile flavor substances in RSS during the post-fermentation process.
Lactic acid bacteria (LAB) is commonly chosen as a starter material in various vegetable fermentation processes, such as Sichuan paocai, Korean kimchi, German sauerkraut and North-eastern Chinese pickles (36–39). LAB could convert fermentable sugars into lactic acid and other organic acids (40), which could help to produce flavor compounds in foods through fermentation (41). The gradual accumulation of acids will inhibit the growth of other microorganisms so that LAB gradually become the dominant bacteria (42, 43). Meanwhile, the diversity of LAB may also contribute to the production of volatile flavored compounds (13). As shown in Figure 3, LAB is the main bacteria in RSS in the post-fermentation process, consistent with sour soup’s widely reported microbial composition (4, 12, 13, 31, 32, 44). Notably, the central populations of LAB are Sporolactobacillus spp., Lentilactobacillus spp., Lactiplantibacillus spp., and Lactobacillus spp. Sporolactobacillus spp. predominantly correlate with 2- hydroxy-, ethyl ester, methyl ester, methyl ester, ethyl ester, ethyl ester, ethyl ester, linoleic acid ethyl ester, benzoic acid, hexadecanoic acid, and other volatile flavor compounds. Lentilactobacillus spp. is mainly related to benzoic acid ethyl ester, linalyl acetate, and propanoic acid propyl ester. Lactiplantibacillus spp. mainly correlate with α-deshydro-ar-himachalene, naphthalene, and octadecane, while Lactobacillus spp. mainly correlate with hexanoic acid ethyl ester and methyl salicylate. However, as Lin et al. reported, excessive LAB may inhibit the production of flavor substances, especially esters (12). The current study report that the lactic acid bacteria reached the highest content at 180 days, while the ester content decreased. A hypothesis was suggested that the underlying reason could relate to excess LAB inhibiting the growth of yeast and microorganisms related to ester production. The growth of yeast can produce many alcohols as precursors of esters (45). LAB inhibits yeast growth by producing bacteriostatic substances or robbing trace nutrients for fungal growth (46, 47).
Acetobacter spp. can produce acetic acid and are ubiquitous in the fermentation of various kinds of vinegar (48). Acetic acid production significantly contributes to the generation of esters from alcohols and can make the fermented product more aromatic (49). In addition, there is evidence that acetic acid bacteria can increase the total fatty acid content of the fermentation by breaking down amino acids (50). Pearson correlation analysis results indicate that in the post-fermentation process of RSS, Acetobacter spp. is positively correlated with a variety of esters, including (Z,Z)-9.12-octadecadienoic acid-methyl ester, 2-hydroxy-benzoic acid ethyl ester, dodecanoic acid ethyl ester, ethyl 9-hexadecenoate, hexadecanoic acid ethyl ester, hexadecanoic acid methyl ester, isopropyl myristate, linoleic acid ethyl ester, methyl tetradecanoate, and tetradecanoic acid ethyl ester.
Clostridium spp. are usually found in wine fermentation (51, 52). Acetyl coenzyme A can be synthesized via the reverse β-oxidation pathway by Clostridium spp. and then converted to butyric acid. Octanoic acid can be synthesized through a similar metabolic pathway by Clostridium spp. (53). Low concentrations of butyric acid are essential flavor compounds in many foods. However, the high concentration of butyric acid would create an unpleasant smell. Therefore, butyric acid is best kept at a low concentration during fermentation (54). The current study also detected butyric and caprylic acids as volatile flavor compounds.
Small amounts of Ralstonia spp. were also detected. Ralstonia spp. are usually found in soil and presumably were introduced by raw materials during production (55). In some cases, Ralstonia spp. are pathogenic and causes bacterial infections, and levels were inhibited later during fermentation (180 days) (56). Meanwhile, esters positively related with Ralstonia spp., such as (Z,Z)-9.12-octadecadienoic acid, methyl ester, dodecanoic acid ethyl ester, hexadecanoic acid ethyl ester, and tetradecanoic acid ethyl ester also decreased significantly at 180 days. However, its role in fermentation is unclear.
Hydrocarbons, including alkanes and aromatic hydrocarbons, were also detected during fermentation. Aromatic hydrocarbons have a unique aroma, but aromatic hydrocarbon compounds have a higher flavor threshold and may not significantly affect flavor. Nevertheless, at a specific concentration, they give fermented products a fuller flavor (57). Terpenoids are mainly produced by plants and have floral and woody scents. During fermentation, terpenoids are released due to the transformation of microorganisms, increasing terpenoid levels. LAB has been shown to release potential volatile terpenes through enzymatic hydrolysis (58–68). There may be a positive correlation between terpenoids’ content and consumers’ affection (60). High concentrations of aldehydes are often thought to be the unpleasant taste of vegetable fermentation, and lactic fermentation usually reduces the levels of related aldehydes (61). The current study found that aldehydes are negatively correlated with bacterial levels. Benzaldehyde and 2-4 dimethylbenzaldehyde are detected in our study, and give the fermentation desirable sensory properties, such as almond, bitter almond, cherry and sweet tastes (62, 63).
After a long post-fermentation process, the contents of volatile compounds, especially esters, acids, terpenes and aromatic compounds, were more abundant, indicating that a longer fermentation time was beneficial to expanding the volatile flavor. However, the data illustrate that when fermentation time is prolonged and between 120 and 180 days, the contents of the esters decrease. This may be due to the excessive LAB, which could inhibit the production of flavor substances (11). Due to the low flavor threshold of esters, even small changes in the concentrations of esters can directly impact the sour soup’s sensory quality (49). Thus, these results indicate that the optimal post-fermentation time is around 120 days in the RSS preparation process.
This study investigated the relationship between microbial composition and volatile flavor substances in RSS during the post-fermentation process. Acetobacter spp., Clostridium spp. and Sporolactobacillus spp. influenced volatile flavor compound levels significantly. In addition, with the passage of fermentation time (0–120 days), the amounts of LAB and volatile flavor substances accumulate. Unfortunately, although LAB are overabundant in the lengthy post-fermentation time (180 days), esters production in RSS are inhibited. Thus, the fermentation time of RSS should be controlled at around 120 days. Notably, Acetobacter spp., Clostridium spp. and Sporolactobacillus spp. can be considered starter material for RSS fermentation and warrants further research.
The data presented in this study are deposited in the NCBI repository, accession number: PRJNA857173.
XZ: writing—original draft and conceptualization. WZ: conceptualization. LZ and LZZ: writing—review and editing. ML and XF: visualization. XH, YD, and LL: software and formal analysis. All authors contributed to the article and approved the submitted version.
This work was supported by the Natural Science Foundation of Hunan Province (Nos. 2022JJ50241 and 2022JJ31009), The project of the Hunan Education Department (No. 21C0623), The Science and Technology Innovation Program of Hunan Province (Nos. 2017TP1021, 2019TP1028, 2019SK2122, 2019TP2011, 2019NK4229, 2021GK4024, and 2021GK4022), The Science and Technology Support Project of Guizhou Province (No. [2020]1Y150) and the Open Project of Hunan Provincial Key Laboratory of Soybean Products Processing and Safety Control (DZPJG202005), and Innovation and Entrepreneurship Training for College Students of Shaoyang University plan project (No. 86).
Author XF was employed by Shenzhen Shanggutang Food Development Co., Ltd.
The remaining authors declare that the research was conducted in the absence of any commercial or financial relationships that could be construed as a potential conflict of interest.
All claims expressed in this article are solely those of the authors and do not necessarily represent those of their affiliated organizations, or those of the publisher, the editors and the reviewers. Any product that may be evaluated in this article, or claim that may be made by its manufacturer, is not guaranteed or endorsed by the publisher.
The Supplementary Material for this article can be found online at: https://www.frontiersin.org/articles/10.3389/fnut.2022.1007164/full#supplementary-material
1. Xiao X, Li J, Xiong H, Tui W, Zhu Y, Zhang J. Effect of extrusion or fermentation on physicochemical and digestive properties of barley powder. Front Nutr. (2022) 8:794355. doi: 10.3389/fnut.2021.794355
2. Chen W, Lv X, Tran VT, Maruyama JI, Han KH, Yu JH. From traditional to modern: progress of molds and yeasts in Fermented-Food production. Front Microbiol. (2022) 13:876872. doi: 10.3389/fmicb.2022.876872
3. Zhang Y, Liu Y, Yang W, Huang J, Liu Y, Huang M, et al. Characterization of the potent aroma compounds in preserved egg yolk by gas chromatography-olfactometry, quantitative measurements, and odor activity value. J Agric Food Chem. (2018) 66:6132–41. doi: 10.1021/acs.jafc.8b01378
4. Xiong K, Han F, Wang Z, Du M, Chen Y, Tang Y, et al. Screening of dominant strains in red sour soup from Miao nationality and the optimization of inoculating fermentation conditions. Food Sci Nutr. (2021) 9:261–71. doi: 10.1002/fsn3.1992
5. Cong S, Li Z, Yu L, Liu Y, Cheng M. Integrative proteomic and lipidomic analysis of Kaili Sour Soup-mediated attenuation of high-fat diet-induced nonalcoholic fatty liver disease in a rat model. Nutr Metab. (2021) 18:26. doi: 10.1186/s12986-021-00553-4
6. Zhou W. Hmong’s delicious food-Vinegar soup. Jiangsu Condiment Subsid Food. (2004) 4:27–8. doi: 10.16782/j.cnki.32-1235/ts.2004.04.011
7. Zhou D. Analysis and research on nutrients in Kaili red sour soup. China Condiment. (2015) 40:5. doi: 10.3969/j.issn.1000-9973.2015.05.033
8. Li D, Duan F, Tian Q, Zhong D, Wang X, Jia L. Physiochemical, microbiological and flavor characteristics of traditional Chinese fermented food Kaili Red Sour Soup. LWT Food Sci Technol. (2021) 142:110933. doi: 10.1016/j.lwt.2021.110933
9. Lin L, Du F, Zeng J, Liang Z, Zhang X, Gao X. Deep insights into fungal diversity in traditional Chinese sour soup by Illumina MiSeq sequencing. Food Res Int. (2020) 137:109439. doi: 10.1016/j.foodres.2020.109439
10. Lin L, Wu J, Chen X, Huang L, Zhang X, Gao X. The role of the bacterial community in producing a peculiar smell in Chinese fermented sour soup. Microorganisms. (2020) 8:1270. doi: 10.3390/microorganisms8091270
11. Wang C, Zhang Q, He L, Li C. Determination of the microbial communities of Guizhou Suantang, a traditional Chinese fermented sour soup, and correlation between the identified microorganisms and volatile compounds. Food Res Int. (2020) 138:109820. doi: 10.1016/j.foodres.2020.109820
12. Lin LJ, Zeng J, Tian QM, Ding XQ, Zhang XY, Gao XY. Effect of the bacterial community on the volatile flavor profile of a Chinese fermented condiment – Red sour soup – During fermentation. Food Res Int. (2022) 155:111059. doi: 10.1016/j.foodres.2022.111059
13. Liu N, Pan J, Miao S, Qing L. Microbial community in Chinese traditional fermented acid rice soup (rice-acid) and its correlations with key organic acids and volatile compounds. Food Res Int. (2020) 137:109672. doi: 10.1016/j.foodres.2020.109672
14. Wu Y, Yang K, Shi M, Lyu P, Wang D, Li L, et al. High-throughput sequencing combined with traditional microbial culturable method to study microbial diversity and community changes in soy sauce moromi. Food Ferment Ind. (2022) 1–11. doi: 10.13995/j.cnki.11-1802/ts.031469
15. Wei Q, Wang H, Chen Z, Lv Z, Xie Y, Lu F. Profiling of dynamic changes in the microbial community during the soy sauce fermentation process. Appl Microbiol Biotechnol. (2013) 97:9111–9. doi: 10.1007/s00253-013-5146-9
16. Liu N, Lu Z, Wang L, Yu Y, Li G, Shi J, et al. Clone library analysis of enzyme genes in metabolic pathway for acetoin production in the fermentation of Zhenjiang aromatic vinegar. Chin J Appl Environ Biol. (2017) 23:134–9.
17. De Filippis F, Parente E, Ercolini D. Metagenomics insights into food fermentations. Microb Biotechnol. (2017) 10:91–102. doi: 10.1111/1751-7915.12421
18. Li Q, Kang J, MaXiao Z, Li P, Liu L, Hu X. Microbial succession and metabolite changes during traditional serofluid dish fermentation. LWT Food Sci Technol. (2017) 84:771–9. doi: 10.1016/j.lwt.2017.06.051
19. Seo HS, Lee S, Singh D, Park MK, Kim YS, Shin HW, et al. Evaluating the headspace volatolome, primary metabolites, and aroma characteristics of Koji fermented with Bacillus amyloliquefaciens and Aspergillus oryzaes. J Microbiol Biotechnol. (2018) 28:1260–9. doi: 10.4014/jmb.1804.04017
20. Svečnjak L, Jović O, Prđun S, Rogina J, Marijanoviæ Z, Car J, et al. Influence of beeswax adulteration with paraffin on the composition and quality of honey determined by physico-chemical analyses, 1 H NMR, FTIR-ATR and HS-SPME/GC–MS. Food Chem. (2019) 291:187–98. doi: 10.1016/j.foodchem.2019.03.151
21. Lin Y, Lin Y, Cai T, Lan W. High-throughput sequencing of microbial community diversity and dynamics during douchi fermentation. PLoS One. (2016) 11:e0168166. doi: 10.1371/journal.pone.0168166
22. Fei Y, Li L, Chen L, Zheng Y, Yu B. High-throughput sequencing and culture-based approaches to analyze microbial diversity associated with chemical changes in naturally fermented tofu whey, a traditional Chinese tofu-coagulant. Food Microbiol. (2018) 76:69–77. doi: 10.1016/j.fm.2018.04.004
23. Liu Z, Wang Z, Sun J, Ni L. The dynamics of volatile compounds and their correlation with the microbial succession during the traditional solid-state fermentation of Gutian Hong Qu glutinous rice wine. Food Microbiol. (2020) 86:103347. doi: 10.1016/j.fm.2019.103347
24. Hu S, He C, Li Y, Yu Z, Chen Y, Wang Y, et al. The formation of aroma quality of dark tea during pile-fermentation based on multi-omics. LWT Food Sci Technol. (2021) 147:111491. doi: 10.1016/j.lwt.2021.111491
25. Du F, Zhang X, Gu H, Song J, Gao X. Dynamic changes in the bacterial community during the fermentation of traditional Chinese fish sauce (TCFS) and their correlation with TCFS quality. Microorganisms. (2019) 7:371. doi: 10.3390/microorganisms7090371
26. Liu D, Zhang C, Zhang J, Xin X, Liao X. Metagenomics reveals the formation mechanism of flavor metabolites during the spontaneous fermentation of potherb mustard (Brassica juncea var. Multiceps). Food Res Int. (2021) 148:110622. doi: 10.1016/j.foodres.2021.110622
27. Xiao M, Huang T, Xu Y, Peng Z, Liu Z, Guan Q, et al. Metatranscriptomics reveals the gene functions and metabolic properties of the major microbial community during Chinese Sichuan Paocai fermentation. Food Microbiol. (2021) 98:103573. doi: 10.1016/j.fm.2020.103573
28. Jun Z, Shuaishuai W, Lihua Z, Qilong M, Xi L, Mengyang N, et al. Culture-dependent and -independent analysis of bacterial community structure in Jiangshui, a traditional Chinese fermented vegetable food. LWT Food Sci Technol. (2018) 96:244–50. doi: 10.1016/j.lwt.2018.05.038
29. Liu S, Chen Q, Zou H, Yu Y, Zhou Z, Mao J, et al. A metagenomic analysis of the relationship between microorganisms and flavor development in Shaoxing mechanized huangjiu fermentation mashes. Int J Food Microbiol. (2019) 303:9–18. doi: 10.1016/j.ijfoodmicro.2019.05.001
30. Xiao M, Peng Z, Hardie WJ, Huang T, Liu Z, Zhang Y, et al. Exploring the typical flavors formation by combined with metatranscriptomics and metabolomics during Chinese Sichuan paocai fermentation. LWT Food Sci Technol. (2022) 153:112474. doi: 10.1016/j.lwt.2021.112474
31. Cui Y, Qu X. Genetic mechanisms of prebiotic carbohydrate metabolism in lactic acid bacteria: emphasis on Lacticaseibacillus casei and Lacticaseibacillus paracasei as flexible, diverse and outstanding prebiotic carbohydrate starters. Trends Food Sci Technol. (2021) 115:486–99. doi: 10.1016/j.tifs.2021.06.058
32. Zhou X, Liu Z, Xie L, Li L, Zhou W, Zhao L. The correlation mechanism between dominant bacteria and primary metabolites during fermentation of red sour soup. Foods. (2022) 11:341. doi: 10.3390/foods11030341
33. He Y, Li G, Li Y, Luo X, Luo Q, Shi B, et al. Analysis of trend of microflora and flavor components in red sour soup during fermentation. Sci Technol Food Ind. (2022) 28:301. doi: 10.13386/j.issn1002-0306.2021120301
34. Zheng S, Hu P. Study on quality change of red sour soup fermented by lactic acid bacteria. China Condiment. (2019) 44:65–70. doi: 10.3969/j.issn.1000-9973.2019.08.012
35. Wu S, Li J, Long L, Yang T, Wang Y, Li G. Quality change of red sour soup during natural fermentation and lactic acid bacteria intensified fermentation. China Brew. (2020) 39:75–8. doi: 10.11882/j.issn.0254-5071.2020.10.015
36. Xiao Y, Xiong T, Peng Z, Liu C, Huang T, Yu H, et al. Correlation between microbiota and flavors in fermentation of Chinese Sichuan Paocai. Food Res Int. (2018) 114:123–32. doi: 10.1016/j.foodres.2018.06.051
37. Park KY, Jeong JK, Lee YE, Daily JW. Health benefits of kimchi (Korean fermented vegetables) as a probiotic food. J Med Food. (2014) 17:6–20. doi: 10.1089/jmf.2013.3083
38. Cho SK, Shin SY, Lee SJ, Li L, Moon JS, Kim DJ, et al. Simple synthesis of isomaltooligosaccharides during Sauerkraut fermentation by addition of Leuconostoc starter and sugars. Food Sci Biotechnol. (2015) 24:1443–6. doi: 10.1007/s10068-015-0185-x
39. An F, Sun H, Wu J, Zhao C, Li T, Huang H, et al. Investigating the core microbiota and its influencing factors in traditional Chinese pickles. Food Res Int. (2021) 147:110543. doi: 10.1016/j.foodres.2021.110543
40. Ashaolu TJ, Reale A. A holistic review on Euro-Asian lactic acid bacteria fermented cereals and vegetables. Microorganisms. (2020) 8:1–24. doi: 10.3390/microorganisms8081176
41. Qin H, Sun Q, Pan X, Qiao Z, Yang H. Microbial diversity and biochemical analysis of Suanzhou: a traditional Chinese fermented cereal gruel. Front Microbiol. (2016) 7:1311. doi: 10.3389/fmicb.2016.01311
42. Adams MR, Hall CJ. Growth inhibition of food-borne pathogens by lactic and acetic acids and their mixtures. Int J Food Sci Technol. (1988) 23:287–92. doi: 10.1111/j.1365-2621.1988.tb00581.x
43. Gao Z, Daliri EBM, Wang JUN, Liu D, Chen S, Ye X, et al. Inhibitory effect of lactic acid bacteria on foodborne pathogens: a review. J Food Prot. (2019) 82:441–53. doi: 10.4315/0362-028X.JFP-18-303
44. Li J, Wang X, Wu W, Jiang J, Feng D, Shi Y, et al. Comparison of fermentation behaviors and characteristics of tomato sour soup between natural fermentation and dominant bacteria-enhanced fermentation. Microorganisms. (2022) 10:640. doi: 10.3390/microorganisms10030640
45. De Roos J, De Vuyst L. Microbial acidification, alcoholization, and aroma production during spontaneous lambic beer production. J Sci Food Agric. (2019) 99:25–38. doi: 10.1002/jsfa.9291
46. SLU Library,. Fungal Inhibitory Lactic Acid Bacteria. Sweden: Open access publications in the SLU publication database (2022).
47. Bayrock DP, Ingledew WM. Inhibition of yeast by lactic acid bacteria in continuous culture: nutrient depletion and/or acid toxicity? J Ind Microbiol Biotechnol. (2004) 31:362–8. doi: 10.1007/s10295-004-0156-3
48. Sokollek SJ, Hertel C, Hammes WP. Description of Acetobacter oboediens sp. nov. and Acetobacter pomorum sp. nov., two new species isolated from industrial vinegar fermentations. Int J Syst Bacteriol. (1998) 48:935–40. doi: 10.1099/00207713-48-3-935
49. Settanni L, Corsetti A. The use of multiplex PCR to detect and differentiate food- and beverage-associated microorganisms: a review. J Microbiol Methods. (2007) 69:1–22. doi: 10.1016/j.mimet.2006.12.008
50. Kruis AJ, Bohnenkamp AC, Patinios C, van Nuland YM, Levisson M, Mars AE, et al. Microbial production of short and medium chain esters: enzymes, pathways, and applications. Biotechnol Adv. (2019) 37:107407. doi: 10.1016/j.biotechadv.2019.06.006
51. Fang G-Y, Chai L-J, Zhong X-Z, Lu Z-M, Zhang X-J, Wu L-H, et al. Comparative genomics unveils the habitat adaptation and metabolic profiles of clostridium in an artificial ecosystem for liquor production. Msystems. (2022):e297–322. doi: 10.1128/msystems.00297-22
52. Lawson Anani Soh A, Ralambotiana H, Ollivier B, Prensier G, Tine E, Garcia JL. Clostridium thermopalmarium sp. nov., a moderately thermophilic butyrate-producing bacterium isolated from palm wine in senegal. Syst Appl Microbiol. (1991) 14:135–9. doi: 10.1016/S0723-2020(11)80291-2
53. Xu Y, Zhao J, Liu X, Zhang C, Zhao Z, Li X, et al. Flavor mystery of Chinese traditional fermented baijiu: the great contribution of ester compounds. Food Chem. (2022) 369:130920. doi: 10.1016/j.foodchem.2021.130920
54. Hawthorne DB, Shaw RD, Davine DF, Kavanagh TE, Clarke BJ. Butyric acid off-flavors in beer: origins and control. J Am Soc Brew Chem. (1991) 49:4. doi: 10.1094/asbj-49-0004
55. Denny T. Plant pathogenic Ralstonia species. Plant Assoc Bact. (2006) 2006:573–644. doi: 10.1007/978-1-4020-4538-7_16
56. Ryan MP, Adley CC. Ralstonia spp.: emerging global opportunistic pathogens. Eur J Clin Microbiol Infect Dis. (2014) 33:291–304. doi: 10.1007/s10096-013-1975-9
57. Dan T, Chen H, Li T, Tian J, Ren W, Zhang H, et al. Influence of Lactobacillus plantarum P-8 on fermented milk flavor and storage stability. Front Microbiol. (2019) 9:3133. doi: 10.3389/fmicb.2018.03133
58. Sarry JE, Günata Z. Plant and microbial glycoside hydrolases: volatile release from glycosidic aroma precursors. Food Chem. (2004) 87:509–21. doi: 10.1016/j.foodchem.2004.01.003
59. Klerk D. Co-Expression of Aroma Liberating Enzymes in a Wine Yeast Strain. Ph.D. thesis. Matieland: Institute for Wine Biotechnology (2009). p. 86–7.
60. Melgarejo P, Calín-Sánchez Á, Vázquez-Araújo L, Hernández F, Martínez JJ, Legua P, et al. Volatile composition of pomegranates from 9 Spanish cultivars using headspace solid phase microextraction. J Food Sci. (2011) 76:S114–20. doi: 10.1111/j.1750-3841.2010.01945.x
61. Liu Y, Chen H, Chen W, Zhong Q, Zhang G, Chen W. Beneficial effects of tomato juice fermented by lactobacillus plantarum and Lactobacillus Casei: antioxidation, antimicrobial effect, and volatile profiles. Molecules. (2018) 23:2366. doi: 10.3390/molecules23092366
62. Genovese A, Gambuti A, Piombino P, Moio L. Sensory properties and aroma compounds of sweet Fiano wine. Food Chem. (2007) 103:1228–36. doi: 10.1016/j.foodchem.2006.10.027
63. Hong M, Li J, Chen Y, Qi B, Huang Y, Wu J, et al. Impact of mixed non-Saccharomyces yeast during fermentation on volatile aroma compounds of Vidal blanc icewine. Lwt Food Sci Technol. (2021) 145:111342. doi: 10.1016/j.lwt.2021.111342
64. Hu Y, Zhang L, Wen R, Chen Q, Kong B. Role of lactic acid bacteria in flavor development in traditional Chinese fermented foods: A review. Crit Rev Food Sci. (2022) 62:2741–55. doi: 10.1080/10408398.2020.1858269
65. Jung M, Kim J, Lee SH, Whon TW, Sung H, Bae J, et al. Role of combinated lactic acid bacteria in bacterial, viral, and metabolite dynamics during fermentation of vegetable food, kimchi. Food Res Int. (2022) 157:111261. doi: 10.1016/j.foodres.2022.111261
66. Sevindik O, Guclu G, Agirman B, Selli S, Kadiroglu P, Bordiga M, et al. Impacts of selected lactic acid bacteria strains on the aroma and bioactive compositions of fermented gilaburu (Viburnum opulus) juices. Food Chem. (2022) 378:132079. doi: 10.1016/j.foodchem.2022.132079
67. Pang X, Chen C, Huang X, Yan Y, Chen J, Han B. Influence of indigenous lactic acid bacteria on the volatile flavor profile of light-flavor Baijiu. LWT (2021) 147:111540. doi: 10.1016/j.lwt.2021.111540
Keywords: bacterial diversity, effect mechanism, post-fermentation, red sour soup (RSS), volatile compounds
Citation: Zhou X, Zhou W, He X, Deng Y, Li L, Li M, Feng X, Zhang L and Zhao L (2022) Effects of post-fermentation on the flavor compounds formation in red sour soup. Front. Nutr. 9:1007164. doi: 10.3389/fnut.2022.1007164
Received: 30 July 2022; Accepted: 20 September 2022;
Published: 28 October 2022.
Edited by:
Mingquan Huang, Beijing Technology and Business University, ChinaReviewed by:
Nattakorn Kuncharoen, Kasetsart University, ThailandCopyright © 2022 Zhou, Zhou, He, Deng, Li, Li, Feng, Zhang and Zhao. This is an open-access article distributed under the terms of the Creative Commons Attribution License (CC BY). The use, distribution or reproduction in other forums is permitted, provided the original author(s) and the copyright owner(s) are credited and that the original publication in this journal is cited, in accordance with accepted academic practice. No use, distribution or reproduction is permitted which does not comply with these terms.
*Correspondence: Lin Zhang, dDIwMTMxNTAxQGNzdWZ0LmVkdS5jbg==; Liangzhong Zhao, c3lzMTY5QDE2My5jb20=
Disclaimer: All claims expressed in this article are solely those of the authors and do not necessarily represent those of their affiliated organizations, or those of the publisher, the editors and the reviewers. Any product that may be evaluated in this article or claim that may be made by its manufacturer is not guaranteed or endorsed by the publisher.
Research integrity at Frontiers
Learn more about the work of our research integrity team to safeguard the quality of each article we publish.