 Yong-Rui Wang
 Song-Lei Wang2
94% of researchers rate our articles as excellent or good
Learn more about the work of our research integrity team to safeguard the quality of each article we publish.
Find out more
ORIGINAL RESEARCH article
Front. Nutr. , 18 October 2022
Sec. Food Chemistry
Volume 9 - 2022 | https://doi.org/10.3389/fnut.2022.1003126
This article is part of the Research Topic Flavor Chemistry of Food: Mechanism, Interaction, New Advances View all 24 articles
The traditional charcoal technique was used to determine the changes in the key aroma compounds of Tan mutton during the roasting process. The results showed that the samples at the different roasting time were distinguished using GC-MS in combination with PLS-DA. A total of 26 volatile compounds were identified, among which 14 compounds, including (E)-2-octenal, 1-heptanol, hexanal, 1-hexanol, heptanal, 1-octen-3-ol, 1-pentanol, (E)-2-nonenal, octanal, 2-undecenal, nonanal, pentanal, 2-pentylfuran and 2-methypyrazine, were confirmed as key aroma compounds through the odor activity values (OAV) and aroma recombination experiments. The OAV and contribution rate of the 14 key aroma compounds were maintained at high levels, and nonanal had the highest OAV (322.34) and contribution rate (27.74%) in the samples after roasting for 10 min. The content of α-helix significantly decreased (P < 0.05), while the β-sheet content significantly increased (P < 0.05) during the roasting process. The content of random coils significantly increased in the samples roasted for 0–8 min (P < 0.05), and then no obvious change was observed. At the same time, β-turn content had no obvious change. Correlation analysis showed that the 14 key aroma compounds were all positively correlated with the content of α-helix and negatively correlated with the contents of β-sheet and random coil, and also positively correlated with the content of β-turn, except hexanal and 2-methypyrazine. The results are helpful to promoting the industrialization of roasted Tan mutton.
Regardless of religious restrictions, mutton is extensively consumed owing to its great nutritional value, including iron, zinc, high-quality protein, fat and vitamins (1). The consumption of mutton in China, the world's largest mutton production and consumption country, has steadily increased (2). Tan sheep, one of the most well-known and popular sheep in Ningxia Hui Autonomous Region of China, have frequently boarded the official dinner to entertain international guests (3). The unique geographical environment, forage grass and water quality of the Ningxia region result in a low “off-flavor” of Tan mutton.
Roasted mutton, including roasted sheep leg and mutton shashlik, is a classic and handy meal that is popular across the world (4). During the roasting process of mutton, the reactions, like Maillard reaction, lipid oxidation and the interactions between the components of the meat produce a large number of aroma compounds (5). The aroma compounds, including aliphatic aldehydes, ketones, alcohols, acids and esters, were usually generated by lipid degradation, and these compounds were responsible for the animal species-specific meat aroma (6, 7). The heterocyclic compounds, like nitrogen-containing and oxygen-containing, as well as sulfur-containing chemicals, are regularly produced by the Maillard process and contribute to the fundamental aroma of meat (8). Furthermore, the interaction between the Maillard reaction and the lipid degradation also plays a significant role in the generation of the cooked meat aroma (9). However, the overall aroma of Tan mutton can be altered by modifying the manufacturing conditions, and temperature is an important factor in this process (10).
In the recent 40 years, the key aroma compounds in many types of meat were evaluated by GC-MS combined with GC-O and odor active values (OAV) (8). Based on OAV, a series of compounds, such as hexanal, 1-octen-3-ol, nonanal and octanal, were confirmed as the primary aroma compounds in roasted mutton using a typical charcoal roasting method (11). Different roasting methods, including microwave, electricity and superheated steam, also produced similar aroma compounds in roasted mutton (12–14). However, to our knowledge, little has been known about the changes in aroma compounds or odor expression and its alterations during the roasting process. It is thus necessary to understand the relationship between the changes and key control factors of aroma compounds in roasted mutton, thereby helping producers control the aroma of products (15).
Protein can combine with aroma compounds (16). When the protein's capacity to attach to the aromatic compounds changes, it impacts the retention of the aroma compounds in the product, which has a substantial impact on the product's aroma perception (17). Polypeptides' original conformation was broken during the roasting process, resulting in increased thermal motion, loss of secondary and tertiary structure, and rupture of intermolecular forces, such as electrostatic or non-polar interactions and disulfide bonds (18–20). As a result, the meat's sensory quality after cooking, like tenderness and aroma, was affected by the denaturation of proteins and changes in fiber structure resulting from heat treatment (21, 22). The appropriateness of meat for cooking is determined mostly by macroscopical factors. However, microstructure changes in meat after cooking are the basis and causes of these macroscopical alterations, which have received little attention so far (23).
Thus, the study aimed to (i) select the key aroma compounds by GC-O and study the changes of these compounds in the composition and concentration using GC-MS in roasted Tan mutton during the traditional charcoal process; (ii) identify the key aroma compounds in roasted Tan mutton using OAV and aroma recombination tests; (iii) study the changes in the protein secondary structure of roasted Tan mutton during the roasting process; (iv) determine correlation between the protein secondary structure and key aroma compounds in roasted Tan mutton.
The Tan mutton used in this experiment was randomly obtained from the hind legs of Yanchi Tan sheep (30 ± 1 kg, 9 months age) from Ningxia Xinhai Food Co., Ltd. (Yanchi, China). The following chemicals were purchased from Sigma-Aldrich (Shanghai, China): 1,2-dichlorobenzene (internal standard, 99.7%) and n-alkanes (C5-C32, 98%), hexanal (95%), heptanal (97%), 1-heptanol (97%), benzaldehyde (99.5%), 2-methypyrazine (99%), (E)-2-undecenal (96%), pentanal (99%), octanal (99%), 1-hexanol (99%), 1-pentanol (99%), (E)-2-octenal (97%), nonanal (99.5%), (E)-2-nonenal (97%), 2-pentylfuran and 1-octen-3-ol (98%). Methanol (analytical grade) was purchased from Thermo Fisher Scientific Co., Ltd. (Shanghai, China).
The bones were removed from the leg of the Tan sheep, and then the mutton washed with tap water to clean the blood and other impurities on the surface (24). After washing, the mutton was cut into small pieces (1.5 × 1.5 × 1.0 cm). Then eight pieces of Tan mutton were put into iron sticks, and then placed on the fire for grilling. The Tan mutton was roasted on a barbeque grill 5 cm from the charcoal fire at 250–270°C, flipping over the clusters every 20 s. The water content of tan mutton decreased from (raw meat) 69.34–72.02 to 48.33–53.25% (roasting for 14 min). The sensory assessment findings revealed that 10 min was the optimal roasting period for the mutton, and the mutton roasted for 10 min had the best flavor and overall acceptability with the unanimous agreement of panelists. The core and surface temperatures of the roasted Tan mutton at 10 min were 79.5–81.2 and 85.6–95.7°C, respectively. The samples were roasted for 0, 2, 4, 6, 8, 10, 12, and 14 min. Three replicate samples (eight iron sticks each) were prepared and subjected to the following analyses.
Aroma analysis of roasted Tan mutton was performed by a GC-MS system (GC-MS 2010 plus, SHIMADZU, Japan) jointed with solid-phase microextraction (SPME) fiber. Briefly, 2 ± 0.01 g of the sample after crushed were placed into a 15 mL headspace bottle with 4 μL of internal standard (1,2-dichlorobenzene, 6.42 μg/mL in methanol). After mixing with a vortex, the headspace bottle was sealed with a PTFE diaphragm, and placed in a water bath at 55°C for 20 min. The aged SPME fiber (50/30 μm DVB / CAR / PDMS) was inserted into a sealed extraction bottle and kept on the top of the mutton sample for adsorption for 30 min, and then transferred to the GC inlet for desorption at 250°C for 5 min. The chromatographic capillary column was DB-WAX (30 m × 0.25 mm × 0.25 μm, Agilent Technologies, Santa Clara, CA). The GC and MS were carried out in accordance with our previous study (25).
A GC system equipped with an olfactory detection port (GC 2014, SHIMADZU, Japan) and a DB-WAX column (60 m × 0.25 mm × 0.25 μm; Agilent Technologies, Inc.) was used for GC-O analysis The GC conditions were the same as for the GC-MS. The effluent was divided in a 1:1 ratio between the MS and the sniffer port. This sniffing experiment was conducted by three professional appraisers. They were required to keep track of the retention time according to the time of the stopwatch and describe the aroma characteristics as soon as they appear in the sniffing port.
The aroma compounds of roasted Tan mutton were identified using a mass spectrometry library (MS), linear retention indices (LRI) and odor characteristics (O) in comparison to authentic flavor standards (S) (Table 1). The retention of a homologous sequence of n-alkanes (C5-C32) was used to compute the LRI. The odorants were validated by comparing the retention time and ion fragments of samples with authentic flavor standards in GC-MS analysis under similar chromatographic conditions. As an internal standard, 1,2-dichlorobenzene was used to semiquantify the aroma compounds. In particular, a 5-point calibration curve was used to measure the quantities of odorants (OAV >1) in an odorless mutton model. The odorless mutton model, in a nutshell, consisted of an odorless mutton matrix, realistic flavor criteria and ultrapure water. The odorless mutton matrix was made according to previous studies (4, 26), with some modifications. Briefly, diethyl ether and n-pentane were added to the mutton (diethyl ether–n-pentane–mutton puree ratio of 2:1:1, m/m/m). After shaking for 12 h, the organic solvent was extracted 5 times. The samples were then frozen in an FD-1A-50 freeze-dryer using liquid nitrogen (Shanghai Zheng-Qiao Science Instrument Plant, Ltd., Beijing, China) at −50°C for 24 h. Sensory panelists assessed the aroma characteristics of roasted mutton and the recombination model.
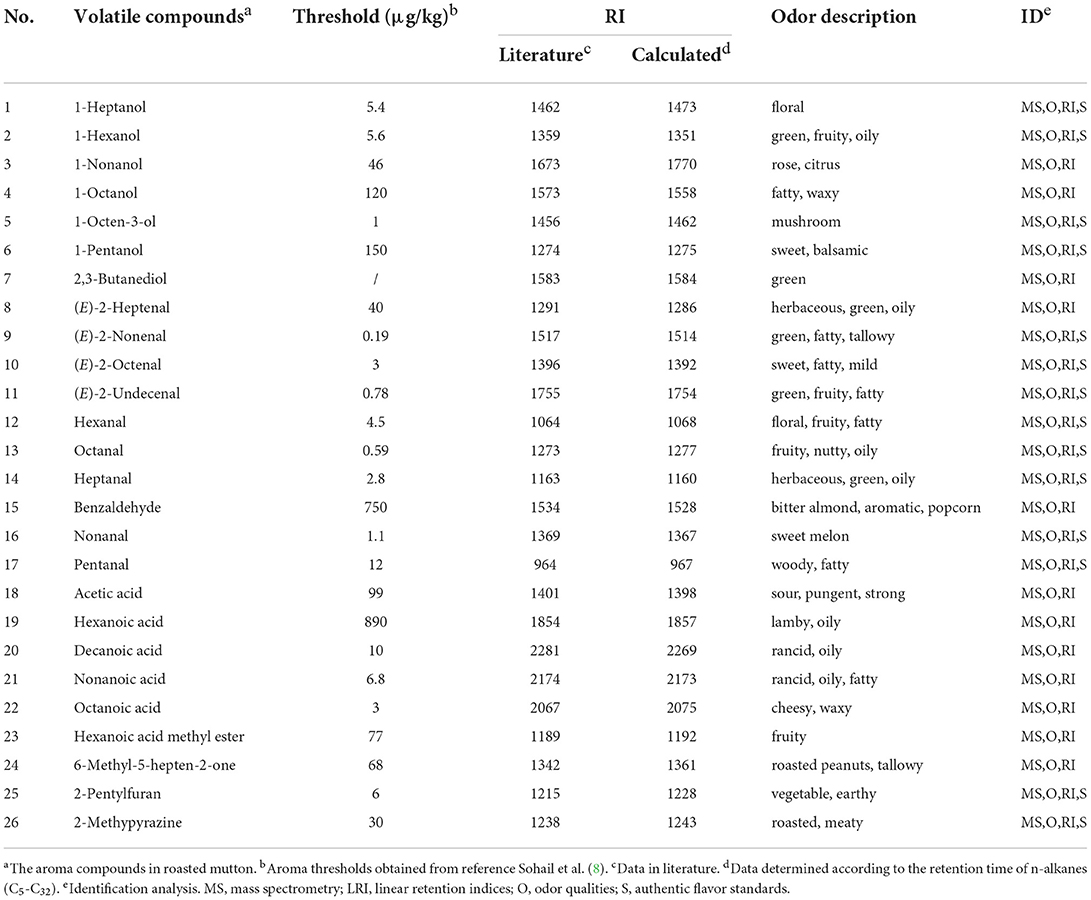
Table 1. Identification of aroma compounds in roasted Tan mutton for 0–14 min.
The protein's secondary structure of roasted Tan mutton was determined using attenuated total reflection (ATR) by Fourier transform infrared spectroscopy (FTIR; Bruker, Germany). Roasted mutton was vacuum-frozen (freezing temperature −25°C, cold trap temperature −30°C, vacuum degree 20 Pa), dried for 48 h and then crushed into 200 mesh powder. Then 2 mg sample of roasted mutton were added with 100 mg KBr, placed in a mortar to grind and crush until evenness, and then pressed into thin slices for analysis by mid-infrared spectroscopy. The instrument's parameters included absorbance spectra ranging from 500 to 4000 cm−1, a resolution of 4 cm−1, and a scan rate of 100 times. The protein secondary structure information was contained in the amide I spectrum in the mid-IR spectral range of 1700–1600 cm−1, which was caused by the expansion vibration of C = O (27). The superposition of different protein secondary structure peak components resulted in the formation of the amide I band. The second-order derivation and deconvolution technique were used to further deconstruct the peaks in the amide I band of the original protein infrared spectra that were not discernable into multiple sub-peaks. Peakfit 4.12 software was used to perform deconvolution and curve-fitting on the amide I band distribution.
The sensory evaluation was carried out in accordance with previous reports (28, 29). The panelists consisted of 10 graduate students (five males and five females, aged from 22 to 25) who did not suffer rhinitis and were non-smokers (30, 31). Before the experiments, ISO 4121:2003 and GB/T 29604-2013 guidelines were used to train all panelists for 30 days. Firstly, the aroma characteristics of a 54-aroma kit (Le Nez du Vin®, France) were distinguished and described for 20 days (once 5 days, each training lasting for 1 h). Secondly, five olfactory qualities, including meaty, fatty, roasty, grassy, and sweet, were chosen for the panelists to assess the aroma quality of roasted Tan mutton. This assessment lasted for 30 min and was performed 15 times within 30 days. Finally, these panelists were qualified to do the sensory evaluation. The sensory evaluation panel evaluated the sensory properties of roasted Tan mutton on a five-point scale (4~5: very strong, 3~4: strong, 2~3: medium, 1~2: weak, 0~1: very weak). To avoid odor interaction between samples, panelists were required to take a 30 s break during the experiment.
Excel was used to analyze the average value and standard deviation of the data, and the data were expressed as means ± standard deviation. Duncan's multiple range test (P < 0.05) was used to analyze differences between individual means using SPSS 19.0 software (IBM Corporation, USA). The PCA chart of the electronic nose data was made by SIMCA14.0 software. The Pearson correlation analysis was performed by R software. The other graphs were made by Origin 18C software.
To discriminate the samples of roasted Tan mutton, GC-MS was coupled with PLS-DA. As shown in Figure 1A, the PLS-DA score plot showed a distinct separation of the eight sample groups. R2X, R2Y and Q2 values of 0.982, 0.983, and 0.951 were obtained, indicating that the built model was stable and predictive. The raw meat and sample roasted for 2 min located in the first quadrant of the PLS-DA score plot (Figure 1B), among which hexanoic acid methyl ester was the major chemical family forming the odors of raw meat. The mutton samples roasted for 4, 6, and 8 min located in the second quadrant. This distribution was heavily influenced by alcohols and aldehydes, including 1-octene-3-ol, 1-nonanol, 1-octanol, pentanal, heptanal, (E)-2-nonenal, (E)-2-octenal, otanal, 1-hexanol, 1-heptanol, nonanal, (E)-2-undecenal, and 2-pentylfuran. The mutton samples roasted for 10 and 12 min appeared in the third quadrant related to 1-pentanol, hexanal, (E)-2-heptenal, decanoic acid, nonanoic acid, hexanoic acid, acetic acid, 2,3-butanediol, 6-methyl-5-hepten-2-one, 2-methylpyrazine, and benzaldehyde. The mutton sample with roasting for 14 min appeared in the fourth quadrant related to octanoic acid.
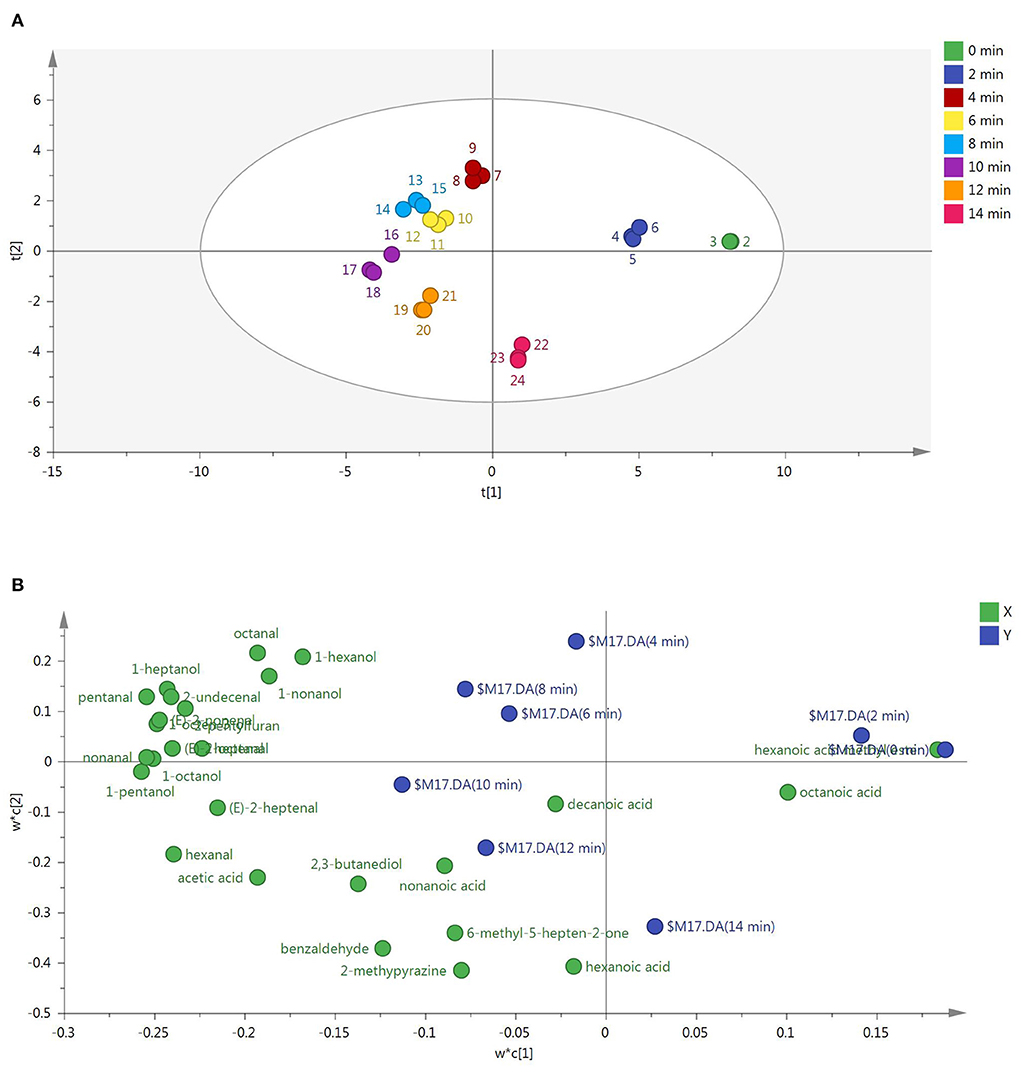
Figure 1. (A) PLS-DA of roasted mutton during the roasting process based on aroma compounds. Samples at each roasting time were measured for 3 replicates. (B) PLS-DA of aroma compounds in roasted mutton during the roasting process. X and Y in the top right represented roasted mutton with different roasting time and aroma compounds (4).
As shown in Tables 1, 2, a total of 26 aroma compounds were identified using DB-WAX columns in all samples, including seven alcohols, 10 aldehydes, five acids, two heterocyclics, one ester and one ketone. In comparison, no significant changes in any of the odorants were found across the eight samples (P > 0.05). Aldehydes and alcohols accounted for more than 65% of all odorants. Methyl ester hexanoic acid was identified in the raw meat and disappeared after roasting for 2 min. Compared with the mutton samples roasted for 2–14 min, the concentration of octanoic acid was significantly higher (P < 0.05) in the raw meat. In contrast, benzaldehyde and pentanal appeared in the mutton roasted for 2 min, with a high concentration in the mutton roasted for 14 min. 1-octanol, hexanal, 1-pentanol, 2-pentylfuran, heptanal, 2,3-butanediol, (E)-2-heptenal, octanal, (E)-2-octenal, nonanal and nonanoic acid were found to have the highest concentrations in the mutton roasted for 8 and 10 min. The mutton roasted for 14 min had the highest concentrations of 6-methyl-5-hepten-2-one, acetic acid, and hexanoic acid. Interestingly, 2-methypyrazine had the highest concentration in the sample roasted for 14 min.
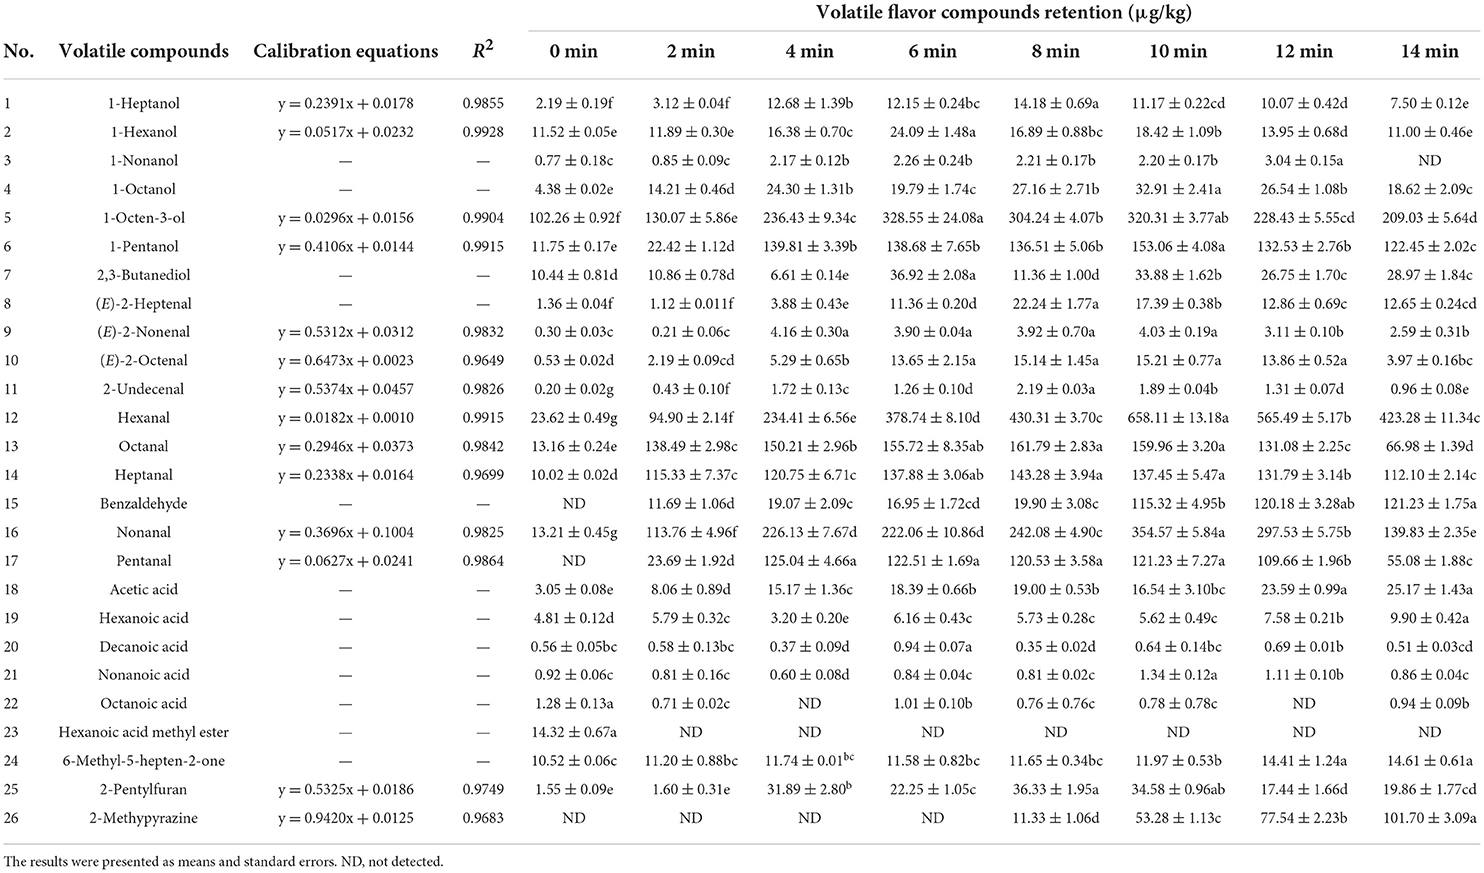
Table 2. Quantitation analysis of aroma compounds in roasted Tan mutton during the roasting process.
In all stages, hexanal, heptanal, (E)-2-octenal, (E)-2-heptenal, nonanal, and octanal were the most important aldehydes, and hexanal had the highest concentration. 1-octen-3-ol was the most important alcohol in roasted Tan mutton. The concentrations of most aldehydes and alcohols rose dramatically in roasted Tan mutton after 2–10 min of roasting (P < 0.05), but reduced after 12–14 min of roasting. In particular, hexanal (658.11 μg/kg), nonanal (354.57 μg/kg), heptanal (137.45 μg/kg), pentanal (121.23 μg/kg), octanal (159.96 μg/kg) and 1-octen-3-ol (320.31 μg/kg) may significantly contribute to the aroma of roasted Tan mutton after 10 min.
The OAV and contribution rate were calculated to better understand the significance of each aroma compound. As shown in Figure 2, a total of 14 aroma compounds, including (E)-2-octenal, 1-heptanol, hexanal, 1-hexanol, heptanal, 1-octen-3-ol, 1-pentanol, (E)-2-nonenal, octanal, (E)-2-undecenal, nonanal, pentanal, 2-pentylfuran and 2-methypyrazine were initially found as the key aroma compounds in roasted Tan mutton because their OAVs surpassed 1. Among them, there were eight aldehydes, four alcohols, one pyrazine and one furan. The concentrations and OAV of 14 key aroma compounds rose considerably (P < 0.05) from 0 to 10 min, but significantly decreased (P < 0.05) from 10 to 14 min. Only 7 of the 14 key aroma compounds with OAV greater than 1 may play critical roles in aroma expression in raw meat, including 1-hexanol, 1-octen-3-ol, (E)-2-nonenal, hexanal, octanal, heptanal, and nonanal. In comparison with raw meat, 14 key odorants were all observed and remained at high levels in the samples for 10 min, among which hexanal (146.24), nonanal (322.33), octanal (271.11), and 1-octen-3-ol (320.31) had the highest OAV. Particularly, the concentration and OAV of nonanal exhibited the highest level in the mutton roasted for 10 min. The contribution rate was further used to demonstrate the importance of each aroma compound. The nonanal (27.74%), 1-octen-3-ol (27.57%), octanal (23.34%), and hexanal (12.59%) primarily contributed to the aroma of roasted mutton for 10 min. Furthermore, the sensory panelists unanimously agreed that the recombination model of 14 key aroma compounds generated the usual meaty, grassy, roasty, fatty, and sweet aromas associated with the roasted mutton (Figure 3). The recombination model's similarity was rated 4.8 out of 5, indicating that the 14 aroma compounds were the key aroma compounds of roasted Tan mutton.
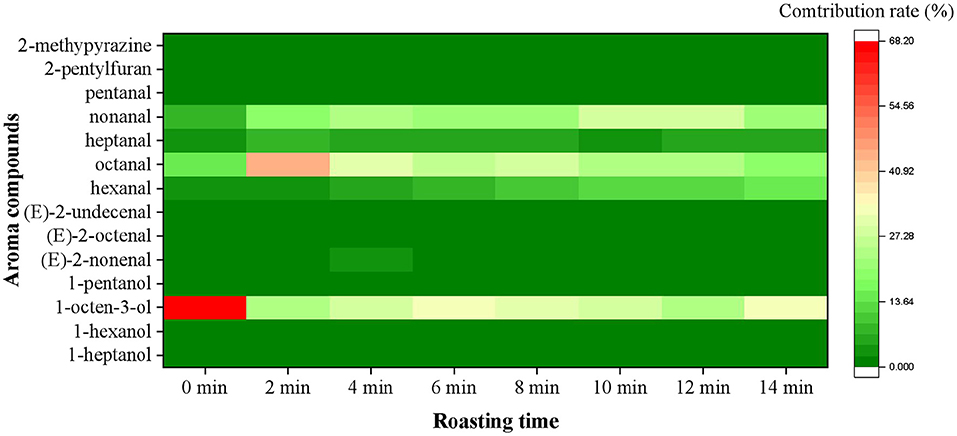
Figure 2. Changes of contribution rates of aroma compounds (OAV > 1) in roasted Tan mutton during the roasting process.

Figure 3. Aroma profiles in roasted Tan mutton and recombination model.
FT-IR spectroscopy is a commonly used and reliable method in the analysis of protein secondary structure. Our second-derivative band placements were consistent with previous studies showing that mid-IR spectra in the range of 1645–1662 cm−1 accounted for the α-helix band, the β-sheet band located at 1612–1640 cm−1 and 1682–1697 cm−1, the β-turn band located at 1662–1682 cm−1, and the random coil located at 1637–1645 cm−1 (32, 33). Fourier self-deconvolution, second derivative, and Gaussian curve-fitting were used in this investigation to quantitatively examine the spectra's second derivative (34). As shown in Table 3 and Figure 4, there was a reduction in the α-helix content (P < 0.05), and an increase in the β-sheet (P < 0.05) across all of the samples. The content of random coils significantly increased in the samples roasted for 0–8 min (P < 0.05), but afterward, no discernible change was found. At the same time, there were no significant changes in the content of β-turn. The contents of α-helix and β-sheet of protein from roasted Tan mutton decreased, and the contents of β-turn and random coil increased. Higher levels of α-helix and β-sheet indicated a more stable secondary structure, whereas higher contents of β-turn and random coil indicated a more flexible protein structure (35).

Table 3. Relative percentage of protein secondary structure of roasted Tan mutton.
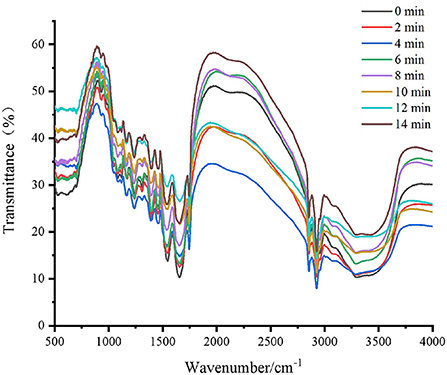
Figure 4. Fourier transform infrared spectroscopy (500–4000 cm−1) from roasted Tan mutton at different roasting time.
The pivotal aroma compounds in meat were aldehydes and alcohols, such as hexanal, nonanal, octanal, and 1-octen-3-ol (36). In this study, 12 aldehydes and alcohols were identified out of 14 key aroma compounds, with a percentage contribution of 98.91–99.95% in the aroma of roasted Tan mutton. Nonanal had the highest OAV (322.34) and contribution rate (27.74%) especially, followed by 1-octen-3-ol, octanal and hexanal in the mutton roasted for 10 min. According to the investigation, lipid oxidation products, such as 1-octen-3-ol, heptanal, hexanal and octanal, had the highest concentrations and OAV in the roasted mutton (4, 13, 37). Although the concentrations of aldehydes and alcohols varied depending on the roasting procedure, these compounds remained the most prominent aroma compounds in the roasted mutton (11).
Unsaturated fatty acids were the primary contributors to the formation of fatty aldehydes and alcohols. In various livestock and poultry meat, oleic acid is the common monounsaturated fatty acid, while linoleic acid, linolenic acid, and arachidonic acid are the common polyunsaturated fatty acids (8). Figure 5 depicts the formation pathway of some aliphatic aldehydes and alcohols from fatty acid degradation. First, hydroperoxides of fatty acids are formed by removing the hydrogen-free radical from the alkyl radical, adding O2, and absorbing the hydrogen-free radical (39). The hydroperoxides are then fractured, which results in the generation of volatile chemicals. As shown in Figure 5, the decomposition of oleic acid 8- and 11-hydroperoxides may result in the formation of octanal and decanal, respectively (40). The decomposition of linoleic acid 9- and 13-hydroperoxides may result in the formation of (E, E)-2,4-decadienal and hexanal, respectively (38, 41). Furthermore, the generated aldehydes can undergo further reactions, such as alcohol or acid transformation or retro-aldol condensation (9, 42). The decomposition of 9- and 13-hydroperoxides of linoleic acid can produce (E, E)-2,4-decadienal, and the retro-aldolization of (E, E)-2,4-decadienal can result in the formation of (E)-2-octenal.
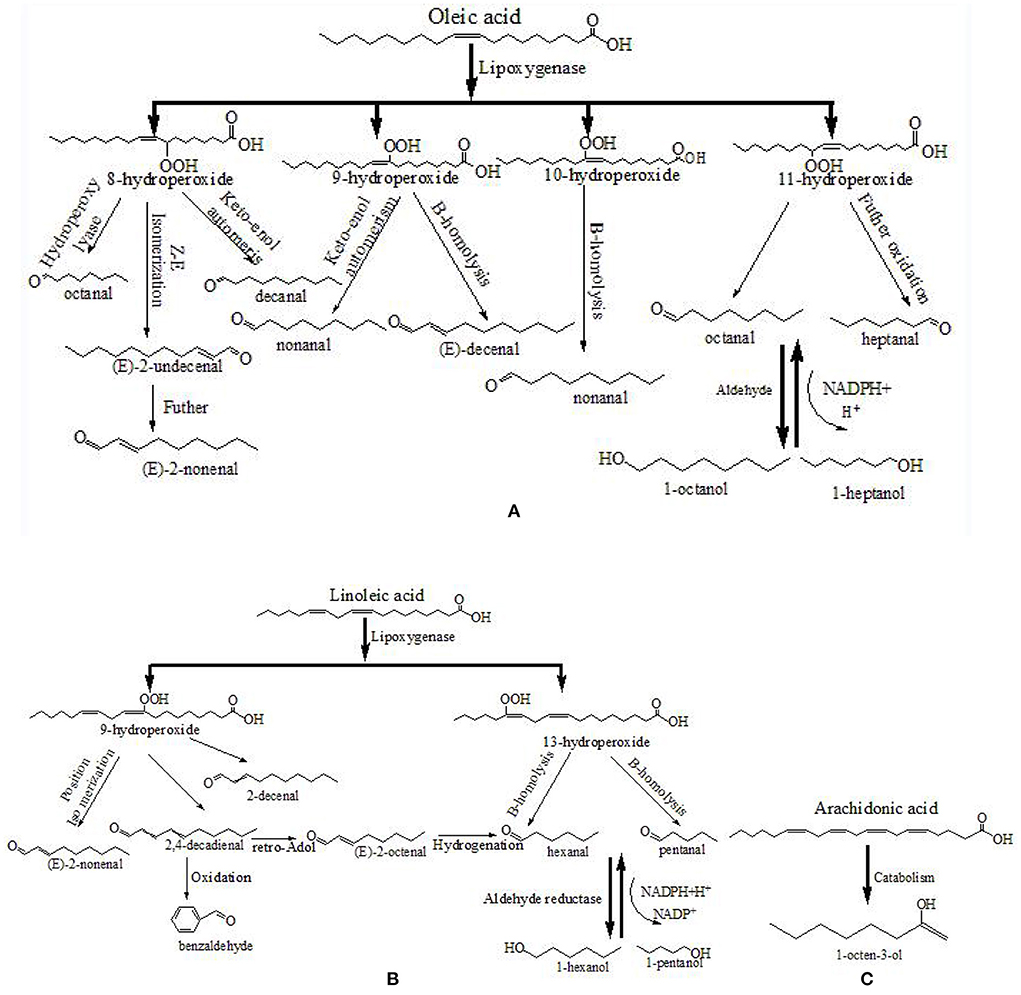
Figure 5. Formation pathway of the typical aliphatic aldehydes from the fatty acid (A–C). Referred to Al-Dalali et al. (38).
As for the 14 key aroma compounds in roasted Tan mutton, the major source of 1-octen-3-ol, which has a mushroom odor, is arachidonic acid (38, 43). Hexanal, pentanal, heptanal, (E)-2-nonenal, (E)-2-octenal, 1-pentanol and 2-pentylfuran are derived from the oxidized linoleic acid, while octanal, 1-hexanol, 1-heptanol nonanal and 2-undecenal are mainly oxidized from oleic acid. Furthermore, 2-methypyrazine may also be generated from lipid-Maillard interaction and a higher pH value contributed to its generation (44, 45).
Protein is a key quality indicator in the roasted meat, influencing the color, texture and flavor of the meat (46–48). Particularly, some physiologically active enzymes in meat have a direct impact on meat tenderness (49). The amide I band is the most useful band to analyze secondary structural information of proteins. The alterations in the FTIR band in the current investigation were in accordance with previous studies showing that the level of β-sheet gradually increased and the α-helix content decreased during roasting process (50, 51). The decrease of α-helix content suggested that myofibrillar proteins were uncoiling and nonpolar amino acids were exposed to the surface of proteins in roasted Tan mutton (51, 52). The exposure to nonpolar amino acids led to the improvement of surface hydrophobicity, and this improvement was sensitive to the change in roasting temperature (53). The interaction between nonpolar amino acids was greatly strengthened, leading to protein aggregation when roasted at high temperatures (54). Protein aggregation significantly altered the structure of proteins, and β-sheet was shown to be intimately associated with protein aggregation (55). The increase of β-sheet content in roasted Tan mutton during the roasting process may be due to the effects of heating on the reconstruction of unfolded myofibrillar proteins and the aggregation of myofibrillar proteins via hydrophobic interaction between nonpolar amino acids (56, 57). Interestingly, an increased content of random coils was observed in the samples roasted for 0–8 min, suggesting that random coils were formed as a result of extreme denaturation of myofibrillar proteins (58).
Many flavor compounds, including ketones, aldehydes and esters, bind to proteins via hydrophobic interactions (59–61). During the roasting process, a high energy input may cause a significant degree of denaturation and destruction of the secondary structure (62, 63). Changes in the microstructure of macromolecules, such as changes in protein conformation (α-helix, β-sheet, and β-turn), can alter the interaction between volatile chemicals and proteins (64). Finally, the phase equilibrium of the flavor compound system may be broken.
To understand the relationship between the structure of proteins and the key aroma compounds during the roasting process, the Pearson correlation analysis was performed (Figure 6). The 14 key aroma compounds were all positively correlated with α-helix and were all negatively correlated with β-sheet and random coil in the amide I band and were also positively correlated with β-turn except hexanal and 2-methypyrazine. Among them, hexanal both had the highest correlation coefficient with α-helix and β-sheet.
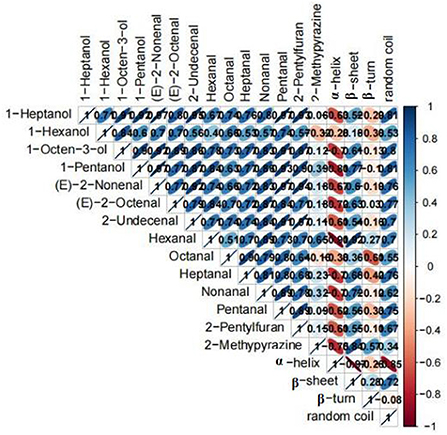
Figure 6. Correlation matrix between parameters of proteins structures (α-helix, β-sheet, β-turn, and random coil) and key aroma compounds.
Thermal processing methods have a significant influence on the aroma of mutton. In this study, 14 aroma compounds, including 1-heptanol, 1-hexanol, 1-octen-3-ol, 1-pentanol, (E)-2-nonenal (E)-2-octenal, (E)-2-undecenal, hexanal, octanal, heptanal, nonanal, pentanal, 2-pentylfuran, and 2-methypyrazine, were identified as key aroma compounds in roasted Tan mutton under charcoal grilling conditions. Among them, the key aroma compounds were aldehydes and alcohols. A reduction in the α-helix content (p < 0.05) and an increase in the β-sheet level (p < 0.05) were observed during the whole roasting process. Furthermore, random coil content significantly increased in the samples roasted for 0–8 min and β-turn content did not change. Correlation analysis showed that 14 key aroma compounds were all positively correlated with α-helix and negatively correlated with β-sheet and random coil in the amide I band, and were also positively correlated with β-turn except hexanal and 2-methypyrazine. In the next step, we will study the key volatile compounds of common condiments to lay the foundation for revealing the interaction between the aroma of roasted Tan mutton and condiments, which is helpful to promoting the industrialization of roasted Tan mutton.
The original contributions presented in the study are included in the article/supplementary material, further inquiries can be directed to the corresponding author.
Y-RW: conceptualization, methodology, software, data curation, and writing—original draft preparation. S-LW: visualization and investigation. R-ML: software, validation, and writing—reviewing and editing. All authors contributed to the article and approved the submitted version.
The State Key Research and Development Plan (2018YFD0400101), the Natural Science Foundation of China (31660484), and the Key Research and Development Plan of Ningxia Hui Autonomous Region (2019BEH03002) provided financial assistance for this work.
The authors declare that the research was conducted in the absence of any commercial or financial relationships that could be construed as a potential conflict of interest.
All claims expressed in this article are solely those of the authors and do not necessarily represent those of their affiliated organizations, or those of the publisher, the editors and the reviewers. Any product that may be evaluated in this article, or claim that may be made by its manufacturer, is not guaranteed or endorsed by the publisher.
1. Qi SS, Wang P, Zhan P, Tian HL. Characterization of key aroma compounds in stewed mutton (goat meat) added with thyme (Thymus vulgaris L.) based on the combination of instrumental analysis and sensory verification. Food Chem. (2022) 371:131111. doi: 10.1016/j.foodchem.2021.131111
2. Fan H, Fu W. Analysis of supply and demand changes in China's mutton market based on partial equilibrium model. Acta Agri Zhejiangensis. (2020) 32:1123–32.
3. Cheng L, Liu G, He J, Wan G, Ma C, Ban J, et al. Non-destructive assessment of the myoglobin content of Tan sheep using hyperspectral imaging. Meat Sci. (2019) 167:107988. doi: 10.1016/j.meatsci.2019.107988
4. Liu H, Hui T, Fang F, Li SB, Wang ZY, Zhang DQ, et al. The formation of key aroma compounds in roasted mutton during the traditional charcoal process. Meat Sci. (2022) 184:108689. doi: 10.1016/j.meatsci.2021.108689
5. Fan MD, Xiao QF, Xie JC, Cheng J, Sun BG, Du WB, et al. Aroma compounds in chicken broths of Beijing Youji and commercial broilers. J Agri Food Chem. (2018) 66:10242–51. doi: 10.1021/acs.jafc.8b03297
6. Bassam SM, Noleto-Dias C, Farag MA. Dissecting grilled red and white meat flavor: its characteristics, production mechanisms, influencing factors and chemical hazards. Food Chem. (2022) 371:131139. doi: 10.1016/j.foodchem.2021.131139
7. Zhao J, Wang M, Xie J, Zhao M, Hou L, Liang J, et al. Volatile flavor constituents in the pork broth of black-pig. Food Chem. (2017) 226:51–60. doi: 10.1016/j.foodchem.2017.01.011
8. Sohail A, Al-Dalali S, Wang JN, Xie JC, Shakoor A, Asimi S, et al. Aroma compounds identified in cooked meat: a review. Food Res Int. (2022) 157:111385. doi: 10.1016/j.foodres.2022.111385
9. Wang TZ, Zhen DW, Tan J, Xie JC, Cheng J, Zhao J, et al. Characterization of initial reaction intermediates in heated model systems of glucose, glutathione, and aliphatic aldehydes. Food Chem. (2020) 305:125482. doi: 10.1016/j.foodchem.2019.125482
10. Ortner E, Granvogl M. Thermally induced generation of desirable aroma-active compounds from the glucosinolate sinigrin. J Agri Food Chem. (2018) 66:2485–90. doi: 10.1021/acs.jafc.7b01039
11. Liu H, Ma J, Pan T, Suleman R, Wang Z, Zhang D, et al. Effects of roasting by charcoal, electric, microwave and superheated steam methods on (non)volatile compounds in oyster cuts of roasted lamb. Meat Sci. (2021) 172:108324. doi: 10.1016/j.meatsci.2020.108324
12. Adelina NM, Wang H, Zhang LG, Zhao YH. Comparative analysis of volatile profiles in two grafted pine nuts by headspace-SPME/GC-MS and electronic nose as responses to different roasting conditions. Food Res Int. (2021) 140:110026. doi: 10.1016/j.foodres.2020.110026
13. Franciscoa VC, Almeida LC, Junior SB, Neto JO, Nassu RT. Química. Nova. (2020) 43:435–41. doi: 10.21577/0100-4042.20170505
14. Xiao X, Hou C, Zhang D, Li X, Ren C, Ijaz M, et al. Effect of pre- and post-rigor on texture, flavor, heterocyclic aromatic amines and sensory evaluation of roasted lamb. Meat Sci. (2020) 169:108220. doi: 10.1016/j.meatsci.2020.108220
15. Liu H, Huang J, Hu Q, Chen Y, Lai K, Xu J, et al. Dual-fiber solid-phase microextraction coupled with gas chromatography-mass spectrometry for the analysis of volatile compounds in traditional Chinese dry-cured ham. J Chromato B. (2020) 1140:121994. doi: 10.1016/j.jchromb.2020.121994
16. Wang K, Li C, Wang B, Yang W, Luo S, Zhao Y, et al. formation of macromolecules in wheat gluten/starch mixtures during twin-screw extrusion: Effect of different additives. J Sci Food Agri. (2017) 97:5131–8. doi: 10.1002/jsfa.8392
17. Guichard E. Flavour retention and release from protein solutions. Biotechnol Adv. (2006) 24:226–9. doi: 10.1016/j.biotechadv.2005.11.003
18. Hu L, Ren S, Shen Q, Chen J, Ye X, Ling J, et al. Proteomic study of the effect of different cooking methods on protein oxidation in fish fillets. RSC Adv. (2017) 7:27496–505. doi: 10.1039/C7RA03408C
19. Yu T, Morton J, Clerens S, Dyer J. Cooking-induced protein modifications in meat. Comp Rev Food Sci Food Safety. (2017) 16:141–59. doi: 10.1111/1541-4337.12243
20. Nawaz A, Li E, Khalifa I, Walayat N, Liu J, Irshad S, et al. Effect of Different Processingn methods on quality, structure, oxidative properties and water distribution properties of fish meat-based snacks. Foods. (2021) 10:2467. doi: 10.3390/foods10102467
21. Kong F, Tang J, Lin M, Rasco B. Thermal effects on chicken and salmon muscles: Tenderness, cook loss, area shrinkage, collagen solubility and microstructure. LWT - Food Sci Technol. (2007) 41:1210–22. doi: 10.1016/j.lwt.2007.07.020
22. Pérez-Juan M, Kondjoyan A, Picouet P, Realini CE. Effect of marination and microwave heating on the quality of semimembranosus and semitendinosus muscles from Friesian mature cows. Meat Sci. (2012) 92:107–14. doi: 10.1016/j.meatsci.2012.04.020
23. Liu H, Wang Z, Suleman R, Shen Q, Zhang D. Effect of protein thermal stability and protein secondary structure on the roasted mutton texture and colour from different cuts. Meat Sci. (2019) 156:52–8. doi: 10.1016/j.meatsci.2019.05.014
24. Zhan P, Tian HL, Zhang XM, Wang LP. Contribution to aroma characteristics of mutton process flavor from the enzymatic hydrolysate of sheep bone protein assessed by descriptive sensory analysis and gas chromatography olfactometry. J Chromato B. (2013) 922:1–8. doi: 10.1016/j.jchromb.2012.12.026
25. Wang YR, Luo RM, Wang SL. Water distribution and key aroma compounds in the process of beef roasting. Front Nutr. (2022) 9:978622. doi: 10.3389/fnut.2022.978622
26. Bressanello D, Liberto E, Cordero C, Sgorbini B, Rubiolo P, Pellegrino G, et al. Chemometric modeling of coffee sensory notes through their chemical signatures: Potential and limits in defining an analytical tool for quality control. J Agri Food Chem. (2018) 66:7096–109. doi: 10.1021/acs.jafc.8b01340
27. Sun S, Guo B, Wei Y, Fan M. Multi-element analysis for determining the geographical origin of mutton from different regions of China. Food Chem. (2011) 124:1151–6. doi: 10.1016/j.foodchem.2010.07.027
28. Biffin TE, Smith MA, Bush RD, Collins D, Hopkins DL. The effect of electrical stimulation and tenderstretching on colour and oxidation traits of alpaca (Vicunga pacos) meat. Meat Sci. (2019) 156:125–30. doi: 10.1016/j.meatsci.2019.05.026
29. Schmidberger PC, Schieberle P. Changes in the key aroma compounds of raw shiitake mushrooms (Lentinula edodes) induced by pan-frying as well as by rehydration of dry mushrooms. J Agri Food Chem. (2020) 68:4493–506. doi: 10.1021/acs.jafc.0c01101
30. Pu DD, Duan W, Huang Y, Zhang YY, Sun BG, Ren FZ, et al. Characterization of the key odorants contributing to retronasal olfaction during bread consumption. Food Chem. (2020) 318:126520. doi: 10.1016/j.foodchem.2020.126520
31. Pu DD, Zhang YY, Zhang HY, Sun BG, Ren FZ, Chen HT, et al. Characterization of the key aroma compounds in traditional Hunan Smoke-Cured Pork Leg (Larou, THSL) by aroma extract dilution analysis (AEDA), odor activity value (OAV), and sensory evaluation experiments. Foods. (2020) 9:413. doi: 10.3390/foods9040413
32. Singh A, Lahlali R, Vanga SK, Karunakaran C, Orsat V, Raghavan V, et al. Effect of high electric field on secondary structure of wheat gluten. Int J Food Prop. (2016) 19:1217–26. doi: 10.1080/10942912.2015.1076458
33. Vanga SK, Wang J, Orsat V, Raghavan V. Effect of pulsed ultrasound, a green food processing technique, on the secondary structure and in-vitro digestibility of almond milk protein. Food Res Int. (2020) 137:109523. doi: 10.1016/j.foodres.2020.109523
34. Zhou LY, Zhang Y, Zhao CB, Lin HJ, Wang ZJ, Wu F, et al. Structural and functional properties of rice bran protein oxidized by peroxyl radicals. Int J Food Prop. (2017) 20:1456–67. doi: 10.1080/10942912.2017.1352596
35. Zhang ZY, Yang YL, Zhou P, Zhang X, Wang JY. Effects of high pressure modification on conformation and gelation properties of myofibrillar protein. Food Chem. (2017) 217:678–86. doi: 10.1016/j.foodchem.2016.09.040
36. Zhang J, Pan D, Zhou G, Wang Y, Dang Y, He J, et al. The changes of the volatile compounds derived from lipid oxidation of boneless dry-cured hams during processing. Eur J Lipid Sci Technol. (2019) 121:1900135. doi: 10.1002/ejlt.201900135
37. Liu H, Hui T, Fang F, Ma QL, Li SB, Zhang DQ, et al. Characterization and discrimination of key aroma compounds in pre- and postrigor roasted mutton by GC-O-MS, GC E-Nose and aroma recombination experiments. Foods. (2021) 10:2387. doi: 10.3390/foods10102387
38. Al-Dalali S, Li C, Xu B. Insight into the effect of frozen storage on the changes in volatile aldehydes and alcohols of marinated roasted beef meat: Potential mechanisms of their formation. Food Chem. (2022) 385:132629. doi: 10.1016/j.foodchem.2022.132629
39. Domínguez R, Pateiro M, Gagaoua M, Barba FJ, Zhang W, Lorenzo JMA, et al. Comprehensive review on lipid oxidation in meat and meat products. Antioxidants. (2019) 8:429. doi: 10.3390/antiox8100429
40. Merlo TC, Lorenzo JM, Saldãna E, Patinho I, Oliveira AC, Menegali BS, et al. Relationship between volatile organic compounds, free amino acids, and sensory profile of smoked bacon. Meat Sci. (2021) 181:108596. doi: 10.1016/j.meatsci.2021.108596
41. Du WB, Zhao MY, Zhen DW, Tan J, Wang TZ, Xie JC, et al. Key aroma compounds in Chinese fried food of youtiao. Flavour Frag J. (2019) 35:88–98. doi: 10.1002/ffj.3539
42. Al-Dalali S, Li C, Xu B. Effect of frozen storage on the lipid oxidation, protein oxidation, and flavor profile of marinated raw beef meat. Food Chem. (2022) 376:131881. doi: 10.1016/j.foodchem.2021.131881
43. Zang MW, Wang L, Zhang ZQ, Zhang KH, Li D, Li XM, et al. Changes in flavour compound profiles of precooked pork after reheating (warmed-over flavour) using gas chromatography–olfactometry–mass spectrometry with chromatographic feature extraction. Int J Food Sci Technol. (2019) 55:978–87. doi: 10.1111/ijfs.14306
44. Resconi VC, Bueno M, Escudero A, Magalhaes D, Ferreira V, Campo MM, et al. Ageing and retail display time in raw beef odour according to the degree of lipid oxidation. Food Chem. (2018) 242:288–300. doi: 10.1016/j.foodchem.2017.09.036
45. Li ZZ, Ha M, Frank D, McGilchrist P, Warner RD. Volatile profile of dry and wet aged beef loin and its relationship with consumer flavour liking. Foods. (2021) 10:3113. doi: 10.3390/foods10123113
46. Berhe DT, Engelsen SB, Hviid M, Lametsch R. Raman spectroscopic study of effect of the cooking temperature and time on meat proteins. Food Res Int. (2014) 66:123–31. doi: 10.1016/j.foodres.2014.09.010
47. Han Z. Meng-jie Cai MJ, Cheng JH, Sun DW. Effects of constant power microwave on the adsorption behaviour of myofibril protein to aldehyde flavour compounds. Food Chem. (2021) 336:127728. doi: 10.1016/j.foodchem.2020.127728
48. Guo X, Wang YQ, Lu SL, Wang JY, Fu HH, Gu BY, et al. Changes in proteolysis, protein oxidation, flavor, color and texture of dry-cured mutton ham during storage. LWT Food Sci Technol. (2021) 149:111860. doi: 10.1016/j.lwt.2021.111860
49. Becker A, Boulaaba A, Pingen S, Krischek C, Klein G. Low temperaturecooking of pork meat-physicochemical and sensory aspects. Meat Sci. (2016) 118:82–8. doi: 10.1016/j.meatsci.2016.03.026
50. Xu XL, Han MY, Fei Y, Zhou GH. Raman spectroscopic study of heat-induced gelation of pork myofibrillar proteins and its relationship with textural characteristic. Meat Sci. (2010) 87:159–64. doi: 10.1016/j.meatsci.2010.10.001
51. Zhou CY, Cao JX, Zhuang XB, Bai Y, Li CB, Xu XL, et al. Evaluation of the secondary structure and digestibility of myofibrillar proteins in cooked ham. CyTA J Food. (2019) 17:78–86. doi: 10.1080/19476337.2018.1554704
52. Chelh I, Gatellier P, Sante-Lhoutellier V. Technical note: a simplified procedure for myofibril hydrophobicity determination. Meat Sci. (2006) 74:681–3. doi: 10.1016/j.meatsci.2006.05.019
53. Zhou CY, Pan DD, Sun YY, Li CB, Xu XL, Cao JX, et al. The effect of cooking temperature on the aggregation and digestion rate of myofibrillar proteins in Jinhua ham. J Sci Food Agri. (2018) 98:3563–70. doi: 10.1002/jsfa.8872
54. Xie J, Qin M, Cao Y, Wang W. Mechanistic insight of photo-induced aggregation of chicken egg white lysozyme: The interplay between hydrophobic interactions and formation of inter-molecular disulfide bonds. Proteins Struct Funct Bioinform. (2011) 79:2505–16. doi: 10.1002/prot.23074
55. Nault L, Vendrely C, Brechet Y, Bruckert F, Weidenhaupt M. Peptides that form beta-sheets on hydrophobic surfaces accelerate surface-induced insulin amyloidal aggregation. FEBS Lett. (2013) 587:1281–6. doi: 10.1016/j.febslet.2012.11.036
56. Bouraoui M, Nakai S, Li-Chan E. In situ investigation of protein structure in pacific whiting surimi and gels using Raman spectroscopy. Food Res Int. (1997) 30:65–72. doi: 10.1016/S0963-9969(97)00020-3
57. Okuno A, Kato M, Taniguchi Y. Pressure effects on the heat-induced aggregation of equine serum albumin by FT-RT spectroscopic study: Secondary structure, kinetic and thermodynamic properties. Biochem Biophysica Acta. (2007) 1774:652–60. doi: 10.1016/j.bbapap.2007.03.003
58. Yoshidome T, Kinoshita M. Physical origin of hydrophobicity studied in terms of cold denaturation of proteins: comparison between water and simple fluids. Phys Chem Chem Phys. (2012) 14:14554–66. doi: 10.1039/c2cp41738c
59. Viry O, Boom R, Avisona S, Pascu M, Bodnár I. A predictive model for flavor partitioning and protein-flavor interactions in fat-free dairy protein solutions. Food Res Int. (2018) 109:52–8. doi: 10.1016/j.foodres.2018.04.013
60. Pelletier E, Kai S, Guichard E. Measurement of interactions between β-lactoglobulin and flavor compounds (esters, acids, and pyrazines) by affinity and exclusion size chromatography. J Agri Food Chem. (1998) 46:1506–9. doi: 10.1021/jf970725v
61. Guichard E, Langourieux S. Interactions between β-lactoglobulin and flavour compounds. Food Chem. (2000) 71:301–8. doi: 10.1016/S0308-8146(00)00181-3
62. Ying D, Hlaing MM, Lerisson J, Pitts K, Cheng L, Sanguansri L, et al. Physical properties and FTIR analysis of rice-oat flour and maize-oat flour based extruded food products containing olive pomace. Food Res Int. (2017) 100:665–73. doi: 10.1016/j.foodres.2017.07.062
63. Lou XW, Yang QL, Sun YY, Pan DD, Cao JX. The effect of microwave on the interaction of flavour compounds with G-actin from grass carp (Catenopharyngodon idella). J Sci Food Agri. (2017) 97:3917–22. doi: 10.1002/jsfa.8325
Keywords: roasted Tan mutton, key aroma compounds, OAVS, aroma recombination experiment, protein secondary structure, correlation analysis
Citation: Wang YR, Wang SL and Luo RM (2022) Evaluation of key aroma compounds and protein secondary structure in the roasted Tan mutton during the traditional charcoal process. Front. Nutr. 9:1003126. doi: 10.3389/fnut.2022.1003126
Received: 25 July 2022; Accepted: 20 September 2022;
Published: 18 October 2022.
Edited by:
Gang Fan, Huazhong Agricultural University, ChinaReviewed by:
Madhuresh Dwivedi, National Institute of Technology Rourkela, IndiaCopyright © 2022 Wang, Wang and Luo. This is an open-access article distributed under the terms of the Creative Commons Attribution License (CC BY). The use, distribution or reproduction in other forums is permitted, provided the original author(s) and the copyright owner(s) are credited and that the original publication in this journal is cited, in accordance with accepted academic practice. No use, distribution or reproduction is permitted which does not comply with these terms.
*Correspondence: Rui-Ming Luo, d3lyMjAxM3R5bWtAMTYzLmNvbQ==
Disclaimer: All claims expressed in this article are solely those of the authors and do not necessarily represent those of their affiliated organizations, or those of the publisher, the editors and the reviewers. Any product that may be evaluated in this article or claim that may be made by its manufacturer is not guaranteed or endorsed by the publisher.
Research integrity at Frontiers
Learn more about the work of our research integrity team to safeguard the quality of each article we publish.