 Ming Ma
 Zhiwei Feng
 Xiaolong Liu1,2
 Gengxin Jia
95% of researchers rate our articles as excellent or good
Learn more about the work of our research integrity team to safeguard the quality of each article we publish.
Find out more
ORIGINAL RESEARCH article
Front. Nutr. , 15 October 2021
Sec. Nutrition Methodology
Volume 8 - 2021 | https://doi.org/10.3389/fnut.2021.763677
This article is part of the Research Topic Databases and Nutrition - Volume 1 View all 20 articles
Background: Previous studies had revealed that Body Mass Index (BMI) positively affected Bone Mineral Density (BMD). However, an excessively high BMI was detrimental to health, especially for the elderly. Moreover, it was elusive how much BMI was most beneficial for BMD in older adults to maintain.
Objective: To investigate whether there was a BMI saturation effect value that existed to maintain optimal BMD.
Methods: A cross-sectional study was conducted using the datasets of the National Health and Nutrition Examination Survey (NHANES) 2005–2006, 2007–2008, 2009–2010, 2013–2014, and 2017–2018. After adjusting for covariates, an analysis of the association between BMI and BMD in different femoral regions (Total femur, Femoral neck, Trochanter, Intertrochanter, and Ward's triangle) and lumbar spine regions (Total spine, L1, L2, L3, and L4) in the whole population was performed using the multivariate linear regression models, smoothing curve fitting, and saturation effects analysis models. Then, subgroup analyses were performed according to gender, age, and race.
Results: A total of 10,910 participants (5,654 males and 5,256 females) over 50 years were enrolled in this population-based study. Multivariate linear regression analyses in the population older than 50 years showed that BMI was positively associated with femoral BMD and lumbar spine BMD (P < 0.001, respectively). Smoothing curve fitting showed that the relationship between BMI and BMD was not simply linear and that a saturation value existed. The saturation effect analysis showed that the BMI saturation value was 26.13 (kg/m2) in the total femur, 26.82 (kg/m2) in the total spine, and showed site-specificity in L1 (31.90 kg/m2) and L2 (30.89 kg/m2). The saturation values were consistent with the whole participants in males, while there was high variability in the females. BMI saturation values remained present in subgroup analyses by age and race, showing specificity in some age (60–70 years old) groups and in some races.
Conclusions: Our study showed a saturation value association between BMI and BMD for people over 50 years old. Keeping the BMI in the slightly overweight value (around 26 kg/m2) might reduce other adverse effects while obtaining optimal BMD.
Osteoporosis was a common disease of the skeletal system that imposed a substantial economic burden on society (1, 2) and posed a risk of fracture in the elderly (3, 4). As the most common clinical examination index, BMD was the gold standard for assessing osteoporosis (5). Obesity was one of the major public health issues to face in today's society, especially in the United States, with the highest adult obesity prevalence globally (6). Similarly, BMI was used in clinical situations to assess overweight and obesity (7).
Most of the available studies showed a positive association between BMI and BMD. A study in a 70-year-old population showed that patients with high BMI had a higher BMD and a lower risk of osteoporosis than those with a normal BMI (8). In older men and postmenopausal women, an increase in BMI was accompanied by BMD (9–11). However, an excessive BMI caused various other systemic diseases and complications such as hypertension (12), coronary heart disease (13), and type 2 diabetes (14). Possible mechanisms involved in the above diseases were the activation of the sympathetic nervous system (15), damage to the vascular endothelium (16), or insulin resistance (17).
Therefore, it was essential to strike a balance between BMI and BMD. However, existing researches were unclear exactly how much BMI was most beneficial for BMD while reducing the occurrence of other obesity-related complications. Therefore, we investigated the association between BMI and BMD in this work using a cross-sectional population survey sample from the NHANES (18) database for participants aged above 50 years, representing all regions and major ethnicities in the United States. We hypothesize that there was a saturation value of BMI and that keeping BMI at this value would result in an optimal balance between BMI and BMD.
The present study used the data sets from the NHANES database to carry out a cross-sectional study. NHANES is a national health information source to collect the health and nutrition of adults and children in the USA. The NHANES project had approved by the National Center of Health Statistics (NCHS) Research Ethics Review Board (ERB), and every willing participant signed a consent document before starting. (NCHS IRB/ERB Protocol Number: Protocol #2005-06, Continuation of Protocol #2005-06, Continuation of Protocol #2011-17, Protocol #2018-01, https://www.cdc.gov/nchs/nhanes/irba98.htm).
Data sets were used from NHANES 2005–2006, NHANES 2007–2008, NHANES 2009–2010, NHANES 2013–2014, and NHANES 2017–2018 because femur BMD data were only collected the above period. Before the study began, the following people were excluded from BMD testing: (1) Participants refused to measure BMD. (2) Pregnancy. (3) History of radiographic contrast agents in the past 7 days. (4) Test weight over 450 pounds (Beyond the measurement range of DXA equipment). (5) History of bilateral hip fractures, bilateral hip replacements, and pins or steel in both hips. (6) Participants with degenerative spine disease include severe scoliosis, stiffening of the spine, previous spinal fusion, laminectomy, and spine fracture. (7) Insufficient scans of the participant's vertebrae and hips to complete the whole scan. (8) Overlapping of body parts during BMD measurement, e.g., overlapping of hands and legs. (9) Other causes were affecting BMD measurements, such as cardiac stenting, morbid obesity producing excessive x-ray noise. A total of 50,463 participants were included in this study initially. After excluded 36,297 participants under 50 years old, 869 participants without BMI data, and 2,387 participants without BMD data, leaving 10,910 participants included in this study finally (Figure 1).
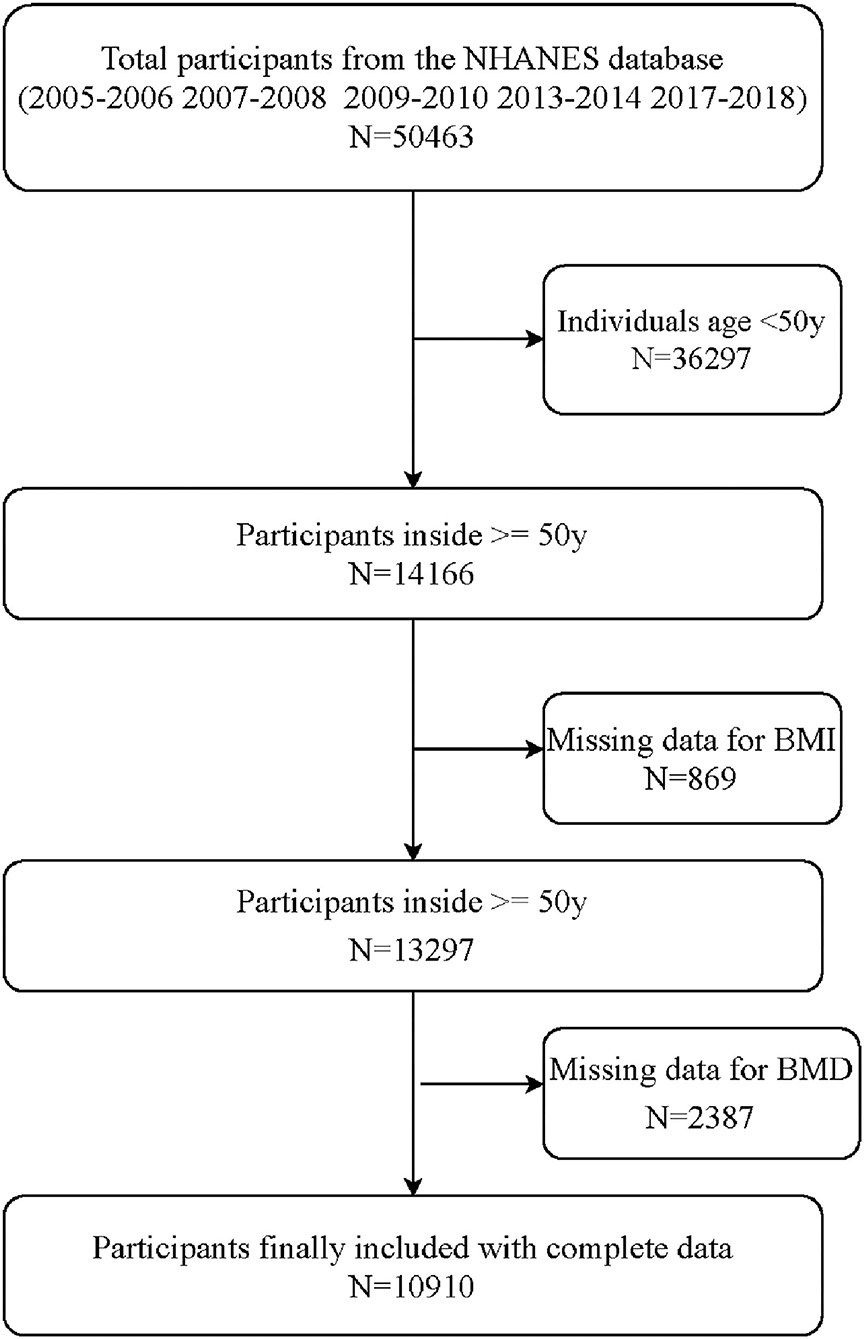
Figure 1. Flow chart of participants selected from the NHANES database.
BMI was calculated as weight (kg) divided by height (m) squared. Participants would not be excluded during the body measurements protocol for medical, safety, or other reasons. Values above the 99th percentile or below the 1st percentile were reviewed for data reasonableness. Data were reviewed for reasonableness based on a combination of height, weight, age, and gender of the participants. Data that were determined to be unrealistic after review will be artificially removed. All data during the BMI measurement would be the original data without any modifications.
The primary outcomes of this study were femoral BMD and lumbar spine BMD. Dual-energy X-ray absorptiometry (DXA) was used to measure the BMD of the participants (19). BMD measurement regions include femoral regions (Total femur, Femoral neck, Trochanter, Intertrochanter, and Ward's triangle) and lumbar spine regions (Total spine, L1, L2, L3, and L4). All measurement data would be subject to data review.
Demographic variables included Gender (Male, Female), Age, Race (Mexican American, Other Hispanic, Non-Hispanic White, Non-Hispanic Black, and Other Race), Education level (<9th grade, 9–11th grade, High school graduate, Some college or AA degree, and College graduate or above), and Ratio of family income to poverty (0–5). The body covariates included Weight, Standing Height, Arm Circumference, and Waist Circumference. Furthermore, other covariates included Biochemistry (Albumin refrigerated serum, Globulin, Glucose refrigerated serum, Cholesterol refrigerated serum, and Triglycerides refrigerated serum), Moderate work activity, and Smoking-Cigarette Use (Smoked at least 100 cigarettes in life).
The Hologic Discovery A: Participants' BMD was examined with the Hologic Discovery A. The Discovery A used a low level of x-rays, and under standard operating conditions, the entrance dose to the examinee for a whole-body scan is less than one mR1 (a standard x-ray is ~35 mR). Digital weight scale: The participants' weight was weighed using a digital weight scale placed on a flat surface. Portable weight scales: If the participant weighed beyond the scope of the digital weight scale, he or she was weighed on a portable scale. Stadiometer: The participants' height was measured used a stadiometer. Height adjustment ruler: A ruler ~15 cm long was used to correct height if the participant's hairstyle interfered with the measurement or if they were unwilling to remove their shoes.
Statistical software R (version 3.6.1) and EmpowerStats Software were used to carry out the statistical analysis. Characteristics of the study population were conducted according to BMI subgroup (1) (Underweight, <18.5 kg/m2; Normal, 18.5–24.9 kg/m2; Overweight, 25–29.9 kg/m2; and Obese, ≥30 kg/m2). Mean ± standard deviation (SD), and Linear regression model for continuous variables (Age, Ratio of family income to poverty, Albumin refrigerated serum, Globulin, Glucose refrigerated serum, Cholesterol refrigerated serum, Triglycerides refrigerated serum, Weight, Standing Height, Waist Circumference, Arm Circumference, Total femur BMD, Femoral neck BMD, Trochanter BMD, Intertrochanter BMD, Wards triangle BMD, Total spine BMD, L1 BMD, L2 BMD, L3 BMD, L4 BMD. Frequencies (%) and a chi-squared test for categorical variables (Gender, Race, Education level, Moderate work activity, and Smoked at least 100 cigarettes in life). Multivariate linear regression analyses were conducted between the BMI and BMD to calculate the β and 95% confidence interval (CI). Three models were used to construct the multivariate test: Model 1, no covariates were adjusted; Model 2, Gender, Age, and Race were adjusted; Model 3, all covariates were adjusted. All covariates included Gender, Race, Age, Education level, Ratio of family income to poverty, Smoked at least 100 cigarettes in life, Moderate work activity, Albumin refrigerated serum, Globulin, Glucose refrigerated serum, Cholesterol refrigerated serum, Cholesterol Triglycerides, Standing Height, Arm Circumference, Waist Circumference. Whether covariates were adjusted in Model 3, we added them to the basic model or removed them from the full model, changing the BMI β at least 10% or the covariate P < 0.1 in the univariate model (Supplementary Table 1). Smoothed curve fittings were performed simultaneously by adjusting the covariates. The association between BMI and BMD was analyzed with a saturated effects analysis model, and the results were expressed as the BMI Turning point (K), effect-β (95% CI), and log-likelihood ratio test (LRT-test). In the saturated effect analysis model, the covariates were adjusted according to criteria 2 in Supplementary Table 1. Finally, the same multivariate linear regression, smoothed curve fitting, and saturation effects analyses were performed in the gender, age, and race subgroups. P < 0.05 was considered statistically significant. Sample weight: The 2-year sample weights were used for all NHANES analyses.
The characteristics of study participants were shown in Table 1. In total, 5,654 male and 5,256 female adults above 50 years old were included. According to the BMI, 163 participants were underweight, 2,781 were normal, 4,185 were overweight, and 3,781 were obese. In each BMI group, the mean for age was 63.236 ± 10.085 years, 63.498 ± 9.887 years, 63.336 ± 9.410 years, and 61.805 ± 8.548 years, respectively. With increased BMI, the femur BMD and spine BMD significantly increased (P < 0.00001, respectively). Age, Gender, Race, Weight, Standing Height, Ratio of family income to poverty, Albumin refrigerated serum, Globulin, Glucose refrigerated serum, Cholesterol refrigerated serum, Cholesterol Triglycerides, Waist Circumference, Arm Circumference, Education level, Moderate work activity, and Smoke behavior were also presented in Table 1.

Table 1. Characteristics of the study participants.
Multivariate linear regression analyses showed BMI was positively associated with Total femur BMD (β = 0.010, 95% CI = 0.010, 0.011), Femoral neck BMD (β = 0.014, 95% CI = 0.012, 0.01), Trochanter BMD (β = 0.013, 95% CI = 0.012, 0.014), Intertrochanter BMD (β = 0.016, 95% CI = 0.008, 0.009), Wards triangle BMD (β = 0.013, 95% CI = 0.011, 0.015), Total spine BMD (β = 0.008, 95% CI = 0.012, 0.01), L1 BMD (β = 0.011, 95% CI = 0.009, 0.013), L2 BMD (β = 0.013, 95% CI = 0.011, 0.015), L3 BMD (β = 0.013, 95% CI = 0.011, 0.016), and L4 BMD (β = 0.014, 95% CI = 0.012, 0.017) in the adjusted model (Table 2). When the BMI was categorized for analysis, the higher categorical had a higher BMD in the Total femur in adjusted model (BMI 18.5, 25: β = 0.116, 95% CI = 0.095, 0.138; BMI 25, 30: β = 0.186, 95% CI = 0.165, 0.207; BMI ≥ 30: β = 0.247, 95% CI = 0.226, 0.269). Similarly, Femoral neck, Trochanter, Intertrochanter, Wards triangle, Total spine, L1, L2, L3, and L4 also had a higher BMD in BMI categorical analysis (β-Value, 95% CI, and P-value were showed in Table 2).
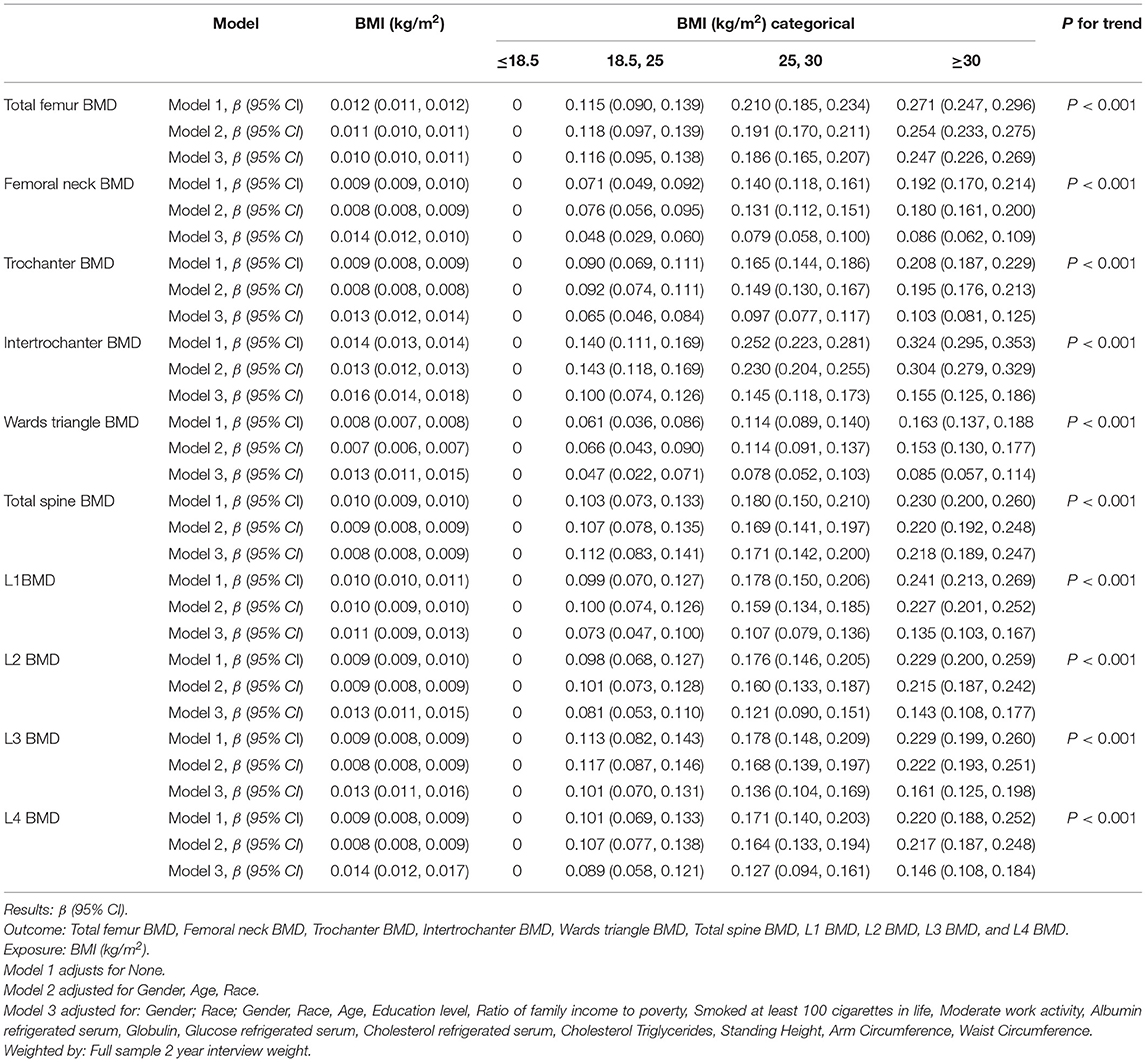
Table 2. Multiple linear regression analysis of the associations between BMI (kg/m2) and BMD (g/cm2) in different models.
When a smoothing curve fitting was conducted in the adjusted model (Figure 2), we found a saturation effect value between BMI and BMD. We further used the saturation effect analysis model to investigate the BMI turning point and found that the saturation effect value was 26.13 (kg/m2) in the Total femur BMD, 26.59 (kg/m2) in the Femoral neck BMD, 26.44 (kg/m2) in the Trochanter BMD, 26.06 (kg/m2) in the Intertrochanter BMD, 29.60 (kg/m2) in the Wards triangle BMD, 26.82 (kg/m2) in the Total spine BMD, 31.90 (kg/m2) in the L1 BMD, 30.89 (kg/m2) in the L2 BMD, 25.60 (kg/m2) in the L3 BMD, and 25.60 (kg/m2) in the L4 BMD (Table 3). When BMI was <26.13 (kg/m2), the total femur BMD increased by 0.023 (95% CI = 0.022, 0.025) g/cm2 for each unit increase in BMI. However, when BMI exceeded 26.13 (kg/m2), the total femur BMD increased by only 0.007 (95% CI = 0.007, 0.008) g/cm2 for each unit increase in BMI. Similarly, when BMI was less than the turning point, BMD of the Femoral neck, Trochanter, Intertrochanter, Wards triangle, Total spine, L1, L2, L3, and L4 increased by 0.016 (95% CI = 0.015, 0.017), 0.018 (95% CI = 0.017, 0.020), 0.028 (95% CI = 0.026, 0.030), 0.013 (95% CI = 0.011, 0.014), 0.018 (95% CI = 0.016, 0.020), 0.015 (95% CI = 0.014, 0.016), 0.015 (95% CI = 0.014, 0.016), 0.018 (95% CI = 0.016, 0.020), and 0.018 (95% CI = 0.016, 0.020) g/cm2, respectively, for each unit increase in BMI. However, when BMI exceeds the turning point, BMD at the sites mentioned above increases very slowly (Table 3).
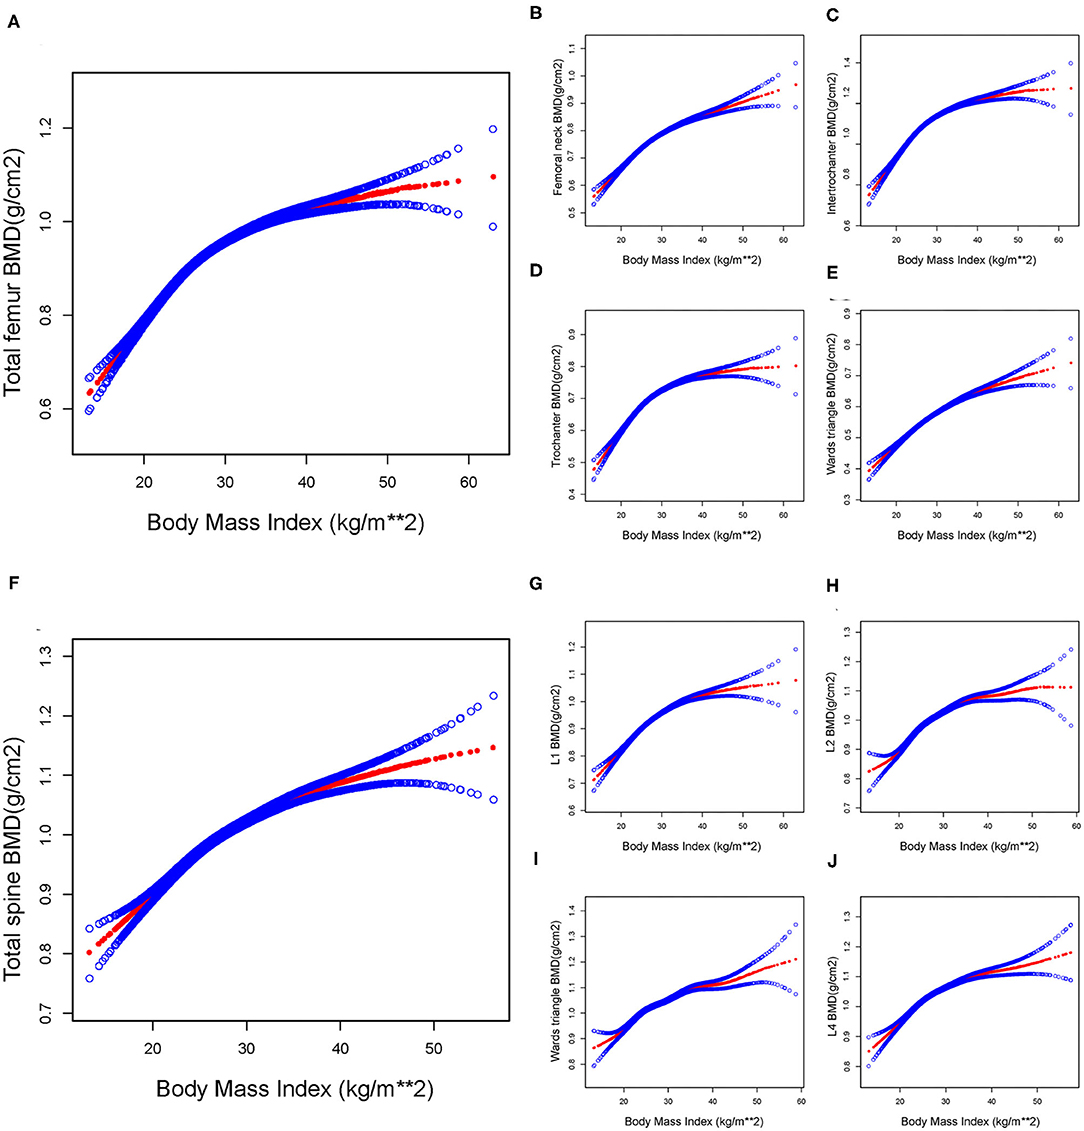
Figure 2. The association between BMI and BMD in total participants. By saturation effect analysis, saturation values were found in all subgroups (Log-likelihood ratio test, P < 0.001, respectively). (A) Total femur group, BMI saturation value = 26.13 (kg/m2). (B) Femoral neck group, BMI saturation value = 26.59 (kg/m2). (C) Trochanter group, BMI saturation value = 26.44 (kg/m2). (D) Intertrochanter group, BMI saturation value = 26.06 (kg/m2). (E) Ward triangle group, BMI saturation value = 29.60 (kg/m2). (F) Total spine group, BMI saturation value = 26.82 (kg/m2). (G) L1 group, BMI saturation value = 31.90 (kg/m2). (H) L2 group, BMI saturation value = 30.89 (kg/m2). (I) L3 group, BMI saturation value = 25.60 (kg/m2). (J) L4 group, BMI saturation value = 25.60 (kg/m2). The red line represents the β-value, and the blue line represents the 95% CI. Adjust for: Gender, Race, Age, Education level, Ratio of family income to poverty, Smoked at least 100 cigarettes in life, Moderate work activity, Albumin refrigerated serum, Globulin, Glucose refrigerated serum, Cholesterol refrigerated serum, Cholesterol Triglycerides, Standing Height, Arm Circumference, Waist Circumference.

Table 3. Saturation effect analysis of BMI (kg/m2) on BMD (g/cm2) in whole participants.
The subgroup analysis conducted by gender was shown in Supplementary Table 2 (Male) and Supplementary Table 3 (Female). After adjusting the covariates, the smoothing curve fitting showed a saturation effect value between BMI and BMD in male participants (Supplementary Figure 1). After adjusting for covariates and using a saturated effects model, we found that the BMI saturation value was 26.25 (kg/m2) in total femur BMD and 26.84 (kg/m2) in the total spine in males participants. This was consistent with the results obtained for the whole participants. However, saturation effects were not evident in the female participants, and saturation values for each femur and lumbar spine region varied widely (Supplementary Figure 2).
The subgroup analysis conducted by age was shown in Supplementary Table 4. After adjusting the covariates, the smoothing curve fitting also showed a saturation effect value. The saturation effect model showed that in the participants aged 60–70 years, the saturation values of BMI in the Femoral neck, Ward triangle, Total spine, and L1–L4 reached 32 (kg/m2), and the results in other age groups were similar in the whole participants (Supplementary Figure 3).
The subgroup analysis conducted by race was shown in Supplementary Table 5. The results showed that the non-Hispanic population had a higher BMI saturation value at the lumbar spine region than at around 30 (kg/m2), while others had a BMI saturation value at around 24 (kg/m2). Mexican Americans and other Hispanics had higher BMI saturation values than other races at several sites in the femoral region, reaching around 35 (kg/m2) in some areas (Supplementary Figure 4).
In the present study, a BMI saturation value (around 26 kg/m2) was founded in the femur BMD and spine BMD in all participants over 50 years old. A positive association was found between BMI and BMD at BMI level <26 (kg/m2) and a minimal increase in BMI level above 26 (kg/m2), this being important for maintaining optimal BMD.
A positive association was found between BMI and BMD. When BMI was <26 (kg/m2), for each unit increased in BMI, the BMD of the femur and spine increased by 0.023 (g/cm2) and 0.018 (g/cm2), which was consistent with the previous studies (20, 21). A cross-sectional study in a Polish population also showed a positive association between BMI and BMD (22). Another study by Morin et al. indicated that low BMI predicted the future occurrence of osteoporosis and increased fracture risk (23). In the middle-aged and elderly female population, maintaining obesity could prevent the onset of postmenopausal bone loss (24). Similarly, a 10.5-year prospective cohort study suggested that obesity may be associated with the delayed bone loss (25). There were several possible mechanisms for a positive association between BMI and BMD as follows: (1) The increased static mechanical compliance produced by excessive fat accumulation was one of the possible mechanisms. Excessive fat accumulation and high body weight could impose greater static mechanical loads on the bones, and bone tissue produced a series of changes when it felt the mechanical forces exerted by the body (26, 27). (2) More body fat in patients with high BMI was accompanied by an increase in various hormones, such as estrogen (28), insulin (29), and leptin (30), which had a beneficial effect on BMD by inhibiting bone resorption (31) and bone remodeling (32, 33). (3) Androgens in adipose tissue were converted to estrogen, which would increase bone mass (34). (4) Studies also reported the effect of some genes (35) on BMD, such as the mutation of the Pro10 allele in tumor necrosis factor-β1 (TGF-β1), which is more frequent in obese patients (36).
Nevertheless, when BMI exceeded a specific value of 26 (kg/m2), the BMD of the femur and spine increased with each unit of BMI by only 0.007 (g/cm2) and 0.006 (g/cm2). The mechanisms of keeping the BMI around 26 to have the most optimal BMD had not been fully explained. A review of the literature allowed us to draw some possible clues. (1) Genetic determinism. Bone growth trajectories (37) and peak bone mass (38) were determined early in life, which might be one of the possible explanations that BMD no longer increased after a limited increase in value in adults. Pocock et al. (39) explored genetic effects on BMD in 38 identical and 27 dizygotic twins and found that genetics determines adult bone mass. Genetic influences explained 75% of BMD variance, regardless of whether the twin was male (40) or female (41). Meanwhile, other acquired environmental factors, such as increased BMI (21), calcium intake (42), estrogen intake (43), and physical exercise (44), have a limit to the increase in BMD in adults. (2) Multi-factors co-leading. Researches had shown a specific bone-adipose axis (45) between adipose and bone tissues within the body, connected by a variety of bioactive molecules and maintained bone homeostasis, which might be another possible mechanism for the presence of BMI saturation effects. Available studies clarified that bone and adipocytes originated from a common stem cell precursor and were competitive, with excess fat gain leading to bone loss (46, 47). Several experiments in animal models induced by high-fat diets had confirmed that BMD in obese animals decreased with increasing obesity (48–50). The PPAR-γ (Peroxisome Proliferator-Activated Receptor-γ) pathway (46) was involved in adipose and bone differentiation in obesity animal models in vivo. Activation of PPAR-γ (51) stimulates adipogenesis and bone loss, while inhibition of PPAR-γ prevents (52) bone loss. Other studies had shown that adipose was an endocrine organ that secreted inflammatory cells such as interleukin-1 (IL-1) and tumor necrosis factor-α (TNF-α) (53). The above cytokines inhibit BMD via the OPG/RANKL/RANK pathway (54). We hypothesized that the multiple factors mentioned above combined to cause an increase in BMI to a certain range without a significant increase in BMD, but direct experimental evidence was insufficient, so more advanced studies were still needed.
Our results showed that although the BMI saturation values were similar in the total femur (BMI saturation value, 26.13 kg/m2) and total spine (BMI saturation value, 26.82 kg/m2), they were significantly higher in the L1 (BMI saturation value, 31.09 kg/m2) and L2 (BMI saturation value, 30.89 kg/m2) than in the other sites, showed site-specificity. This might be related to the increased spondylarthrosis in the elderly, which led to reactive changes and increasing BMD in the lumbar (55). Unfortunately, we could not extract osteoarthritis-related data for a related study because of limitations in the database itself. Subgroup analysis by gender showed that the BMI saturation values for male participants' femur and spine were concentrated around 26 kg/m2. However, the BMI saturation values for female participants varied greatly by each site, which might be linked to the different levels of sex hormones in males and females (56). Age-subgrouped analysis showed that people aged 60–70 years had higher BMI saturation values for the spine than other age groups. A 10-year survey of bone loss rates in the elderly population from Japan suggested that this was related to the prevalence of spine osteophytes in this age group (57). In addition, race subgroup analysis revealed significant differences in BMI saturation values across races, suggesting that different genetic backgrounds and ancestry might be associated with this phenomenon (58).
Indeed, excessive BMI was detrimental to the elderly population. For one, high BMI brought a range of bone-related diseases, such as increased bone fragility (59) and increased fracture risk (60). On the other hand, obesity could lead to a variety of chronic diseases and complications, such as cardiovascular disease (61), type 2 diabetes (62), gallbladder disease (63), and fatty liver (64). More seriously, excessive obesity might be associated with increased cancer risk (65) and cancer-related mortality (66). Therefore, we believed that keeping BMI at a reasonable value (around 26 kg/m2) would maintain optimal BMD and reduce the risk of other obesity-related diseases and complications.
There were several limitations in this study. Firstly, this was a cross-sectional study, and we could only conclude whether there was an association between BMI and BMD, not a direct cause-and-effect correlation. Secondly, due to limitations in the database itself, we could not identify the medication-taking participants, menstrual and menopausal (female participants), and osteoarthritis participants, so our conclusions need to be interpreted with caution. Thirdly, we performed covariates detection to control confounders, but there might still be unpredictable covariates, such as medicine use, menstrual status (female), body fat percentage, etc. Last but not least, to the best of our knowledge, the present study was conducted in a US population, and the findings should be cautiously extended to other populations.
In the present study, we used the multivariate linear regression models, smoothing curve fitting, and saturation effects analysis models to investigate the association between BMI and BMD of people over 50 years old in the US. We found not only a simple linear positive association between BMI and BMD, but a saturation value existed, and this saturation value persisted during site-specific analysis, sex, age, and race subgroup analysis. This work indicated that keeping BMI at a reasonable value (around 26 kg/m2) will provide the most significant benefit to older adults in maintaining optimal BMD and reducing other obesity-related diseases.
The original contributions presented in the study are included in the article/Supplementary Material, further inquiries can be directed to the corresponding author/s.
The studies involving human participants were reviewed and approved by NCHS IRB/ERB Protocol Number: Protocol #2005-06, Continuation of Protocol #2005-06, Continuation of Protocol #2011-17, Protocol #2018-01. The patients/participants provided their written informed consent to participate in this study.
MM and ZF conceived the study, data curation, data analysis, and draft writing. XL and GJ completed images and tables preparation. BG conceived the study and writing Instruction. YX conceived the study, funding acquisition, and writing-review editing. All the authors participated in critical revision of the manuscript, contributed to the article, and approved the submitted version.
This work was supported by the National Natural Science Foundation of China (81874017, 81960403, and 82060405); Natural Science Foundation of Gansu Province of China (20JR5RA320); and Cuiying Scientific and Technological Innovation Program of Lanzhou University Second Hospital (CY2017-ZD02).
The authors declare that the research was conducted in the absence of any commercial or financial relationships that could be construed as a potential conflict of interest.
All claims expressed in this article are solely those of the authors and do not necessarily represent those of their affiliated organizations, or those of the publisher, the editors and the reviewers. Any product that may be evaluated in this article, or claim that may be made by its manufacturer, is not guaranteed or endorsed by the publisher.
The Supplementary Material for this article can be found online at: https://www.frontiersin.org/articles/10.3389/fnut.2021.763677/full#supplementary-material
1. Burge R, Dawson-Hughes B, Solomon DH, Wong JB, King A, Tosteson A. Incidence and economic burden of osteoporosis-related fractures in the United States, 2005-2025. J Bone Miner Res. (2007) 22:465–75. doi: 10.1359/jbmr.061113
2. Lane JM, Russell L, Khan SN. Osteoporosis. Clin Orthop Relat Res. (2000) 372:139–50. doi: 10.1097/00003086-200003000-00016
3. Black DM, Rosen CJ. Clinical practice. Postmenopausal osteoporosis. N Engl J Med. (2016) 374:254–62. doi: 10.1056/NEJMcp1513724
4. Seeman E, Delmas PD. Bone quality–the material and structural basis of bone strength and fragility. N Engl J Med. (2006) 354:2250–61. doi: 10.1056/NEJMra053077
5. Hauk L. Treatment of low BMD osteoporosis to prevent fractures: updated guideline from the ACP. Am Fam Phys. (2018) 97:352–3.
6. Mujica OJ, Victora CG. Obesity inequality among adults in Latin America and the Caribbean. Lancet Glob Health. (2019) 7:e1589–90. doi: 10.1016/S2214-109X(19)30460-7
7. Daniels SR. The use of BMI in the clinical setting. Pediatrics. (2009) 124(Suppl. 1):S35–41. doi: 10.1542/peds.2008-3586F
8. Barrera G, Bunout D, Gattás V, de la Maza MP, Leiva L, Hirsch S. A high body mass index protects against femoral neck osteoporosis in healthy elderly subjects. Nutrition. (2004) 20:769–71. doi: 10.1016/j.nut.2004.05.014
9. Głogowska-Szelag J. [Assessment of the relationship between BMD and body mass index BMI in women with postmenopausal osteoporosis]. Wiad Lek. (2018) 71:1714–8.
10. Edelstein SL, Barrett-Connor E. Relation between body size and bone mineral density in elderly men and women. Am J Epidemiol. (1993) 138:160–9. doi: 10.1093/oxfordjournals.aje.a116842
11. Ravn P, Cizza G, Bjarnason NH, Thompson D, Daley M, Wasnich RD, et al. Low body mass index is an important risk factor for low bone mass and increased bone loss in early postmenopausal women. Early Postmenopausal Intervention Cohort (EPIC) study group. J Bone Miner Res. (1999) 14:1622–7. doi: 10.1359/jbmr.1999.14.9.1622
12. Seravalle G, Grassi G. Obesity and hypertension. Pharmacol Res. (2017) 122:1–7. doi: 10.1016/j.phrs.2017.05.013
13. Garrison RJ, Higgins MW, Kannel WB. Obesity and coronary heart disease. Curr Opin Lipidol. (1996) 7:199–202. doi: 10.1097/00041433-199608000-00005
14. Kahn SE, Hull RL, Utzschneider KM. Mechanisms linking obesity to insulin resistance and type 2 diabetes. Nature. (2006) 444:840–6. doi: 10.1038/nature05482
15. DeLalio LJ, Sved AF, Stocker SD. Sympathetic nervous system contributions to hypertension: updates and therapeutic relevance. Can J Cardiol. (2020) 36:712–20. doi: 10.1016/j.cjca.2020.03.003
16. Li M, Qian M, Kyler K, Xu J. Adipose tissue-endothelial cell interactions in obesity-induced endothelial dysfunction. Front Cardiovasc Med. (2021) 8:681581. doi: 10.3389/fcvm.2021.681581
17. Greenfield JR, Campbell LV. Insulin resistance and obesity. Clin Dermatol. (2004) 22:289–95. doi: 10.1016/j.clindermatol.2004.01.011
18. Patel CJ, Pho N, McDuffie M, Easton-Marks J, Kothari C, Kohane IS, et al. A database of human exposomes and phenomes from the US National Health and Nutrition Examination Survey. Sci Data. (2016) 3:160096. doi: 10.1038/sdata.2016.96
19. Baran DT, Faulkner KG, Genant HK, Miller PD, Pacifici R. Diagnosis and management of osteoporosis: guidelines for the utilization of bone densitometry. Calcif Tissue Int. (1997) 61:433–40. doi: 10.1007/s002239900362
20. Song J, Zhang R, Lv L, Liang J, Wang W, Liu R, et al. The relationship between Body Mass Index and bone mineral density: a Mendelian randomization study. Calcif Tissue Int. (2020) 107:440–5. doi: 10.1007/s00223-020-00736-w
21. Dogan A, Nakipoglu-Yüzer GF, Yildizgören MT, Ozgirgin N. Is age or the body mass index (BMI) more determinant of the bone mineral density (BMD) in geriatric women and men? Arch Gerontol Geriatr. (2010) 51:338–41. doi: 10.1016/j.archger.2010.01.015
22. Wiacek M, Skrzek A, Ignasiak Z, Zubrzycki IZ. The changes of bone mineral density in relation to body mass index and aging among Polish and different ethnic women in the United States: cross-sectional studies. J Clin Densitom. (2010) 13:307–14. doi: 10.1016/j.jocd.2010.03.002
23. Morin S, Tsang JF, Leslie WD. Weight and body mass index predict bone mineral density and fractures in women aged 40 to 59 years. Osteoporos Int. (2009) 20:363–70. doi: 10.1007/s00198-008-0688-x
24. Ribot C, Tremollieres F, Pouilles JM, Bonneu M, Germain F, Louvet JP. Obesity and postmenopausal bone loss: the influence of obesity on vertebral density and bone turnover in postmenopausal women. Bone. (1987) 8:327–31. doi: 10.1016/8756-3282(87)90062-7
25. Saarelainen J, Kiviniemi V, Kröger H, Tuppurainen M, Niskanen L, Jurvelin J, et al. Body mass index and bone loss among postmenopausal women: the 10-year follow-up of the OSTPRE cohort. J Bone Miner Metab. (2012) 30:208–16. doi: 10.1007/s00774-011-0305-5
26. Lanyon LE. Control of bone architecture by functional load bearing. J Bone Miner Res. (1992) 7(Suppl. 2):S369–75. doi: 10.1002/jbmr.5650071403
27. Hla MM, Davis JW, Ross PD, Wasnich RD, Yates AJ, Ravn P, et al. A multicenter study of the influence of fat and lean mass on bone mineral content: evidence for differences in their relative influence at major fracture sites. Early Postmenopausal Intervention Cohort (EPIC) study group. Am J Clin Nutr. (1996) 64:354–60. doi: 10.1093/ajcn/64.3.345
28. Movérare-Skrtic S, Wu J, Henning P, Gustafsson KL, Sjögren K, Windahl SH, et al. The bone-sparing effects of estrogen and WNT16 are independent of each other. Proc Natl Acad Sci USA. (2015) 112:14972–7. doi: 10.1073/pnas.1520408112
29. Costantini S, Conte C. Bone health in diabetes and prediabetes. World J Diabetes. (2019) 10:421–45. doi: 10.4239/wjd.v10.i8.421
30. Isaia GC, D'Amelio P, Di Bella S, Tamone C. Is leptin the link between fat and bone mass? J Endocrinol Invest. (2005) 28:61–5.
31. Guo L, Chen K, Yuan J, Huang P, Xu X, Li C, et al. Estrogen inhibits osteoclasts formation and bone resorption via microRNA-27a targeting PPARγ and APC. J Cell Physiol. (2018) 234:581–94. doi: 10.1002/jcp.26788
32. Krishnan A, Muthusami S. Hormonal alterations in PCOS and its influence on bone metabolism. J Endocrinol. (2017) 232:R99–113. doi: 10.1530/JOE-16-0405
33. Martin, de Vittoris R, David V, Moraes R, Bégeot M, Lafage-Proust MH, et al. Leptin modulates both resorption and formation while preventing disuse-induced bone loss in tail-suspended female rats. Endocrinology. (2005) 146:3652–9. doi: 10.1210/en.2004-1509
34. Bélanger C, Luu-The V, Dupont P, Tchernof A. Adipose tissue intracrinology: potential importance of local androgen/estrogen metabolism in the regulation of adiposity. Horm Metab Res. (2002) 34:737–45. doi: 10.1055/s-2002-38265
35. Nguyen TV, Howard GM, Kelly PJ, Eisman JA. Bone mass, lean mass, and fat mass: same genes or same environments? Am J Epidemiol. (1998) 147:3–16. doi: 10.1093/oxfordjournals.aje.a009362
36. Rosmond R, Chagnon M, Bouchard C, Björntorp P. Increased abdominal obesity, insulin and glucose levels in nondiabetic subjects with a T29C polymorphism of the transforming growth factor-beta1 gene. Horm Res. (2003) 59:191–4. doi: 10.1159/000069323
37. Jones G, Dwyer T. Birth weight, birth length, and bone density in prepubertal children: evidence for an association that may be mediated by genetic factors. Calcif Tissue Int. (2000) 67:304–8. doi: 10.1007/s002230001148
38. Weiler HA, Yuen CK, Seshia MM. Growth and bone mineralization of young adults weighing less than 1500 g at birth. Early Hum Dev. (2002) 67:101–12. doi: 10.1016/S0378-3782(02)00003-8
39. Pocock NA, Eisman JA, Hopper JL, Yeates MG, Sambrook PN, Eberl S. Genetic determinants of bone mass in adults. A twin study. J Clin Invest. (1987) 80:706–10. doi: 10.1172/JCI113125
40. Videman T, Levälahti E, Battié MC, Simonen R, Vanninen E, Kaprio J. Heritability of BMD of femoral neck and lumbar spine: a multivariate twin study of Finnish men. J Bone Miner Res. (2007) 22:1455–62. doi: 10.1359/jbmr.070606
41. Flicker L, Hopper JL, Rodgers L, Kaymakci B, Green RM, Wark JD. Bone density determinants in elderly women: a twin study. J Bone Miner Res. (1995) 10:1607–13. doi: 10.1002/jbmr.5650101102
42. Calvin Hirsch. ACP Journal Club. Review: dietary or supplemental calcium increase BMD by ≤ 1.8% in persons >50 years of age. Ann Intern Med. (2016) 164:JC5. doi: 10.7326/ACPJC-2016-164-2-005
43. Watts NB, Nolan JC, Brennan JJ, Yang HM. Esterified estrogen therapy in postmenopausal women. Relationships of bone marker changes and plasma estradiol to BMD changes: a two-year study. Menopause. (2000) 7:375–82. doi: 10.1097/00042192-200011000-00002
44. Tønnesen R, Schwarz P, Hovind PH, Jensen LT. Physical exercise associated with improved BMD independently of sex and vitamin D levels in young adults. Eur J Appl Physiol. (2016) 116:1297–304. doi: 10.1007/s00421-016-3383-1
45. Gómez-Ambrosi J, Rodríguez A, Catalán V, Frühbeck G. The bone-adipose axis in obesity and weight loss. Obes Surg. (2008) 18:1134–43. doi: 10.1007/s11695-008-9548-1
46. Akune T, Ohba S, Kamekura S, Yamaguchi M, Chung UI, Kubota N, et al. PPARgamma insufficiency enhances osteogenesis through osteoblast formation from bone marrow progenitors. J Clin Invest. (2004) 113:846–55. doi: 10.1172/JCI200419900
47. Gregoire FM, Smas CM, Sul HS. Understanding adipocyte differentiation. Physiol Rev. (1998) 78:783–809. doi: 10.1152/physrev.1998.78.3.783
48. Halade GV, Rahman MM, Williams PJ, Fernandes G. High fat diet-induced animal model of age-associated obesity and osteoporosis. J Nutr Biochem. (2010) 21:1162–9. doi: 10.1016/j.jnutbio.2009.10.002
49. Iwaniec UT, Dube MG, Boghossian S, Song H, Helferich WG, Turner RT, et al. Body mass influences cortical bone mass independent of leptin signaling. Bone. (2009) 44:404–12. doi: 10.1016/j.bone.2008.10.058
50. Halade GV, El Jamali A, Williams PJ, Fajardo RJ, Fernandes G. Obesity-mediated inflammatory microenvironment stimulates osteoclastogenesis and bone loss in mice. Exp Gerontol. (2011) 46:43–52. doi: 10.1016/j.exger.2010.09.014
51. David V, Martin A, Lafage-Proust MH, Malaval L, Peyroche S, Jones DB, et al. Mechanical loading down-regulates peroxisome proliferator-activated receptor gamma in bone marrow stromal cells and favors osteoblastogenesis at the expense of adipogenesis. Endocrinology. (2007) 148:2553–62. doi: 10.1210/en.2006-1704
52. Li X, Ning L, Ma J, Xie Z, Zhao X, Wang G, et al. The PPAR-γ antagonist T007 inhibits RANKL-induced osteoclastogenesis and counteracts OVX-induced bone loss in mice. Cell Commun Signal. (2019) 17:136. doi: 10.1186/s12964-019-0442-3
53. Abrahamsen B, Bonnevie-Nielsen V, Ebbesen EN, Gram J, Beck-Nielsen H. Cytokines and bone loss in a 5-year longitudinal study–hormone replacement therapy suppresses serum soluble interleukin-6 receptor and increases interleukin-1-receptor antagonist: the Danish Osteoporosis Prevention Study. J Bone Miner Res. (2000) 15:1545–54. doi: 10.1359/jbmr.2000.15.8.1545
54. Khosla S. Minireview: the OPG/RANKL/RANK system. Endocrinology. (2001) 142:5050–5. doi: 10.1210/endo.142.12.8536
55. Salminen H, Sääf M, Ringertz H, Strender LE. Bone mineral density measurement in the calcaneus with DXL: comparison with hip and spine measurements in a cross-sectional study of an elderly female population. Osteoporos Int. (2005) 16:541–51. doi: 10.1007/s00198-004-1719-x
56. Nguyen HT, von Schoultz B, Nguyen TV, Thang TX, Chau TT, Duc PT, et al. Sex hormone levels as determinants of bone mineral density and osteoporosis in Vietnamese women and men. J Bone Miner Metab. (2015) 33:658–65. doi: 10.1007/s00774-014-0629-z
57. Yoshimura N, Kinoshita H, Danjoh S, Takijiri T, Morioka S, Kasamatsu T, et al. Bone loss at the lumbar spine and the proximal femur in a rural Japanese community, 1990-2000: the Miyama study. Osteoporos Int. (2002) 13:803–8. doi: 10.1007/s001980200111
58. Nam HS, Kweon SS, Choi JS, Zmuda JM, Leung PC, Lui LY, et al. Racial/ethnic differences in bone mineral density among older women. J Bone Miner Metab. (2013) 31:190–8. doi: 10.1007/s00774-012-0402-0
59. Dolan E, Swinton PA, Sale C, Healy A, O'Reilly J. Influence of adipose tissue mass on bone mass in an overweight or obese population: systematic review and meta-analysis. Nutr Rev. (2017) 75:858–70. doi: 10.1093/nutrit/nux046
60. Palermo A, Tuccinardi D, Defeudis G, Watanabe M, D'Onofrio L, Lauria Pantano A, et al. BMI and BMD: the potential interplay between obesity and bone fragility. Int J Environ Res Public Health. (2016) 13:544. doi: 10.3390/ijerph13060544
61. Kim MS, Kim WJ, Khera AV, Kim JY, Yon DK, Lee SW, et al. Association between adiposity and cardiovascular outcomes: an umbrella review and meta-analysis of observational and Mendelian randomization studies. Eur Heart J. (2021) 42:3388–403. doi: 10.1093/eurheartj/ehab454
62. Scheen AJ, Van Gaal FL. Combating the dual burden: therapeutic targeting of common pathways in obesity and type 2 diabetes. Lancet Diabetes Endocrinol. (2014) 2:911–22. doi: 10.1016/S2213-8587(14)70004-X
63. Cortés VA, Barrera F, Nervi F. Pathophysiological connections between gallstone disease, insulin resistance, and obesity. Obes Rev. (2020) 21:e12983. doi: 10.1111/obr.12983
64. Fabbrini E, Sullivan S, Klein S. Obesity and nonalcoholic fatty liver disease: biochemical, metabolic, clinical implications. Hepatology. (2010) 51:679–89. doi: 10.1002/hep.23280
65. Iyengar NM, Gucalp A, Dannenberg AJ, Hudis CA. Obesity and cancer mechanisms: tumor microenvironment and inflammation. J Clin Oncol. (2016) 34:4270–6. doi: 10.1200/JCO.2016.67.4283
Keywords: Body Mass Index, Bone Mineral Density, femur, lumbar spine, National Health and Nutrition Examination Survey (NHANES)
Citation: Ma M, Feng Z, Liu X, Jia G, Geng B and Xia Y (2021) The Saturation Effect of Body Mass Index on Bone Mineral Density for People Over 50 Years Old: A Cross-Sectional Study of the US Population. Front. Nutr. 8:763677. doi: 10.3389/fnut.2021.763677
Received: 24 August 2021; Accepted: 20 September 2021;
Published: 15 October 2021.
Edited by:
Massimo Lucarini, Council for Agricultural Research and Economics, ItalyReviewed by:
Geng-dong Chen, Foshan Women and Children Hospital, ChinaCopyright © 2021 Ma, Feng, Liu, Jia, Geng and Xia. This is an open-access article distributed under the terms of the Creative Commons Attribution License (CC BY). The use, distribution or reproduction in other forums is permitted, provided the original author(s) and the copyright owner(s) are credited and that the original publication in this journal is cited, in accordance with accepted academic practice. No use, distribution or reproduction is permitted which does not comply with these terms.
*Correspondence: Bin Geng, Y3h4eGZAcXEuY29t; Yayi Xia, eGlheXlAbHp1LmVkdS5jbg==
†These authors have contributed equally to this work
Disclaimer: All claims expressed in this article are solely those of the authors and do not necessarily represent those of their affiliated organizations, or those of the publisher, the editors and the reviewers. Any product that may be evaluated in this article or claim that may be made by its manufacturer is not guaranteed or endorsed by the publisher.
Research integrity at Frontiers
Learn more about the work of our research integrity team to safeguard the quality of each article we publish.