
94% of researchers rate our articles as excellent or good
Learn more about the work of our research integrity team to safeguard the quality of each article we publish.
Find out more
ORIGINAL RESEARCH article
Front. Nutr. , 14 October 2021
Sec. Nutrition and Food Science Technology
Volume 8 - 2021 | https://doi.org/10.3389/fnut.2021.754222
Lactobacillus plantarum ZJUFB2 is a novel probiotic isolate derived from Chinese traditional sourdough that possesses promising probiotics properties. This study aimed to investigate the effects of L. plantarum ZJUFB2 (B2) on insulin sensitivity using mice fed on a high-fat diet (HFD) as well as to explore the involved mechanisms. Purposely, male C57BL/6 mice continuously received an intervention of B2 (~109 CFU/day) for 16 weeks. The results showed that B2 treatment remarkably ameliorated insulin resistance and hyperglycemia in HFD-fed mice. The B2 intervention significantly decreased the hepatic lipid accumulation, serum low-density lipoproteins cholesterol, and lipopolysaccharides, and regulated the bile acids levels as well as liver mRNA expression involved in lipid metabolism. Moreover, the B2 intervention significantly changed the gut microbiota, specifically, showed a lower abundance of obesity-related and inflammation-associated microbes, e.g., Ruminococcus and Mogibacteriaceae. Furthermore, it exhibited a higher abundance of short-chain fatty acids and bile salt hydrolas-producing bacteria, such as Bifidobacterium and F16 compared with the HFD group. The findings of this study suggested that B2 is a novel probiotic, effective in preventing insulin resistance by improving the gut microbiota and bile acids.
• L. plantarum ZJUFB2 alleviated insulin resistance and fat accumulation in the liver.
• B2 significantly altered the gut microbiota and their metabolites, e.g., SCFAs, bile acids.
• Roles of the axis “gut microbiota—bile acids—liver” associated with the B2 were investigated.
Type 2 diabetes mellitus is a public pandemic that remains a challenging health issue of the 21st century which leads to the onset of plenty of health risks and economic burdens (1). The disease owes to the relative lack of insulin mainly caused by insulin resistance (IR) in fuel storage organs, e.g., skeletal muscles, liver, and white adipose tissues (2). Despite increasing knowledge of pathogenesis and management of IR, the global prevalence and incidence of type 2 diabetes mellitus (T2DM) is continuously growing (3). Many studies indicated that systemic inflammation and fat accumulation were the key factors in triggering abnormal cellular responses to insulin, resulting in IR (4, 5). In this regard, regulating the pro-inflammatory cytokines expression and fat accumulation are the challenging concerns in preventing obesity-related inflammation and subsequently insulin sensitivity.
The intestinal ecosystem comprising a complex microbial community. In the case of any imbalance in the gut microbiota, they can affect the normal metabolic pathways which lead to immune dysfunctions (6, 7). It has been reported that gut microorganisms play a crucial role in regulating the host glucose homeostasis (8, 9). Many studies have indicated that intestinal microflora dysbiosis may trigger the onset of diabetes and obesity-related issues (10). In a related study, sterile rodents showed resistance to high-fat diet (HFD) induced obesity, indicating that the gut microbiota may influence the mammalian adiposity through regulation of the metabolic pathways that control the bioenergetics (11). The study of Amar et al. (12) reported that the commensal gut microbiota translocation resulting in the early development of T2DM was associated with an HFD (12). In addition, the change in the intestinal microbiota composition and diversity also contributes to the development of T2DM and obesity. For instance, an increase in the growth of pathogens may cause disruption in the gut barrier which increases gut permeability, resulting in hyperglycemia (IR), inflammation, and obesity-related issues (13). The abundance of certain specific bacteria, such as Oscillospira and Lactococcus, were closely related to the inflammatory cytokines and obesity of the body (14). The level of Bifidobacterium was positively correlated with expanded glucose tolerance and gut barrier in mice (15, 16). Although the mechanism regarding the interaction of the gut microbiota with the host is still not clear, few studies have demonstrated that a liver-bile acids (BAs)-gut microbiome metabolic axis drives significant modifications of BAs and microbiota composition capable of triggering metabolic disorders (17). The small heterodimer partner (SHP), which controls the metabolic pathways, is involved in the glycolipids homeostasis and hepatic BAs production through the transcriptional repression of several other nuclear receptors (18).
Probiotics have been widely used to combat IR since it is an effective and direct intervention for the gut microbiota and BAs production. In recent years, studies demonstrated that Lactobacillus plantarum strains were found effective against diarrhea, irritable bowel syndrome, metabolic syndrome, and especially hyperglycemia (19–21). Recently, clinical trials indicated that L. plantarum intervention prevented/delayed diabetes occurrence by regulating blood glucose, improving insulin sensitivity, and minimizing oxidative stress (22, 23). Therefore, it is hypothesized that L. plantarum (specific strain) may possess antidiabetic potentials and beneficial effects in the management of T2DM.
In this study, a novel isolate L. plantarum ZJUFB2 (B2) derived from sourdough, a Chinese traditional breadmaking starter, which possesses excellent in vitro probiotics properties was evaluated for its anti-diabetic potentials using a mice model, in which IR was induced by HFD. Afterward, HFD-fed C57BL/6 mice were orally administered with B2 for 16 weeks and investigated with the following objectives, including (i) glucose and lipid metabolism profile, (ii) inflammatory cytokines expression, total bile acids, and the intestinal microflora, and (iii) liver mRNA levels involved in glycolipids metabolism.
Lactobacillus plantarum ZJUFB2 (stored at China center for type culture collection, CCTCC M2020126) was screened from Chinese traditional fermented food (sourdough). The B2 tested sample was manufactured according to the reported guidelines (24). The concentration of the lyophilized B2 sample was ~1011 colony forming units per gram (CFU/g).
Male C57BL/6 mice (n = 36) of 6-weeks were acquired from the Shanghai SLAC Laboratory Animal Co., Ltd. (Shanghai, China), housed at 60% relative humidity and 25°C, and provided with free access to water and diet. After a week of acclimatization, the mice were divided into three groups (n = 12, 04/cage). The mice of different groups were given a normal chow diet (NCD, 10% calories from fat, MD17111, Jiangsu Medicine Ltd., Supplementary Table 1), HFD (45% calories from fat, MD12032, Jiangsu Medicine Ltd., Supplementary Table 1), and an oral intervention of 0.2 ml of saline containing ~109 CFU bacteria daily for a period of 16 weeks: (i) NCD group (NCD, saline), (ii) HFD group (HFD, saline), and (iii) B2 group (HFD, B2), respectively. Afterward, mice were fasted up to 12 h and euthanized using pentobarbital sodium (100 mg/kg, i.v.) to collect the samples. Serum samples were obtained by centrifugation of blood (3,000 × g, 15 min). The samples including mice livers, inguinal white adipose tissue (iWAT), epididymal white adipose tissue (eWAT), and brown adipose tissue (BAT) were obtained, weighed, and stored at −80°C.
After a 15-weeks feeding, male C57BL/6 mice were fasted (12 h) followed by an intraperitoneal glucose tolerance test (GTT) was conducted after glucose injection (2 g/kg of the bodyweight). Blood glucose was determined with an interval of 0, 30, 60, 90, and 120 min using a glucometer (Accu-Check glucometer, Roche, Mannheim, Germany). Fasting serum insulin and serum glucose levels were measured by ELISA and glucose oxidase assay kits (Jiyinmei, Wuhan, China, and Jiancheng Bioengineering Institute, Nanjing, China). Furthermore, the insulin resistance in terms of homeostasis model assessment was determined using this equation:
Homeostasis model assessment of insulin resistance (HOMA-IR) = Fasting serum glucose (mM) × Fasting serum insulin (mU/L)/22.5.
The serum biochemical parameters including low-density lipoproteins cholesterol (LDL-C), high-density lipoproteins cholesterol (HDL-C), total cholesterol (T-CHO), triacylglycerols (TG), total bile acids (TBAs), and hepatic glutathione peroxidase enzyme (GSH-Px), total superoxide dismutase enzyme (SOD), and catalase enzyme (CAT) were measured using corresponding kits (mention names) (Jiancheng Bioengineering Institute, Nanjing, China). Lipopolysaccharide (LPS) content was detected by a ToxinSensor Chromogenic Limulus Amebocyte Lysate (LAL) (Endotoxin Assay Kit, GenScript, Piscataway, New Jersey, USA).
Serum lipopolysaccharide-binding protein (LBP), leptin (LEP), adiponectin (ADP), glucagon-like peptide-1 (GLP-1), peptide YY (PYY), hemoglobin A1c (HbA1c), tumor necrosis factor-alpha (TNF-α), interleukin 10 (IL-10), and interleukin 6 (IL-6) levels were determined using commercial ELISA kits (Jiyinmei, Wuhan, China).
The hematoxylin and eosin (HandE) staining procedures and analysis were performed following the procedures of Zhong et al. (25). To determine the size of the adipocytes, 10 different random visual fields were computed for each HandE staining image.
All the reagents for extracting total RNA, synthesizing cDNA, and Quantitative PCR (qPCR) procedures were carried out using commercial kits (Vazyme Corp., Nanjing, China). The PCR program and calculation process were conducted following our previous study (25). The primers of sterol regulatory element-binding protein 1c (SREBP-1c); fatty acid synthase (FAS); peroxisome proliferator-activated receptors (PPARγ and PPARα), cholesterol 7α-hydroxylase (CYP7A1), and SHP used for performing RT-qPCR were listed in Supplementary Table 2.
For gut microbiota analysis, the procedure was carried out according to our study (25). Briefly, fresh fecal samples (ca. 30 mg, n = 8) on 16 weeks were collected and immediately frozen using dry ice and stored at −80°C. Total DNA was extracted from fecal samples using a QIAamp DNA Stool Mini Kit (Qiagen, Venlo, Netherlands) according to the instructions of the manufacturer. The V3-V4 hypervariable regions of bacteria 16S rRNA gene were amplified with primers 338F (5′- ACTCCTACGGGAGGCAGCAG-3′) and 806R (5′-GGACTACHVGGGTWTCTAAT-3′) by thermocycler PCR system (GeneAmp 9700, ABI, USA). Library quality was checked using a Thermo NanoDrop 2000 ultraviolet microspectrophotometer, and 2% agarose gel electrophoresis as well as Qubit for library quantification (Thermo Scientific, USA). Illumina MiSeq platform (Majorbio Bio-pharm Technology Co. Ltd., Shanghai, China) was used to sequence. The analysis protocol was performed following our previous work (25). Sequences with 97% similarity were clustered into operational taxonomic units (OTUs) using UPARSE (V7.0.1001) (http://drive5.com/uparse/). A representative sequence was picked for each OTU and the Greengenes reference database was used to annotate taxonomic information for each representative sequence. The OTU absolute abundance table was extracted from the pipeline and converted to relative abundances by normalizing to total OTU clustering for analyzing the composition of gut microbiota by Quantitative Insights into Microbial Ecology software (QIIME) (http://qiime.org). In order to compare diversity, the OTU table was rarified to calculate the metrics as Chao1, Observed species, and Shannon index. 3D principal coordinate analysis (PCoA) plot was constructed for the evaluation of the dissimilarity and the community composition between samples from weighted UniFrac distances. Linear discriminant analysis (LDA) effect size (LEfSe) was performed to identify the difference between groups. The correlation analysis between the intestinal bacteria and significant biomarkers in mice was calculated by the R software (R version 3.6.3) (Free Software Foundation, USA). Raw Illumina MiSeq reads were publicly accessible in the NCBI Sequence Read Archive (SRA) database with accession number PRJNA723728.
The short-chain fatty acids (SCFAs) analysis was performed following the protocol of our previous study (25). The results of SCFAs were shown in μmol/g of a fecal sample.
The obtained data were analyzed statistically to determine the level of significance using one-way ANOVA along with a post-hoc Tukey's test. The statistical analysis was conducted through SPSS 22 (SPSS Inc., Chicago, IL, USA). GraphPad Prism 6 (GraphPad Software Inc., San Diego, CA, USA) was used to shape the experimental data, and the data shown in the manuscript indicating mean ± SE (n = 8–12). Means with the same letters in a table or a figure differ non-significantly (P > 0.05).
After 8 weeks, the body weight and total body weight gain (TBWG) of HFD and B2 groups were increased significantly (Figures 1A,B) as compared with the NCD group. At the end of the experiment, mice fed on B2 showed a relatively higher percentage of body weight gain compared with the NCD group, but no significant difference was observed in comparison to the HFD group (Figure 1C). However, no significant difference was observed in daily energy intakes among the groups, indicating that an HFD did not change energy intakes (Figure 1D). Similarly, there was no significance found in the weight of liver and fat tissues, and the size of eWAT between HFD and B2 groups (Figures 1E–G). Intriguingly, Figure 1H showed that the number of multi-locular lipid droplets in the livers of the B2 group were lower than in the HFD group. Based on the findings of this study, B2 exhibited strong inhibitory effects on the lipid formation in the liver of HFD-fed mice without disturbing their body weight.
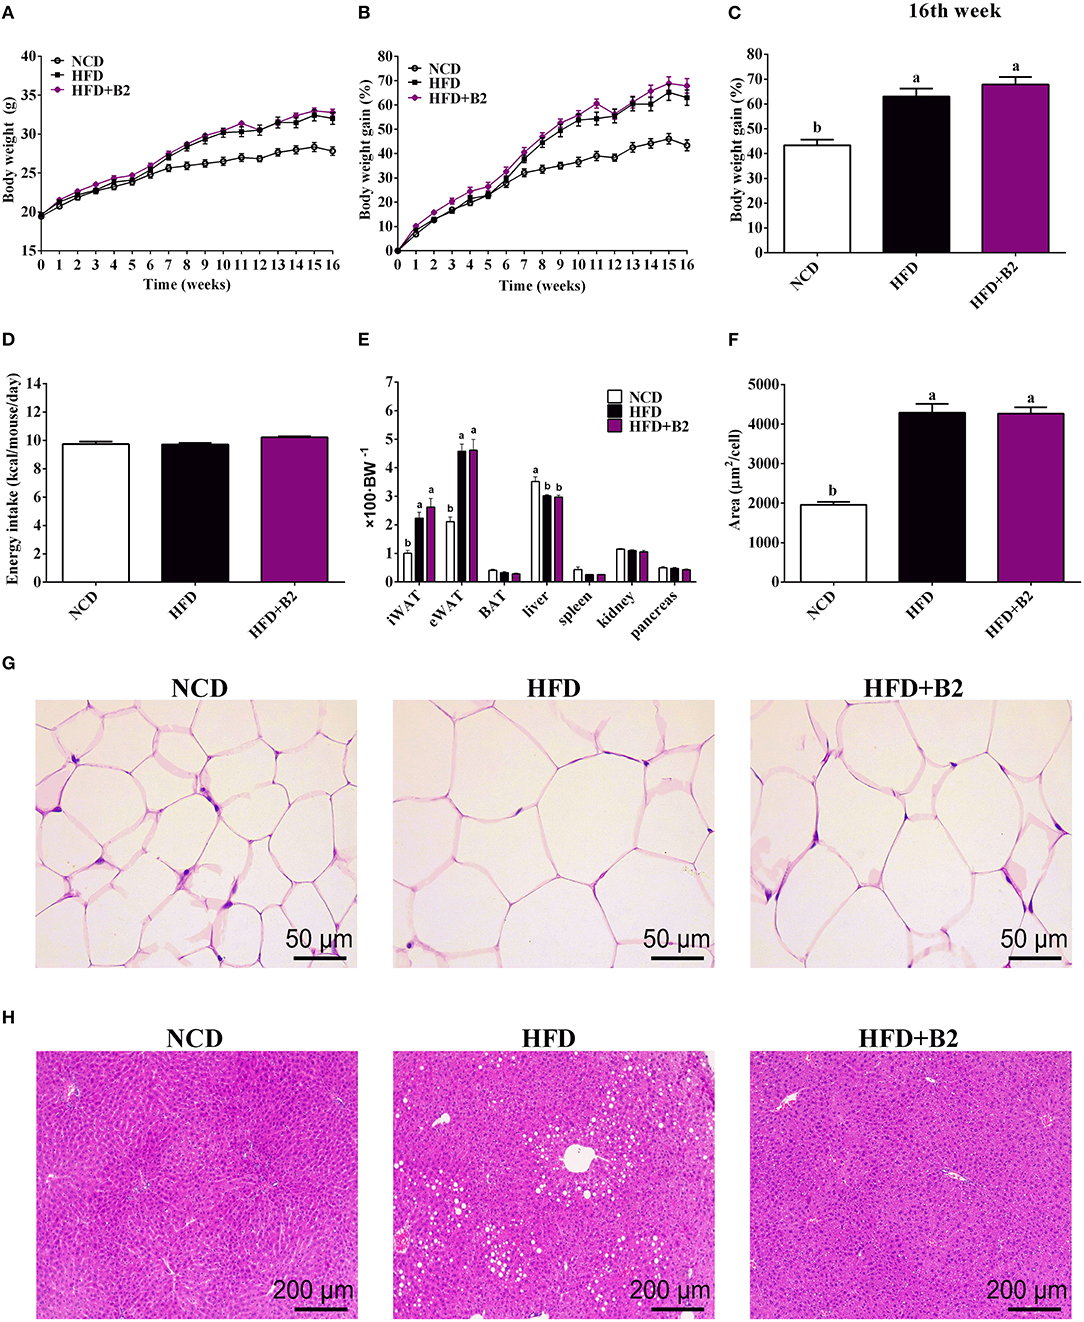
Figure 1. Lactobacillus plantarum ZJUFB2 (B2) administration did not affect the body weight gain and eWAT, but suppressed lipid accumulation of liver in HFD-induced mice. (A) body weight of mice during 16 weeks (n = 12); (B) body weight gain changes (n = 12); (C) weight percentage (n = 12); (D) average daily energy intakes (n = 12); (E) the weight percentage of organs (n = 12); (F) adipocyte size of eWAT (n = 6); (G) HandE staining of eWAT (n = 6); (H) HandE staining of liver tissues (n = 6).
High-fat diet group did not exhibit any effects on the serum TG (Figure 2A), but TCHO contents increased (from 4.16 to 6.4 mmol/L) in HFD-fed mice compared with the NCD group (Figure 2B). However, mice who received B2 intervention exhibited a decline in LDL-C (Figure 2C). Likewise, the B2 group showed a slight increase in the HDL-C in comparison to the NCD group (Figure 2D). In the GTT result, Figure 2E demonstrated that less glucose tolerance was observed in HFD-fed mice. The B2 intervention did not show any improvement in the glucose tolerance in comparison with the HFD group (Figure 2F). An HFD significantly elevated fasting serum glucose in mice but fasting serum insulin and HbA1c of NCD- and HFD-fed mice showed no significant differences (Table 1; Figure 2H). However, the data of HOMA-IR (from 3.25 to 1.74) and serum fasting glucose (from 6.96 to 3.7 mmol/L) showed that B2 intervention significantly decreased insulin resistance and hyperglycemia (Figure 2G; Table 1).
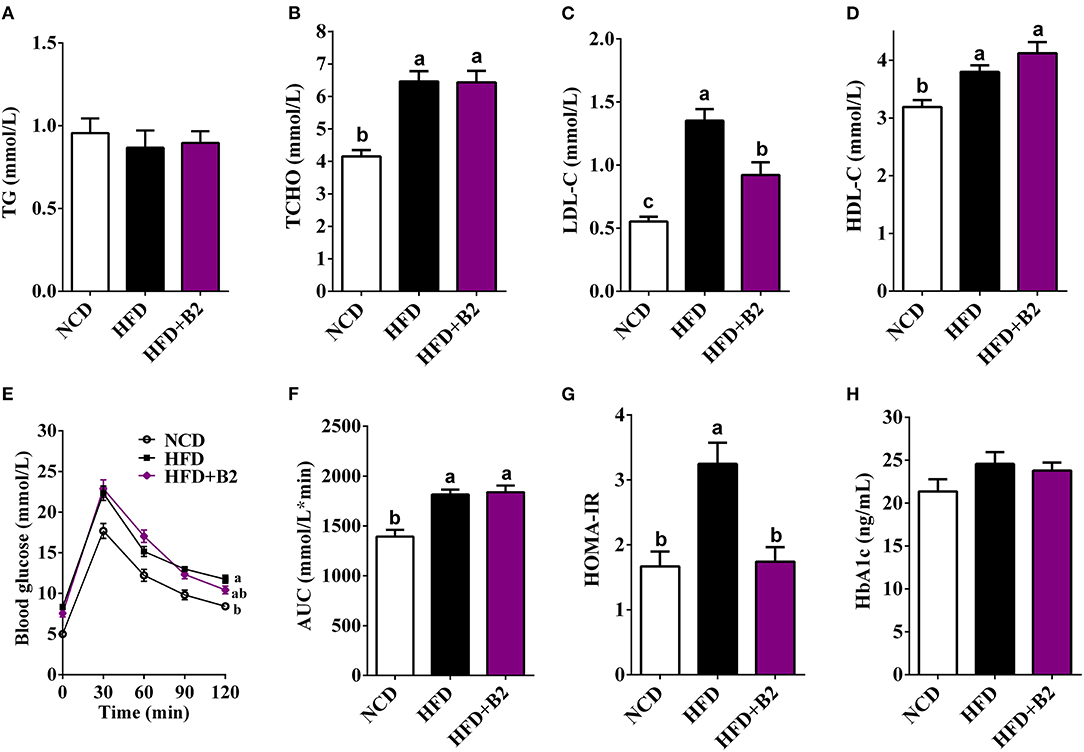
Figure 2. Effects of B2 on serum lipid profiles and glucose homeostasis. (A) TG; (B) TCHO; (C) LDL-C; (D) HDL-C; (E) glucose tolerance test (GTT); (F) area under curve (AUC) from GTT; (G) HOMA-IR; (H) HbA1c. Data were shown as mean ± SE (n = 8).
To evaluate changes in the hormone levels with B2 treatment, the serum LEP, ADP, PYY, and GLP-1 levels were determined. Figures 3A,B, indicate that the mice group fed with B2 showed no significant change in the LEP levels compared with the HFD group, but a decrease was observed in the ADP levels. B2 supplementation in HFD-fed mice significantly increased the serum GLP-1 and PYY levels compared with the NCD and HFD groups (Figures 3C,D). The serum LPS levels in the HFD group were significantly increased compared with the NCD group (Figure 3E). Overall, B2 intervention significantly improved HFD-induced increased levels of LPS and LBP (Figures 4E,F). Although there were some positive modifications in TNF-α, IL-6, and IL-10 levels after B2 administration, but no significant differences were observed (P > 0.05) (Figures 3G–I). Mice fed with B2 exhibited a slightly higher content of IL-10 (Figure 3I) and a lower concentration of IL-6 (Figure 3H) than that of the HFD group. Figures 3J–L showed that there were no significant differences in liver antioxidant enzymes between HFD and B2 groups.
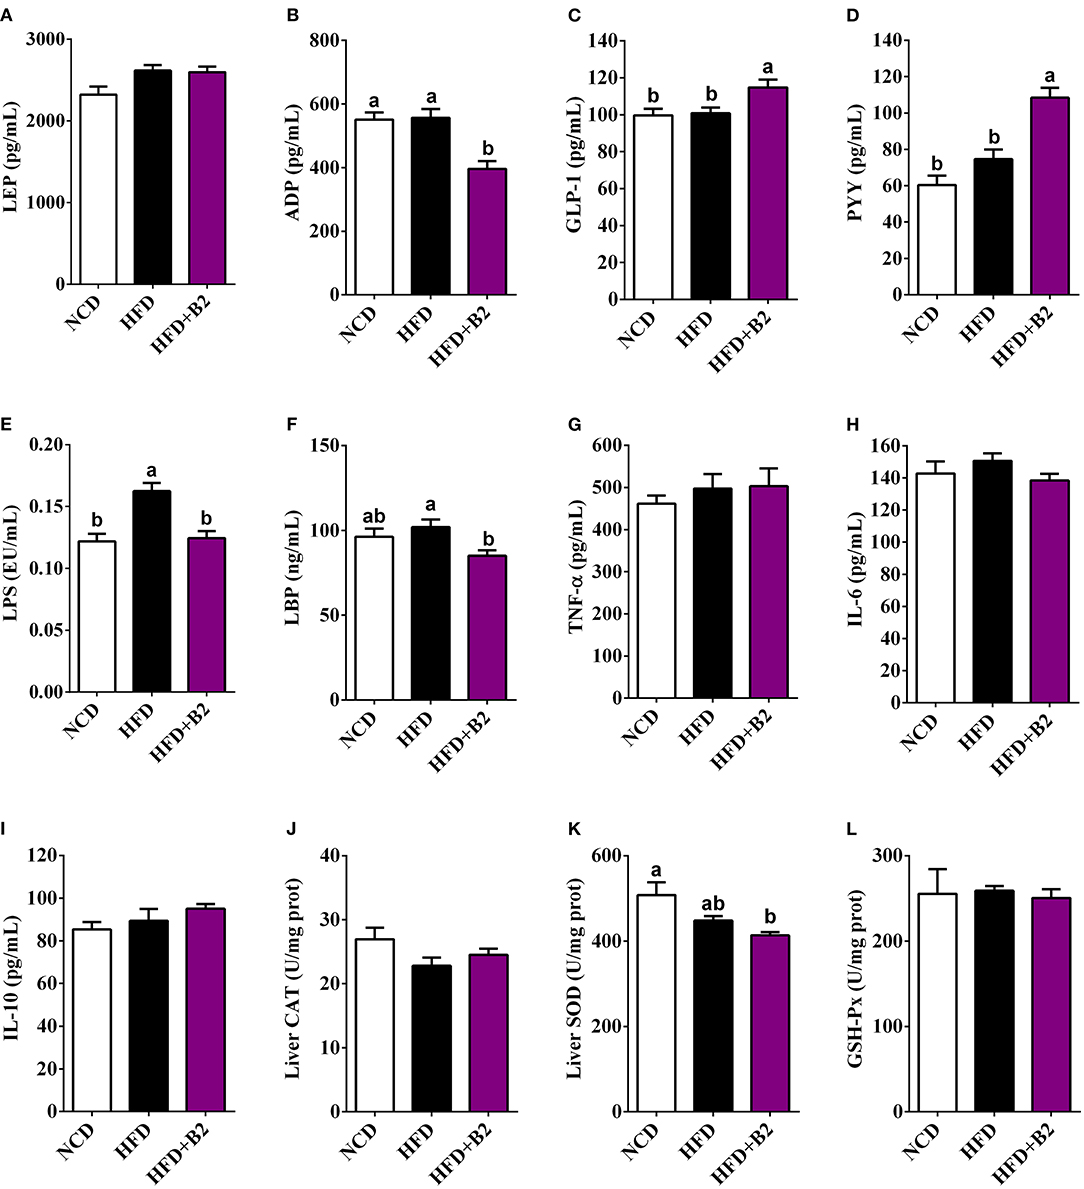
Figure 3. Effects of B2 on serum hormones, cytokines, and liver oxidative stress. (A) LEP; (B) ADP; (C) GLP-1; (D) PYY; (E) LPS; (F) LBP; (G) TNF-α; (H) IL-6; (I) IL-10; (J) liver CAT; (K) liver SOD; (L) liver GSH-Px. Data were shown as mean ± SE (n = 8).
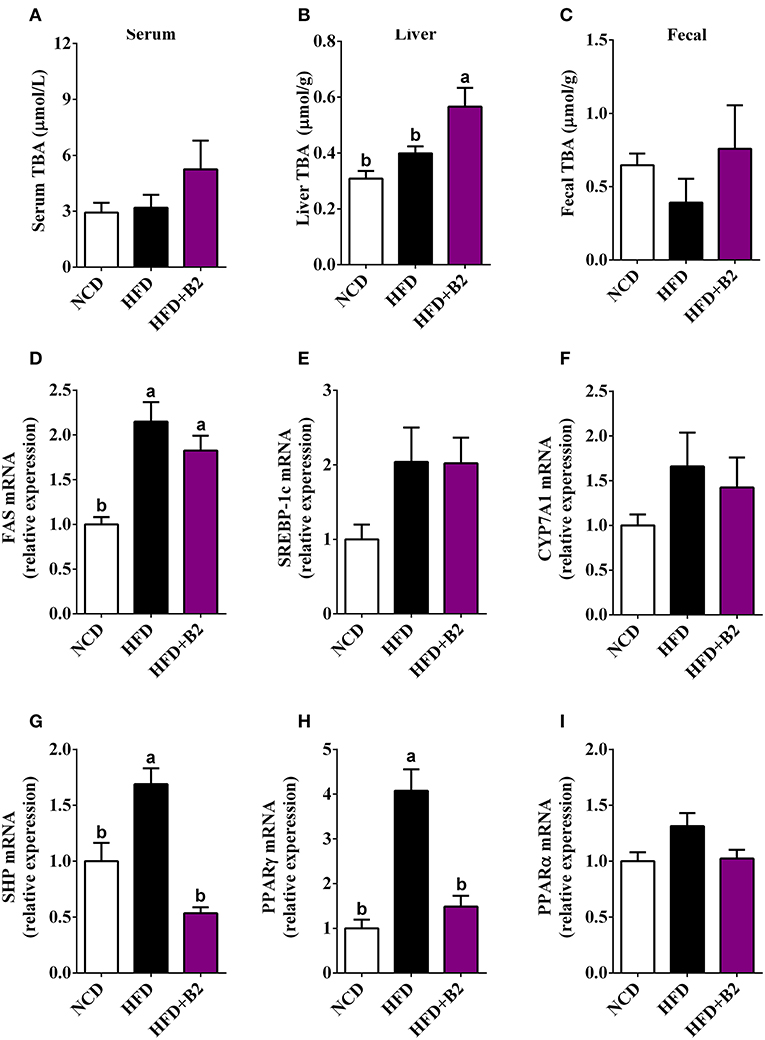
Figure 4. Effects of B2 on total bile acids (TBA) and liver gene expression in HFD-fed mice (n = 8). (A) serum TBA; (B) liver TBA; (C) fecal TBA; (D) relative expression of mRNA of FAS; (E) SREBP-1c; (F) CYP7A1; (G) SHP; (H) PPARγ; (I) PPARα.
To investigate that B2 intervention would alter the gut microbiota and lipid metabolism, the contents of bile acids and lipometabolism-related genes expression levels were determined. The total bile acids data showed a significant increase in the liver tissues with B2 intervention compared with the NCD and HFD groups, while there was a slight increase in fecal and serum samples (Figures 4A–C). The results of RT-qPCR showed that the mRNA expression levels of SREBP-1c, CYP7A1, and PPARα have not been significantly altered after B2 intervention (Figures 4E,F,I). The expressions of the FAS were upregulated in HFD and B2 groups as compared with the NCD group (Figure 4D). The mRNA expression levels of PPARγ and SHP were found lower in the B2 group than HFD group (Figures 4G,H).
The α-diversity (diversity parameter of Sobs and Chao1) of the gut microbiota was significantly decreased in the HFD-fed group compared with the NCD group (Figures 5A,B). However, the results for Simpson and Shannon diversities showed a decrease in the B2 group (Figures 5C,D) compared with the HFD group, indicating that the B2 intervention slightly decreased the gut microbial α-diversity. To investigate the difference in the microbial structure among the different groups, a PCoA was performed to calculate the similarity of community composition (Figure 5E). HFD and B2 groups formed a peculiar composition of microflora independently from the NCD group. Moreover, the B2 group had a separated cluster as compared with the HFD group. Figure 5F showed that the HFD and B2 groups shared 448 and 415 common OTUs with the NCD group, respectively. The classification abundance analysis showed that the HFD group had a higher relative abundance of Firmicutes and a lower Bacteroidetes in comparison with NCD-fed mice. After B2 supplementation, the abundances of Firmicutes and Bacteroidetes showed a decline, and Actinobacteria and Proteobacteria increased compared with the HFD group (P > 0.05, Figure 5G). The results of community abundance on Family level showed that B2 had a lower abundance of Ruminococcaceae (P < 0.05), Lactobacillaceae, Desulfovibrionaceae, Lachnospiraceae, and Mogibacteriaceae (P < 0.05), and a higher abundance of Bifidobacteriaceae, Helicobacteraceae, and Deferribacteraceae in comparison with HFD group (Figure 5H).
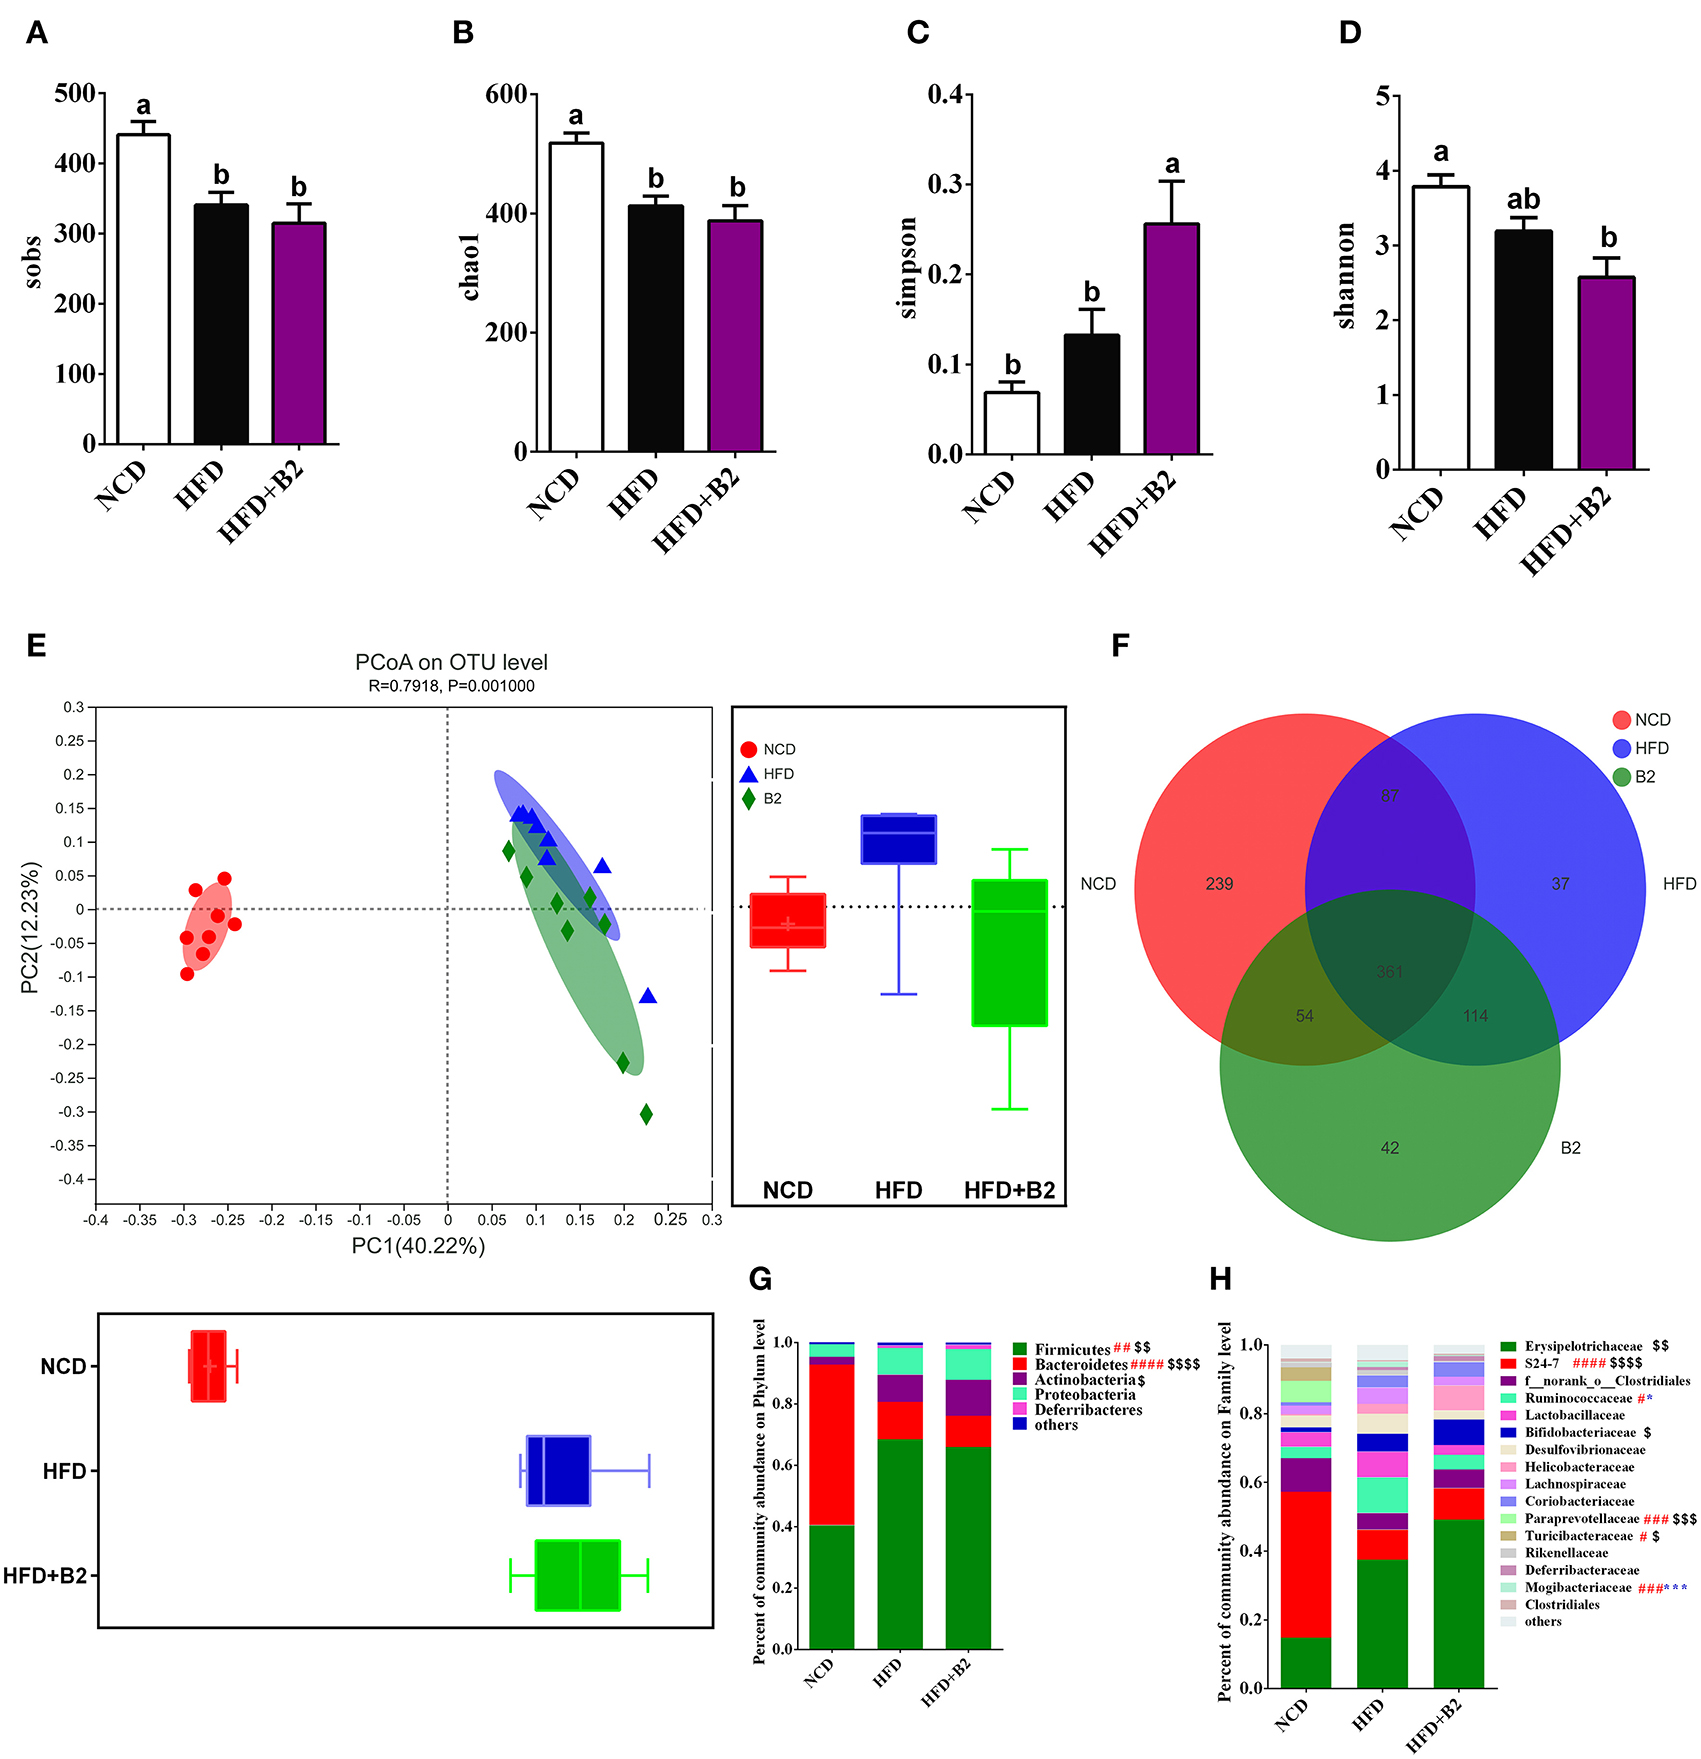
Figure 5. Effects of B2 on diversity of the gut microbiota. (A) Sobs; (B) Chao1; (C) Simpson; (D) Shannon; (E) PCoA plot (weighted UniFrac distances); (F) OTUs Venn Diagram; (G) Phylum level; (H) Family level. #P < 0.05 NCD vs. HFD, $P < 0.05 NCD vs. HFD+B2, and *P < 0.05 HFD vs. HFD+B2 (n = 8).
The gut microbiota of experimental mice was mainly composed of 50 genera (Figure 6A). The consumption of an HFD significantly increased the relative abundance of Allobaculum, Oscillospira, Bifidobacterium, norank_f__Desulfovibrionaceae, unclassified_f__Helicobacteraceae, Ruminococcus, norank_f_Mogibacteriaceae, Mucispirillum, Streptococcus, unclassified_f__Lachnospiraceae, unclassified_f__Ruminococcaceae, Lactococcus, and Dehalobacterium, and significantly decreased the relative abundance of norank_f__S24-7, Prevotella, Turicibacter, Desulfovibrio, Clostridium, unclassified_o__Bacteroidales_c__Bacteroidia, Sutterella, Coprococcus, Adlercreutzia, and norank_o__YS2. To further examine the specific effects of B2 on the gut microbiota in HFD-fed mice, a LEfSe analysis was used to find the distinct bacteria in each group (Figure 6B). Figures 6C–K showed the modifications of the abundance of the characterized genera of bacteria base on the LEfSe report. The predominant genus in the NCD group was g_norank_f__S24-7 and in the HFD-fed mice was Allobaculum (Figures 6C,D). The administration of B2 dramatically decreased the obese-type gut microbiota (Oscillospira, norank_f__Desulfovibrionaceae, Ruminococcus, and norank_f_Mogibacteriaceae) were significantly decreased after B2 intervention (Figures 6E–H), and the alteration in their abundance was in line with the modification in HOMA-IR. The relative abundance of probiotics Bifidobacterium was also explored (Figure 6J). B2 treatment significantly elevated its relative abundance (P < 0.05) in comparison with the HFD group. Moreover, F16, a biomarker in the B2 group, was remarkably increased after probiotic administration (Figure 6I), while Akkermansia was decreased (Figure 6K). Finally, Spearman's correlation analysis was applied to investigate the relationship between the intestinal microflora and biochemical profiles (Figure 6L). Microbes such as F16 and g_norank_f__Lactobacillaceae, were found significantly enriched in the B2 group and were negatively correlated with HOMA-IR and LPS. In contrast, Oscillospira, Lactococcus, and Mucispirillum had positive correlations with LDL-C and LPS.
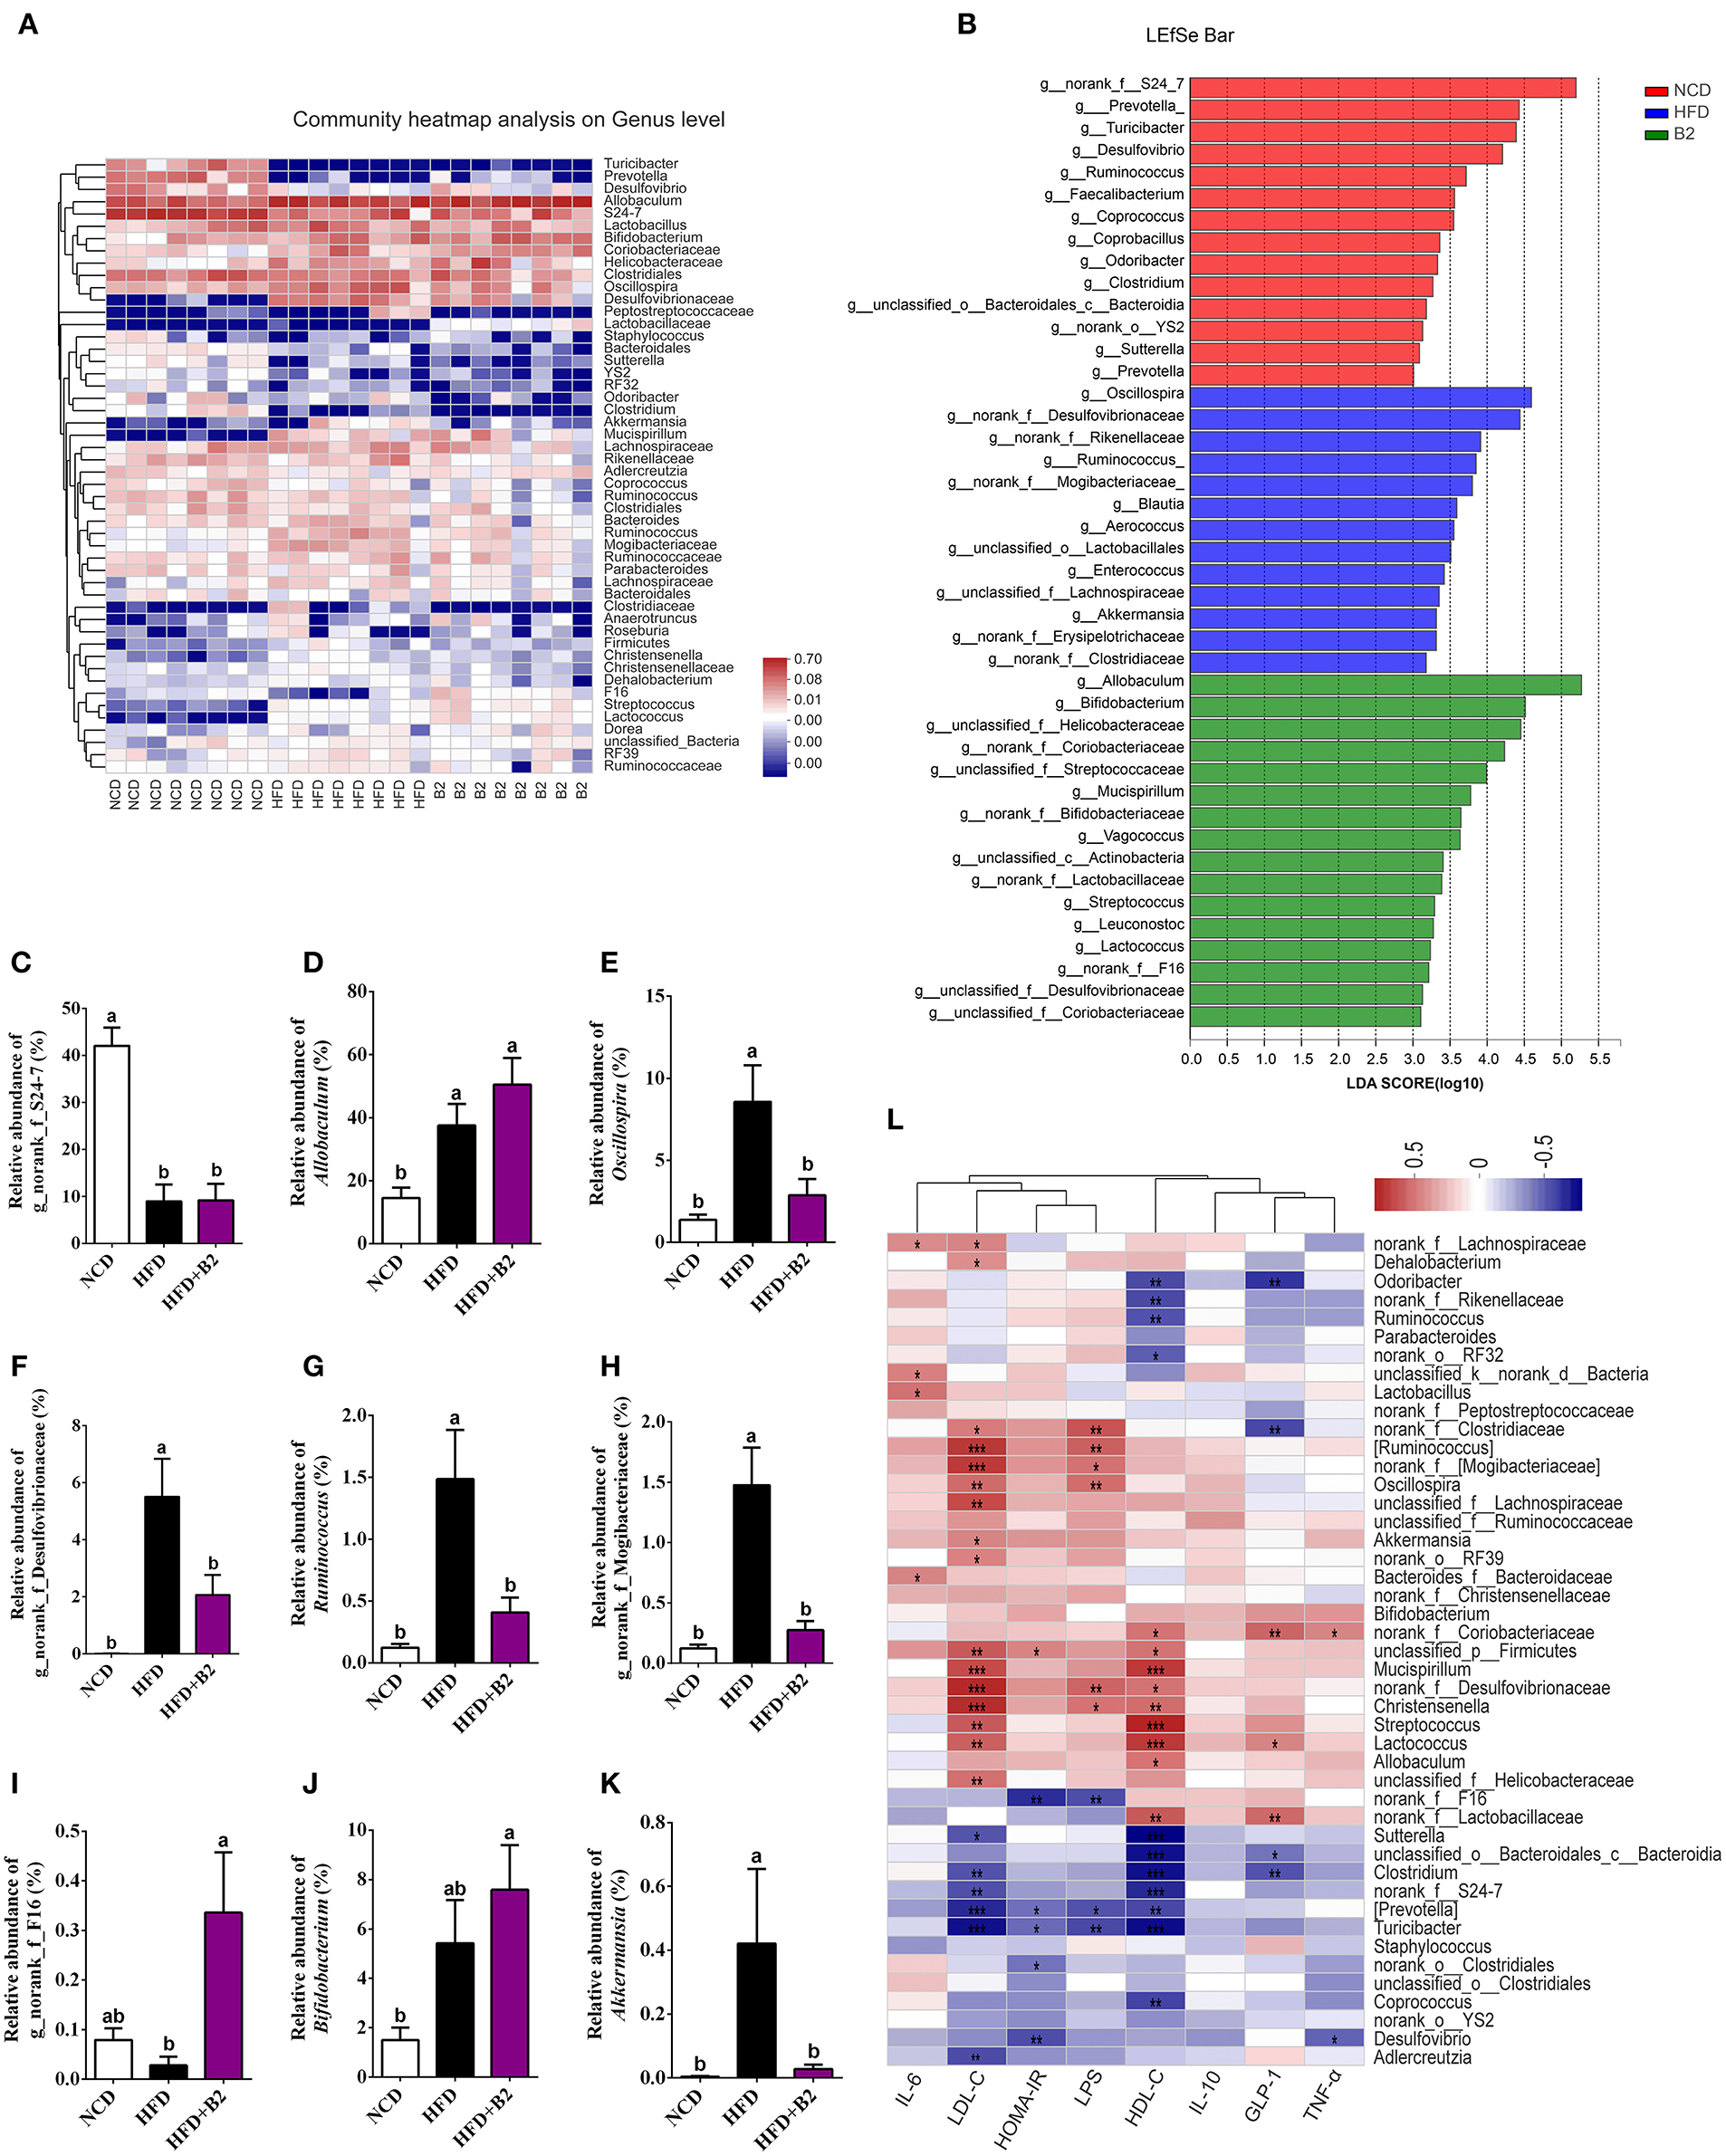
Figure 6. Effects of B2 on the gut bacteria composition. (A) Heatmap analysis on genus level (the relative abundance of OTUs >0.25%); (B) The LEfSe analysis (LDA > 3); (C) The relative abundance of g_norank_f_S24-7; (D) Allobaculum; (E) Oscillospira; (F) g_norank_f_Desulfovibrionaceae; (G) Ruminococcus; (H) g_norank_f_Mogibacteriaceae; (I) g_norank_f_F16; (J) Bifidobacterium; (K) Akkermansia; (L) Correlations between intestinal microflora and biochemical indicators. In (L), P < 0.001 marked with “***”, P < 0.01 marked with “**”, P < 0.05 marked with “*” (n = 8).
Figure 7 shows that B2 intervention significantly increased the total contents of fecal SCFAs as compared with the HFD group (Figure 7H). Specifically, B2 intervention significantly increased the levels of acetate, i-butyrate, and i-valerate in comparison with the HFD group (Figures 7A,C,E). Moreover, the B2 group showed a relatively higher amount of propionate and valerate than the HFD group (Figures 7B,F).
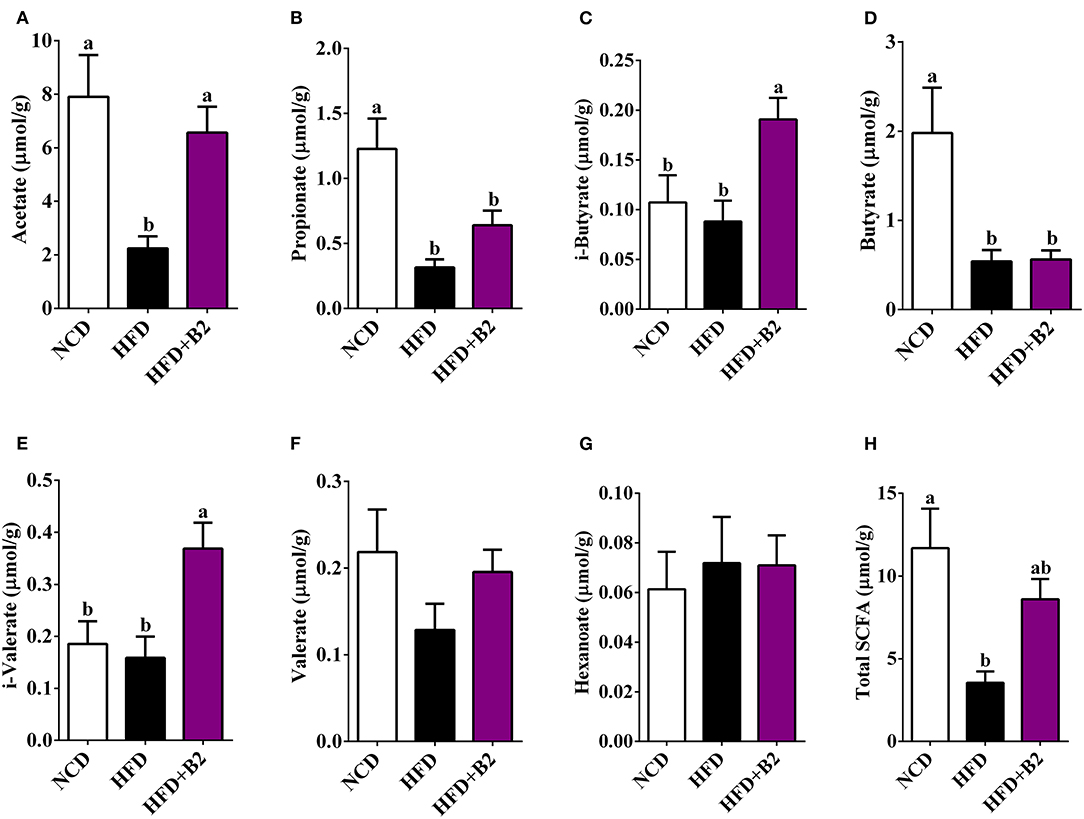
Figure 7. B2 intervention increased caecum content of SCFAs in HFD-fed mice. (A) Acetate; (B) Propionate; (C) i-Butyrate; (D) Butyrate; (E) i-Valerate; (F) Valerate; (G) Hexanoate; (H) Total SCFAs. Data were shown as mean ± SE (n = 8).
Studies have reported the hypoglycemic and weight-reducing potentials of L. plantarum in animal models, whereas the underlying mechanisms have not yet been thoroughly studied. Recently, some studies reported the potentials of the gut microbiota in glycolipids metabolism and related diseases (7, 26). The findings of this study inferred that B2 intervention not only prevented HFD-induced IR but also reduced inflammation by changing the gut microflora. In addition, this green intervention also plays an important role in regulating the genes associated with the glucose and lipid metabolism in the liver. Thus, the gut microbiota and bacteria-related biomarkers of mice fed on B2 were investigated to understand the possible mechanisms of hypoglycemia.
Generally, an HFD triggers the process of visceral fat mass, leading to metabolic dysfunction. In this case, B2 decreased lipid accumulation in the liver but did not impede HFD-induced body weight gain and lipid accumulation in white adipose tissues. Many reports have demonstrated that probiotics may have no potential in preventing obesity, but improving non-alcohol fatty liver disease and hyperlipidemia (27, 28). Similarly, B2 treatment ameliorated the high level of LDL-C in HFD-fed mice. Notably, in this study, B2 prevented hyperglycemia and insulin resistance, probably by improving the gut microbiota and inhibiting LPS synthesis. Therefore, B2 may play an important role in maintaining blood glucose and lipid homeostasis.
In addition, inflammation also plays a negative role in the occurrence and development of hyperglycemia. The increase of plasma LPS induced by an HFD has been found to trigger inflammation and IR (29, 30). In this study, HFD-fed mice exhibited a remarkably higher level of LPS. Correspondingly, the slightly higher serum levels of two pro-inflammatory cytokines (IL-6 and TNF-α) were observed, indicating that an HFD could induce low-grade systemic inflammation. However, B2 intervention significantly reduced the levels of circulating LPS and LBP and decreased the serum IL-6 while increasing IL-10, suggesting that B2 could ameliorate the inflammation in HFD-fed mice. Therefore, the modification of inflammation by B2 may also be responsible for its efficacy in preventing IR.
Insulin resistance is related to the adipocyte hormones (leptin and adiponectin) that mediate insulin-sensitizing effects through the activation of adenosine monophosphate dependent kinase (AMPK), PPARγ, and some other signaling pathways (25). In the present study, B2 intervention decreased the mRNA expression of SHP and PPARγ. It is reported that the overexpression of SHP and PPARγ in HFD-fed mice constrained insulin-stimulated glucose uptake and damaged the insulin signaling pathway (18, 31). Additionally, SHP plays an essential role in the feedback of bile acid biosynthesis (32). Interestingly, B2 treatment increased the hepatic bile acids. B2 may regulate the bile acids resulting in improved insulin sensitivity through SHP and PPARγ pathways.
Obesity and hyperglycemia induced by an HFD were closely associated with the gut microbiota dysbiosis, which has been confirmed in this study. In addition, recent researches have also demonstrated that probiotics intervention exhibited promising roles, such as antiobesity and insulin sensitivity by restoring the balance of the intestine microorganisms in murine models (24, 33). In this study, B2 intervention decreased the α-diversity in comparison with the HFD group, indicating that B2 characteristically altered the gut bacterial community. Gut bacteria-derived bile salt hydrolase (BSH) is a major enzyme that catalyzes the “gateway” reaction in the biotransformation of conjugated BAs to produce deconjugated BAs (34). Furthermore, B2 treatment varied intestinal microflora with an enrichment of the intestine bacteria (health-promoting) with BSH-containing phyla (Firmicutes and Actinobacteria). Additionally, the L. plantarum was only found in HFD+B2 groups (Supplementary Figure 1), which suggested that L. plantarum B2 can be colonized in the gut. Moreover, L. plantarum B2 itself has high BSH activity. BAs are closely correlated to the glycolipids metabolism (35). Thus, B2 may exert its beneficial effects through the modulation of the gut microbiota on BAs.
In line with the previous findings, an HFD can increase the relative abundance of Oscillospira and norank_f_Desulfovibrionaceae in feces (36, 37). The B2 intervention significantly overturned the increased Oscillospira and norank_f_Desulfovibrionaceae, which were found to be more abundant in hyperglycemic and hyperlipidemic individuals in comparison with normal subjects (37, 38). F16 was also identified as novel superior microbiota in probiotics intervention groups, which was consistent with a previous study (39). Based on LEfSe analysis, the genera Oscillospira, Lactococcus, and Mucispirillum, which were the characteristic flora of the HFD group, were found to be positively correlated to the LPS, suggesting that these bacteria may play a pro-inflammatory role in the development of obesity and IR (37, 40). It was also speculated whether the disorder of glycolipid metabolism could be modified by the beneficial gut microbes by preventing inflammation. One reason may be that helpful microbes could promote the bioconversion of fermentable carbohydrates into SCFAs (41). In this case, the SCFAs-producing bacteria (Bifidobacteriaceae and Helicobacteraceae) were increased in the B2 group. Consequently, mice fed on B2 produced more SCFAs, especially acetate. A study demonstrated that SCFAs largely ameliorated the glucose metabolism and IR disorders by reducing the production of LPS (42). These findings referred that B2 was a potent alternative in improving the beneficial gut bacteria in HFD-fed mice. Conclusively, B2 intervention could possibly provide a robust modulation of the gut microbiota, which possesses a promising antidiabetic potential.
Study findings revealed that B2 intervention showed promising potential in preventing HFD-induced insulin resistance was associated with the improvement of the gut microbiota and inhibition of LPS synthesis. B2 intervention significantly increased fecal BA excretion by increasing BSH comprising gut bacteria. Moreover, B2 intervention also promoted fecal SCFAs production. Based on the study findings, it is suggested that B2 intervention possibly used in preventing/improving hyperglycemia linked with alteration of the gut microbiota and their metabolites, including BAs and SCFAs. However, antidiabetic roles of the axis “gut microbiota - bile acids - liver” of B2 intervention in HFD-fed mice need to be confirmed by further investigations.
The datasets presented in this study can be found in online repositories. The names of the repository/repositories and accession number(s) can be found in the article/Supplementary Material.
The animal study was reviewed and approved by Animal Ethical Committee of Zhejiang Chinese Medical University (approval no. ZSLL-2019-10947).
FF and RG conceived and designed research. HZ conducted experiments. JW and HZ contributed new reagents or analytical tools. HZ and FF analyzed data. HZ and A wrote the manuscript. A, MH, FF, and RG reviewed and edited the manuscript. All authors have read and approved the manuscript.
This research was supported by Zhejiang Provincial Key Research and Development Program (Grant No. 2021C04032).
The authors declare that the research was conducted in the absence of any commercial or financial relationships that could be construed as a potential conflict of interest.
All claims expressed in this article are solely those of the authors and do not necessarily represent those of their affiliated organizations, or those of the publisher, the editors and the reviewers. Any product that may be evaluated in this article, or claim that may be made by its manufacturer, is not guaranteed or endorsed by the publisher.
Special thanks to Yangjie Yang, Jinyuan Shi, and Minjie Zhao for reviewing English language usage.
The Supplementary Material for this article can be found online at: https://www.frontiersin.org/articles/10.3389/fnut.2021.754222/full#supplementary-material
1. Zheng Y, Ley SH, Hu FB. Global aetiology and epidemiology of type 2 diabetes mellitus and its complications. Nat Rev Endocrinol. (2018) 14:88–98. doi: 10.1038/nrendo.2017.151
2. Czech MP. Insulin action and resistance in obesity and type 2 diabetes. Nat Med. (2017) 23:804–14. doi: 10.1038/nm.4350
3. Chatterjee S, Khunti K, Davies MJ. Type 2 diabetes. Lancet. (2017) 389:2239–51. doi: 10.1016/S0140-6736(17)30058-2
4. Mazidi M, Kengne AP, Katsiki N, Mikhailidis DP, Banach M. Lipid accumulation product and triglycerides/glucose index are useful predictors of insulin resistance. J Diabetes Complicat. (2018) 32:266–70. doi: 10.1016/j.jdiacomp.2017.10.007
5. Posey KA, Clegg DJ, Printz RL, Byun J, Morton GJ, Vivekanandan-Giri A, et al. Hypothalamic proinflammatory lipid accumulation, inflammation, and insulin resistance in rats fed a high-fat diet. Am J Physiol-Endoc M. (2009) 296:E1003–12. doi: 10.1152/ajpendo.90377.2008
6. Cerf-Bensussan N, Gaboriau-Routhiau V. The immune system and the gut microbiota: friends or foes? Nat Rev Immunol. (2010) 10:735–44. doi: 10.1038/nri2850
7. Lozupone CA, Stombaugh JI, Gordon JI, Jansson JK, Knight R. Diversity, stability and resilience of the human gut microbiota. Nature. (2012) 489:220–30. doi: 10.1038/nature11550
8. Chen X, Eslamfam S, Fang L, Qiao S, Ma X. Maintenance of gastrointestinal glucose homeostasis by the gut-brain axis. Curr Protein Pept Sc. (2017) 18:541–7. doi: 10.2174/1389203717666160627083604
9. Greiner T, Bäckhed F. Effects of the gut microbiota on obesity and glucose homeostasis. Trends Endocrin Met. (2011) 22:117–23. doi: 10.1016/j.tem.2011.01.002
10. Li X, Watanabe K, Kimura I. Gut microbiota dysbiosis drives and implies novel therapeutic strategies for diabetes mellitus and related metabolic diseases. Front Immunol. (2017) 8:1882. doi: 10.3389/fimmu.2017.01882
11. Bäckhed F, Manchester JK, Semenkovich CF, Gordon JI. Mechanisms underlying the resistance to diet-induced obesity in germ-free mice. Proc Natl Acad Sci USA. (2007) 104:979–84. doi: 10.1073/pnas.0605374104
12. Amar J, Chabo C, Waget A, Klopp P, Vachoux C, Bermúdez-Humarán LG, et al. Intestinal mucosal adherence and translocation of commensal bacteria at the early onset of type 2 diabetes: molecular mechanisms and probiotic treatment. EMBO Mol Med. (2011) 3:559–72. doi: 10.1002/emmm.201100159
13. Saad M, Santos A, Prada P. Linking gut microbiota and inflammation to obesity and insulin resistance. Physiology. (2016) 31:283–93. doi: 10.1152/physiol.00041.2015
14. Ding Y, Song Z, Li H, Chang L, Pan T, Gu X, et al. Honokiol ameliorates high-fat diet-induced obesity of different sexes mice by modulating the composition of the gut microbiota. Front Immunol. (2019) 10:2800. doi: 10.3389/fimmu.2019.02800
15. Cani PD, Possemiers S, Van de Wiele T, Guiot Y, Everard A, Rottier O, et al. Changes in gut microbiota control inflammation in obese mice through a mechanism involving GLP-2-driven improvement of gut permeability. Gut. (2009) 58:1091–103. doi: 10.1136/gut.2008.165886
16. Sedighi M, Razavi S, Navab-Moghadam F, Khamseh ME, Alaei-Shahmiri F, Mehrtash A, et al. Comparison of gut microbiota in adult patients with type 2 diabetes and healthy individuals. Microb Pathogenesis. (2017) 111:362–9. doi: 10.1016/j.micpath.2017.08.038
17. Zheng X, Huang F, Zhao A, Lei S, Zhang Y, Xie G, et al. Bile acid is a significant host factor shaping the gut microbiome of diet-induced obese mice. BMC Biol. (2017) 15:1–15. doi: 10.1186/s12915-017-0462-7
18. Tabbi-Anneni I, Cooksey R, Gunda V, Liu S, Mueller A, Song G, et al. Overexpression of nuclear receptor SHP in adipose tissues affects diet-induced obesity and adaptive thermogenesis. Am J Physiol-Endoc M. (2010) 298:E961–70. doi: 10.1152/ajpendo.00655.2009
19. Ducrotté P, Sawant P, Jayanthi V. Clinical trial: Lactobacillus plantarum 299v (DSM 9843) improves symptoms of irritable bowel syndrome. World J Gastroentero. (2012) 18:4012–8. doi: 10.3748/wjg.v18.i30.4012
20. Meng X, Qian Y, Jiang LS, Kang JM, Chen Y, Wang J, et al. Effects of Lactobacillus plantarum SCS2 on blood glucose level in hyperglycemia mice model. Appl Biol Chem. (2016) 59:143–50. doi: 10.1007/s13765-015-0135-6
21. Yang K, Jiang Z, Zheng C, Wang L, Yang X. Effect of Lactobacillus plantarum on diarrhea and intestinal barrier function of young piglets challenged with enterotoxigenic Escherichia coli K88. J Anim Sci. (2014) 92:1496–503. doi: 10.2527/jas.2013-6619
22. Lee E, Jung SR, Lee SY, Lee NK, Paik HD, Lim SI. Lactobacillus plantarum strain Ln4 attenuates diet-induced obesity, insulin resistance, and changes in hepatic mRNA levels associated with glucose and lipid metabolism. Nutrients. (2018) 10:643. doi: 10.3390/nu10050643
23. Toshimitsu T, Gotou A, Furuichi K, Hachimura S, Asami Y. Effects of 12-wk Lactobacillus plantarum OLL2712 treatment on glucose metabolism and chronic inflammation in prediabetic individuals: A single-arm pilot study. Nutrition. (2019) 58:175–80. doi: 10.1016/j.nut.2018.07.116
24. Liu T, Li Y, Zhao M, Mo Q, Feng F. Weight-reducing effect of Lactobacillus plantarum ZJUFT17 isolated from sourdough ecosystem. Nutrients. (2020) 12:977. doi: 10.3390/nu12040977
25. Zhong H, Abdullah A, Deng L, Zhao M, Tang J, Liu T, et al. Probiotics-fermented blueberry juice prevents obesity and hyperglycemia in high fat diet-fed mice in association with modulating the gut microbiota. Food Func. (2020) 11:9192–207. doi: 10.1039/d0fo00334d
26. Fan Y, Pedersen O. Gut microbiota in human metabolic health and disease. Nat Rev Microbiol. (2020) 19, 55–71. doi: 10.1038/s41579-020-0433-9
27. Crovesy L, Ostrowski M, Ferreira D, Rosado E, Soares-Mota M. Effect of Lactobacillus on body weight and body fat in overweight subjects: a systematic review of randomized controlled clinical trials. Int J Obesity. (2017) 41:1607–14. doi: 10.1038/ijo.2017.161
28. Kim B, Park KY, Ji Y, Park S, Holzapfel W, Hyun CK. Protective effects of Lactobacillus rhamnosus GG against dyslipidemia in high-fat diet-induced obese mice. Biochem Bioph Res Co. (2016) 473:530–6. doi: 10.1016/j.bbrc.2016.03.107
29. Moreno-Navarrete J, Ortega F, Serino M, Luche E, Waget A, Pardo G, et al. Circulating lipopolysaccharide-binding protein (LBP) as a marker of obesity-related insulin resistance. Int J Obesity. (2012) 36:1442–9. doi: 10.1038/ijo.2011.256
30. Ni Y, Ni L, Zhuge F, Xu L, Fu Z, Ota T. Adipose tissue macrophage phenotypes and characteristics: the key to insulin resistance in obesity and metabolic disorders. Obesity. (2020) 28:225–34. doi: 10.1002/oby.22674
31. Lee JB, Yoon SJ, Lee SH, Lee MS, Jung H, Kim TD, et al. Ginsenoside Rg3 ameliorated HFD-induced hepatic steatosis through downregulation of STAT5-PPARγ. J Endocrinol. (2017) 235:223–35. doi: 10.1530/JOE-17-0233
32. Kim KH, Choi S, Zhou Y, Kim EY, Lee JM, Saha PK, et al. Hepatic FXR/SHP axis modulates systemic glucose and fatty acid homeostasis in aged mice. Hepatology. (2017) 66:498–509. doi: 10.1002/hep.29199
33. Chen M, Guo WL, Li QY, Xu JX, Cao YJ, Liu B, et al. The protective mechanism of Lactobacillus plantarum FZU3013 against non-alcoholic fatty liver associated with hyperlipidemia in mice fed a high-fat diet. Food Funct. (2020) 11:3316–31. doi: 10.1039/c9fo03003d
34. Liu Y, Chen K, Li F, Gu Z, Liu Q, He L, et al. Probiotic Lactobacillus rhamnosus GG prevents liver fibrosis through inhibiting hepatic bile acid synthesis and enhancing bile acid excretion in mice. Hepatology. (2020) 71:2050–66. doi: 10.1002/hep.30975
35. Zhang H, Zhang W, Yun D, Li L, Zhao W, Li Y, et al. Alternate-day fasting alleviates diabetes-induced glycolipid metabolism disorders: Roles of FGF21 and bile acids. J Nutr Biochem. (2020) 83:108403. doi: 10.1016/j.jnutbio.2020.108403
36. Ji Y, Park S, Park H, Hwang E, Shin H, Pot B, et al. Modulation of active gut microbiota by Lactobacillus rhamnosus GG in a diet induced obesity murine model. Front Microbiol. (2018) 9:710. doi: 10.3389/fmicb.2018.00710
37. Zhao L, Zhang Q, Ma W, Tian F, Shen H, Zhou M. A combination of quercetin and resveratrol reduces obesity in high-fat diet-fed rats by modulation of gut microbiota. Food Func. (2017) 8:4644–56. doi: 10.1039/c7fo01383c
38. Liu F, Ling Z, Xiao Y, Yang Q, Wang B, Zheng L, et al. Alterations of urinary microbiota in type 2 diabetes mellitus with hypertension and/or hyperlipidemia. Front Physiol. (2017) 8:126. doi: 10.3389/fphys.2017.00126
39. Wang Y, Wu Y, Wang B, Xu H, Mei X, Xu X, et al. Bacillus amyloliquefaciens SC06 protects mice against high-fat diet-induced obesity and liver injury via regulating host metabolism and gut microbiota. Front Microbiol. (2019) 10:1161. doi: 10.3389/fmicb.2019.01161
40. Li L, Li R, Zhu R, Chen B, Tian Y, Zhang H, et al. Salvianolic acid B prevents body weight gain and regulates gut microbiota and LPS/TLR4 signaling pathway in high-fat diet-induced obese mice. Food Func. (2020) 11, 8743–56. doi: 10.1039/d0fo01116a
41. Trompette A, Gollwitzer ES, Yadava K, Sichelstiel AK, Sprenger N, Ngom-Bru C, et al. Gut microbiota metabolism of dietary fiber influences allergic airway disease and hematopoiesis. Nat Med. (2014) 20:159–66. doi: 10.1038/nm.3444
Keywords: Lactobacillus plantarum, metabolic syndrome, insulin resistance, gut microbiota, bile acids
Citation: Zhong H, Wang J, Abdullah, Hafeez MA, Guan R and Feng F (2021) Lactobacillus plantarum ZJUFB2 Prevents High Fat Diet-Induced Insulin Resistance in Association With Modulation of the Gut Microbiota. Front. Nutr. 8:754222. doi: 10.3389/fnut.2021.754222
Received: 06 August 2021; Accepted: 14 September 2021;
Published: 14 October 2021.
Edited by:
Alberto Valdés, Consejo Superior de Investigaciones Científicas (CSIC), SpainReviewed by:
Julio Plaza-Diaz, Children's Hospital of Eastern Ontario (CHEO), CanadaCopyright © 2021 Zhong, Wang, Abdullah, Hafeez, Guan and Feng. This is an open-access article distributed under the terms of the Creative Commons Attribution License (CC BY). The use, distribution or reproduction in other forums is permitted, provided the original author(s) and the copyright owner(s) are credited and that the original publication in this journal is cited, in accordance with accepted academic practice. No use, distribution or reproduction is permitted which does not comply with these terms.
*Correspondence: Rongfa Guan, cmZndWFuQDE2My5jb20=; Fengqin Feng, ZmVuZ19mZW5ncWluQGhvdG1haWwuY29t
Disclaimer: All claims expressed in this article are solely those of the authors and do not necessarily represent those of their affiliated organizations, or those of the publisher, the editors and the reviewers. Any product that may be evaluated in this article or claim that may be made by its manufacturer is not guaranteed or endorsed by the publisher.
Research integrity at Frontiers

Learn more about the work of our research integrity team to safeguard the quality of each article we publish.