 Ying-Jie Yu
 Sheng-Ping Yang
 Ting Lin1
 Yun-Fang Qian
 Jing Xie
- 1College of Food Science and Technology, Shanghai Ocean University, Shanghai, China
- 2Shanghai Engineering Research Center of Aquatic Product Processing and Preservation, Shanghai, China
- 3National Experimental Teaching Demonstration Center for Food Science and Engineering (Shanghai Ocean University), Shanghai, China
- 4Shanghai Professional Technology Service Platform on Cold Chain Equipment Performance and Energy Saving Evaluation, Shanghai, China
- 5Nanjing Weigang Dairy Co., Ltd, Nanjing, China
Lipid oxidation and water migration are important factors in the quality changes of aquatic products. This study investigated the relationship between water migration and lipid oxidation in salmon filets under four different storage conditions (control: 0°C; T1: 4°C; T2 and T3: two temperature fluctuation groups) by detecting thiobarbituric acid–reactive substances, changes of fatty acids, and volatile organic compounds (VOCs), and other quality indicators including redness, microorganism, total volatile basic nitrogen (TVB-N), and water-holding capacity (WHC) were also measured. The results of low-field nuclear magnetic resonance (LF-NMR) showed that more trapped water (T22) turned to form free water (T23) in groups suffering temperature fluctuations. A more significant decrease in fatty acids was found in T2 and T1 groups, especially oleic acid (C18:1n9c), linoleic acid (C18:2n6c), and palmitic acid (C16:0). The VOCs with off-flavors (1-penten-3-ol, 2-penten-1-ol, (Z)-, 1-octen-3-ol, hexanal) in the groups suffered from simulated cold chain interruptions increased faster than the other two groups during storage. T22 was negatively correlated (p < 0.05) with stearic acid (C18:0), 1-penten-3-ol, hexanal, and nonanal, whereas T23 was positively correlated with 1-penten-3-ol, hexanal, and heptanal. Therefore, the temperature fluctuation accelerated the loss of polyunsaturated fatty acids and the increase of unpleasant odors related to water migration.
Introduction
Temperature is considered to be the most important environmental factor that inhibits the microbiological growth and thus influences the shelf life of fresh fish (1). However, it is very difficult to keep the temperature constant during the actual cold chain transportation, especially when loading and unloading. In recent years, more and more scientists have paid attention to the effect of temperature fluctuation on the quality of aquatic products. Several storage trials at fluctuating temperature conditions on quality changes of fishery products have been conducted in recent years (2–4).
Salmon (Salmon salar) belongs to the family Salmonidae and is a high quality of considerable nutritional and economic importance because of its high content of polyunsaturated fatty acids (PUFAs), including eicosapentaenoic acid (EPA) and docosahexaenoic acid (DHA) (5, 6). However, salmon is highly perishable during transportation and storage, which are contributed not only by the growth of microorganisms and protein degradation, but also by lipid oxidation (7). Lipid oxidation in seafood may result in the production of volatile oxidation products, which will affect its odor, flavor, appearance, texture, and even the nutrients and the shelf life (8). Our previous study also found that salmon was rich in lipid; lipid oxidation not only affected the odor, but also affected the color appearance (9). Lipid oxidation in seafood is usually triggered by enzymes such as lipase, lipoxygenase, cycloxygenase, etc., which needs water as a medium. Unfortunately, water is the most abundant component in tissues of seafood. Although most water is trapped in muscle in fresh seafood, it may migrate because of the degradation of the cell membrane and myofibrillar proteins, leading to the spread of soluble enzymes (10). It is hypothesized that water migration may be correlated with the lipid oxidation and production of volatile organic compounds (VOCs).
Therefore, this article mainly studies the changes of water migration, lipid oxidation, and VOCs caused by temperature fluctuations in salmon during simulated cold chain logistics, as well as the growth of microorganisms, and their correlations were analyzed, so as to demonstrate the relationship between water migration, lipid oxidation, and off-odors.
Materials and Methods
Sample Preparation
The fish in this study were fresh farmed Atlantic salmon (each gutted weighed about 5 kg) were purchased from an aquatic products market (Pudong District, Shanghai, China). The salmon samples were gutted after being caught in the local farms (brand: Super Salmon) and transported immediately in a closed box with ice to Shanghai by air within 3 days. On arrival, all the samples were transferred immediately to the laboratory. After washing with distilled water, the fish was cut into pieces of about 200 g and put them in polyethylene bags (Fanren Packaging Co., Ltd., Foshan, China). The samples were randomly divided into four groups and stored under four simulated logistics conditions for 8 days as shown in Figure 1. Sampling is performed daily. The sampling was carried out every day.
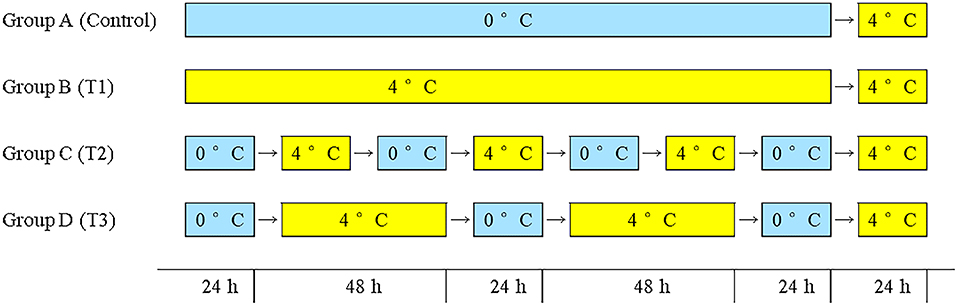
Figure 1. Group A: 0°C constant (control group), group B: 4°C constant (T1 group), group C: seven shifts for 24 h from 0 to 4°C (T2 group), group D: five shifts for 0°C 24 h and 4°C 48 h (T3 group).
Sensory Evaluation
Ten persons from the laboratory staff were asked to assess the sensory evaluation of salmon. The total scores of five attributes include color, odor, tissue morphology, elasticity, and mucus, and the quality of the samples based on 5-point hedonic scales in descending order from 5 to 1 (9). The average of the total score of the five attributes is considered the final result, and a total score of lower than two is considered an unacceptable threshold.
Determination of Redness Value
The redness value (a*) of salmon was recorded by a portable colorimeter (CR-400; Konica, Tokyo, Japan). Each batch was conducted in triplicate.
Microbiological Analyses
Quantitative microbiological analysis was determined according to the method of Xie et al. (11). At each sampling, salmon filet samples (25 g) were homogenized with 225 mL of sterilized saline water (0.85 g/100 mL). One milliliter of these 10-fold dilutions by sterilized saline water was mixed with 15–20 mL of iron agar (no. HB8735; Qingdao Hope Biol-Technology Co., Ltd., Qingdao, PR China). Total mesophilic bacterial counts and psychrotrophic bacterial counts were determined by counting the total colonies on the plate after incubating at 30°C for 48 h and at 4°C for 10 days, respectively. For H2S-producing bacteria, the black colonies were counted after 72 h of incubation at 25°C. Each dilution was performed in three parallels.
Determination of Total Volatile Basic Nitrogen and Thiobarbituric Acid–Reactive Substances
The total volatile basic nitrogen (TVB-N) value was determined according to the method of FOSS (12) by using an Automatic Kjeldahl Apparatus (Kjeltec Analyzer Unit; Foss Tecator AB, Hoganas, Sweden).
The thiobarbituric acid–reactive substances (TBARS) were determined according to the method of Ibrahim Sallam (5) with minor modifications. The fish samples (5 g) were homogenized with 25 mL of 20% (wt/vol) trichloroacetic acid (Sinopharm Chemical Reagent Co., Ltd., Shanghai, PR China), centrifuged, and incubated, and the absorbance was measured at 532 nm. The TBARS value was expressed as mg malondialdehyde equivalents per 100 g of samples (mg/100 g).
Determination of Water-Holding Capacity
The fish samples (M1) (3 g) were weighed accurately, and the fish samples (M2) were weighed after centrifugation at 3,000 r/min for 10 min. The formula for calculating water-holding capacity (WHC) (%) was as follows:
Determination of Transverse Relaxation Time (T2) of Low-Field Nuclear Magnetic Resonance and Proton Magnetic Resonance Imaging
T2 relaxation measurements were performed using a low-field nuclear magnetic resonance (LF-NMR) analyzer minispec PQ 001 (Niumag, Ltd., Shanghai, China). The fish sample (2 × 2 × 2 cm) was put into the detecting tube (70-mm diameter). Using the Carr-Purcell-Meiboom-Gill sequence to set the T2 measurement parameters (9), the analysis software (NMI20-030H-1 NMR analyzer: Suzhou Niumag Analytical Instrument Co., Suzhou, China) was used to iteratively invert the collected signals to obtain the transverse relaxation time T2 spectrum. Similarly, the proton density distribution of the sample is determined by magnetic resonance imaging (MRI) after setting the parameters. The gray-scale map of proton intensity was altered to be pseudocolor images by MATLAB software (MathWorks Inc., Natick, MA, USA).
Fatty Acid Profile
The total lipids of salmon were extracted by adding 10 g of flesh sample with chloroform/methanol (2:1, vol/vol) and then condensed using rotary evaporation according to the method of Folch et al. (13). The extracted sample (0.1 g) in a 100-mL round-bottomed flask and methylate the fatty acids by the boron trifluoride-methanol method according to the method of Zhang et al. (14) and analyze it by gas chromatography (GC) after methyl esterification. Qualitative analysis was performed according to the comparative retention time of fatty acid methyl ester mixed standards (Sigma–Aldrich Co. LLC, USA) and samples, and quantitative analysis was performed by the internal standard method. GC parameters were set according to the method of Merlo et al. (15).
VOC Determination by Headspace Solid Phase Microextraction Coupled With GC/Mass Spectrometry Analysis
The VOC analysis was measured according to the method of Parlapani et al. (16) with some modifications. Three grams of fish meat was weighed and added it to 20-mL headspace vials and equilibrate at 50°C for 15 min. Then the SPME fiber (DVB/CAR/PDMS 50/30 μm) was exposed to the headspace for additional 40 min. The fiber with VOCs was inserted into the injection port of the GC at 250°C for 5 min.
GC/mass spectrometry (MS) analysis was performed on an Agilent 7890A gas chromatograph coupled to an Agilent 5977A mass spectrometer (Agilent Technologies Co. Ltd., CA, USA). A capillary HP-5MS column (30 m × 0.25 mm × 0.25 μm) was used, and the GC oven temperature initially was maintained at 40°C for 3 min and then was raised to 100°C with a program of 3°C/min, and increase of 5°C/min to a final temperature of 230°C and kept for 5 min. The carrier gas (helium) flow rate was 0.8 mL/min, the analytical temperature was 250°C, and the injection was performed in splitless mode. The temperature of transfer lines was maintained at 280°C, the temperature of MS source and quadrupole was set at 230 and 150°C, respectively. The scan range from 30 to 550 m/z and ionization energy was 70 eV. The VOCs were identified by comparing their retention times with reference compounds or by comparing their mass spectra with those stored in the National Institute of Standards and Technology 11 spectral database. The amount of VOCs was expressed as the peak area of the deconvoluted component multiplied by any unit of 10−6.
Statistical Analysis
At least three measurements of all experiments were performed. The data were performed in Excel 2010 software (Microsoft Corp., Redmond, WA, USA), and analysis of variance and mean comparison were carried out by using SPSS 20 (SPSS version 20.0; SPSS Inc., Chicago, IL, USA); the significant difference was set at p < 0.05, and the figures were performed using the Origin2018 software (OriginLab, USA).
Results and Discussion
Sensory Evaluation
As shown in Figure 2A, the sensory scores of the four groups of fish samples decreased during storage, but the degradation rate of the T3 was significantly faster. On the third day, T3 began to produce mucus, but no off-odor was produced in all four groups. On the 6th day, the mucus in all groups increased significantly, whereas the elasticity decreased, and the color was darker than before; the three groups (control, T1, T2) started to exhibit a slight ammonia odor, but the unacceptable rancid odor began to appear in T3, which led to a significant decrease in sensory scores. On the 8th day, the sensory scores of all groups reached an unacceptable threshold. This phenomenon was similar to the research of Wang et al. (9). The sensory score of salmon at 0°C was significantly higher than the group that suffered temperature fluctuations, and the quality of salmon filets was rapidly decreased because of the temperature fluctuation, and the score was also significantly lower than that of the control group.
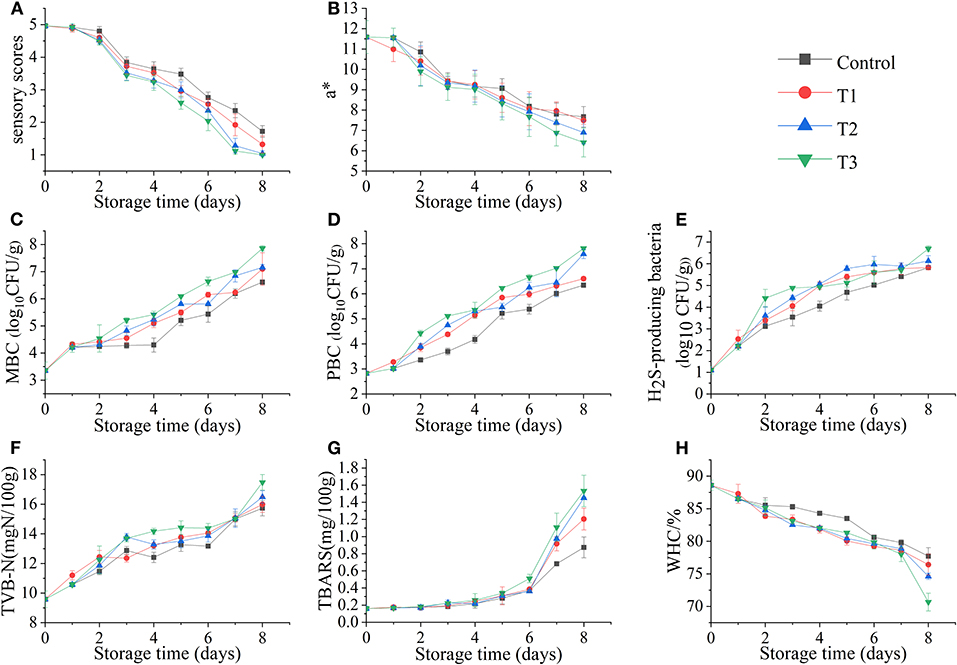
Figure 2. Sensory score (A), redness value (a*) (B), total mesophilic bacteria count (MBC) (C), total psychrotrophic bacteria count (PBC) (D), hydrogen sulfide–producing bacteria count (E), total volatile basic nitrogen (TVB-N) values (F), thiobarbituric acid–reactive substances (TBARS) values (G), and water-holding capacity (WHC) (H) of salmon filets under four different storage conditions.
Determination of Redness Value (a*)
The fresh salmon filets exhibit bright red in color due to the high astaxanthin content. The change in redness value (a*) of salmon filets is shown in Figure 2B. The color of the four groups of fish samples changed significantly with the increase of time. Among them, the colors of T2 and T3 became significantly darker; especially the muscle of T3 was not bright. The redness value decreased with the increasing time, which might be due to the oxidation of astaxanthin (17). The color of salmon filets during storage is related to the astaxanthin state (18). And the decrease in the redness value was also one of the reasons for the decrease in sensory scores.
Microbiological Analyses
The changes in total mesophilic bacteria count (MBC), total psychrotrophic bacteria count (PBC), and H2S-producing bacteria count in salmon filets stored at different storage conditions are shown in Figures 2C–E. In this study, the initial number of MBC was low [<4 log10 CFU/g] before the salmon filets were subjected to different treatments, indicating that the fish filets were fresh. It is shown that the MBC count of the control group was significantly lower than that of the other three groups, whereas the number of the T3 group was significantly higher, and the growth rates and numbers of the T1 and T2 groups were closer. The T3 group first reached the microbial limit [ ≤ 7 log10 CFU/g, ICMSF (19)] during storage. On the 8th day, the T3 group had reached 7.9 log10 CFU/g, and the T1 and T2 groups reached 7.1 and 7.2 log10 CFU/g, respectively, whereas the control group reached 6.6 log10 CFU/g, which did not exceed the microbial limit. The rapid reproduction of microorganisms should be caused by temperature fluctuations (20).
The psychrotrophic microorganisms are one of the main microorganisms in fishery products during refrigeration (21). It can be seen from Figure 2D that the growth trend of PBC is similar to that of MBC. The T3 group was significantly higher than the other three groups. Similarly, on the 8th day, the PBC of T3 was the highest, reaching 7.8 log10 CFU/g, followed by the T2 group also reaching 7.6 log10 CFU/g, whereas the control and T1 groups reached only 6.3 and 6.6 log10 CFU/g, respectively. The results confirmed that temperature fluctuations would accelerate bacterial growth in seafood.
Most H2S-producing bacteria found in fishery products are gram-negative bacteria, such as Shewanella spp., Serratia spp., Aeromonas spp., etc. They can produce trimethylamine (TMA) and H2S and amino acid decarboxylation and proteolytic activity (22). The counts of H2S-producing bacteria in salmon filets under four storage conditions also increased with storage time, reaching the highest value on the 8th day. The T2 and T3 groups were 6.1 and 6.7 log10 CFU/g, respectively, whereas the control and T1 groups were only 5.8 log10 CFU/g.
Determination of TVB-N and TBARS
The TVB-N value is used as one of the important indicators to evaluate the freshness of fishery products (23). As shown in Figure 2F, the TVB-N value of salmon increased during four different storages. The TVB-N value of the T3 group was significantly higher than the other three groups, reaching 17.48 mg N/100 g at the end of storage, followed by the T2, T1, and the control groups in descending order. The increase of TVB-N is mainly related to the activities of spoilage microorganisms and endogenous enzymes in fish (24). The decomposition of protein and some non-protein nitrogen compounds in salmon will become basic nitrogen-containing substances, including ammonia, monoethyl amine, dimethylamine, and TMA, which are also contributing to the odor changes (25).
The TBARS value is one of the important indexes to evaluate the degree of lipid oxidation (26). Because salmon is rich in fat and PUFAs, the lipid oxidation may play an important role in deterioration by producing unpleasant odors and yellowish color (7). As shown in Figure 2G, the TBARS value of salmon increased slowly in the first 6 days, but rapidly in the following 2 days, indicating that lipid oxidation was accelerated at this time. After 8 days of storage, the TBARS values of T2 and T3 groups reached 1.45 and 1.53 mg/100 g, respectively, and the control and T1 groups reached 0.87 and 1.20 mg/100 g, respectively. The TBARS values of the temperature fluctuation group were significantly higher than that of the control group, indicating the temperature fluctuation accelerated the lipid oxidation of salmon.
Determination of WHC
The WHC of salmon filets decreased with storage time under different storage conditions (Figure 2H). The WHC of fresh salmon was 88.59%, and the WHC of four storage conditions decreased with the increasing time, especially at the end of storage. The WHC of the T3 group decreased to 70.67% on the 8th day, and those of the control, T1, and T2 groups were 77.71, 76.41, and 74.61%, respectively. The oxidation and decomposition of proteins could be the main cause of this phenomenon (27).
Transverse Relaxation Time (T2) of LF-NMR
The transverse relaxation time (T2) of the LF-NMR technique can determine the changes in water distribution and water migration of salmon filets under different storage conditions. The original contributions presented in the study are publicly available. These data can be found at https://doi.org/10.6084/m9.figshare.12610628.v1. According to the results of T2 shown in Figures 3A–D, T2 is closely related to the three states of salmon filets at different relaxation times: T21 (0.1–1 ms) represents bound water, which is closely related to proteins and other biological macromolecules, T22 (43–50 ms) represents the trapped water mainly existing in the tertiary or quaternary structure of the protein or existed between myofibrils and membranes, and T23 (464–1,418 ms) represents the free water that has the longest relaxation time and exits outside the myofibrillar fibers (28). The changes of T21 were not obvious with the increasing storage time. As the storage time increases, the signal intensity of T22 decreased significantly, especially in the T3 group after 6 days of storage. On the other hand, the signal intensity of T23 increased rapidly, especially after 6 days of storage. This phenomenon indicated that the trapped water altered to free water during storage, due to the destruction of myofibril structure (29). The changes of T22 and T23 in the T3 group were more significant than other groups, in accordance with the changes of the TVB-N and TBARS values and bacterial counts.
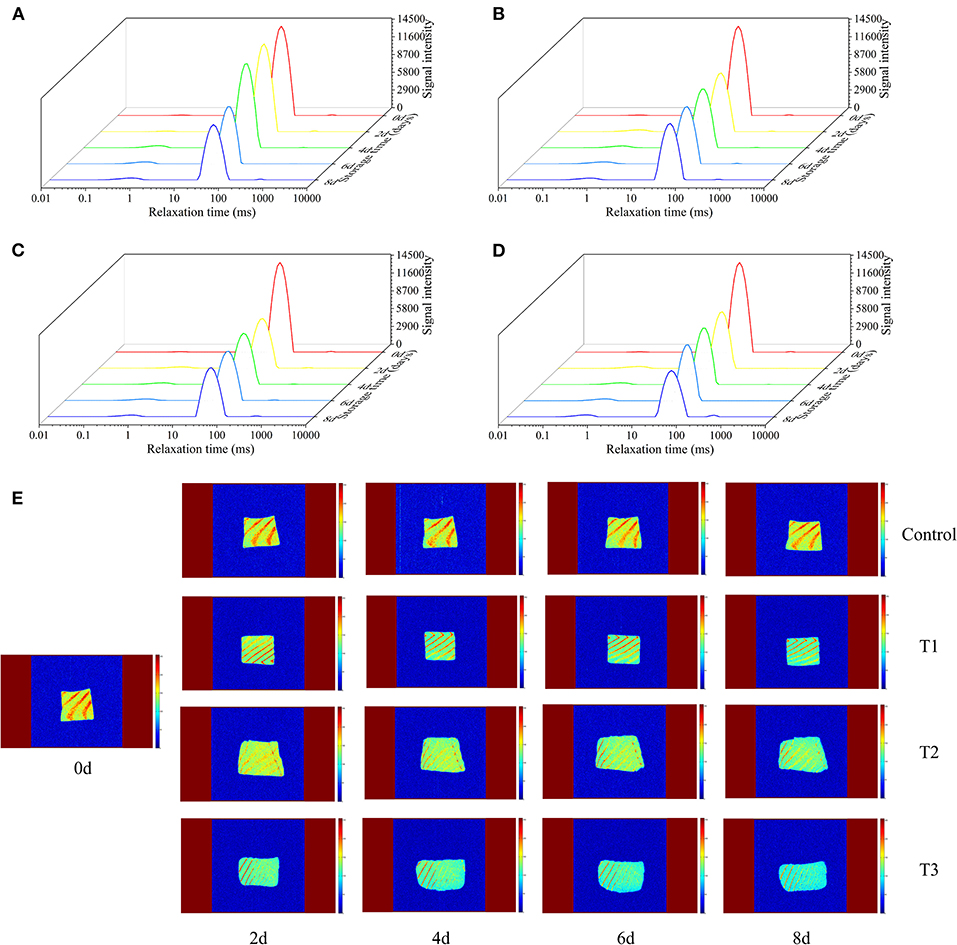
Figure 3. Transverse relaxation time (T2) of salmon filets under four different storage conditions (A–D) and magnetic resonance imaging (MRI) of salmon filets under four different storage conditions (E).
Proton MRI
MRI was used to visualize the spatial distribution of moisture in salmon samples under four different storage conditions. In the MRI scan, red (bright) corresponds to regions of high water/proton density, and blue (dark) corresponds to regions of low water/proton density. Fresh salmon filets had the strongest internal signals and the highest moisture content, mainly red and bright yellow. As shown in Figure 3E, with the increasing storage time, the MRI scans of the four groups were gradually changed from bright yellow to blue, and the colors of the T2 and T3 groups were significantly bluer than the other two groups, indicating the decreased of moisture content, corresponding to the previously mentioned changes of T22. Temperature fluctuations may promote the migration of water. More water migrates to the outside of the myofibrils, promoting the degradation and denaturation of proteins, resulting in the quality of salmon to decline faster.
Fatty Acid Profile
The composition and content of fatty acids in salmon are shown in Table 1. A total of 30 fatty acids were detected in salmon filets, including 11 saturated fatty acids (SFAs), eight monounsaturated fatty acids (MUFAs), and 11 PUFAs. The content of unsaturated fatty acids (UFAs) in salmon accounted for about 79% of the total fatty acids. Generally, the higher the content of UFAs, the higher the nutritional value of the food is (6). Among the UFAs in salmon, PUFA accounts for about 32% of the total fatty acids, and MUFA accounts for about 47%. The most abundant fatty acid in salmon was oleic acid (C18:1n9c), followed by linoleic acid (C18:2n6c) and palmitic acid (C16:0).
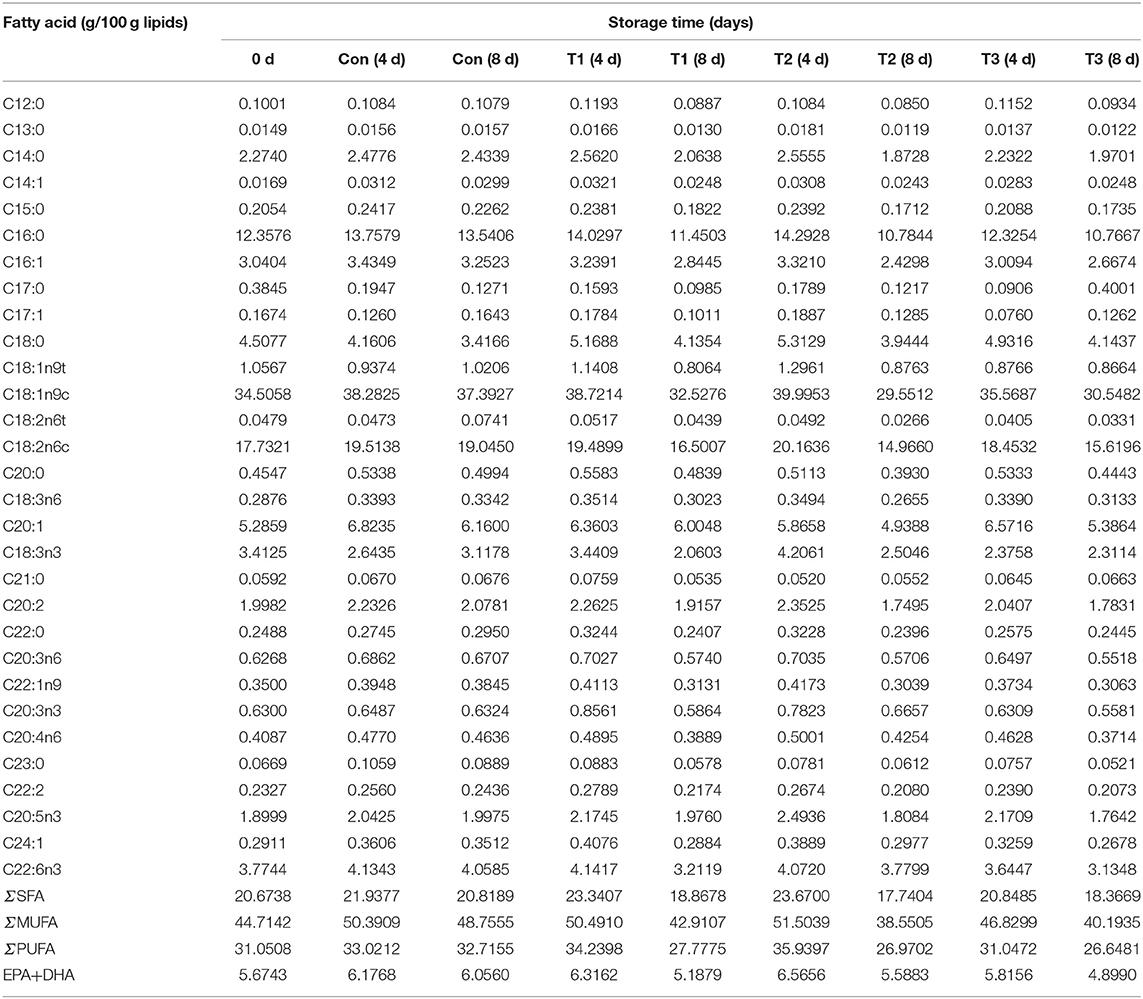
Table 1. The total fatty acids composition and relative contents of salmon filets under four different storage conditions.
During storage, the contents of total fatty acids, ΣSFA, ΣMUFA, and ΣPUFA of samples on the 8th day were all lower than those on the 4th day. The fatty acid content in the control samples was more stable than other groups, whose total fatty acids content decreased only by 2.90% when compared to the results on the 8th day with the 4th day. A more significant decrease in fatty acids was found in T2 and T1 groups. The predominant decreased fatty acids in all groups were oleic acid (C18:1n9c), linoleic acid (C18:2n6c), and palmitic acid (C16:0). Linolenic acid (C18:3n3) decreased by more than 40% in T2 and T1 group (4d VS 8d), but it did not change much in the T3 group. It was indicated that the degradation of fatty acid was correlated with the temperature and frequency of temperature fluctuation. The fatty acid is an important precursor of volatile compounds including aldehydes and ketones, leading to odor formation. Therefore, the VOCs were also detected in this study.
Determination of VOCs
The formations of VOCs are usually contributed by bacterial metabolisms, enzymatic reactions, or lipid auto-oxidation products (30). A total of 25 VOCs were identified in this study, including eleven alcohols, nine aldehydes, four ketones, and one ester (Table 2).
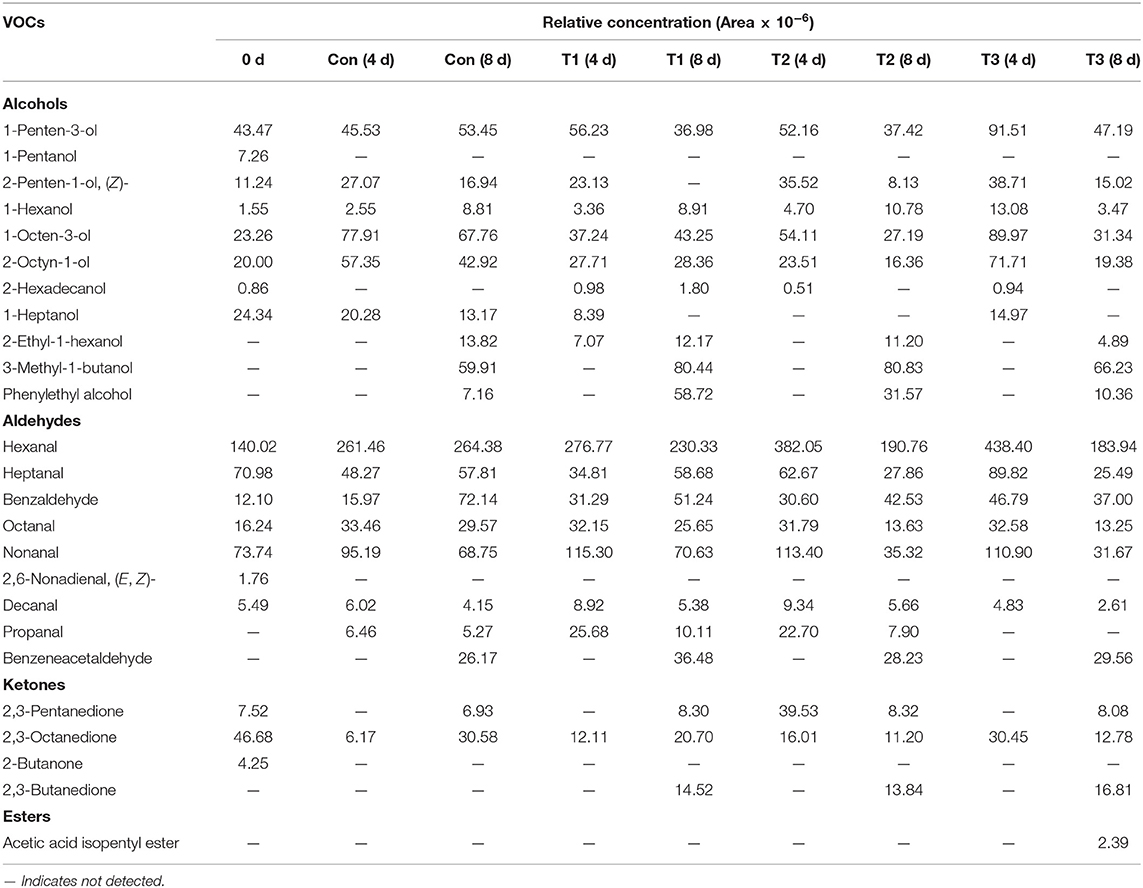
Table 2. Main volatile organic compounds (VOCs) and their relative contents (chromatographic peak area × 10−6) in salmon filets under four different storage conditions.
Among the volatile alcohol compounds of salmon filets, 1-penten-3-ol, 2-penten-1-ol, (Z)-, 1-hexanol, 1-octen-3-ol, and 2-octyn-1-ol increased during storage. 1-Penten-3-ol and 2-octyn-1-ol were the most abundant compounds in salmon filets, which are related to lipid oxidation (mainly caused by the oxidation of UFAs and arachidonic acid by lipoxygenase (31–33). 1-Octen-3-ol is one of the most important contributors of rancid off-flavors because of its low sensorial threshold value so that a little increment was enough for the contribution of lower sensory scores (34).
The highest content of aldehydes was hexanal in fresh salmon, followed by heptanal and nonanal. Hexanal and nonanal were related to the oxidation of linoleic acid and PUFA (35, 36), which were important contributors to meat flavor. In addition, in the later stage of storage, the content of benzaldehyde also increased significantly, and benzeneacetaldehyde also accumulated in the later stage of storage, which was related to the spoilage of salmon filets.
The ketones in salmon filets were much lower than alcohols and aldehydes. The mainly detected compounds of ketones were 2,3-pentanedione, 2,3-octanedione, 2-butanone, and 2,3-butanedione. 2,3-Octanedione was the predominant ketone in fresh salmon, and its content decreased with the increasing storage time. The content of 2,3-butanedione increased significantly during storage, which might be contributed by the metabolic activity of Pseudomonas (37).
The principal component analysis showed that VOC variations of different salmon samples were 35.8% [principal coordinates 1 (PC1)] and 24.1% [principal coordinates 2 (PC2)] (Figure 4). The dots of samples were generally distributed in three different quadrants by different storage time. The dot representing fresh salmon filet was far away from other samples. Therefore, the volatile compounds of fresh salmon were significantly different from the samples during storage. The dot of T3 samples on day 4 was also distinguished from other three groups, but the dots of samples became closer to each other after 8 days of storage, indicating that the differences of the content of VOCs between every four groups were much obvious on the 4th day than on the 8th day.
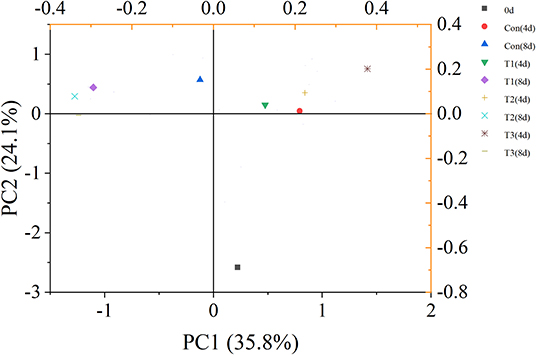
Figure 4. Principal component analysis (PCA) score plot of volatile organic compounds (VOCs) of salmon filets under four different storage conditions.
Relationship Between TBARS Values, Fatty Acid, VOCs, and Water Migration
Table 3 showed the correlation between TBARS values, fatty acids (C16:0, C18:0, C18:1n9c, C18:2n6c, C20:1, ΣSFA, ΣMUFA, ΣPUFA, and EPA + DHA), VOCs (1-penten-3-ol, hexanal, heptanal, nonanal, and 2,3-octanedione), and water migration in salmon filets. The relationship between T21 and the TBARS value, fatty acids, and VOCs was quite low, which is closely bound to proteins and has little impact on biological reactions (29). T22 was negatively significantly correlated (p < 0.05) with octadecanoic acid, 1-penten-3-ol, hexanal, and non-anal. In addition, T23 was positively correlated (p < 0.05) with 1-penten-3-ol, hexanal, and heptanal. During storage, the trapped water (T22) gradually altered to be free water (T23) because of the loss of WHC of myofibril protein. The migration of intramyofibrillar water might also lead to the leakage of enzymes such as lipase, lipoxygenase, and protease, which accelerated the degradation and oxidation of fatty acid and proteins and the proliferation of bacteria (38). Therefore, the results indicated that water dynamics had a significant correlation with the fatty acids and VOCs, which could be used to assess and detect the quality changes of salmon.
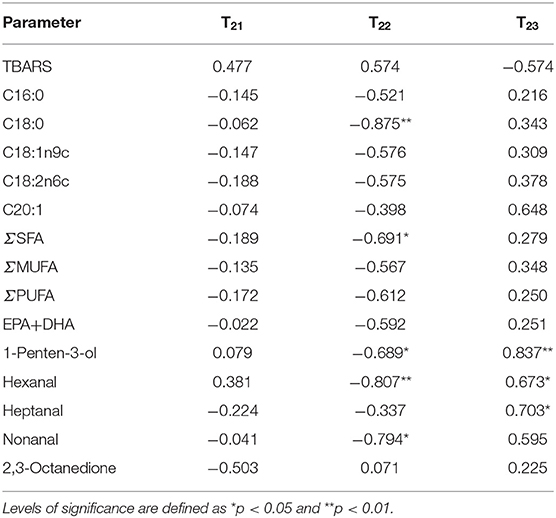
Table 3. Pearson correlation analysis and levels of significance for correlations between TBARS values, fatty acid, and VOCs with T21, T22, and T23.
Conclusions
This study showed that the sensory score, redness value, and WHC of salmon filets under temperature fluctuation decreased faster than that of filets stored at constant temperature (0 and 4°C), whereas the MBC, PBC, H2S-producing bacteria count, TVB-N, and TBARS values gradually increased. LF-NMR 1H also showed that water migration was more significant because of temperature shifts. Meanwhile, the fatty acid degraded, and some VOCs including 1-penten-3-ol, hexanal, and 2,3-butanedione contributing to unpleasant rancid flavor increased, which could be a potential indicator of poor quality in salmon. The relationship between T22 or T23 and other quality indicators had a significant correlation, indicating that LF-NMR 1H is a potential non-destructive method to evaluate the quality of seafood. The acceleration of fatty acid degradation and oxidation was observed in samples that suffered frequent temperature fluctuations, and the water migration accelerated the degradation and oxidation of fatty acids. Therefore, the temperature fluctuation during cold chain logistics should be avoided to maintain the nutrients and freshness of salmon.
Data Availability Statement
The original contributions presented in the study are included in the article/supplementary material, further inquiries can be directed to the corresponding author/s.
Author Contributions
JX: conceptualization, project administration, and funding acquisition. Y-JY and Y-FQ: methodology. Y-JY: writing—original draft preparation, software, data curation, and visualization. Y-JY, S-PY, and TL: investigation. Y-JY, JX, and CH: validation. JX and Y-FQ: formal analysis, resources, and supervision. Y-FQ: writing—review and editing. All authors contributed to the article and approved the submitted version.
Funding
This work was supported by the National 13th Five-Year Key Research and Development Program for Science and Technology Support (Grant No: 2016YFD0400106) and Shanghai Municipal Science and Technology project to Enhance the Capabilities of the Platform (Grant No: 19DZ2284000).
Conflict of Interest
CH was employed by Nanjing Weigang Dairy Co., Ltd.
The remaining authors declare that the research was conducted in the absence of any commercial or financial relationships that could be construed as a potential conflict of interest.
References
1. Shumilina E, Ciampa A, Capozzi F, Rustad T, Dikiy A. NMR approach for monitoring post-mortem changes in Atlantic salmon fillets stored at 0 and 4°C. Food Chem. (2015) 184:12–22. doi: 10.1016/j.foodchem.2015.03.037
2. Lorentzen G, Ageeva TN, Heide M, Esaiassen M. Temperature fluctuations in processing and distribution: effect on the shelf life of fresh cod fillets (Gadus morhua L.). Food Control. (2020) 112:107102. doi: 10.1016/j.foodcont.2020.107102
3. Margeirsson B, Lauzon HL, Pálsson H, Popov V, Gospavic R, Jónsson MÞ*, et al. Temperature fluctuations and quality deterioration of chilled cod (Gadus morhua) fillets packaged in different boxes stored on pallets under dynamic temperature conditions. Int J Refrig. (2012) 35:187–201. doi: 10.1016/j.ijrefrig.2011.09.006
4. Olafsdottir G, Lauzon HL, Martinsdottir E, Oehlenschlager J, Kristbergsson K. Evaluation of shelf life of superchilled cod (Gadus morhua) fillets and the influence of temperature fluctuations during storage on microbial and chemical quality indicators. J Food Sci. (2006) 71:S97–109. doi: 10.1111/j.1365-2621.2006.tb08928.x
5. Ibrahim Sallam K. Antimicrobial and antioxidant effects of sodium acetate, sodium lactate, and sodium citrate in refrigerated sliced salmon. Food Control. (2007) 18:566–75. doi: 10.1016/j.foodcont.2006.02.002
6. Simoes JS, Marsico ET, Marshall MR, Simonne A, Yagiz Y, Xu C, et al. Applications of extracts from skin and seed muscadine grape (Vitis rotundifolia Michx.) waste on bacterial growth, autoxidation, and color in atlantic salmon (Salmo salar L.). J Food Process Preserv. (2019) 43:13976. doi: 10.1111/jfpp.13976
7. Fidalgo LG, Lemos ÁT, Delgadillo I, Saraiva JA. Microbial and physicochemical evolution during hyperbaric storage at room temperature of fresh Atlantic salmon (Salmo salar). Innov Food Sci Emerg Technol. (2018) 45:264–72. doi: 10.1016/j.ifset.2017.11.003
8. Jacobsen C. Oxidative rancidity. In: L. Melton, F. Shahidi, P. Varelis, editors. Encyclopedia of Food Chemistry. Oxford: Academic Press (2019). p. 2619. doi: 10.1016/B978-0-08-100596-5.21672-7
9. Wang S, Xiang W, Fan H, Xie J, Qian Y-F. Study on the mobility of water and its correlation with the spoilage process of salmon (Salmo solar) stored at 0 and 4 °C by low-field nuclear magnetic resonance (LF NMR 1H). J Food Sci Technol. (2018) 55:173–82. doi: 10.1007/s13197-017-2880-5
10. Sánchez-Alonso I, Martinez I, Sánchez-Valencia J, Careche M. Estimation of freezing storage time and quality changes in hake (Merluccius merluccius, L.) by low field NMR. Food Chem. (2012) 135:1626–34. doi: 10.1016/j.foodchem.2012.06.038
11. Xie J, Zhang Z, Yang S-P, Cheng Y, Qian Y-F. Study on the spoilage potential of Pseudomonas fluorescens on salmon stored at different temperatures. J Food Sci Technol. (2018) 55:217–25. doi: 10.1007/s13197-017-2916-x
12. FOSS. Determination of Total Volatile Basic Nitrogen of Fresh Fish and Frozen Fish. Hoganas: Application Sub Note (2002).
13. Folch J, Lees M, Stanley GS. A simple method for the isolation and purification of total lipides from animal tissues. J Biol Chem. (1957) 226:497–509.
14. Zhang J, Tao N, Wang M, Shi W, Ye B, Wang X, et al. Characterization of phospholipids from Pacific saury (Cololabis saira) viscera and their neuroprotective activity. Food Biosci. (2018) 24:120–6. doi: 10.1016/j.fbio.2018.06.002
15. Merlo TC, Contreras-Castillo CJ, Saldaña E, Barancelli GV, Dargelio MDB, Yoshida CMP, et al. Incorporation of pink pepper residue extract into chitosan film combined with a modified atmosphere packaging: effects on the shelf life of salmon fillets. Food Res Int. (2019) 125:108633. doi: 10.1016/j.foodres.2019.108633
16. Parlapani FF, Michailidou S, Anagnostopoulos DA, Sakellariou AK, Pasentsis K, Psomopoulos F, et al. Microbial spoilage investigation of thawed common cuttlefish (Sepia officinalis) stored at 2 °C using next generation sequencing and volatilome analysis. Food Microbiol. (2018) 76:518–25. doi: 10.1016/j.fm.2018.08.004
17. Torres Sánchez EG, Fuenmayor CA, Vásquez Mejía SM, Díaz-Moreno C, Suárez Mahecha H. Effect of bee pollen extract as a source of natural carotenoids on the growth performance and pigmentation of rainbow trout (Oncorhynchus mykiss). Aquaculture. (2020) 514:734490. doi: 10.1016/j.aquaculture.2019.734490
18. Zhu Z, Gao H, Gao T, Sun D-W. Quality comparison of grass carp and salmon fillets packaged in modified atmosphere with different composite films. J Food Process Eng. (2018) 41:12803. doi: 10.1111/jfpe.12803
19. ICMSF. Microorganisms in foods 7: microbiological testing in food safety management. Int J Food Microbiol. (2003) 89:291–2. doi: 10.1016/S0168-1605(03)00163-6
20. Lin H, Shavezipur M, Yousef A, Maleky F. Prediction of growth of Pseudomonas fluorescens in milk during storage under fluctuating temperature. J Dairy Sci. (2016) 99:1822–30. doi: 10.3168/jds.2015-10179
21. Gram L, Huss HH. Microbiological spoilage of fish and fish products. Int J Food Microbiol. (1996) 33:121–37. doi: 10.1016/0168-1605(96)01134-8
22. Serio A, Fusella GC, Chaves López C, Sacchetti G, Paparella A. A survey on bacteria isolated as hydrogen sulfide-producers from marine fish. Food Control. (2014) 39:111–8. doi: 10.1016/j.foodcont.2013.11.003
23. Rizo A, Mañes V, Fuentes A, Fernández-Segovia I, Barat JM. Physicochemical and microbial changes during storage of smoke-flavoured salmon obtained by a new method. Food Control. (2015) 56:195–201. doi: 10.1016/j.foodcont.2015.03.030
24. Fernández-Segovia I, Fuentes A, Aliño M, Masot R, Alcañiz M, Barat JM. Detection of frozen-thawed salmon (Salmo salar) by a rapid low-cost method. J Food Eng. (2012) 113:210–6. doi: 10.1016/j.jfoodeng.2012.06.003
25. Liu D, Liang L, Xia W, Regenstein JM, Zhou P. Biochemical and physical changes of grass carp (Ctenopharyngodon idella) fillets stored at−3 and 0°C. Food Chem. (2013) 140:105–14. doi: 10.1016/j.foodchem.2013.02.034
26. Fuentes A, Masot R, Fernández-Segovia I, Ruiz-Rico M, Alcañiz M, Barat JM. Differentiation between fresh and frozen-thawed sea bream (Sparus aurata) using impedance spectroscopy techniques. Innov Food Sci Emerg Technol. (2013) 19:210–7. doi: 10.1016/j.ifset.2013.05.001
27. Wang X-Y, Xie J. Evaluation of water dynamics and protein changes in bigeye tuna (Thunnus obesus) during cold storage. LWT. (2019) 108:289–96. doi: 10.1016/j.lwt.2019.03.076
28. Carneiro CdS, Marsico ET, Resende Ribeiro RdO, Conte-Junior CA, Mano SB, et al. Low-Field Nuclear Magnetic Resonance (LF NMR 1H) to assess the mobility of water during storage of salted fish (Sardinella brasiliensis). J Food Eng. (2016) 169:321–5. doi: 10.1016/j.jfoodeng.2015.09.010
29. Wang X, Geng L, Xie J, Qian Y-F. Relationship between water migration and quality changes of Yellowfin Tuna (Thunnus albacares) during storage at 0 and 4°C by LF-NMR. J Aquat Food Prod Technol. (2018) 27:35–47. doi: 10.1080/10498850.2017.1400630
30. Li Q, Zhang L, Luo Y. Changes in microbial communities and quality attributes of white muscle and dark muscle from common carp (Cyprinus carpio) during chilled and freeze-chilled storage. Food Microbiol. (2018) 73:237–44. doi: 10.1016/j.fm.2018.01.011
31. Alasalvar C, Taylor KDA, Shahidi F. Comparison of volatiles of cultured and wild sea bream (Sparus aurata) during storage in ice by dynamic headspace analysis gas chromatography mass spectrometry. J Agric Food Chem. (2005) 53:2616–22. doi: 10.1021/jf0483826
32. Hsieh RJ, Kinsella JE. Lipoxygenase generation of specific volatile flavor carbonyl compounds in fish tissues. J Agric Food Chem. (1989) 37:279–86. doi: 10.1021/jf00086a001
33. Iglesias J, Medina I. Solid-phase microextraction method for the determination of volatile compounds associated to oxidation of fish muscle. J Chromatogr A. (2008) 1192:9–16. doi: 10.1016/j.chroma.2008.03.028
35. Iglesias J, Medina I, Bianchi F, Careri M, Mangia A, Musci M. Study of the volatile compounds useful for the characterisation of fresh and frozen-thawed cultured gilthead sea bream fish by solid-phase microextraction gas chromatography-mass spectrometry. Food Chem. (2009) 115:1473–8. doi: 10.1016/j.foodchem.2009.01.076
36. Soncin S, Chiesa LM, Panseri S, Biondi P, Cantoni C. Determination of volatile compounds of precooked prawn (Penaeus vannamei) and cultured gilthead sea bream (Sparus aurata) stored in ice as possible spoilage markers using solid phase microextraction and gas chromatography/mass spectrometry. J Sci Food Agric. (2009) 89:436–42. doi: 10.1002/jsfa.3466
37. Wang X-Y, Xie J. Study on the volatile organic compounds and its correlation with water dynamics of Bigeye Tuna (Thunnus obesus) during cold storage. Molecules. (2019) 24:3119. doi: 10.3390/molecules24173119
Keywords: salmon filets, cold storage, temperature fluctuations, low-field nuclear magnetic resonance (LF-NMR), fatty acid, volatile organic compounds (VOCs)
Citation: Yu Y-J, Yang S-P, Lin T, Qian Y-F, Xie J and Hu C (2020) Effect of Cold Chain Logistic Interruptions on Lipid Oxidation and Volatile Organic Compounds of Salmon (Salmo salar) and Their Correlations With Water Dynamics. Front. Nutr. 7:155. doi: 10.3389/fnut.2020.00155
Received: 02 July 2020; Accepted: 30 July 2020;
Published: 09 September 2020.
Edited by:
Jun Lu, Auckland University of Technology, New ZealandReviewed by:
Yilmaz Uçar, Çukurova University, TurkeyTao Feng, Shanghai Institute of Technology, China
Copyright © 2020 Yu, Yang, Lin, Qian, Xie and Hu. This is an open-access article distributed under the terms of the Creative Commons Attribution License (CC BY). The use, distribution or reproduction in other forums is permitted, provided the original author(s) and the copyright owner(s) are credited and that the original publication in this journal is cited, in accordance with accepted academic practice. No use, distribution or reproduction is permitted which does not comply with these terms.
*Correspondence: Yun-Fang Qian, eWZxaWFuQHNob3UuZWR1LmNu; Jing Xie, anhpZUBzaG91LmVkdS5jbg==