 Danielle T. Vannan
 Marc R. Bomhof
 Raylene A. Reimer
- 1Faculty of Kinesiology, University of Calgary, Calgary, AB, Canada
- 2Department of Kinesiology and Physical Education, University of Lethbridge, Lethbridge, AB, Canada
- 3Department of Biochemistry and Molecular Biology, Cumming School of Medicine, University of Calgary, Calgary, AB, Canada
The obesity epidemic is driving interest in identifying strategies that enhance appetite control by altering the secretion of hormones that regulate satiety and food intake. An appropriate nutrient stimulus, such as a meal or oral nutrient solution, is needed to elicit the secretion of satiety hormones in order to evaluate the impact of dietary and other interventions. Our objective was to compare the effects of oral glucose vs. mixed nutrients on plasma concentrations of glucose and appetite-regulating hormones to determine the most appropriate oral nutrient challenge to trigger robust hormone secretion. A 120 min oral glucose tolerance test (OGTT) was compared with two meal tolerance tests (MTT) of differing formulation to evaluate glucose and satiety hormone responses. Following overnight feed deprivation, male Sprague-Dawley rats were given one of three oral gavages with equal carbohydrate content (2 g CHO/kg) in the form of: (1) Dextrose, (2) Ensure®, or (3) Mixed Meal. A fourth group was given saline as a control. Blood was collected via tail snip and analyzed for glucose, insulin, GLP-1, GIP, PYY, amylin, leptin, and ghrelin. Dextrose resulted in the highest blood glucose at T15 (P = 0.014), while the mixed meal was significantly higher than saline from T30-T120 (P < 0.05). Insulin was higher at T15 with dextrose compared to saline (P = 0.031) and Ensure® (P = 0.033). GLP-1 tAUC was significantly higher with dextrose compared to mixed meal (P = 0.04) while GIP tAUC was higher with dextrose and mixed meal compared to saline (P < 0.05). Changes in tAUC for insulin, amylin, leptin, ghrelin, and PYY did not reach significance. Based on these findings, dextrose appears to provide a robust acute glycemic and hormone response and is therefore likely an appropriate oral solution to reproducibly test the impact of various dietary, surgical, or pharmacological interventions on glucose and satiety hormone response.
Introduction
Substantial resources have been dedicated to the treatment of obesity and related comorbidities including diabetes, hypertension, and cardiovascular disease (1). Of current interest are strategies that target appetite control and feeding behavior (2). The hormonal signaling network that allows for cross-talk between the brain and peripheral tissues about energy stores and metabolic status includes leptin, insulin, glucagon-like peptide-1 (GLP-1), peptide YY (PYY), and ghrelin among others (3). Exposure to either an oral glucose tolerance test (OGTT) or a meal tolerance test (MTT) is a common protocol used to demonstrate changes in the release of satiety hormones in response to an acute stimulus such as a drug or nutrient or following longer term interventions to assess the effects of treatments such as bariatric surgery or dietary change on satiety hormones. Indeed, a variety of nutrients and/or dietary patterns have been shown to alter the secretion of orexigenic and anorexigenic hormones in rodents, including work with the prebiotics inulin and oligofructose and whey protein, that in turn are associated with changes in body weight and adiposity (4, 5). Furthermore, studies showing substantial changes in the release of appetite-regulating hormones following bariatric surgery have helped to identify one of several potential mechanisms by which this surgery enhances weight loss and leads to diabetes resolution (6, 7).
Oral gavage of a glucose solution or a complete meal is the most common technique used to assess an animals' satiety hormone response to nutrients (8–10). While individual studies may utilize either an OGTT or MTT to assess effects on satiety hormone secretion, to our knowledge they have not been directly assessed in a head to head manner. This is a critical comparison given that the two techniques, which deliver a single macronutrient in the OGTT and all three macronutrients in the MTT, could elicit distinct responses that could influence the interpretation of outcomes across different studies evaluating dietary or therapeutic interventions. For example, carbohydrate is highly effective at suppressing ghrelin release but fat is a rather weak ghrelin-suppressor (11). Similarly, individual macronutrients vary in their stimulation of GLP-1 release (12). It was our goal in this methods paper to identify the most appropriate test to elicit a robust response in both blood glucose and appetite-regulating hormone concentrations in rats. Since multiple hormones are part of the hormonal signaling network that controls appetite and feeding behavior (3), we measured the circulating levels of glucose, insulin, GLP-1, glucose-dependent insulinotropic peptide (GIP), peptide tyrosine tyrosine (PYY), leptin, amylin, and ghrelin during an OGTT and MTT (13). Based on evidence that all macronutrients stimulate GLP-1 secretion in the gut (14–16), we hypothesized that a MTT would elicit greater overall secretion of GLP-1 due to the mixed macronutrient composition compared to an OGTT. We predicted that other related hormones, such as PYY would be similarly affected.
Materials and Methods
Animals and Housing
This study was carried out in accordance with recommendations of the Guide to the Care and Use of Experimental Animals, Canadian Council on Animal Care. The protocol was approved by The University of Calgary Animal Care Committee. Twenty-four male Sprague-Dawley rats (10 weeks of age) were obtained from Charles River (Montreal, QC, Canada) and housed 3 per cage on a 12 h light–dark cycle in a temperature and humidity controlled room. Rats were maintained on standard rat chow (Lab Diet #5001, St. Louis, MO).
Preparation of Oral Test Solutions
All oral test solutions were created with equal carbohydrate (CHO) concentrations (0.5 g CHO/ml of solution). The 50% dextrose solution (wt/vol) was prepared by dissolving 0.5 g of dextrose in 1 ml of purified water. Commercial Ensure Plus® vanilla flavor [0.21 g carbohydrate(CHO)/ml: 0.086 g/ml sugar and 0.128 g/ml maltodextrin] was used as a mixed meal solution. Because of the lower carbohydrate content of Ensure®, dextrose was added to standardize carbohydrate content (adjusted to 0.5 g CHO/ml by adding in 0.44 g of dextrose/ml). The final macronutrient distribution of the Ensure® test meal was 80% CHO, 13% Fat, and 7% Protein. The in-house mixed meal was prepared by combining 0.5 g/ml dextrose, 0.092 g/ml vegetable oil, 0.149 g/ml high nitrogen casein (87% protein) (Dyets Inc., Bethlehem, PA) in purified water. The macronutrient distribution of the in-house mixed test meal was 60% CHO, 25% Fat, and 15% protein. The energy content for each of the experimental diets was: Dextrose-8.4 KJ/ml; Ensure®−10.4 KJ/ml; and Mixed-meal-13.9 KJ/ml. A full description of the nutrient composition of the test diets is provided in Table 1.
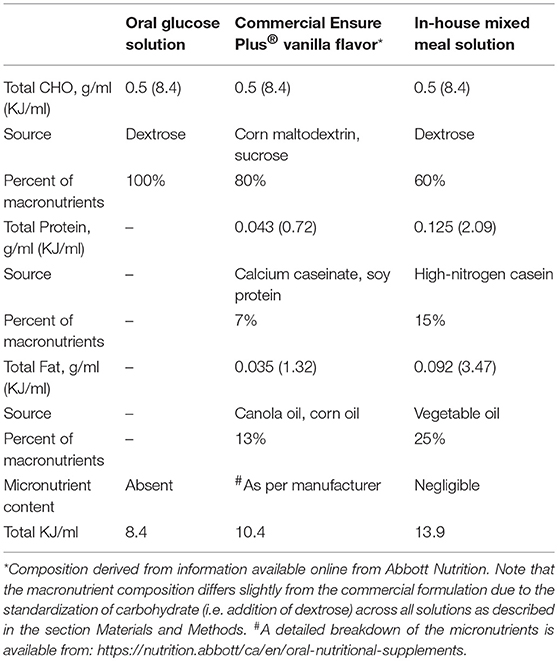
Table 1. Macronutrient composition and energy content of oral meal test solutions.
Experimental Protocol
One day prior to testing, rats (n = 6) were weighed and randomly assigned to 1 of 4 test groups: (1) Dextrose; (2) Ensure®; (3) Mixed meal; or (4) Saline. Following overnight feed deprivation with access to water, rats were given an oral gavage of the test solutions standardized to provide 2 g CHO/kg body weight or an equivalent volume of saline. Blood was sampled via tail nick at 0, 15, 30, 60, 90, and 120 min post-gavage and immediately analyzed for glucose using a blood glucose meter (OneTouch Glucose Meter, Lifescan Inc., Milpitas, CA). At the same time, blood was collected in a chilled tube containing diprotinin-A (0.068 mg/ml blood; MP Biomedicals, Irvine, CA), Sigma protease inhibitor (1 mg/ml blood; Sigma Aldrich, Oakville, ON, Canada) and Roche Pefabloc (1 mg/ml of blood; Roche, Mississauga, ON, Canada). Plasma was stored at −80°C until analysis for satiety hormones.
Appetite-Regulating Hormone Analysis
Concentrations of acylated ghrelin, active amylin, insulin, leptin, total GIP, active GLP-1, and total PYY were quantified using a commercially-available Rat Gut Hormone Panel Milliplex kit (Millipore, St. Charles, MO) and Luminex instrument according to the manufacturer's specifications. The intra-assay CV is < 10% and the inter-assay CV is < 15% for all analytes.
Statistics
All data are presented as mean ± standard error of the mean (SEM). Repeated measures ANOVA was used to assess differences in glucose and hormone response using time as the within subject factor and diet as the between subjects factor. If a significant time by diet interaction was identified, Tukey's post-hoc test was used to determine wherein the differences were found. For AUC data, a one-way ANOVA followed by Tukey's post-hoc test was conducted using SPSS V24.0 software (SPSS Inc., Chicago, IL, USA). Data was considered significant at P < 0.05.
Results
Body Weight
There were no significant differences in body weight between groups (saline 404.5 g ± 6.0, dextrose 404.4 g ± 9.6, Ensure® 404.5 g ± 4.3, mixed meal 405.8 g ± 2.7; P = 0.99).
Glucose and Insulin Response
Blood glucose concentrations were affected by time (P = 0.0001), diet (P = 0.004) and the interaction of time × diet (P = 0.005; Figure 1A). There were no differences in fasting blood glucose levels between groups, however, compared to saline, dextrose elicited the highest blood glucose at T15 (P = 0.014) which was not statistically different from the MTT groups. At T30, mixed meal treatment was significantly higher than saline (P = 0.046) and continued to be at T60 (P = 0.048), T90 (P = 0.0001), and T120 (P = 0.001). Dextrose and Ensure® also elicited higher blood glucose concentrations than saline at T90 and T120 (P < 0.05). Mixed meal blood glucose concentrations were also significantly higher than Ensure® at T90 (P = 0.049). Total AUC for glucose was significantly higher following dextrose (P = 0.017) and mixed meal (P = 0.005) treatments compared to saline (Table 2). Insulin concentrations were significantly influenced by time (P = 0.001) and time × diet (P = 0.001; Figure 1B). At T15, dextrose elicited higher insulin compared to saline (P = 0.031) and Ensure® (P = 0.033). There were no differences in total AUC for insulin (Table 2).
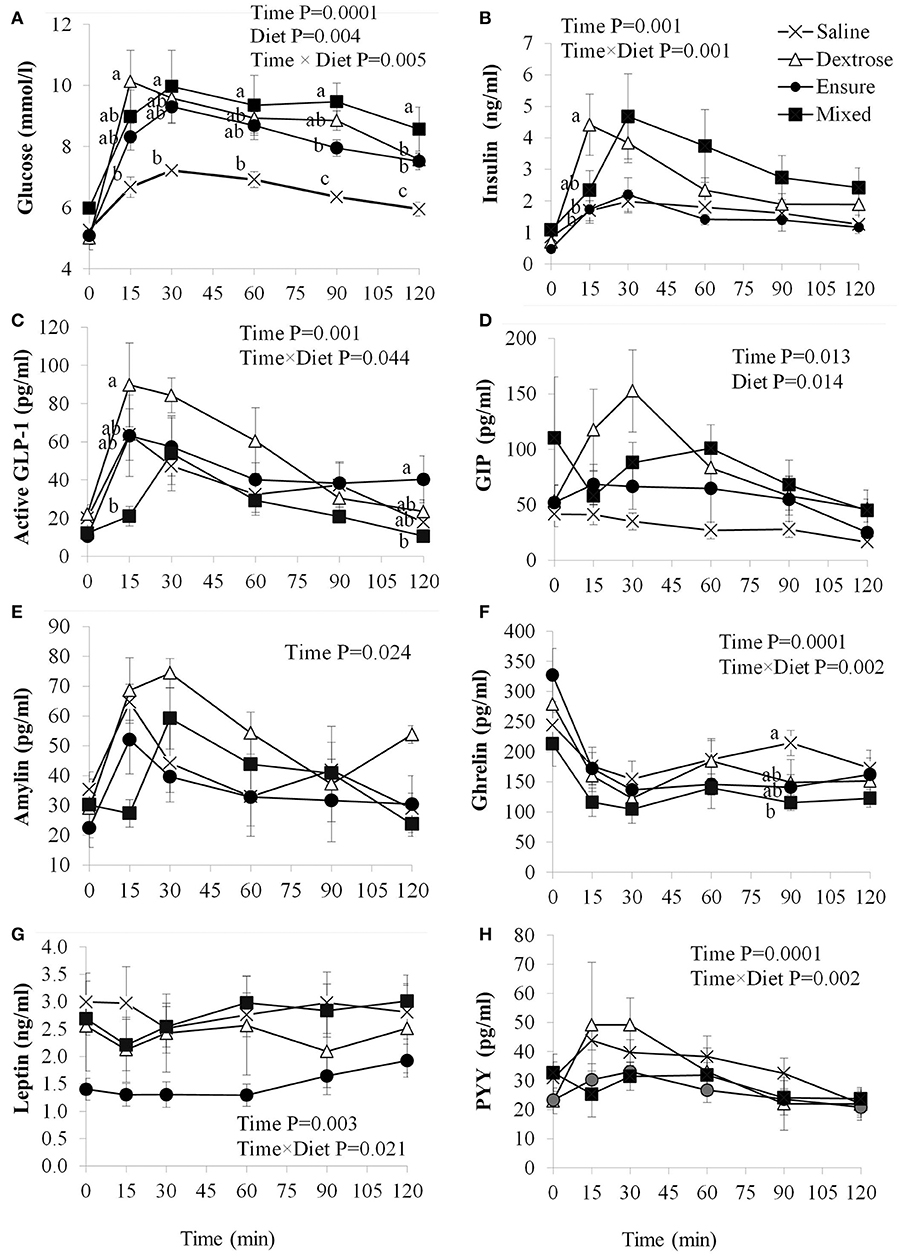
Figure 1. Plasma glucose and satiety hormone response following an oral load of saline, dextrose, Ensure®, or a mixed meal. (A–H) Values are mean±SEM (n = 6). Differences between the oral solutions were measured using one-way ANOVA at each time point. Values with different superscripts are significantly different (P < 0.05).
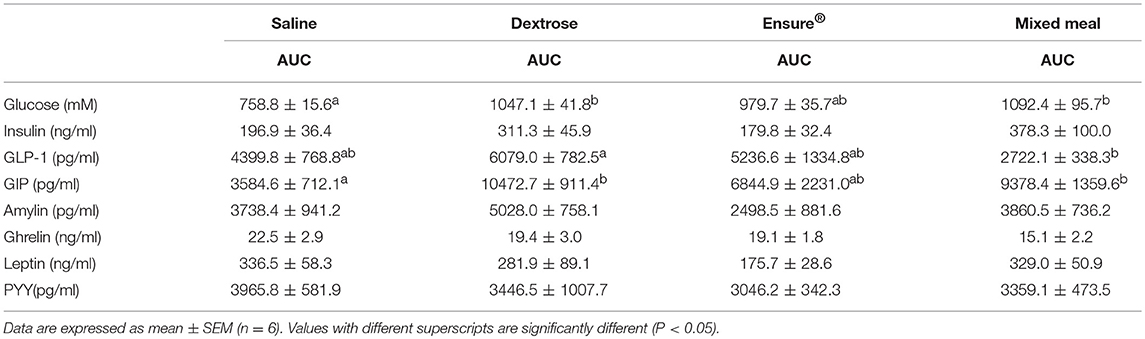
Table 2. Total AUC for glucose and satiety hormones in rats administered saline, dextrose, Ensure®, or a mixed meal (mean ± SEM).
Appetite-Regulating Hormone Response
GLP-1 concentrations were significantly influenced by time (P = 0.001) and time × diet (P = 0.044; Figure 1C). Dextrose elicited a greater GLP-1 response than mixed meal at T15 (P = 0.052) although it was not different from Ensure® and saline. At T120, GLP-1 was higher with Ensure® compared to mixed meal (p = 0.042). Total AUC for GLP-1 was significantly higher for dextrose compared to mixed meal (P = 0.04; Table 2). Plasma GIP was affected by time (P = 0.013) and diet (P = 0.014; Figure 1D). Dextrose (P = 0.014) and mixed meal (P = 0.043) elicited higher total AUC for GIP compared to saline (Table 2). Plasma amylin was only influenced by time (P = 0.024; Figure 1E). There were no differences in amylin total AUC (Table 2). Plasma ghrelin was significantly influenced by time (P = 0.0001) and time × diet (P = 0.001; Figure 1F) with saline having significantly higher ghrelin concentrations compared to mixed meal at T90 (P = 0.049. There were no differences in total AUC, however, for ghrelin (Table 2). Both leptin (Figure 1G) and PYY (Figure 1H) were significantly influenced by time (P < 0.003) and time × diet (P < 0.021), however, post-hoc analysis did not show any significant differences across the time points. There were no differences among groups for total AUC for leptin and PYY (Table 2).
Discussion
Altering circulating satiety hormone levels has emerged as an important target in the treatment and prevention of obesity and associated metabolic disease. The continued development of novel neurohormonal therapeutic strategies for obesity highlights the critical need for preclinical studies to be able to elicit a robust and measurable satiety hormone response (17). Therefore, this experiment evaluated glycemic response and appetite-regulating hormone concentrations across various acute oral nutrient loads. It was anticipated that the secretion of one of the primary satiety hormones of interest, GLP-1, would be greatest following the mixed meal due to the combined macronutrient composition of the treatment (13) and that other related hormones, such as the other incretin GIP or PYY which is co-expressed with GLP-1 in intestinal L cells (18), would react similarly. We also chose to compare a mixed meal treatment that was prepared in-house with the commercially available liquid meal replacement, Ensure®.
We found that both the dextrose and mixed meal treatments elicited a greater blood glucose response compared to saline. This pattern was also reflected in the total AUC for GIP. However, for GLP-1 the dextrose challenge resulted in higher concentrations compared to the mixed meal treatment. This observation may relate to the incretin properties of GLP-1 in which the more rapid rise in blood glucose from baseline to T15 following dextrose treatment elicited a greater response than the slower blood glucose rise seen with the mixed meal treatment (19). The pattern of insulin release over the 120 min was similar to glucose, thereby suggesting a consistent pattern of glycemic and insulinemic response. Amylin is co-secreted with insulin and the changes in amylin from baseline to T15 also reflected insulin secretion with dextrose but less so with the mixed meal (20).
The changes observed between the treatment groups for the orexigenic hormone ghrelin were similar to what we expected. Saline reached a significantly higher concentration at T90 compared to the mixed meal, reflecting a pattern of ghrelin secretion that is typically highest before a meal and subsequently decreases following food consumption (21). Despite finding a significant time × diet effect for leptin and PYY, post-hoc analysis suggested that the four nutrient loads had minimal effect on plasma leptin and PYY concentrations.
An interesting observation in the study was that Ensure®, relative to the other carbohydrate containing solutions, did not elicit a robust appetite-regulating hormone response. Compared to saline, Ensure® was not associated with significantly higher tAUC for any of the outcome variables examined and only one time point (T120) for one hormone (GLP-1) was significantly higher with Ensure® vs. mixed meal. The reason for the blunted response with Ensure® is not clear, but one possibility is that Ensure® contains maltodextrin as a portion of the total carbohydrate content, whereas the carbohydrate in the other solutions was pure dextrose. Maltodextrins are classified according to dextrose equivalents (DE) ranging from 3 to 20 and depending on the DE used in the commercial product, could affect glycemia (22). Furthermore, Ensure® is a commercial meal replacement beverage and contains a full complement of micronutrients. The combined effect of these two notable differences in the composition of Ensure® could explain the blunted glucose and satiety hormone response. These findings are potentially of interest since some scientists may use a commercial meal replacement solution to examine satiety hormone response and the blunted response may mask the true effect of the experimental intervention being tested. While we chose to standardize our formulations based on carbohydrate delivery to the animals, this is a limitation because we did not equalize other components such as the micronutrients or the energy content. Future studies that control for other factors such as this would be needed to determine the influence of these nutrients and compositional factors on satiety hormone release.
While dextrose and mixed meal treatments produced largely similar appetite-regulating hormone profiles, the notable difference was the heightened response of GLP-1 to the dextrose treatment. Given that changes in GLP-1 secretion in response to nutrients and other interventions is of interest to the fields of obesity and diabetes, the robust glycemic and satiety hormone response produced by dextrose and its ease of formulation, may make it an appropriate, if not superior, means of identifying the effects of experimental diets/therapies on biochemical markers of appetite. Differences in the response of some satiety hormones to the two mixed meal formulations suggest that dextrose may represent a more reproducible nutrient stimulus across multiple studies.
Author Contributions
DV and MB were responsible for data acquisition, data analysis and drafting the manuscript. RR was responsible for the study conception and design, data analysis and interpretation. All authors critically reviewed the work and approved the final version.
Funding
This work was supported by a research grant from the Natural Sciences and Engineering Research Council (RGPIN 2016-03773). DV was supported by Natural Sciences and Engineering Research Council of Canada (NSERC) Post-Graduate Scholarship and Alberta Innovates Technology Futures. MB was supported by NSERC Graduate Student Scholarship and Alberta Innovates—Health Solutions.
Conflict of Interest Statement
The authors declare that the research was conducted in the absence of any commercial or financial relationships that could be construed as a potential conflict of interest.
The reviewer IS and handling Editor declared their shared affiliation.
References
1. Kim DD, Basu A. Estimating the medical care costs of obesity in the United States: systematic review, meta-analysis, and empirical analysis. Val Health (2016) 19:602–13. doi: 10.1016/j.jval.2016.02.008
2. Heisler LK, Lam DD. An appetite for life: brain regulation of hunger and satiety. Curr Opin Pharmacol. (2017) 37:100–6. doi: 10.1016/j.coph.2017.09.002
3. Ochner CN, Gibson C, Shanik M, Goel V, Geliebter A. Changes in neurohormonal gut peptides following bariatric surgery. Int J Obes. (2011) 35:153–66. doi: 10.1038/ijo.2010.132
4. Parnell JA, Reimer RA. Prebiotic fibres dose-dependently increase satiety hormones and alter Bacteroidetes and Firmicutes in lean and obese JCR:LA cp rats. Br J Nutr. (2012) 107:601–13. doi: 10.1017/S0007114511003163
5. Zapata RC, Singh A, Chelikani PK. Peptide YY mediates the satiety effects of diets enriched with whey protein fractions in male rats. FASEB J. (2018) 32:850–61. doi: 10.1096/fj.201700519RR
6. Haluzik M, Kratochvilova H, Haluzikova D, Mraz M. Gut as an emerging organ for the treatment of diabetes: focus on mechanism of action of bariatric and endoscopic interventions. J Endocrinol. (2018) 237:R1–17. doi: 10.1530/JOE-17-0438
7. Pucci A, Batterham RL. Mechanisms underlying the weight loss effects of RYGB and SG: similar, yet different. J Endocrinol Invest. (2018). doi: 10.1007/s40618-018-0892-2. [Epub ahead of print].
8. Cani PD, Neyrinck AM, Maton N, Delzenne NM. Oligofructose promotes satiety in rats fed a high-fat diet: involvement of glucagon-like peptide-1. Obes Res. (2005) 13:1000–7. doi: 10.1038/oby.2005.117
9. Berthiaume N, Zinker BA. Metabolic responses in a model of insulin resistance: comparison between oral glucose and meal tolerance tests. Metabolism (2002) 51:595–8. doi: 10.1053/meta.2002.31989
10. Chelikani PK, Shah IH, Taqi E, Sigalet DL, Koopmans HS. Comparison of the effects of Roux-en-Y gastric bypass and ileal transposition surgeries on food intake, body weight, and circulating peptide YY concentrations in rats. Obes Surg. (2010) 20:1281–8. doi: 10.1007/s11695-010-0139-6
11. Murphy R, Stewart AW, Braithwaite I, Beasley R, Hancox RJ, Mitchell EA, et al. Antibiotic treatment during infancy and increased body mass index in boys: an international cross-sectional study. Int J Obes. (2014) 38:1115–9. doi: 10.1038/ijo.2013.218
12. Bodnaruc AM, Prud'homme D, Blachet R, Giroux I. Nutritional modulation of endogenous glucagon-like peptide-1 secretion: a review. Nutr Metab. (2016) 13:92. doi: 10.1186/s12986-016-0153-3
13. Roberge JN, Brubaker PL. Regulation of intestinal proglucagon-derived peptide secretion by glucose-dependent insulinotropic peptide in a novel enteroendocrine loop. Endocrinology (1993) 133:233–40. doi: 10.1210/endo.133.1.8319572
14. Knapper JM, Heath A, Fletcher JM, Morgan LM, Marks V. GIP and GLP-1(7-36)amide secretion in response to intraduodenal infusions of nutrients in pigs. Comp Biochem Physiol C Pharmaol Toxicol Endocrinol. (1995) 111:445–50. doi: 10.1016/0742-8413(95)00046-1
15. Reimer RA, Darimont C, Nicolas-Metral V, Gremlich S, Rüegg UT, Macé K. A human cellular model for studying the regulation of glucagon-like peptide 1 secretion. Endocrinology (2001) 142:4522–8. doi: 10.1210/endo.142.10.8415
16. Herrmann C, Goke R, Richter G, Fehmann HC, Arnold R, Goke B. Glucagon-like peptide-1 and glucose-dependent insulin-releasing polypeptide plasma levels in response to nutrients. Digestion (1995) 56:117–26. doi: 10.1159/000201231
17. Wharton S, Lee J, Christensen RA. Weight loss medications in Canada - a new frontier or a repeat of past mistakes? Diabetes Metab Syndr Obes. (2018) 10:413–7. doi: 10.2147/DMSO.S141571
18. Spreckley E, Murphy KG. The L-Cell in Nutritional Sensing and the Regulation of Appetite. Front Nutr. (2015) 2:23. doi: 10.3389/fnut.2015.00023
19. Brubaker PL. The glucagon-like peptides: pleiotropic regulators of nutrient homeostasis. Ann N Y Acad Sci. (2006) 1070:10–26. doi: 10.1196/annals.1317.006
20. Fehmann HC, Weber V, Goke R, Goke B, Arnold R. Cosecretion of amylin and insulin from isolated rat pancreas. FEBS Lett. (1990) 262:279–81. doi: 10.1016/0014-5793(90)80210-A
21. Tschop M, Smiley DL, Heiman ML. Ghrelin induces adiposity in rodents. Nature (2000) 407:908–13. doi: 10.1038/35038090
Keywords: glycemia, satiety hormones, oral glucose tolerance test, meal tolerance test, glucose response
Citation: Vannan DT, Bomhof MR and Reimer RA (2018) Comparison of Glucose and Satiety Hormone Response to Oral Glucose vs. Two Mixed-Nutrient Meals in Rats. Front. Nutr. 5:89. doi: 10.3389/fnut.2018.00089
Received: 03 July 2018; Accepted: 07 September 2018;
Published: 26 September 2018.
Edited by:
Christophe Matthys, KU Leuven, BelgiumReviewed by:
Ilse Scroyen, KU Leuven, BelgiumClaudio Esteban Perez-Leighton, Pontificia Universidad Católica de Chile, Chile
Copyright © 2018 Vannan, Bomhof and Reimer. This is an open-access article distributed under the terms of the Creative Commons Attribution License (CC BY). The use, distribution or reproduction in other forums is permitted, provided the original author(s) and the copyright owner(s) are credited and that the original publication in this journal is cited, in accordance with accepted academic practice. No use, distribution or reproduction is permitted which does not comply with these terms.
*Correspondence: Raylene A. Reimer, cmVpbWVyQHVjYWxnYXJ5LmNh