- 1Department of Biomedical Informatics, Ajou University School of Medicine, Suwon, Republic of Korea
- 2MDHi Corp, Suwon, Republic of Korea
- 3Department of Neurology, Ajou University School of Medicine, Suwon, Republic of Korea
- 4Department of Convergence Healthcare Medicine, Graduate School of Ajou University (ALCHeMIST), Suwon, Republic of Korea
- 5Department of Biomedical Science, Ajou University Graduate School of Medicine, Suwon, Republic of Korea
- 6Department of Biomedical Systems Informatics, Yonsei University College of Medicine, Seoul, Republic of Korea
- 7Center for Digital Health, Yongin Severance Hospital, Yongin, Republic of Korea
Introduction: Delirium, frequently experienced by ischemic stroke patients, is one of the most common neuropsychiatric syndromes reported in the Intensive Care Unit (ICU). Stroke patients with delirium have a high mortality rate and lengthy hospitalization. For these reasons, early diagnosis of delirium in the ICU is critical for better patient prognosis. Therefore, we developed and validated prediction models to classify the real-time delirium status in patients admitted to the ICU or Stroke Unit (SU) with ischemic stroke.
Methods: A total of 84 delirium patients and 336 non-delirium patients in the ICU of Ajou University Hospital were included. The 8 fixed features [Age, Sex, Alcohol Intake, National Institute of Health Stroke Scale (NIHSS), HbA1c, Prothrombin time, D-dimer, and Hemoglobin] identified at admission and 12 dynamic features [Mean or Variability indexes calculated from Body Temperature (BT), Heart Rate (HR), Respiratory Rate (RR), Oxygen saturation (SpO2), Systolic Blood Pressure (SBP), and Diastolic Blood Pressure (DBP)] based on vital signs were used for developing prediction models using the ensemble method.
Results: The Area Under the Receiver Operating Characteristic curve (AUROC) for delirium-state classification was 0.80. In simulation-based evaluation, AUROC was 0.71, and the predicted probability increased closer to the time of delirium occurrence. We observed that the patterns of dynamic features, including BT, SpO2, RR, and Heart Rate Variability (HRV) kept changing as the time points were getting closer to the delirium occurrence time. Therefore, the model that employed these patterns showed increasing prediction performance.
Conclusion: Our model can predict the real-time possibility of delirium in patients with ischemic stroke and will be helpful to monitor high-risk patients.
1 Introduction
Delirium, an acute neuropsychiatric syndrome, is characterized by a sudden loss of attention, change in consciousness level, and fluctuating cognitive impairments, including memory dysfunction (Inouye et al., 2014). It occurs in one-third of the hospitalized older adults aged ≥70 years and more than half of the patients requiring mechanical ventilation (Marcantonio, 2017; Almeida et al., 2014). Clinically, delirium is an independent factor associated with poor outcomes in various study groups (Wilson et al., 2020) and is associated with higher mortality, longer hospital stay, worse functional outcomes, and sustained cognitive dysfunction even after discharge (Wilson et al., 2020; Pandharipande et al., 2013; Kosar et al., 2017; Burry et al., 2019).
Early diagnosis of delirium is important because timely administration of relevant drugs is critical for delirium management (Flinn et al., 2009; Barr et al., 2013). Recent studies showed that several pharmacological agents including haloperidol and nonpharmacological multi-component interventions could be useful for reducing the incidence, duration, recurrence, and mortality in ICU patients (Wang et al., 2012; van den Boogaard et al., 2013; Milbrandt et al., 2005; Schneider et al., 2005; Duan et al., 2018; Oliven et al., 2021; Rohatgi et al., 2019). However, delirium is often misdiagnosed as pain or depression and the subtle changes in the initial stages of delirium are overlooked (Inouye et al., 2001; de la Cruz et al., 2015; Han et al., 2009).
Several delirium assessment tools, rather than diagnostic criteria, have been developed for accessibility and episodic use when delirium is suspected or for regular monitoring of new-onset delirium (American Psychiatric Association D, Association AP, 2013; Sartorius et al., 1993). The assessment tools include the Confusion Assessment Method (CAM), the Confusion Assessment Method for the ICU (CAM-ICU), 4A’s Test (4AT), and Intensive Care Delirium Screening Checklist (ICDSC) (Inouye et al., 1990; Ely et al., 2001; Bellelli et al., 2014). Furthermore, prediction models including delirium assessment tools such as prediction diagnostic tools (PRE-DELERIC) and early predication model (E-PRE-DELERIC) have been developed for ICU patients (van den Boogaard et al., 2012; van den Boogaard et al., 2014; Wassenaar et al., 2015). In addition, the Lanzhou and the VR-PRE-DELIRIC models were developed using Machine Learning (ML) models based on prospective data. The R-PRE-DELIRIC model also proposed a prediction model using Logistic Regression (LR) (Green et al., 2019; van den Boogaard et al., 2014; Lee et al., 2017). However, these prediction models are clinically limited because they can predict occurrence of delirium at a specific time point such as admission.
The precise mechanism underlying the development of delirium is unclear. However, the postulated mechanisms include neurotransmitters, inflammation, physiological stressors, metabolic derangements, electrolyte disorders, and genetic factors (Inouye et al., 2014; Wilson et al., 2020). Further, evidence shows that delirium is associated with Autonomic Nervous System (ANS) instability (Liem and Carter, 1991; Jooyoung et al., 2017). A previous study has suggested that blood pressure and heart rate are related to autonomic function in patients with delirium (Oh et al., 2018).
In this study, we aimed to develop a novel ML model to predict occurrence of delirium using fixed and dynamic features associated with ANS, as ML techniques can be useful for analyzing complex signals in continuous data-rich environments such as ICUs. The proposed approach utilizes various methods to extract complex biosignal features for early detection and management of delirium in ICU settings. In addition, since the confounders of delirium are diverse and complex, we aimed to apply this model to a single neurological disease such as ischemic stroke to minimize the disease-related confounding variables. We also validate the applicability of ML-based delirium prediction models in clinical practice through simulation-based and temporal evaluation with clinical dashboard.
2 Materials and methods
In this section, we will experiment with various ML models using fixed features from Electronic Medical Records (EMR) and dynamic features from biosignals (i.e., vital signs) as well as the selection of important variables. Additionally, the final model will be validated using a simulation-based and temporal evaluation to verify its applicability in clinical settings.
2.1 Data sources
This study included patients with ischemic stroke admitted to the Neuro ICU (NCU) and SU of Ajou University Hospital. Patients with acute stroke are admitted either to the NCU or the SU. Patients admitted to the NCU typically have more severe strokes; admissions to the NCU or SU may also be based on room availability rather than stroke severity. Patients in the NCU are transferred to the SU once their condition stabilizes; however, close observation remains required. The incidence of delirium was 25% in the SU and 31% in the NCU. Data from July 2019 to December 2020 were utilized for model development and retrospective evaluation, while data from March 2023 to May 2023 were used for temporal evaluation.
2.2 Input variables
The fixed features at admission were based on the initial data collected at the time of admission, which were extracted from the EMR, and the dynamic features based on vital signs were extracted from the electronic medical records and patient monitoring device. The dynamic features comprised HR, RR, SpO2, DBP, and SBP, for which one measurement was taken every minute. BT was measured hourly. We used the dynamic features before event onset and fixed features obtained at ICU admission to reflect the precipitating and predisposing factors, respectively. All laboratory tests were performed within 24 h of hospitalization.
2.3 Primary outcome
The study patients were selected and divided into case and control groups according to their delirium status based on the CAM-ICU or ICDSC assessed by the nurse at the NCU and SU. The CAM-ICU or ICDSC was used in combination with thorough chart reviews of clinical data and nursing records by two trained neurologists for the final subject selection. Patients positive on CAM-ICU or those with an ICDSC score of ≥4 were considered to have delirium at admission. The ICDSC was measured by a nurse periodically every 8 h and immediately at the NCU or SU if delirium was suspected. As the final step, a neurologist confirmed the diagnosis of delirium. For primary outcome labeling, we classified two groups: delirium and non-delirium. Subsequently, we used a 30-min period right before the event occurrence for prediction time for model development. Finally, we divided the 16-h period right before the occurrence of the event into 2-h observation windows. Then, we labeled four observation windows that were close to the event as positive for delirium status (pre-delirious period) and others as negative for non-delirium status (non-delirious period) for simulation-based evaluation, because the evaluation of delirium was conducted every 8 h usually (Figure 1).
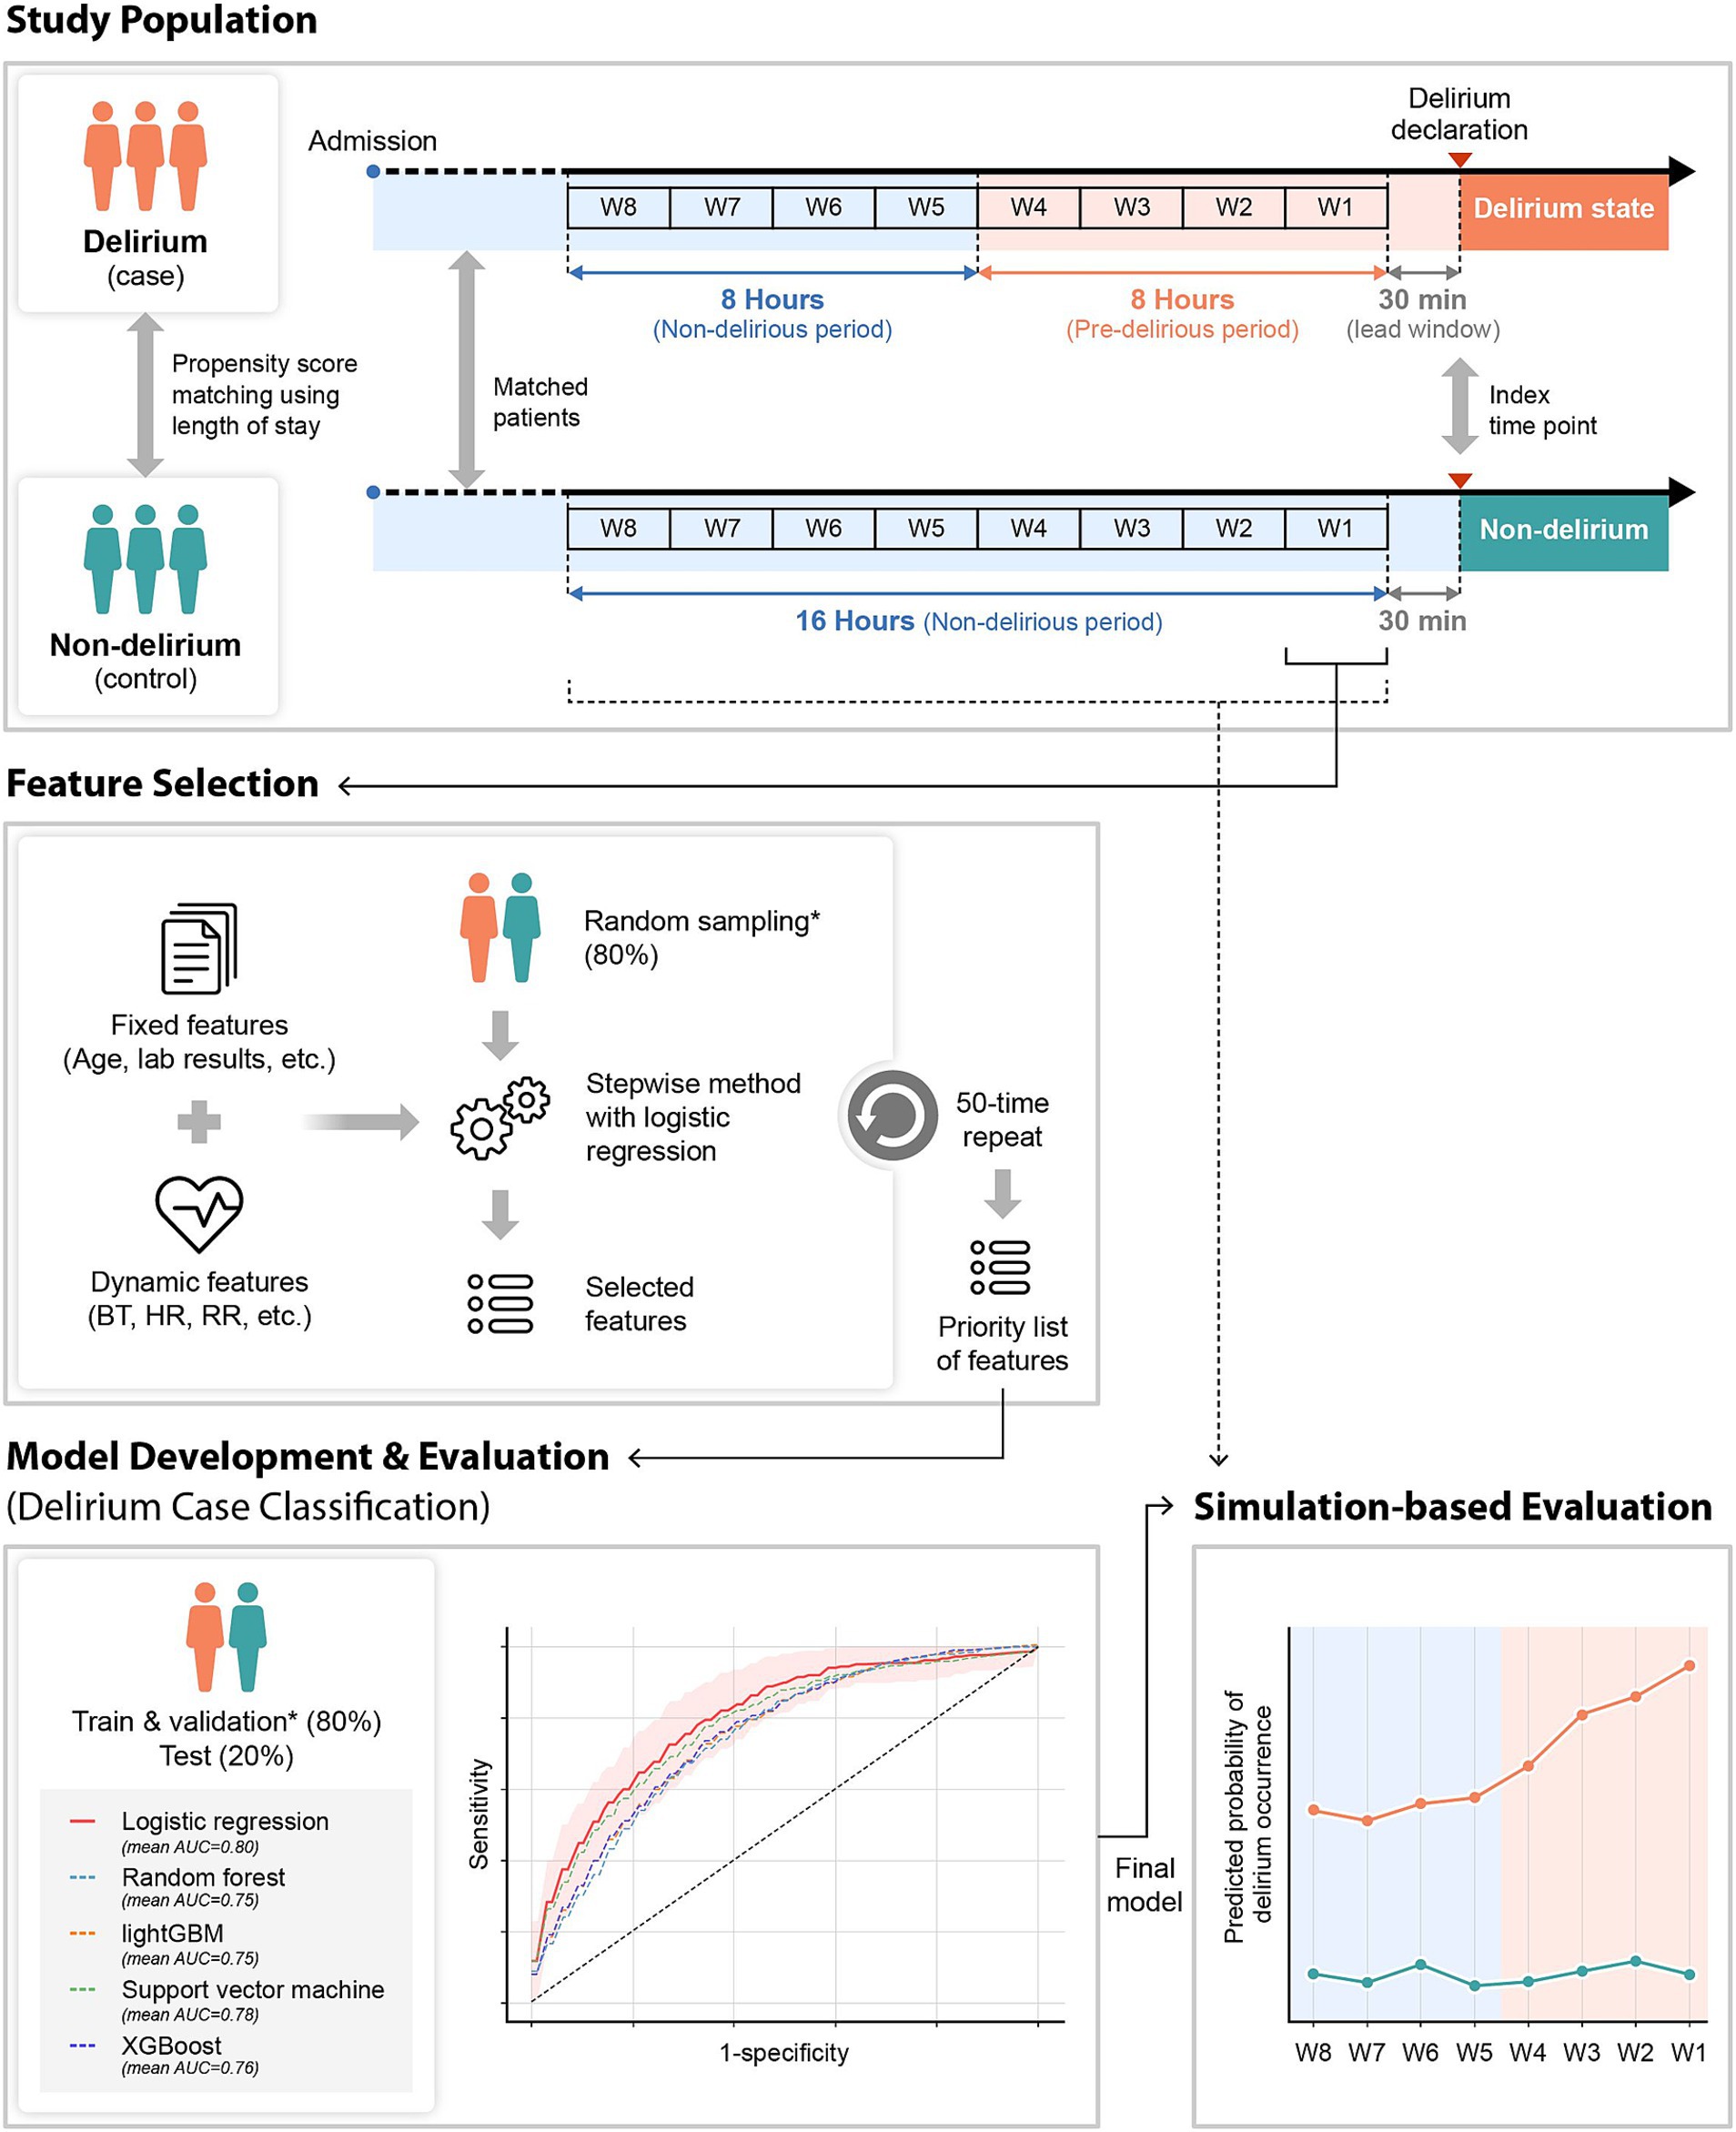
Figure 1. Overview of the study design. Fixed and dynamic features were used for the delirium prediction model development. For model development, dynamic features that were collected 2 h before the time point of delirium occurrence (case group) or matched time point (control group) were utilized. The stepwise method was used for feature selection. With the selected features, several machine learning algorithms were used and evaluated for model development. The final selected model was evaluated in a simulation environment by applying the model from 16 h before to the index time point every 2 h. W1–W8: the observation window 1–8; *the same dataset. BT, body temperature; HR, heart rate; RR, respiratory rate.
2.4 Data preprocessing
2.4.1 Dynamic feature extraction
All dynamic features were vital sign-based features, and they were extracted from the data of the 2-h observation period. The mean, Standard Deviation (SD) of vital signs were obtained from all 2-h observation periods. When we compared the statistical values between the case and control groups, BT and HR variables showed significant differences. However, basic statistical values like SD were not enough to capture the complex patterns in the biosignal data. As a result, we used advanced analytical methods to extract variability features. The time domain, and non-linearity were used for variability calculation. In the case of waveform data, frequency domain features were also extracted.
Dynamic features reflecting variability were calculated using Poincaré plot, Detrended Fluctuation Analysis (DFA), and sample entropy to capture short-and long-term variability, correlations, and irregularity in time-series data. Poincaré plot is a geometrical method of graphing each data point against the next data point, providing insight into patterns within the data measured over the short term (Karmakar et al., 2009; Woo et al., 1992). DFA measures the long-range correlation and dependencies of a time series over a range of time scales (Peng et al., 1994). Sample Entropy quantifies the complexity and measures the irregularity within time series data. Lower value means regularity, and higher value means irregularity (Yentes et al., 2019; Richman and Moorman, 2000). These methods are widely used in time-series analysis for physiological signals. Detailed methodologies for each approach can be found in Karmakar et al. (2009), Woo et al. (1992), Peng et al. (1994), Yentes et al. (2019), and Richman and Moorman (2000).
All variability metrics used are summarized in Supplementary Table S1. The electrocardiogram (ECG) waveform was collected in the most recent 30 min in each observation window, and the variability of respiratory rate interval was extracted through ECG that was down-sampled at 125 Hz (Figure 2).
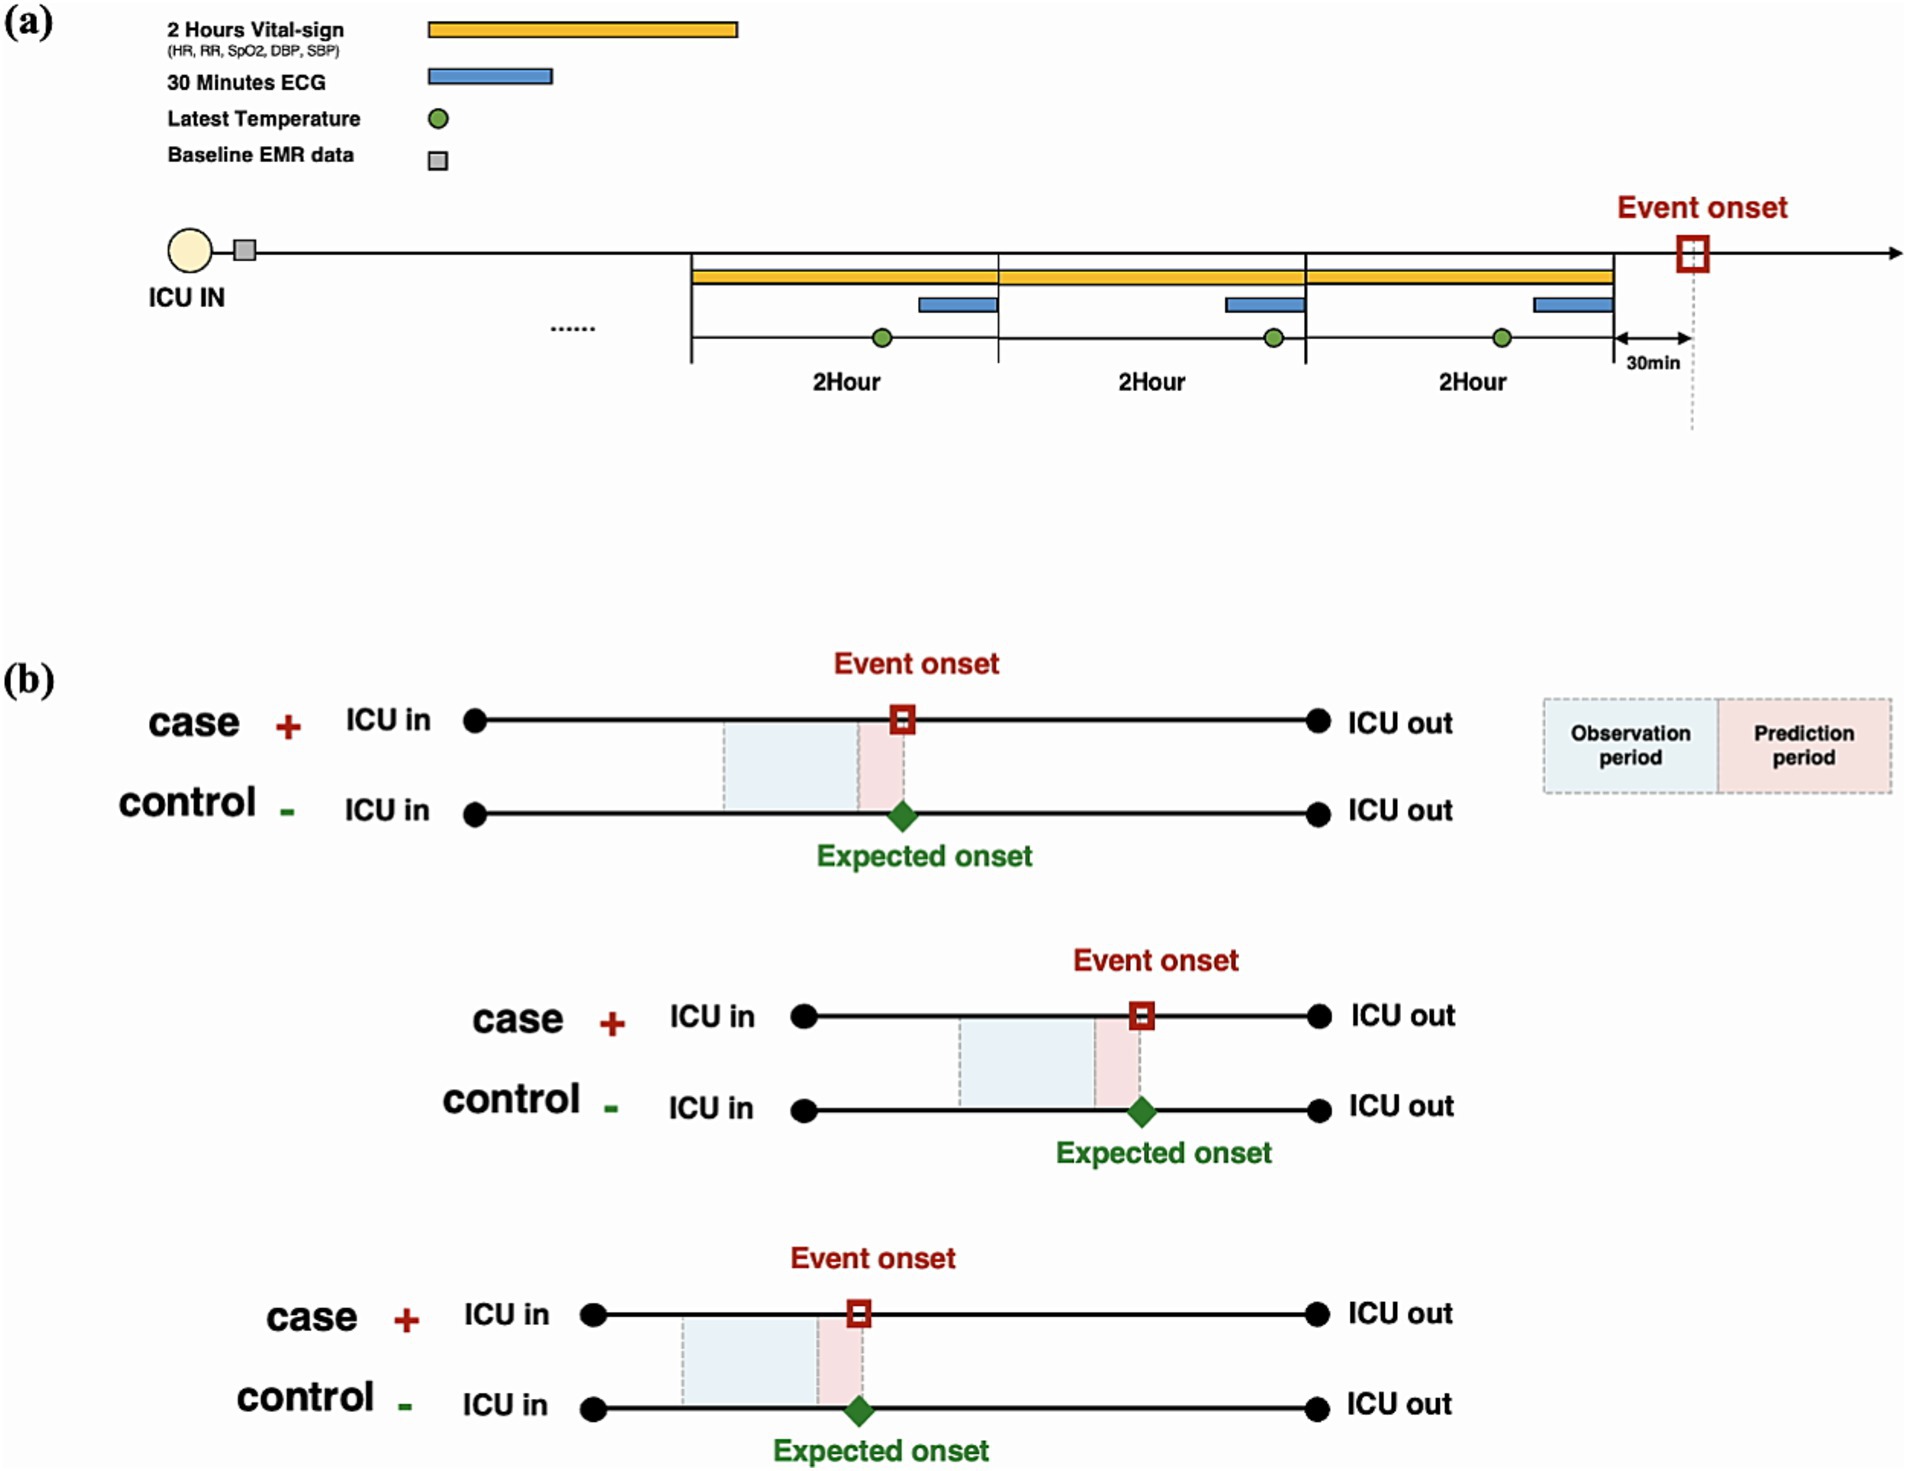
Figure 2. Input variable extraction strategy in each observation time window. (A) In addition to baseline data at admission, 2-h vital signs, the latest 30-min electrocardiogram, and body temperature measurement in each time window are used for model training. (B) All patients are matched by the length of stay in the intensive care unit using the propensity score matching method.
2.4.2 Imputation
The problem of missing values is common in clinical data, and the dataset of the model developed also had missing values. To solve this problem, we experimented using mean value replacement, median value replacement, and Multivariate Imputation by Chained Equations (MICE) replacement methods, and the MICE method with the best performance was finally adopted. The MICE algorithm can impute both continuous and categorical data, and it can simultaneously estimate missing values for multiple variables. This method not only considers the relationships between each variable but also performs multiple iterations of imputation. Details about the MICE methodology are in Azur et al. (2011).
2.5 Study design
The study flow diagram is shown in Figure 3. Model development was based on a case–control study to analyze patients with and without delirium. The study included 707 patients with acute stroke admitted to the SU and NCU at Ajou University Hospital from July 2019 to December 2020. Among the 707 patients with stroke admitted to the ICU at Ajou University Hospital, 138 were excluded because delirium already occurred before admission to the ICU (n = 7), delirium occurred within 2 h of ICU admission (n = 12), and ICU Length Of Stay (LOS) was either too short (<12 h, n = 104) or too long (≥20 days, n = 15). The remaining 84 and 485 patients with and without delirium, respectively, were matched using the Propensity Score Matching (PSM) method. PSM is a method with LR to match two groups into a comparable state. Details has been described in Peter (2011). We used PSM to control confounding factors between delirious patients and non-delirious patients. The LOS variable was used to match patients with and without delirium (within 1-day difference). The LOS was chosen as the matching variable because it indicates patient severity, and the time of data extraction needs to be the same for patients with and without delirium. Therefore, the data could be extracted at similar time points for patients with and without delirium with a similar level of severity. The temporal validation cohort consisted of 149 patients admitted from January to May 2023; 115 were included after applying the exclusion criteria.
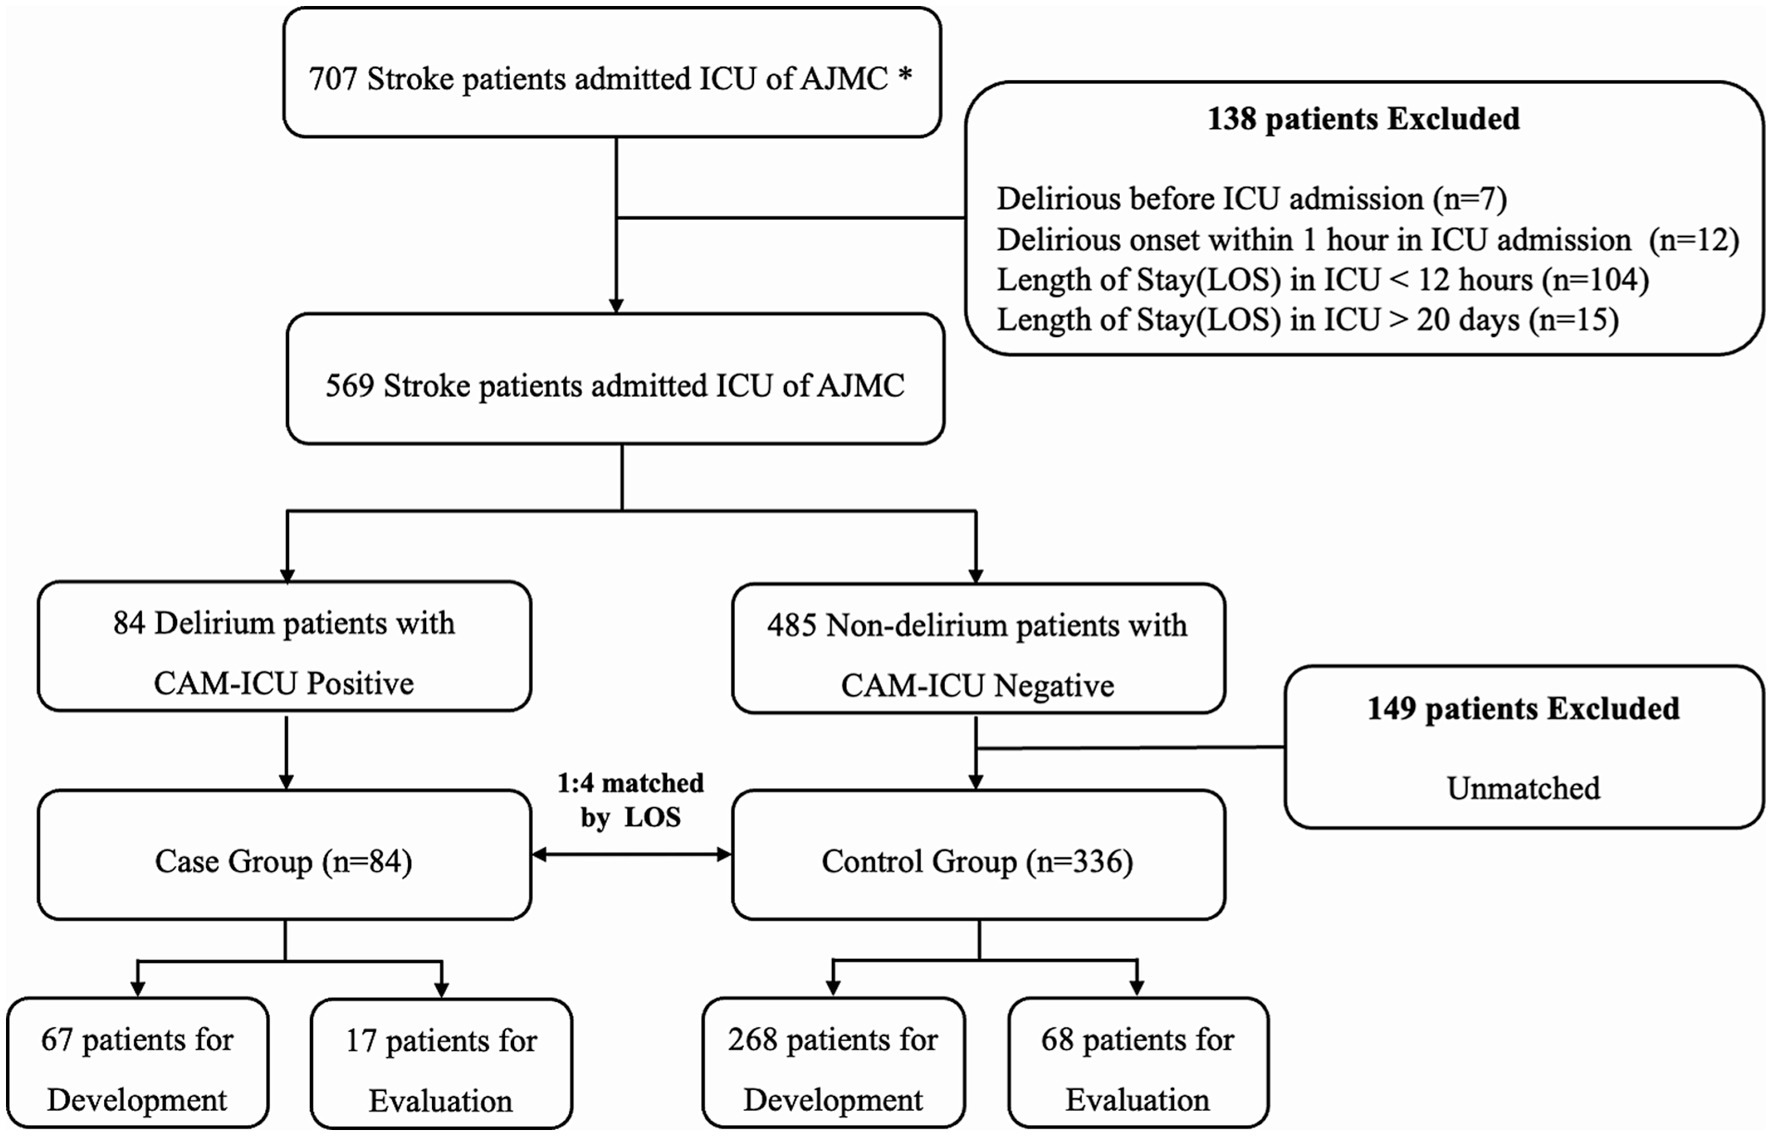
Figure 3. Inclusion and exclusion criteria for model development. All patients admitted to the intensive care unit (ICU) between July 2019 and December 2020 were enrolled. Two trained neurologists selected all patients by reviewing clinical data and nursing records. Finally, 67 patients with delirium (case group) and 268 patients without delirium (control group) were used for model development, and 90% were used for training and 10% for validation. In total, 17 patients with delirium and 68 patients without delirium were used for model evaluation. *AUMC, Ajou University Medical Center; CAM, confusion assessment method.
2.6 ML model
2.6.1 Model development
We developed the model to predict occurrence of delirium in the ICU in 420 patients with stroke. After data preprocessing and extraction, we split the entire dataset patient-wise. The case and control groups were randomly divided into the training set (80%) and test set (20%) and then stratified to unify the labeling ratio of each dataset (case:control = 1:4 for the training set and case:control = 1:4 for the test set). Then, 10% of the training set was divided into the validation set for hyperparameter tuning (Figure 4).
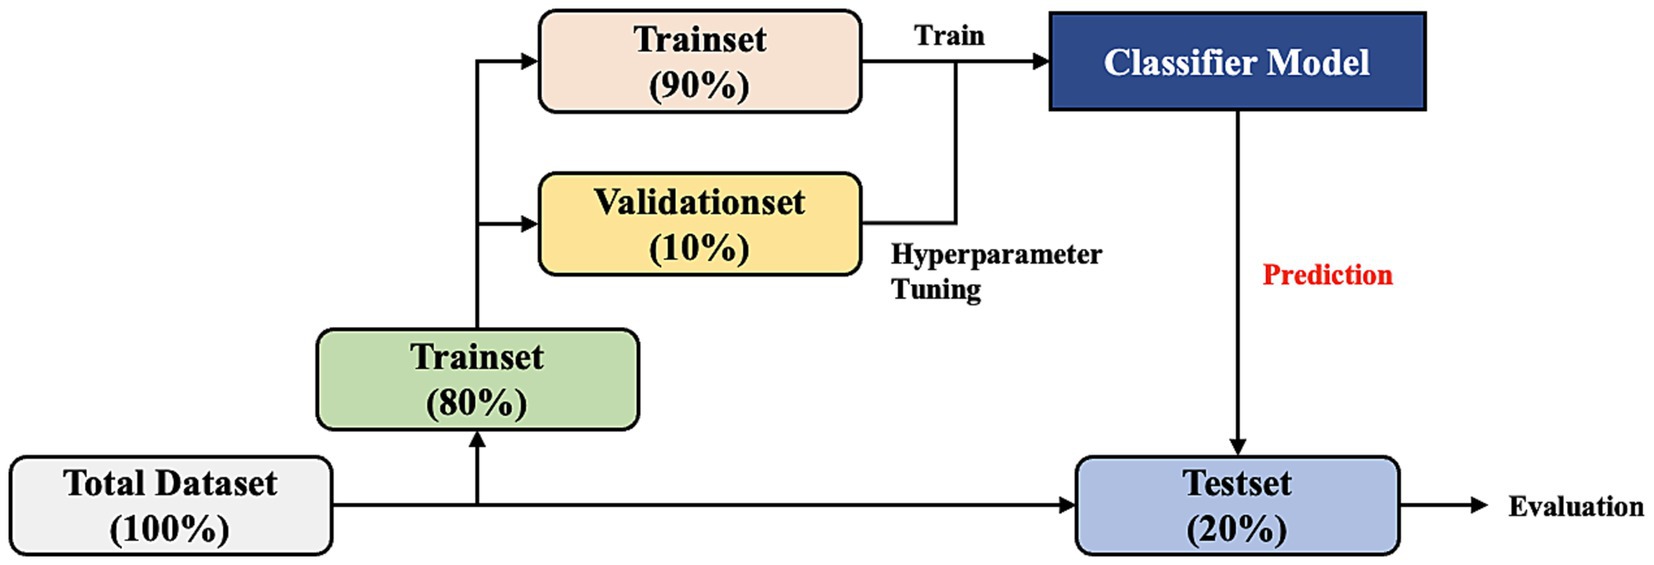
Figure 4. Dataset split workflow. The total dataset is divided by patient into the training set (80%) and test set (20%). Then, 10% of the training set is divided into the validation set for hyperparameter tuning of the model.
To measure the generalized model performance, the training, validation, and test datasets were randomly split 50 times. Finally, we prepared 50 datasets to train and evaluate the delirium prediction model.
We conducted feature reduction for removing model complexity. We extracted 109 features. To reduce unimportant features and overcome the limitations of a small dataset, we applied a stepwise statistical variable selection method to finalize the predictors. The stepwise selection method was used for each of the 50 different training sets described above. A variable that was selected many times during 50 iterations was listed as the higher priority. For example, the variable selected 50 times in all iterations was defined as the most important feature, and the variable selected 0 times in all iterations was defined as the most unimportant feature.
Stepwise variable selection using a p-value of 0.05 as an inclusion and exclusion threshold was performed for adding statistically significant variables and those that were not. By using this method, it enabled us to find the most informative features and reduce the complexity of the model that prevented overfitting. This not only helped the generalization of the model, especially with small datasets, but also reduced noise variance and protected the algorithm from overparameterization.
Owing to the limited number of data samples, we could not use a deep-learning model. Thus, we used machine-learning models. Most prior studies presented models using LR. In contrast, we used multiple models for performance comparison and analysis. The LR, Random Forest (RF), LightGBM (LGBM), Support Vector Machine (SVM), and XGBoost (XGB) were used for training the developed delirium prediction model. Each algorithm m was trained 50 times with 50 training datasets. We also developed and compared models using different number of features (top 10, top 20, top 30, top 40, top 50, and all features from the feature priority list).
2.6.2 Classification evaluation
The performance of the model used to classify delirium status 30 min before the event onset was assessed. The mean performance and 95% CI for the 50 models developed were measured. The optimal cut-off was defined using Youden’s index in the validation dataset to set the cut-off of the model prediction. The Youden’s Index is a method to find the optimal threshold that maximizes sensitivity and specificity, which is useful even when the class is unbalanced (Fluss et al., 2005). The indicators of performance were AUROC, average area under the precision-recall curve (AUPRC), accuracy, precision, recall, F1 score, sensitivity, and specificity. Additionally, to verify the influence of the bio-signal data, the variables were categorized as follows for comparison: top 20 features among only fixed features, top 20 features among only dynamic features, and top 20 features among both fixed and dynamic features.
2.6.3 Simulation-based evaluation
To apply the model in the real clinical environment, the model needs to predict continuously from the time patients are admitted to the ICU. For this simulation-based evaluation, we applied the trained model to evaluate in test set using all observational windows defined in Figure 1 (i.e., window1–8). Then, we confirmed the trend of the model’s prediction probability during 16 h before event occurrence in every 2-h time window. This simulation based evaluation approach can reflect clinical workflows and make timely predictions to help clinicians and nurses make clinical decisions based on real-time data.
2.6.4 Temporal evaluation
We validated our model temporally using a specialized user interface designed for this task (Figure 5). This model was employed for all stroke patients admitted to the SU and the NCU from March 1 through May 3, 2023. Temporal validation process was executed in three stages. First, the discriminative capability of the model was evaluated by differentiating the onset of delirium (using data from within 2 h before delirium event documentation) from a matched non-delirium group. Next, the model’s ability to forecast the risk of delirium onset during the 16 h leading up to a delirium event was compared. Within this period, the 8 h immediately before the 16 h of delirium were explicitly designated as the “pre-delirious period,” consistent with our retrospective validation method. These first two stages adopted the same approach used in our retrospective validation. Finally, the model was applied throughout the patient’s ICU stay. An 8-h “pre-delirious period” before any confirmed delirium event was set for detection. Observations were ended at the time of the first confirmed delirium event or upon the patient’s discharge.
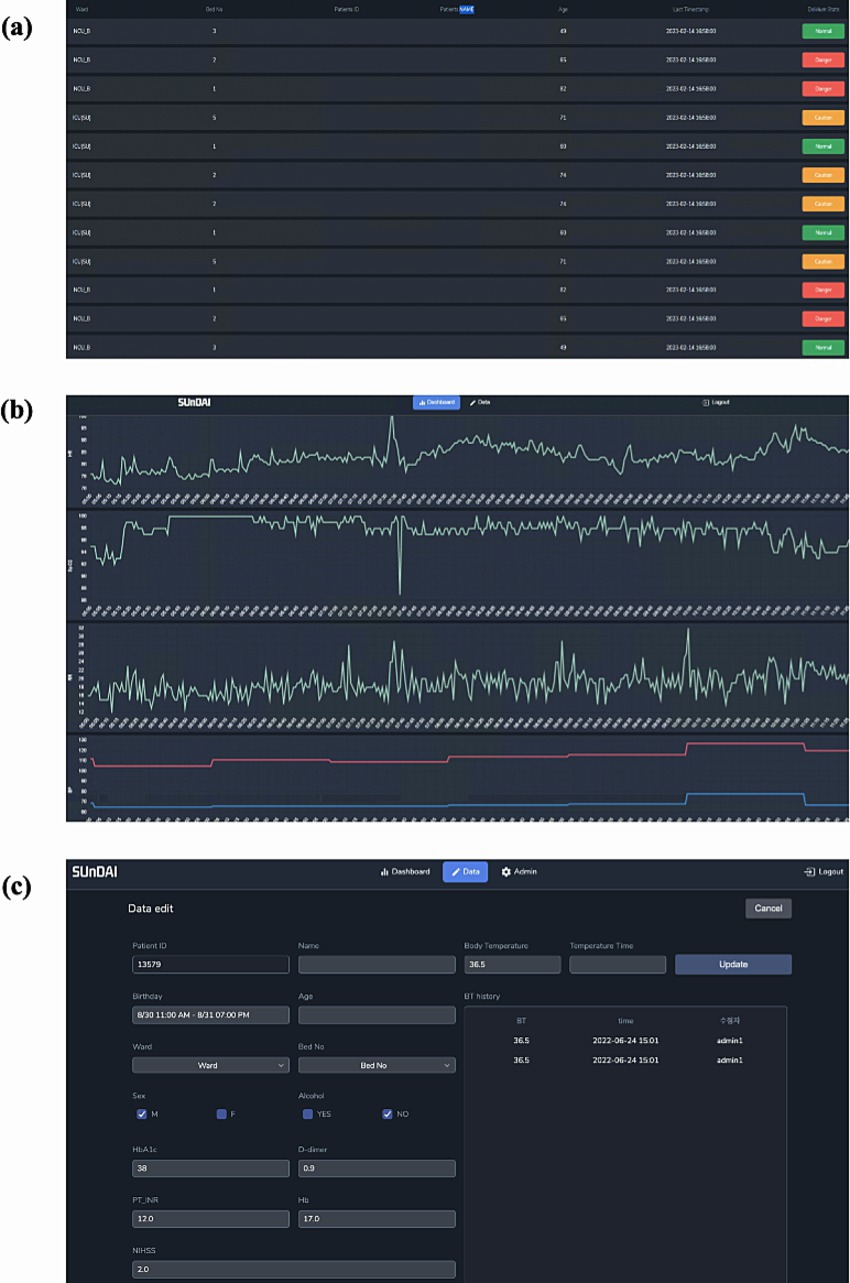
Figure 5. Delirium occurrence alarm system embedded in the prediction model. This image shows the clinical dashboard user interface used for temporal validation. (A) Alarm Dashboard page, (B) Model Prediction and vital sign trend view page, and (C) Data input page.
2.6.5 Statistical analysis
Univariate analysis was performed to statistically compare independent variables between the case and control groups. For continuous data such as HR and SpO2, the between-group variation was analyzed using the two-sample two-tailed t-test. For categorical data such as sex, smoking, and alcohol drinking, the chi-squared test was used. The level of significance was set at p < 0.05.
2.6.6 Software
All analyses were performed using Python version 3.7, the Python package scikit learn 1.0.1, pandas 1.1.5, numpy 1.19.5, scipy 1.4.1, and pyhrv 0.4.0. The Python packages Matplotlib 3.2.2 and Seaborn 0.11.2 were also used to visualize the data and results.
3 Results
3.1 Baseline characteristics
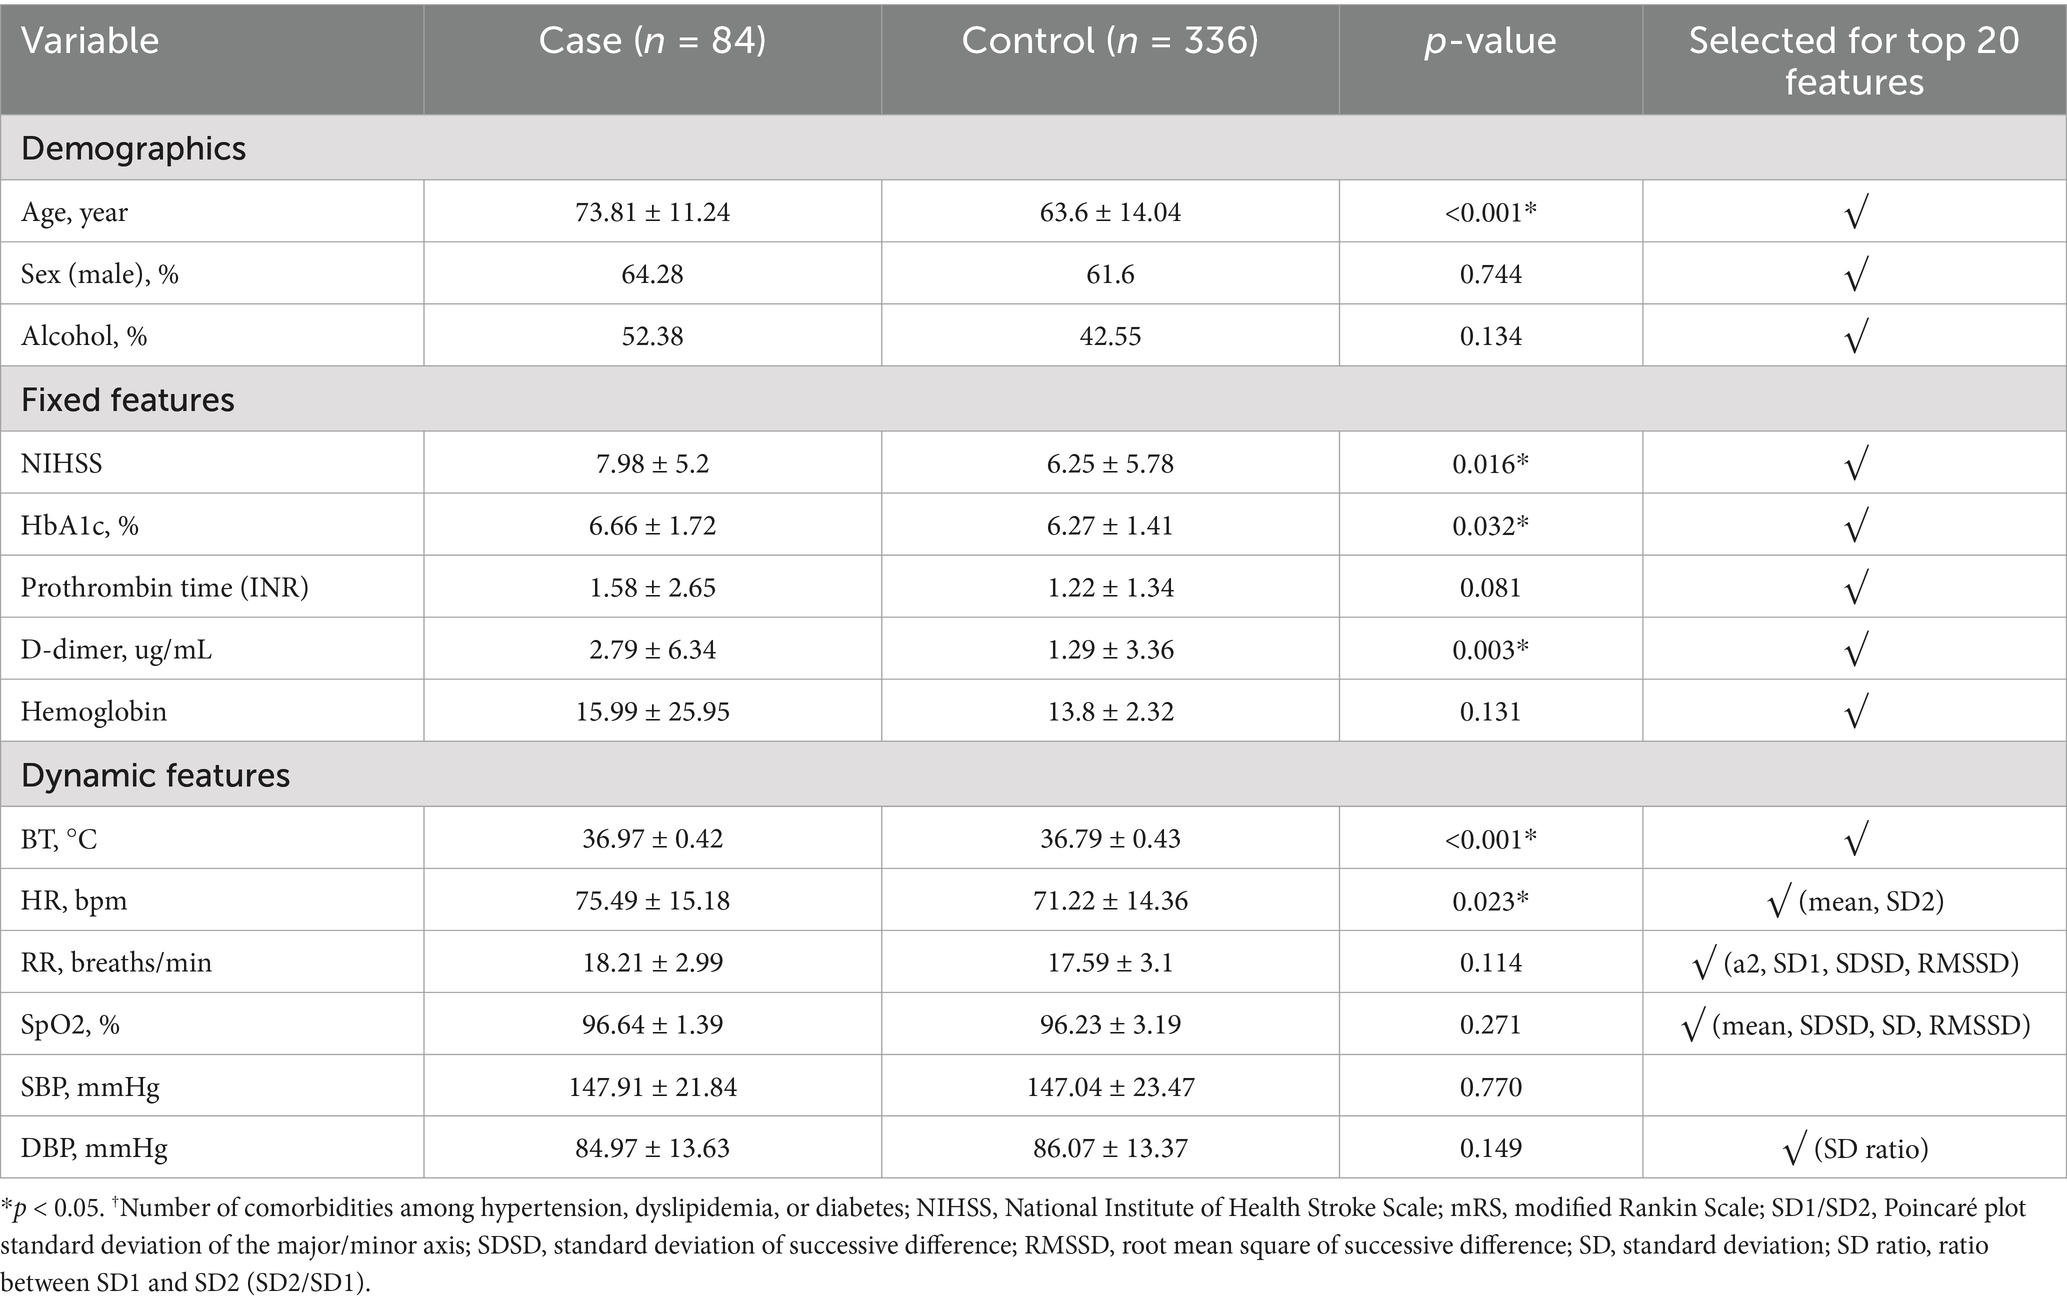
The baseline characteristics of the case and control groups are presented in Supplementary Table S2. The NIHSS score indicating stroke severity (p = 0.016), premorbid modified Rankin Scale (mRS) score (p = 0.013), and number of older patients (p < 0.001) were higher in the case group than in the control group. In addition, the HR (p = 0.023), RR (p < 0.001) and BT (p < 0.001) were significantly higher in the case group than in the control group. The variability features are shown in Supplementary Table S3.
3.2 Models for prediction of delirium occurrence
The result of variable selection across all variables is shown in Figure 6. The top 50 variables were evaluated for model development: 17 variables were from the fixed features (clinical features at admission) and 33 variables from the dynamic features (features based on vital signs). Finally, 20 variables—8 variables from the fixed features and 12 variables from the dynamic features—were selected for the final model (Table 1).
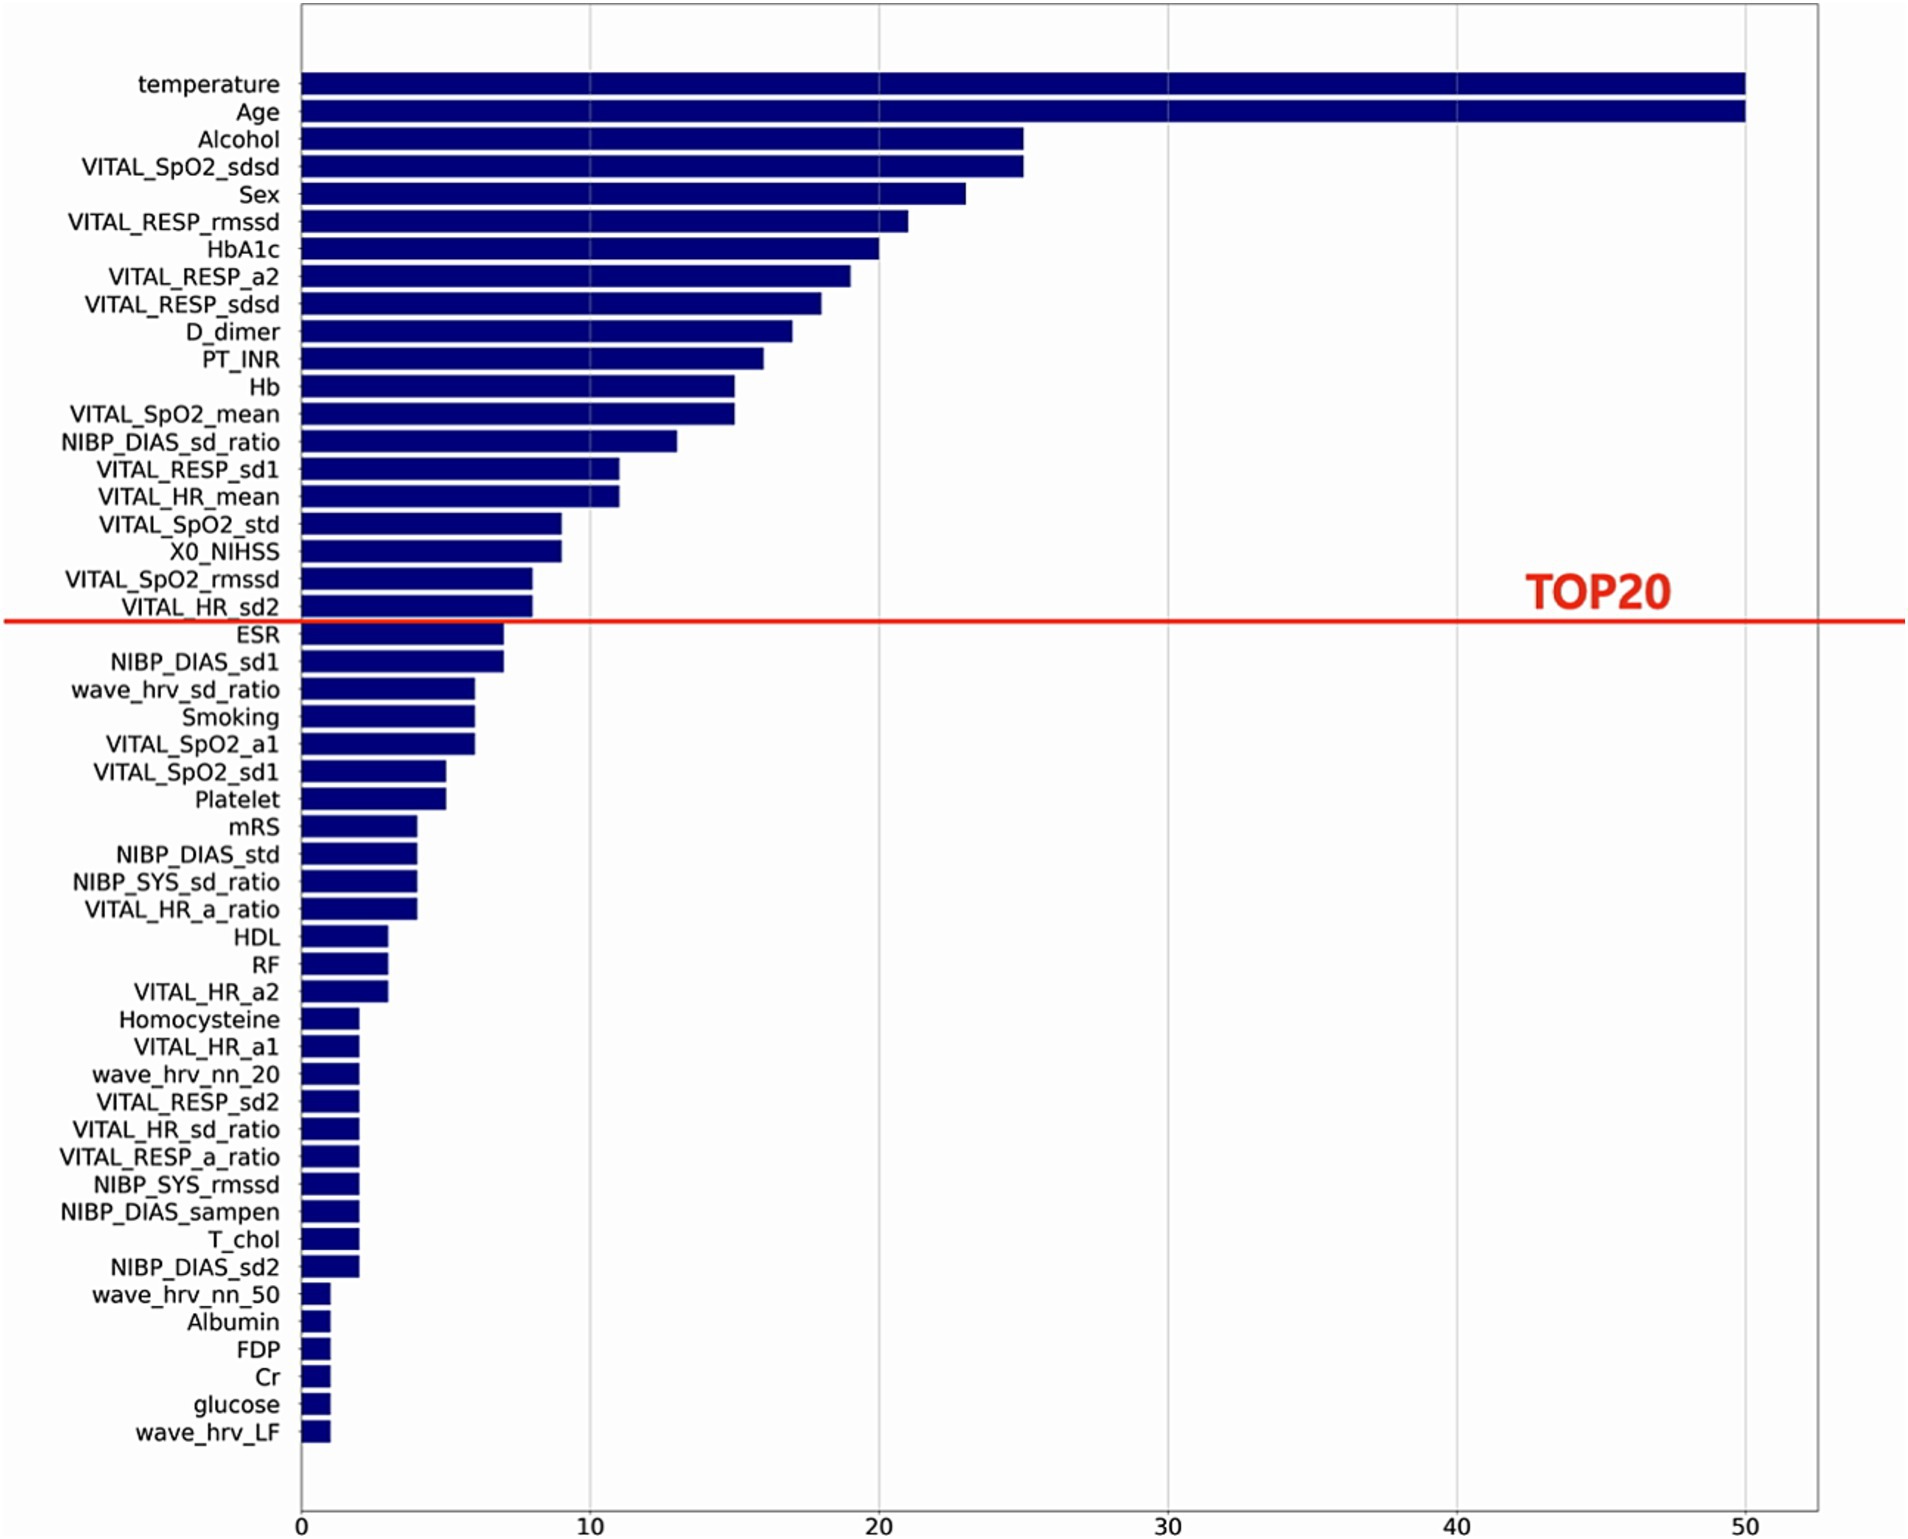
Figure 6. Feature selection results. This plot shows the final variable list selected through stepwise feature selection method. The final ML model included top 20 features.
3.3 Model performance
3.3.1 Evaluation of delirium event classification
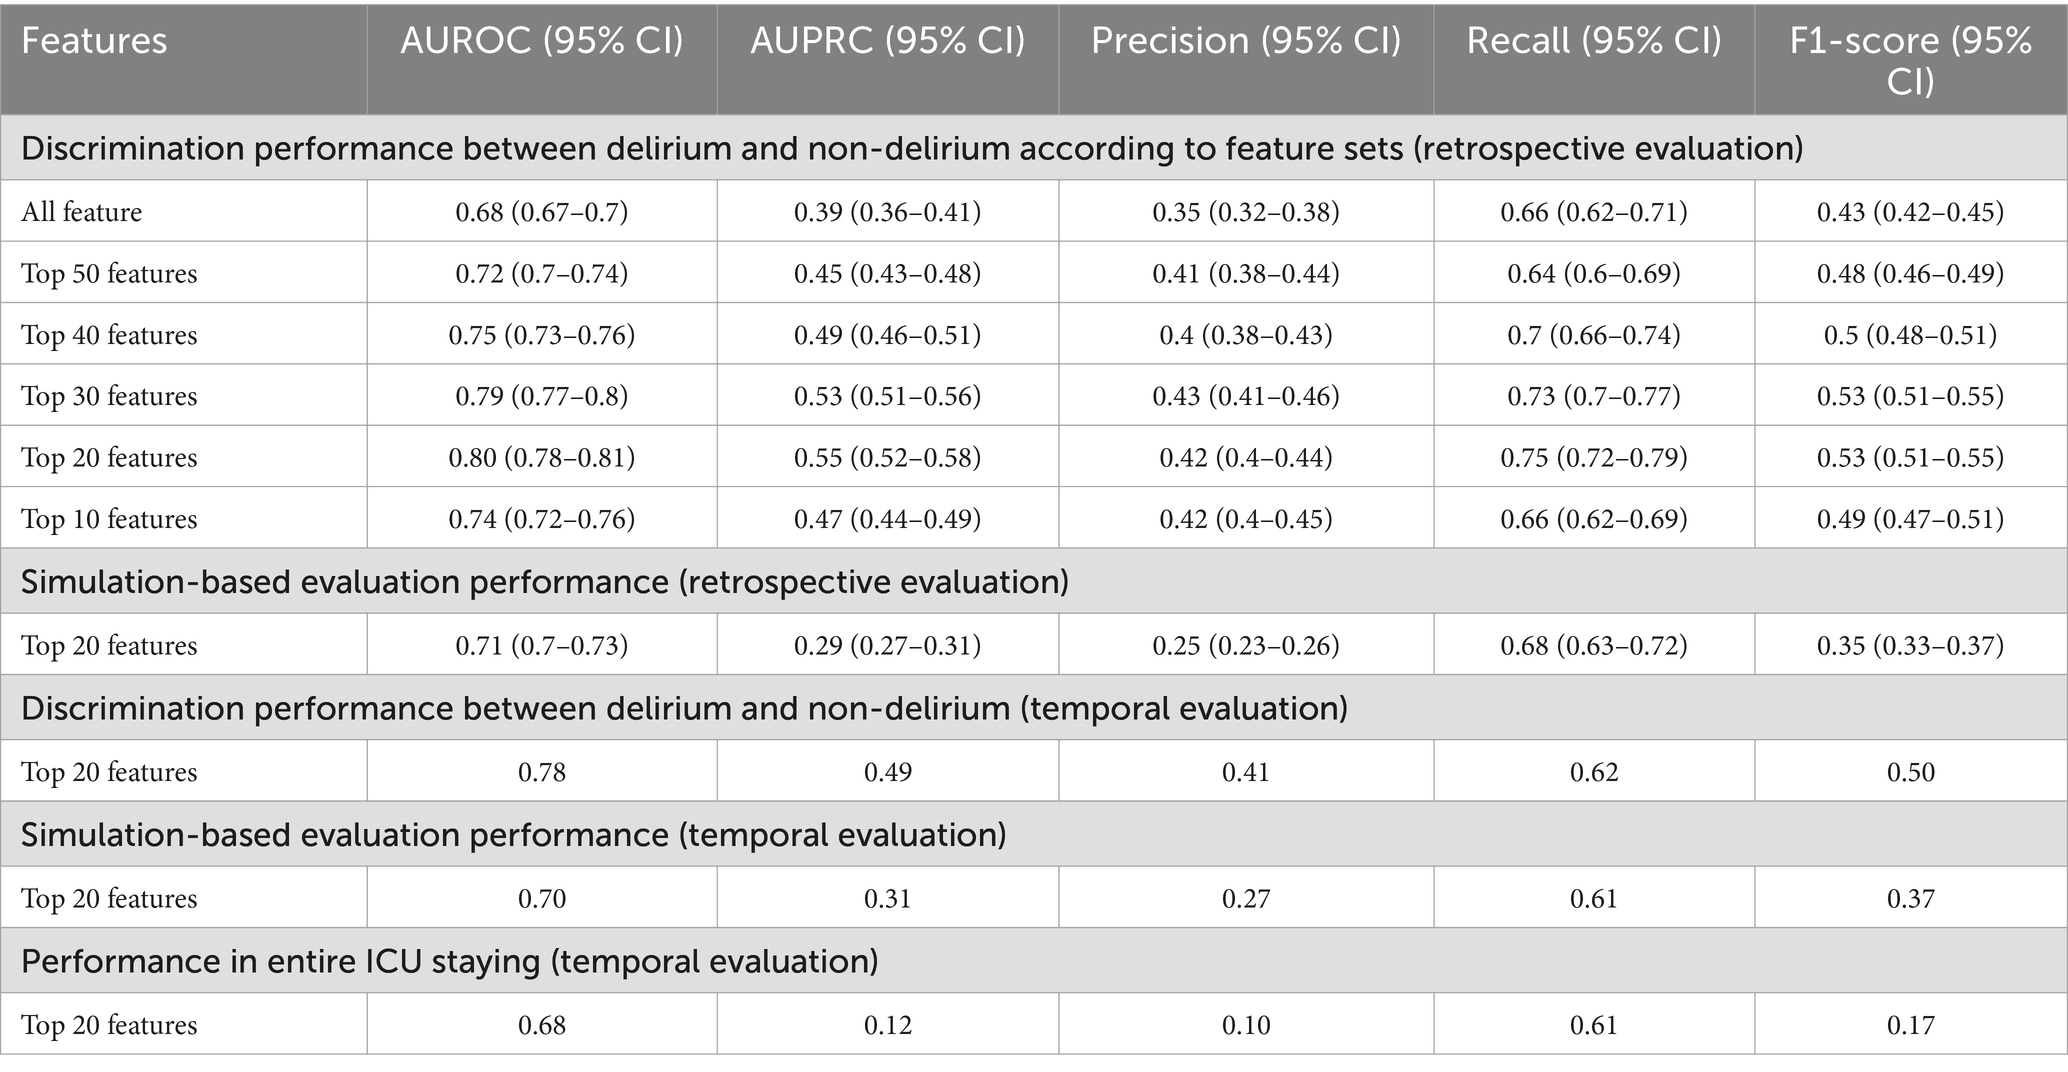
Among ML algorithms, LR showed the highest performance in delirium event classification when the top 20 features were used (Table 2 and Figure 7). Our model showed an AUROC of 0.80 (95% confidence interval [CI]: 0.78–0.81) and an AUPRC of 0.552 (95% CI: 0.525–0.579), and the model could classify delirium and non-delirium status with a sensitivity and specificity of 0.75 and 0.72, respectively.
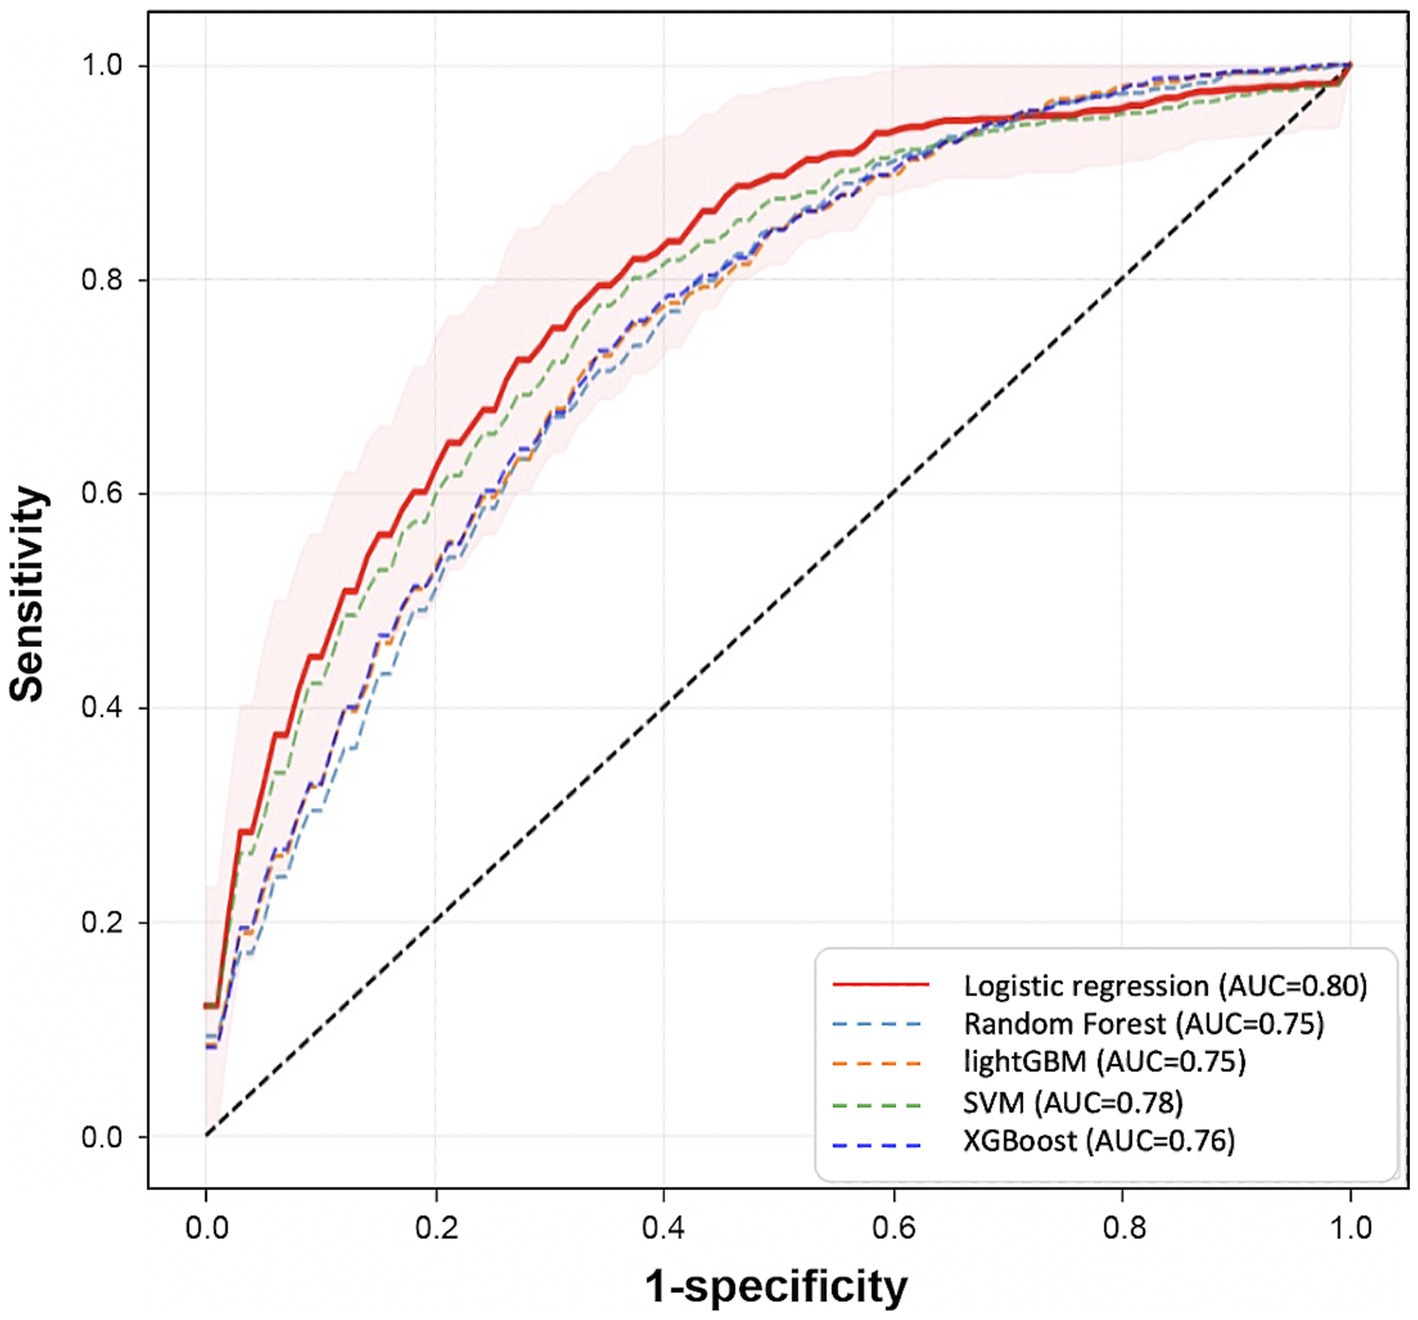
Figure 7. Comparison of prediction performance across different Machine Learning algorithms. This plot shows the Receiver Operating Characteristic curves of each model that is trained by different algorithms (LR, RF, SVM, LGBM, XGB) using the top 20 variables. These results are calculated from the mean performances of 50 models trained by different randomly selected training datasets. The red area represents the mean ± SD of the performance of the final model.
We also compared the models when only fixed features were used and when the dynamic features were used together. When comparing the performance in terms of the different sources of features, the best performance was obtained when fixed and dynamic features were used together (AUROC: 0.8 [95% CI: 0.78–0.814]) (Figure 8 and Supplementary Tables S4, S5), followed by when only fixed features were used (AUROC: 0.701 [95% CI: 0.68–0.721]). The lowest performance was obtained when only dynamic features were used (AUROC: 0.68).
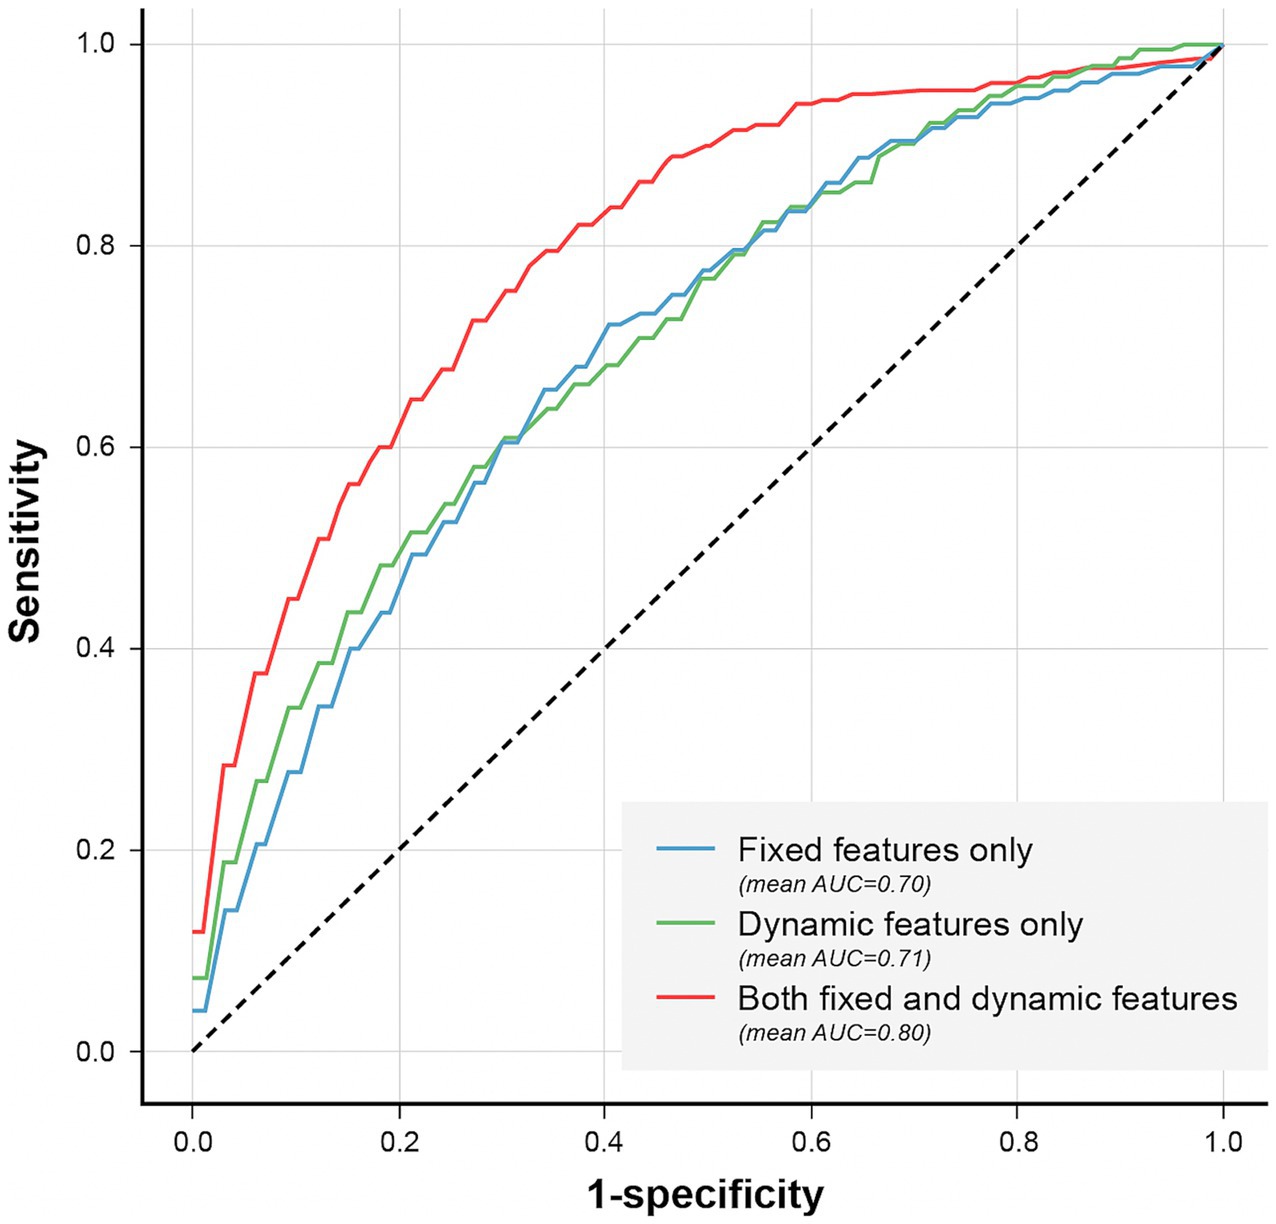
Figure 8. Comparison of models’ performance according to the used features. Comparison of models’ performance according to the used features. The AUROC was higher (0.80) when fixed and dynamic features were used together, compared to the models that used only fixed (0.70) or dynamic features (0.71).
3.3.2 Simulation-based evaluation
In simulation-based evaluation, all observation windows shown in Figure 1 were used for evaluation. The average of performance indices according to outputs of finally selected models (50 models trained by LR with the top 20 variables) was used. The performance at all time points showed an average AUROC and AUPRC of 0.71 and 0.29, respectively (Table 2).
As shown in Figure 9, the model’s mean prediction probability by time point increased as the time points approached the event onset in the case group (orange line). In addition, the mean number of alarms per patient by time point was higher for patients with delirium than for patients without delirium and as the time approached the event onset (Figure 9). The models’ mean prediction probability and total number of alarms per patient in this simulation are presented in Supplementary Table S6.
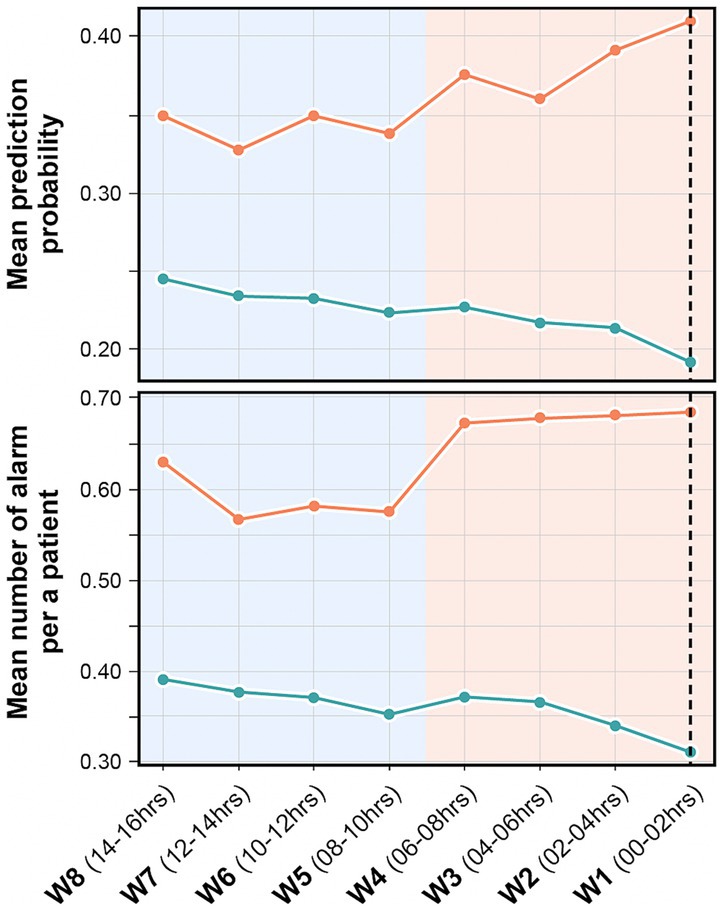
Figure 9. Mean prediction probability and mean number of alarms per patient in the retrospective validation. It shows the mean prediction probability of the model by time point (above), and the number of alarms per patient by time point (below). The orange line indicates delirium group and green line indicates non-delirium group. The black dashed line indicates the time point before 30 min of actual delirium event occurrence. The model’s prediction probability is higher and higher recall performance is seen closer to the event occurrence.
3.3.3 Temporal evaluation
The results of our model’s temporal validation are closely aligned with those of the retrospective evaluation. When assessing delirium occurrence against the matched non-delirium group, the AUROC was 0.78, and the AUPRC was 0.49. In the 16 h leading up to delirium, these values were 0.70 and 0.31, respectively (Table 2). Evaluating over the entire duration of the ICU stay yielded an AUROC of 0.68 and an AUPRC of 0.12, illustrating a decrease in precision and lower AUPRC values as the assessment period lengthened. However, a positive correlation was observed between the approach of a delirium event, the delirium probability value, and the frequency of alarms (Figure 10). Consequently, despite false alarms, it can be inferred that these alerts were meaningful due to their temporal proximity to delirium events.
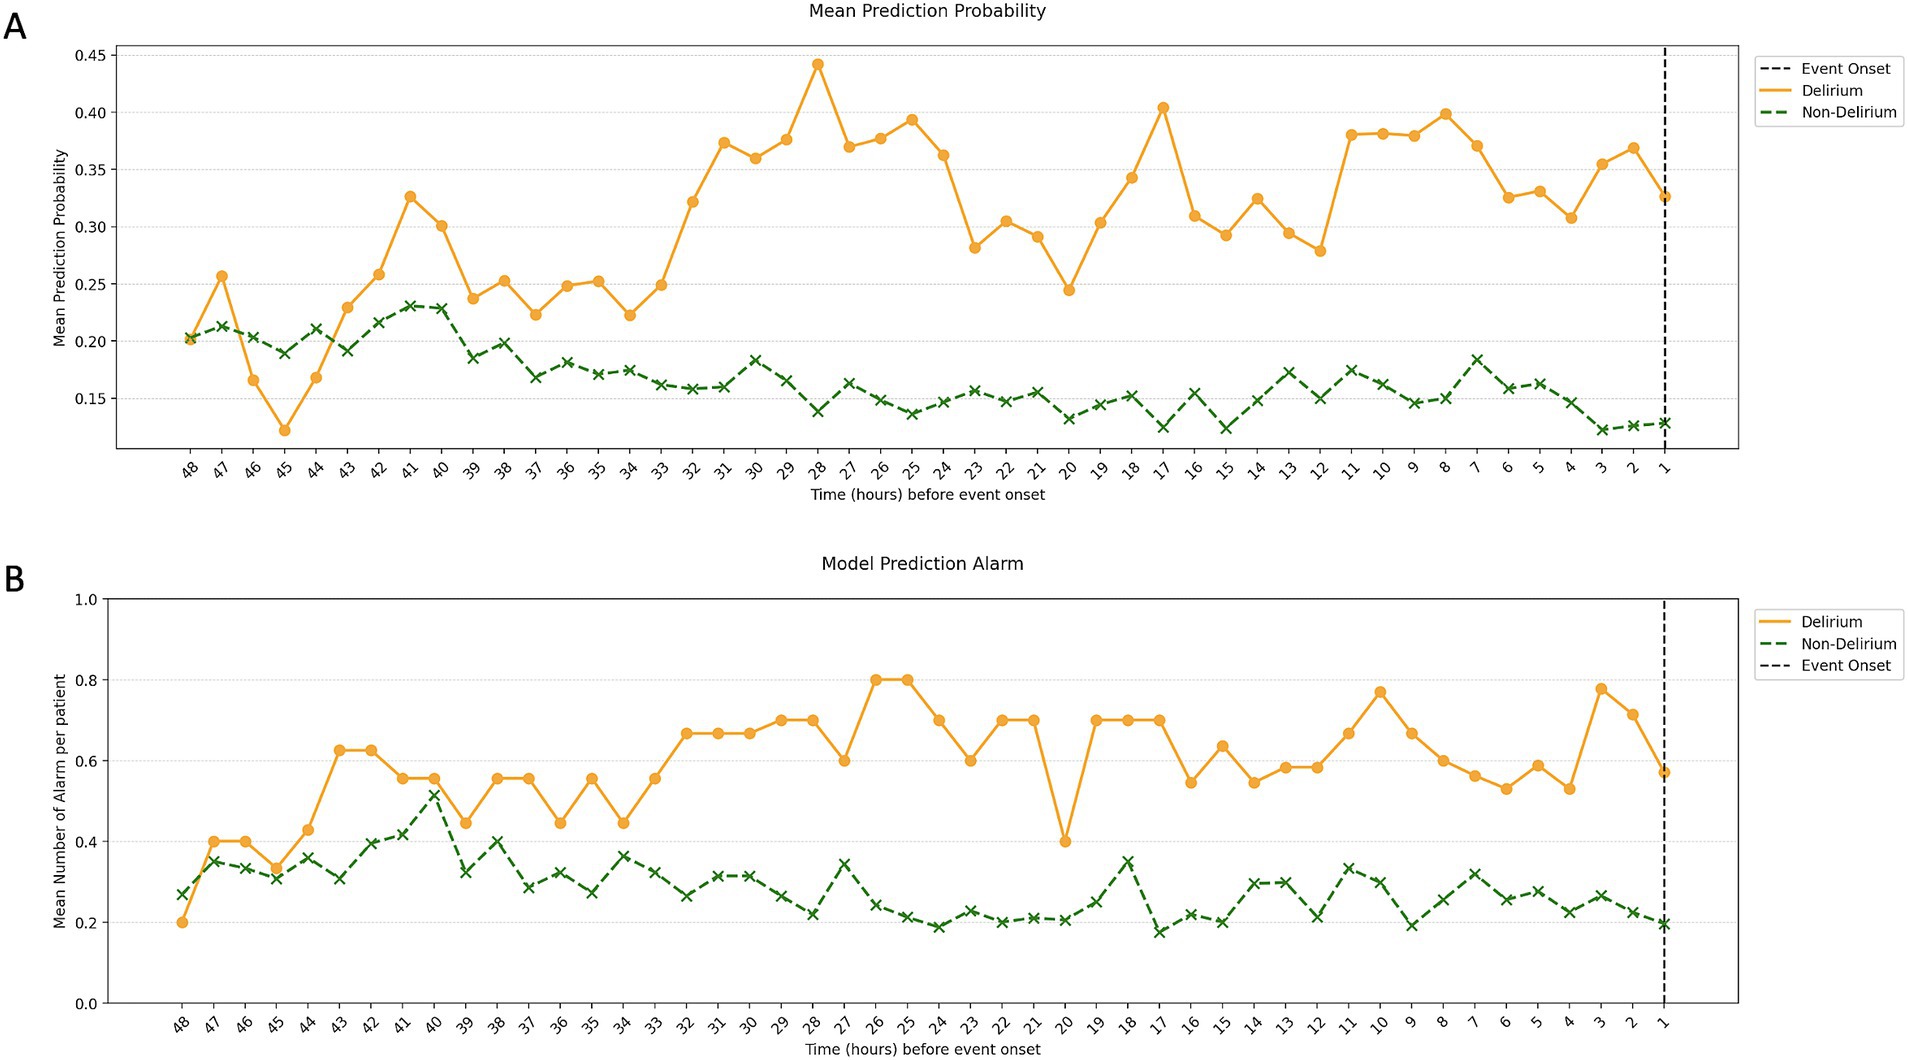
Figure 10. Mean prediction probability and mean number of alarms per patient in the temporal validation. The image shows the mean prediction probability of the model by time point (A) and the number of alarms per patient by time point (B). Similar to the retrospective validation, we saw a gradual increase in prediction probability and the number of alarms closer to the time of the event, with this pattern starting around 48 h before the delirium.
3.3.4 Predicted risk of delirium and patient outcomes
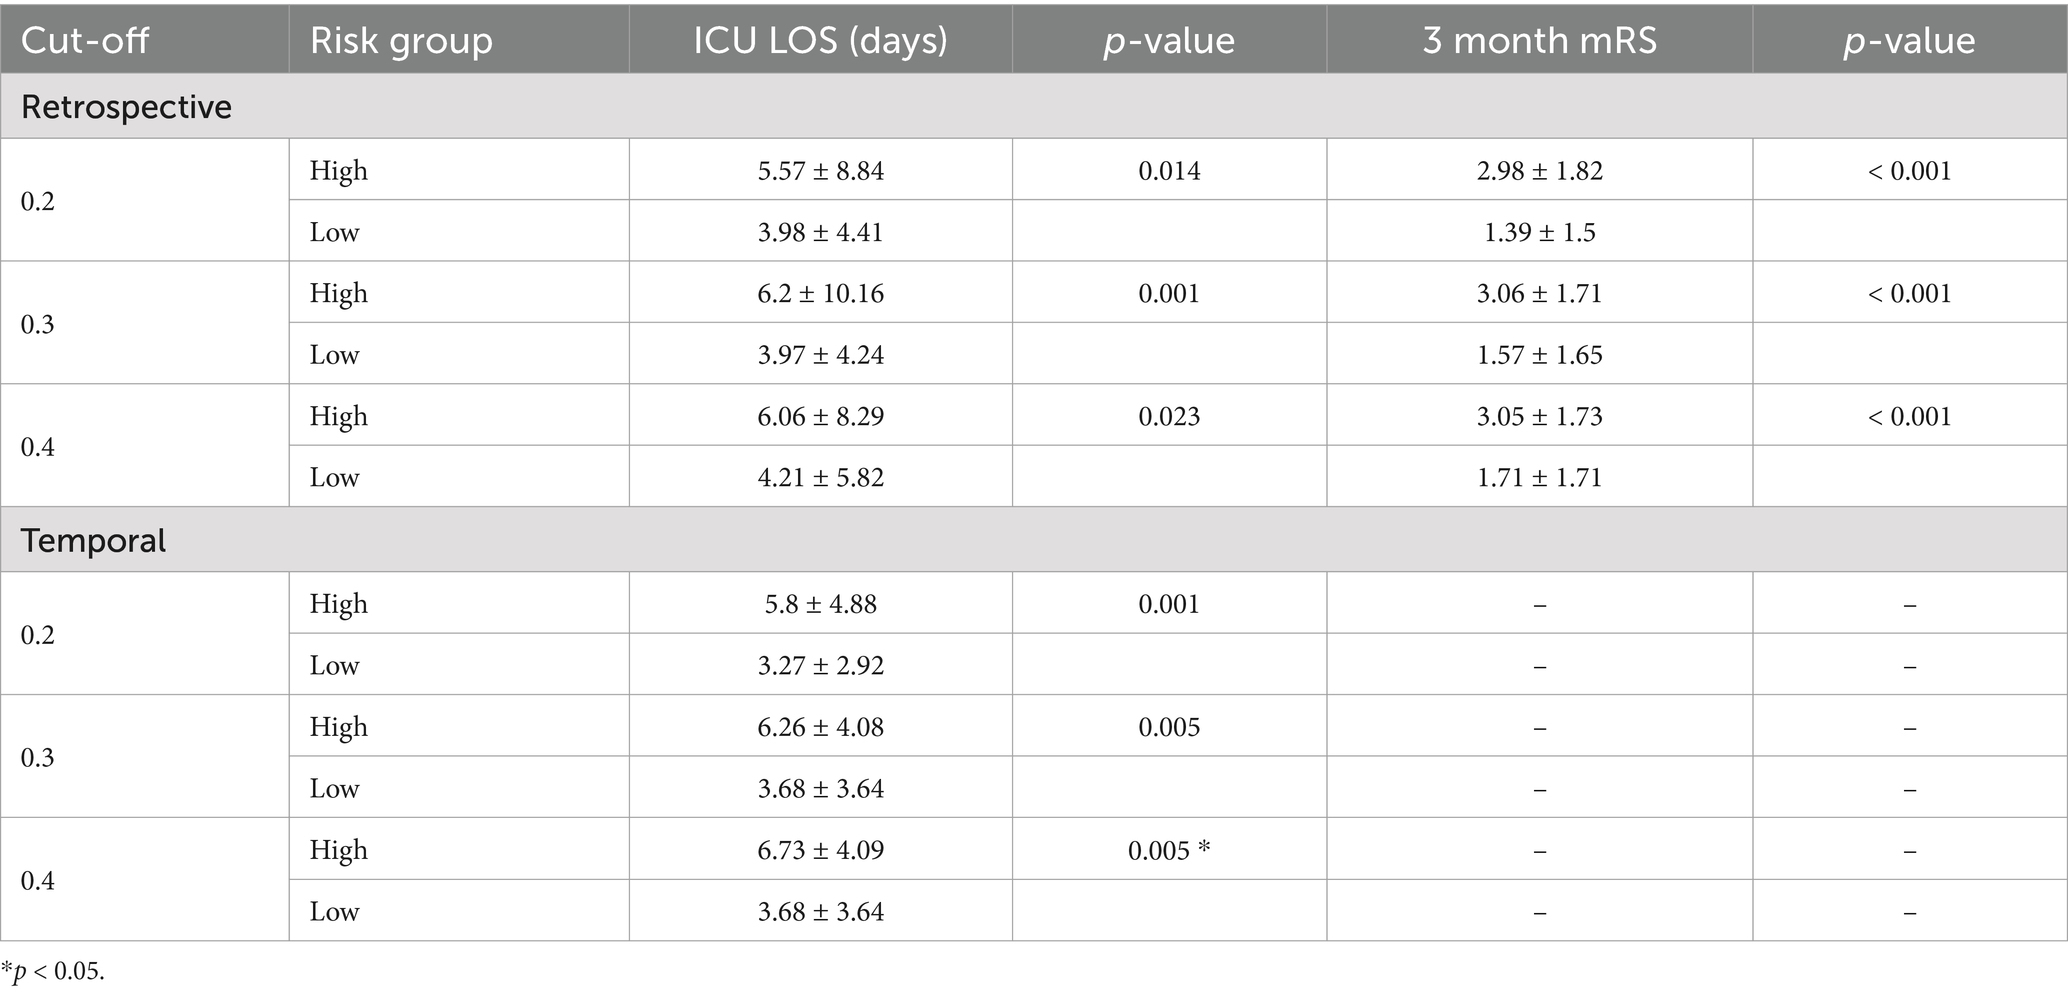
We examined the relationship between the predicted risk of delirium and the actual outcomes of patients evaluated during retrospective and temporal validation. When comparing high-risk patients (mean predicted risk of delirium ≥0.2) and low-risk patients (mean predicted risk of delirium <0.2) during the retrospective validation, the ICU length of stay and 3-month mRS score were statistically significantly higher in the high-risk group (5.57 days, p = 0.014 and 2.98, p < 0.001, respectively) than the low-risk group (3.98 days and 1.39). These trends were also observed in the temporal validation; high-risk patients with a mean risk of delirium ≥0.2 had a mean ICU length of stay of 5.8 days (p = 0.001), compared with 3.27 days for low-risk patients. This difference was also observed when the cut-off for separating the high-risk and low-risk groups was varied (Table 3).
4 Discussion
Our prediction model using ML could predict the occurrence of delirium, and the model’s predictive probability of delirium significantly improved closer to the time of delirium occurrence. In our study, we conducted a temporal evaluation of our model’s performance. The findings revealed a consistency in the model’s performance, mirroring its effectiveness during the training phase. This alignment strengthens our confidence in the model’s robustness and potential as a practical tool in a clinical setting. Given its consistent performance, we anticipate that this model will serve as a valuable addition to clinical practice, aiding healthcare professionals in improving patient outcomes.
To predict the occurrence of delirium, it may be useful to use variable vital signs rather than identify the conventional risk factors of delirium, such as patient demographics and initial laboratory findings. Previous PRE-DELERIC and E-PRE-DELERIC models were static models that yield calculated probabilities of delirium 24 h after ICU admission (van den Boogaard et al., 2012; van den Boogaard et al., 2014). In another previous study, the heart rate of patients with delirium was more variable and irregular than that of patients without delirium (Jooyoung et al., 2017). In addition, a pilot study showed that in recent cases of delirium, blood pressure changed more significantly in the head-up tilt tests and that dynamic parameters were used to correlate with excessive sympathetic responses showing delirium predictability (Shanahan et al., 2021). Although delirium prediction models using ML have been developed, they have not continuously monitored the occurrence of delirium (van den Boogaard et al., 2012; van den Boogaard et al., 2014; Wassenaar et al., 2015; Bishara et al., 2022). One of the primary benefits of utilizing vital sign data is its potential for real-time delirium risk assessment, a marked improvement compared to existing models such as PREDELIRIC and E-DELIRIC. For validation, we compared our machine-learning model with the well-known delirium prediction tools, PRE-DELIRIC and E-DELIRIC. The cut-off was set identically to our model’s optimal threshold for comparing performance metrics. The model we developed demonstrated superior performance across all metrics, proving its clinical application is more effective than existing tools, which can only predict within 24 h of admission (Table 4).
The average AUROC of the model using fixed features alone was 0.70 (95% CI: 0.68–0.72); however, it increased to 0.80 (95% CI: 0.78–0.81) when the dynamic features were also used. This show that dynamic features can not only improve the performance of delirium prediction models but also be useful for predicting real-time delirium probability (Supplementary Table S5). In simulation-based evaluation, the model’s mean prediction probability by time point was higher for predicting delirium status closer to the event onset (Figure 9). Since continuous dynamic data were used, we could continuously predict the likelihood of delirium occurrence.
Despite the lack of clear evidence on drugs that can prevent delirium, a study has shown that short-term prophylactic administration of low-dose haloperidol is effective in preventing delirium in elderly ICU patients after noncardiac surgery (Wang et al., 2012). Appropriate administration timing and patient selection are required to effectively prevent delirium. Therefore, prediction and early detection of delirium using our model can help prevent delirium and reduce unnecessary utilization of medical resources as well as burden on medical staff, caregivers, and patients. Our research may facilitate the earlier prediction and detection of delirium, improving its prevention and treatment.
The 20 variables selected for ML in our study were consistent with the commonly known risk factors for delirium. Old age and diabetes are well-known risk factors for delirium, and stroke severity according to the NIHSS is also known as a risk factor for delirium (Oldenbeuving et al., 2011). In our statistical analysis, the NIHSS score showed significant differences between the two groups. This finding could be interpreted as delirium occurring due to a worsening stroke; however, we used the NIHSS score recorded at admission, which does not consider stroke deterioration, suggesting that the initial NIHSS score is important for classifying delirium. Therefore, the variables determined through ML are related to delirium. The trends in vital sign-based data allow us to gain insight into how the model detects changes in dynamic features before the delirium event (Figure 10). Characteristics such as BT and HRV showed more dynamic changes closer to the delirium onset. The BT of patients with delirium at baseline was higher at the baseline and lower than that before the delirium onset. HRV was similar between patients with and without delirium, but the variability increased before delirium occurrence. Moreover, SpO2 and RR variability were different between patients with and without delirium. Therefore, our study suggests that these dynamic changes controlled by the ANS may help distinguishing the two groups.
Our findings showed dynamic changes in the ANS in patients with delirium, which is consistent with the pathophysiology of delirium revealed in a previous study, indicating dysregulation of HRV and sympathetic hyperactivity. Several studies have suggested that an HRV alteration may help identify patients with stroke at risk for delirium in the ICU (Rollo et al., 2022). In addition, previous studies have suggested that delirium is associated with impaired oxidative metabolism (Taccone et al., 2010; Wood et al., 2017). A near-infrared spectroscopy study showed that low brain tissue oxygenation was an independent risk factor for delirium (Wood et al., 2017). Conversely, some studies have reported that perioperative hyperoxia may contribute to postoperative delirium (Lopez et al., 2017; Kupiec et al., 2020). Among the dynamic features considered in our study, SpO2 was higher in the case group than in the control group and decreased just before delirium occurrence. We believe that delirium is not associated only with tissue oxygenation, and our findings can provide a clue for connecting the contradictory findings on tissue oxygenation. One study had showed that temperature variability increased during delirium (van der Kooi et al., 2013).
In our study, we conducted a temporal application of our model, observing a performance largely congruent with our retrospective evaluation. Notably, when the model was utilized throughout the entire study period, we noticed a substantial decrease in precision as the number of predictions and non-delirium data escalated. However, a trend emerged showing an escalating proportion of alarms as the onset of delirium approached. This pattern could serve as a valuable guide, enabling clinicians to adjust their focus accordingly. In temporal application, we observed that the alerts made clinicians more focused on the onset of delirium in their patients, allowing them to identify new delirium cases quickly. Furthermore, patients exhibiting a higher predicted risk of delirium were found to have an increased 3-month mRS and longer ICU stays. However, the mortality rates of the case (7.14%) and control (6.25%) groups were not significantly different (p = 0.9603).
Though our temporal evaluation did not incorporate interventions, the significant difference in clinical outcomes within the high-risk delirium group provides a compelling rationale for the initiation of future studies that focus on early intervention strategies leveraging our predictive system.
However, our study has several limitations. First, since this model was only applied to patients with stroke, assessed using the NIHSS, it may be difficult to generalize this model to patients admitted to the ICU for other diseases. However, these shortcomings can be overcome using general scales representing the severity of each disease. It can be replaced by the Acute Physiology and Chronic Health Evaluation (APACHE) III or Sequential Organ Failure Assessment (SOFA) score, which are commonly used in the ICU (van den Boogaard et al., 2012; van den Boogaard et al., 2014). In addition, we focused specifically on stroke patients and included hypertension, diabetes, and dyslipidemia as stroke-related comorbidities. Nonetheless, incorporating well-known delirium risk factors, such as dementia and organ failure, can improve the performance of prediction models.
Second, during the temporal validation, we only observed the performance of the alarms and did not add clinical interventions based on the alarms. However, given that this study confirmed that the model-predicted risk levels and alarms were associated with adverse clinical outcomes, it may be possible to study the effectiveness of interventions using this alarm system in the future.
Third, our models have difficulty presenting a predictive score without patient monitoring. However, as the patients targeted in our study (those admitted to the NCU and SU) were fundamentally under vital sign monitoring, we believe this does not pose a significant problem.
Finally, this study did not conduct external validation. However, we collected data from different time points for further validation than the cohort used in the development. We also performed simulation validation, which indicated the evaluation is sufficiently reliable.
5 Conclusion
We believe that a prediction model using ML can provide timely prediction of the possibility of delirium in patients with ischemic stroke. In addition, the study revealed that vital-sign-based dynamic information is valuable for monitoring the risk of delirium occurrence.
Data availability statement
The data analyzed in this study is subject to the following licenses/restrictions: data cannot be shared publicly due to regulations from the Institutional Review Board of Ajou University Medical Center. This is because the data contain potentially identifying or sensitive patient information, and distributing these data could breach patient confidentiality. Data are available from the aforementioned Institutional Review Boards for researchers who meet the criteria for access to confidential data. Requests to access these datasets should be directed to YWpvdWlyYkBhdW1jLmFjLmty.
Ethics statement
The studies involving humans were approved by The Institutional Review Board (IRB) of Ajou University Hospital. The studies were conducted in accordance with the local legislation and institutional requirements. Written informed consent for participation was not required from the participants or the participants’ legal guardians/next of kin in accordance with the national legislation and institutional requirements.
Author contributions
HK: Methodology, Resources, Writing – original draft, Writing – review & editing, Formal analysis, Software, Validation, Visualization. MK: Formal analysis, Methodology, Resources, Validation, Writing – original draft, Writing – review & editing, Data curation, Investigation. DK: Data curation, Investigation, Resources, Writing – original draft, Writing – review & editing, Visualization. JH: Writing – original draft, Conceptualization, Funding acquisition, Investigation, Project administration, Resources, Supervision, Writing – review & editing. DY: Conceptualization, Funding acquisition, Investigation, Project administration, Resources, Supervision, Writing – original draft, Writing – review & editing, Data curation, Methodology. DS: Writing – review & editing, Validation, Investigation, Resources, Software.
Funding
The author(s) declare that financial support was received for the research, authorship, and/or publication of this article. This work was supported by the Korea Medical Device Development Fund grant funded by the Korea government (the Ministry of Science and ICT, the Ministry of Trade, Industry and Energy, the Ministry of Health & Welfare, the Ministry of Food and Drug Safety) (Project Number: 1711138152, RS-2020-KD000095). This work was also supported by Bio-convergence Technology Education Program through the Korea Institute for Advancement Technology (KIAT) funded by the Ministry of Trade, Industry and Energy (No. P0017805).
Conflict of interest
HK is the employee of MDHi Corp. MDHi Corp did not have any role in the study design, analysis, decision to publish, or the preparation of the manuscript. There are no patents, products in development, or marketed products to declare.
The remaining authors declare that the research was conducted in the absence of any commercial or financial relationships that could be construed as a potential conflict of interest.
Publisher’s note
All claims expressed in this article are solely those of the authors and do not necessarily represent those of their affiliated organizations, or those of the publisher, the editors and the reviewers. Any product that may be evaluated in this article, or claim that may be made by its manufacturer, is not guaranteed or endorsed by the publisher.
Supplementary material
The Supplementary material for this article can be found online at: https://www.frontiersin.org/articles/10.3389/fnins.2024.1425562/full#supplementary-material
References
Almeida, I. C., Soares, M., Bozza, F. A., Shinotsuka, C., Bujokas, R., Souza-Dantas, V., et al. (2014). The impact of acute brain dysfunction in the outcomes of mechanically ventilated cancer patients. PLoS One 9:e85332. doi: 10.1371/journal.pone.0085332
American Psychiatric Association D, Association AP (2013). Diagnostic and statistical manual of mental disorders: DSM-5. Washington, DC: American Psychiatric Association.
Azur, M. J., Stuart, E. A., Frangakis, C., and Leaf, P. J. (2011). Multiple imputation by chained equations: what is it and how does it work? Int. J. Methods Psychiatr. Res. 20, 40–49. doi: 10.1002/mpr.329
Barr, J., Fraser, G. L., Puntillo, K., Ely, E. W., Gélinas, C., Dasta, J. F., et al. (2013). Clinical practice guidelines for the management of pain, agitation, and delirium in adult patients in the intensive care unit. Crit. Care Med. 41, 263–306. doi: 10.1097/CCM.0b013e3182783b72
Bellelli, G., Morandi, A., Davis, D. H., Mazzola, P., Turco, R., Gentile, S., et al. (2014). Validation of the 4AT, a new instrument for rapid delirium screening: a study in 234 hospitalised older people. Age Ageing 43, 496–502. doi: 10.1093/ageing/afu021
Bishara, A., Chiu, C., Whitlock, E. L., Douglas, V. C., Lee, S., Butte, A. J., et al. (2022). Postoperative delirium prediction using machine learning models and preoperative electronic health record data. BMC Anesthesiol. 22:8. doi: 10.1186/s12871-021-01543-y
Burry, L., Hutton, B., Williamson, D. R., Mehta, S., Adhikari, N. K. J., Cheng, W., et al. (2019). Pharmacological interventions for the treatment of delirium in critically ill adults. Cochrane Database Syst. Rev. 2019:CD011749. doi: 10.1002/14651858.CD011749.pub2
de la Cruz, M., Fan, J., Yennu, S., Tanco, K., Shin, S. H., Wu, J., et al. (2015). The frequency of missed delirium in patients referred to palliative care in a comprehensive cancer center. Support Care Cancer 23, 2427–2433. doi: 10.1007/s00520-015-2610-3
Duan, X., Coburn, M., Rossaint, R., Sanders, R. D., Waesberghe, J. V., and Kowark, A. (2018). Efficacy of perioperative dexmedetomidine on postoperative delirium: systematic review and meta-analysis with trial sequential analysis of randomised controlled trials. Br. J. Anaesth. 121, 384–397. doi: 10.1016/j.bja.2018.04.046
Ely, E. W., Margolin, R., Francis, J., May, L., Truman, B., Dittus, R., et al. (2001). Evaluation of delirium in critically ill patients: validation of the confusion assessment method for the intensive care unit (CAM-ICU). Crit. Care Med. 29, 1370–1379. doi: 10.1097/00003246-200107000-00012
Flinn, D. R., Diehl, K. M., Seyfried, L. S., and Malani, P. N. (2009). Prevention, diagnosis, and management of postoperative delirium in older adults. J. Am. Coll. Surg. 209, 261–268. doi: 10.1016/j.jamcollsurg.2009.03.008
Fluss, R., Faraggi, D., and Reiser, B. (2005). Estimation of the Youden index and its associated cutoff point. Biom. J. 47, 458–472. doi: 10.1002/bimj.200410135
Green, C., Bonavia, W., Toh, C., and Tiruvoipati, R. (2019). Prediction of ICU delirium: validation of current delirium predictive models in routine clinical practice. Crit. Care Med. 47, 428–435. doi: 10.1097/CCM.0000000000003577
Han, J. H., Zimmerman, E. E., Cutler, N., Schnelle, J., Morandi, A., Dittus, R. S., et al. (2009). Delirium in older emergency department patients: recognition, risk factors, and psychomotor subtypes. Acad. Emerg. Med. 16, 193–200. doi: 10.1111/j.1553-2712.2008.00339.x
Inouye, S. K., Foreman, M. D., Mion, L. C., and Katz, K. H. (2001). Nurses’ recognition of delirium and its symptoms: comparison of nurse and researcher ratings. Arch. Intern. Med. 161, 2467–2473. doi: 10.1001/archinte.161.20.2467
Inouye, S. K., van Dyck, C. H., Alessi, C. A., Balkin, S., Siegal, A. P., Horwitz, R. L., et al. (1990). Clarifying confusion: the confusion assessment method. A new method for detection of delirium. Ann. Intern. Med. 113, 941–948. doi: 10.7326/0003-4819-113-12-941
Inouye, S. K., Westendorp, R. G., and Saczynski, J. S. (2014). Delirium in elderly people. Lancet 383, 911–922. doi: 10.1016/S0140-6736(13)60688-1
Jooyoung, O., Dongrae, C., Jongin, K., Jaeseok, H., Jaesub, P., Se, H. N., et al. (2017). Changes in heart rate variability of patients with delirium in intensive care unit. Annu Int Conf IEEE Eng Med Biol Soc 2017, 3118–3121. doi: 10.1109/EMBC.2017.8037517
Karmakar, C. K., Khandoker, A. H., Gubbi, J., and Palaniswami, M. (2009). Complex correlation measure: a novel descriptor for Poincaré plot. Biomed. Eng. Online 8:17. doi: 10.1186/1475-925X-8-17
Kosar, C. M., Thomas, K. S., Inouye, S. K., and Mor, V. (2017). Delirium during Postacute nursing home admission and risk for adverse outcomes. J. Am. Geriatr. Soc. 65, 1470–1475. doi: 10.1111/jgs.14823
Kupiec, A., Adamik, B., Forkasiewicz-Gardynik, K., and Goździk, W. (2020). Intra-operative hyperoxia and the risk of delirium in elderly patients after cardiac surgery. Aging 12, 7006–7014. doi: 10.18632/aging.103058
Lee, A., Mu, J. L., Joynt, G. M., Chiu, C. H., Lai, V. K. W., Gin, T., et al. (2017). Risk prediction models for delirium in the intensive care unit after cardiac surgery: a systematic review and independent external validation. Br. J. Anaesth. 118, 391–399. doi: 10.1093/bja/aew476
Liem, P. H., and Carter, W. J. (1991). Cystocerebral syndrome: a possible explanation. Arch. Intern. Med. 151:1884, 1886. doi: 10.1001/archinte.1991.00400090150034
Lopez, M. G., Pandharipande, P., Morse, J., Shotwell, M. S., Milne, G. L., Pretorius, M., et al. (2017). Intraoperative cerebral oxygenation, oxidative injury, and delirium following cardiac surgery. Free Radic. Biol. Med. 103, 192–198. doi: 10.1016/j.freeradbiomed.2016.12.039
Marcantonio, E. R. (2017). Delirium in Hospitalized Older Adults. N. Engl. J. Med. 377, 1456–1466. doi: 10.1056/NEJMcp1605501
Milbrandt, E. B., Kersten, A., Kong, L., Weissfeld, L. A., Clermont, G., Fink, M. P., et al. (2005). Haloperidol use is associated with lower hospital mortality in mechanically ventilated patients. Crit. Care Med. 33, 226–229. doi: 10.1097/01.ccm.0000150743.16005.9a
Oh, J., Cho, D., Park, J., Na, S. H., Kim, J., Heo, J., et al. (2018). Prediction and early detection of delirium in the intensive care unit by using heart rate variability and machine learning. Physiol. Meas. 39:035004. doi: 10.1088/1361-6579/aaab07
Oldenbeuving, A. W., de Kort, P. L., Jansen, B. P., Algra, A., Kappelle, L. J., Roks, G., et al. (2011). Delirium in the acute phase after stroke: incidence, risk factors, and outcome. Neurology 76, 993–999. doi: 10.1212/WNL.0b013e318210411f
Oliven, R., Rotfeld, M., Gino-Moor, S., Schiff, E., Odeh, M., and Gil, E. (2021). Early detection and intervention for patients with delirium admitted to the Department of Internal Medicine: lessons from a pilot initiative. Dement Geriatr Cogn Dis Extra 11, 134–139. doi: 10.1159/000515958
Pandharipande, P. P., Girard, T. D., Jackson, J. C., Morandi, A., Thompson, J. L., Pun, B. T., et al. (2013). Long-term cognitive impairment after critical illness. N. Engl. J. Med. 369, 1306–1316. doi: 10.1056/NEJMoa1301372
Peng, C. K., Buldyrev, S. V., Havlin, S., Simons, M., Stanley, H. E., and Goldberger, A. L. (1994). Mosaic organization of DNA nucleotides. Phys. Rev. E Stat. Phys. Plasmas Fluids Relat. Interdiscip. Topics 49, 1685–1689. doi: 10.1103/physreve.49.1685
Peter, C. (2011). Austin: an introduction to propensity score methods for reducing the effects of confounding in observational studies. Multivariate Behav Res 46, 399–424. doi: 10.1080/00273171.2011.568786
Richman, J. S., and Moorman, J. R. (2000). Physiological time-series analysis using approximate entropy and sample entropy. Am. J. Physiol. Heart Circ. Physiol. 278, H2039–H2049. doi: 10.1152/ajpheart.2000.278.6.H2039
Rohatgi, N., Weng, Y., Bentley, J., Lansberg, M. G., Shepard, J., Mazur, D., et al. (2019). Initiative for prevention and early identification of delirium in medical-surgical units: lessons learned in the past five years. Am. J. Med. 132, 1421–1430.e8. doi: 10.1016/j.amjmed.2019.05.035
Rollo, E., Marotta, J., Callea, A., Brunetti, V., Vollono, C., Scala, I., et al. (2022). Heart rate variability and delirium in acute non-cardioembolic stroke: a prospective, cross-sectional, cohort study. Neurol. Sci. 43, 2423–2431. doi: 10.1007/s10072-021-05621-4
Sartorius, N., Bertelse, A., Caetano, D., Channabasavanna, S., Dilling, H., Gelder, M., et al. (1993). World Health Organization: The ICD-10 classification of mental and behavioural disorders: diagnostic criteria for research. 38–39.
Schneider, L. S., Dagerman, K. S., and Insel, P. (2005). Risk of death with atypical antipsychotic drug treatment for dementia: meta-analysis of randomized placebo-controlled trials. JAMA 294, 1934–1943. doi: 10.1001/jama.294.15.1934
Shanahan, E., Ryan, S., Leahy, A., Sheehy, T., Costelloe, A., Roy, A., et al. (2021). Delirium and abnormal autonomic nervous system response to head-up tilt testing. Exp. Gerontol. 152:111430. doi: 10.1016/j.exger.2021.111430
Taccone, F. S., Su, F., Pierrakos, C., He, X., James, S., Dewitte, O., et al. (2010). Cerebral microcirculation is impaired during sepsis: an experimental study. Crit. Care 14:R140. doi: 10.1186/cc9205
van den Boogaard, M., Pickkers, P., Slooter, A. J., Kuiper, M., Spronk, P., Voort, P., et al. (2012). Development and validation of PRE-DELIRIC (PREdiction of DELIRium in ICu patients) delirium prediction model for intensive care patients: observational multicentre study. BMJ 344:e420. doi: 10.1136/bmj.e420
van den Boogaard, M., Schoonhoven, L., Maseda, E., Plowright, C., Jones, C., Luetz, A., et al. (2014). Recalibration of the delirium prediction model for ICU patients (PRE-DELIRIC): a multinational observational study. Intensive Care Med. 40, 361–369. doi: 10.1007/s00134-013-3202-7
van den Boogaard, M., Schoonhoven, L., van Achterberg, T., van der Hoeven, J. G., and Pickkers, P. (2013). Haloperidol prophylaxis in critically ill patients with a high risk for delirium. Crit. Care 17:R9. doi: 10.1186/cc11933
van der Kooi, A. W., Kappen, T. H., Raijmakers, R. J., Zaal, I. J., and Slooter, A. J. C. (2013). Temperature variability during delirium in ICU patients: an observational study. PLoS One 8:e78923. doi: 10.1371/journal.pone.0078923
Wang, W., Li, H. L., Wang, D. X., Zhu, X., Li, S. L., Yao, G. Q., et al. (2012). Haloperidol prophylaxis decreases delirium incidence in elderly patients after noncardiac surgery: a randomized controlled trial*. Crit. Care Med. 40, 731–739. doi: 10.1097/CCM.0b013e3182376e4f
Wassenaar, A., van den Boogaard, M., van Achterberg, T., Slooter, A. J. C., Kuiper, M. A., Hoogendoorn, M. E., et al. (2015). Multinational development and validation of an early prediction model for delirium in ICU patients. Intensive Care Med. 41, 1048–1056. doi: 10.1007/s00134-015-3777-2
Wilson, J. E., Mart, M. F., Cunningham, C., Shehabi, Y., Girard, T. D., MacLullich, A., et al. (2020). Delirium. Nat. Rev. Dis. Primers 6:90. doi: 10.1038/s41572-020-00223-4
Woo, M. A., Stevenson, W. G., Moser, D. K., Trelease, R. B., and Harper, R. M. (1992). Patterns of beat-to-beat heart rate variability in advanced heart failure. Am. Heart J. 123, 704–710. doi: 10.1016/0002-8703(92)90510-3
Wood, M. D., Maslove, D. M., Muscedere, J. G., Day, A. G., and Gordon Boyd, J. (2017). Low brain tissue oxygenation contributes to the development of delirium in critically ill patients: a prospective observational study. J. Crit. Care 41, 289–295. doi: 10.1016/j.jcrc.2017.06.009
Keywords: delirium, machine learning, vital signs, early diagnosis, ischemic stroke
Citation: Kim H, Kim M, Kim DY, Seo DG, Hong JM and Yoon D (2025) Prediction of delirium occurrence using machine learning in acute stroke patients in intensive care unit. Front. Neurosci. 18:1425562. doi: 10.3389/fnins.2024.1425562
Edited by:
Patrick Thiam, University of Ulm, GermanyReviewed by:
Bruno Bernardini, Humanitas Research Hospital, ItalyJosé Eduardo Guimarães Pereira, Hospital Central do Exercito, Brazil
Bruno Santiago, Rio de Janeiro State University, Brazil
Copyright © 2025 Kim, Kim, Kim, Seo, Hong and Yoon. This is an open-access article distributed under the terms of the Creative Commons Attribution License (CC BY). The use, distribution or reproduction in other forums is permitted, provided the original author(s) and the copyright owner(s) are credited and that the original publication in this journal is cited, in accordance with accepted academic practice. No use, distribution or reproduction is permitted which does not comply with these terms.
*Correspondence: Ji Man Hong, ZGFjZGFAaGFubWFpbC5uZXQ=; Dukyong Yoon, ZHVreW9uZy55b29uQHlvbnNlaS5hYy5rcg==
†These authors have contributed equally to this work and share first authorship
 Hyungjun Kim
 Min Kim
 Da Young Kim
 Dong Gi Seo5
 Ji Man Hong
 Dukyong Yoon