 Shaohua Liu
 Jingkai Sun1,2
 Yinglong Zhu
 Tianlu Mao
- 1School of Electronic Engineering, Beijing University of Posts and Telecommunications, Beijing, China
- 2Beijing Key Laboratory of Mobile Computing and Pervasive Device, Institute of Computing Technology, Chinese Academy of Sciences, Beijing, China
- 3School of Computer Science and Technology, University of Chinese Academy of Science, Beijing, China
Predicting the trajectories of pedestrians is an important and difficult task for many applications, such as robot navigation and autonomous driving. Most of the existing methods believe that an accurate prediction of the pedestrian intention can improve the prediction quality. These works tend to predict a fixed destination coordinate as the agent intention and predict the future trajectory accordingly. However, in the process of moving, the intention of a pedestrian could be a definite location or a general direction and area, and may change dynamically with the changes of surrounding. Thus, regarding the agent intention as a fixed 2-d coordinate is insufficient to improve the future trajectory prediction. To address this problem, we propose Dynamic Target Driven Network for pedestrian trajectory prediction (DTDNet), which employs a multi-precision pedestrian intention analysis module to capture this dynamic. To ensure that this extracted feature contains comprehensive intention information, we design three sub-tasks: predicting coarse-precision endpoint coordinate, predicting fine-precision endpoint coordinate and scoring scene sub-regions. In addition, we propose a original multi-precision trajectory data extraction method to achieve multi-resolution representation of future intention and make it easier to extract local scene information. We compare our model with previous methods on two publicly available datasets (ETH-UCY and Stanford Drone Dataset). The experimental results show that our DTDNet achieves better trajectory prediction performance, and conducts better pedestrian intention feature representation.
1 Introduction
Trajectory prediction is an essential research area that has various applications in autonomous driving (Bennewitz et al., 2005; Ma et al., 2019; Chandra et al., 2020), robot navigation (Rasouli et al., 2019), and surveillance systems (Oh et al., 2011; Sultani et al., 2018). For instance, in autonomous driving, vehicles need to estimate the future movements of pedestrians to avoid collisions and plan a safe driving path.
One of the basic challenges for trajectory prediction is to analyze the pedestrian future intention in the changing context, such as whether the pedestrian intends to cross the road before or after a car passes. This analysis can provide a useful information for trajectory prediction. Recently, some works have considered the agent intention prediction in the trajectory prediction task, such as PECNet (Mangalam et al., 2020), TNT (Zhao et al., 2021), DenseTNT (Gu et al., 2021), and so on. However, these methods simplify the problem by assuming that the agent intention endpoint, which reveals the agent movement intention, remains constant during the prediction range.
In fact, predicting the endpoint coordinates of pedestrians is a very challenging task. Pedestrians will dynamically adjust their intent endpoint coordinates in respond to the change of scene information in different regions. As shown in Figure 1, the pedestrian in the red frame is the target pedestrian. In the left image, the vehicle on the right is parked at the upper right of the image and has no tendency to move forward. At this time, the short-term movement target of the pedestrian is the red star below the vehicle. However, during the movement of the pedestrian, the vehicle starts to move forward, blocking the original movement target of the pedestrian. Due to environmental changes, pedestrians must change their original intention and move toward the green star at the upper right. It is important to dynamically analyze the pedestrian's intent coordinate by combining the pedestrian's motion state and scene characteristics.
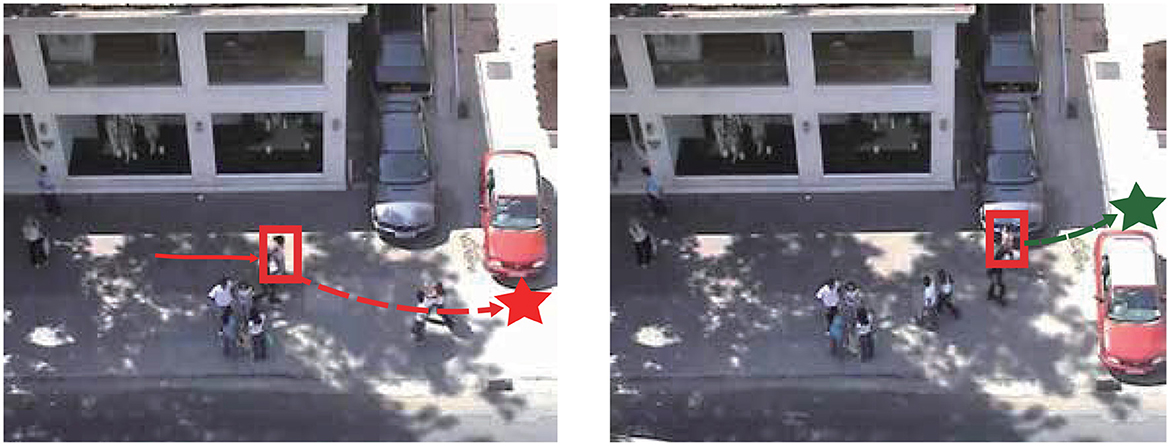
Figure 1. Dynamic change of the pedestrian intention.
In addition, when modeling the future intention of the pedestrian, existing methods generally use the multi-layer perceptrons (MLPs) to predict a 2-d coordinate as the intention feature. Huang et al. (2021) models the intention with a Mutable Intention Filter to address the drift in long-term pedestrian trajectory prediction, and its experiment demonstrates the goal prediction is changing during the prediction process. But there are limitations in the work. Firstly, this work assumes that all targets are located at the scene edges, which is unrealistic. And it models the intention with specific 2-D locations. The pedestrian's movement intention information should not be modeled as a specific physical coordinate, and the observable coordinate cannot fully represent the pedestrian's intention to help predict the future trajectory as in Figure 1.
In this paper, we model the intention as features that combine both fine-precision destination and coarse-precision region representation, and could be dynamically changed in the prediction process, consider the dynamic changing caused by environment and pedestrian. To extract a feasible dynamic intention feature, we propose a multi-precision pedestrian intention analysis module, which dynamically predicts intent from the scene information and history trajectory. We generate the coarse-precision coordinate from the history trajectory, then we use the scene heatmap and the coarse-precision coordinate to calculate the local dynamic feature. By combining the local dynamic feature and the coarse-precision coordinate, we predict agent intention feature as an assistance to predicting the future trajectory. In addition, three sub-tasks including prediction of coarse-precision endpoint coordinate, fine-precision endpoint coordinate and scene sub-regions scoring are proposed to help training the feasible dynamic agent intent extraction module.
We propose Dynamic Target Driven Network for pedestrian trajectory prediction (DTDNet). First, we use a motion pattern encoding module to extract movement patterns from pedestrian historical trajectories. After that, we use multi-precision pedestrian intention analysis module to extract the feasible intention based on multi-precision feature input. At the same time, multi-precision intention analysis sub-tasks are introduced to aid pedestrian intent information extraction. Finally, a pedestrian trajectory decoding module based on the CVAE generation framework combines pedestrian movement patterns and scene information to predict pedestrian intent coordinates dynamically. The contributions of this paper are as follows:
1. We discuss the dynamic changing attribute of pedestrian intention prediction process, and propose a novel module to extract the dynamic intention feature accordingly. This module encodes the pedestrian future intention at each time steps iteratively with scene information, and we propose a multi-task structure to aid the feature learning process with three related subtasks.
2. We propose a novel multi-precision pedestrian trajectory data representation method to estimate the multi-precision intention, including three aspects: coarse-precision coordinates, fine-precision coordinates, and local scene information.
3. We design a new trajectory prediction model DTDNet, which conducts the prediction with dynamic intention modeling and multi-precision history data. Qualitative and quantitative experiments show that this model outperforms current methods and predicts endpoint coordinates closer to the future endpoint.
2 Related work
2.1 Trajectory prediction
Early researches on trajectory prediction are based on hand-craft rules and energy potentials. Helbing and Molnar (1995) model the force between pedestrians by attractive force and repulsive force. However, with the limitation of the hand-craft functions, the previous approaches cannot model the complicated interactions in crowded scenarios. Trajectory prediction is a time series prediction task, many data-driven methods (Oliveira et al., 2021; Zhang et al., 2022) have been proposed to solve this problem in recent years. Alahi et al. (2016) propose one of the earliest deep learning models for trajectory prediction, which uses a grid-based “social pooling” layer to aggregate the hidden state of the pedestrians in the neighborhood. Gupta et al. (2018) also use the pooling-based method and propose a “pooling module” to share information of all the pedestrians in the whole scene. Vemula et al. (2018) and Kosaraju et al. (2019) introduce the attention mechanism to assign different importance to different agents. Recent works (Huang et al., 2019; Hu et al., 2020; Mohamed et al., 2020; Tao et al., 2020) are all graph-based methods that use graph neural networks to model the interactions among the pedestrians.
2.2 Human-scene interaction
Pedestrian motion is not only affected by surrounding pedestrians, but the layout features of the scene also limit the movement space of pedestrians. Therefore, effectively extracting scene information plays a crucial role in trajectory prediction. Some works (Vemula et al., 2018; Huang et al., 2019) use VGGNet to encode a large scene's complete overhead image information. The model can learn any scene information and use the visual attention mechanism to assign important spatial regions to pedestrians. To incorporate scene category information, Yao et al. (2021) use a semantic segmentation model to process scene pictures. Pixel-level scene category information can be obtained by using semantic segmentation information. However, this method still has ambiguous information and does not know whether pedestrians in this category could move forward. Wang et al. (2022) proposed a heat map construction method based on historical trajectory statistics and used the GLU module to model scene information continuity.
2.3 Human intention prediction
Pedestrians have subjective intentions to guide themselves to reach their expected goals. Recently, some researchers have begun to research the endpoint prediction of pedestrians. Mangalam et al. (2020) used the CVAE module to predict the endpoint information and then predicted the complete trajectory. Different from the previous model, Lerner et al. (2007) used the bidirectional trajectory fitting method to predict the complete trajectory in the stage of generating the complete trajectory. Zhao et al. (2021) propose to set up multiple candidate endpoints in the region where pedestrians are likely to reach and score different candidate endpoints based on pedestrian characteristics. Gu et al. (2021) improved TNT (Zhao et al., 2021) and proposed a trajectory prediction method without pre-defining candidate targets. It dramatically improves the performance of target estimation without relying on heuristic predefined target quality. Unlike previous work that only modeled a single long-term objective, Robicquet et al. (2016) proposed a step-wise objective-driven network for trajectory prediction that evaluates and uses the goal at multiple time scales.
3 Method
In this section, we introduce structure of our DTDNet model, as shown in Figure 2. At first, we present the construction of multi-precision data. Then we discuss the three sub-networks of DTDNet: the motion pattern encoding module, multi-precision pedestrian intention analysis module and trajectory decoding module.
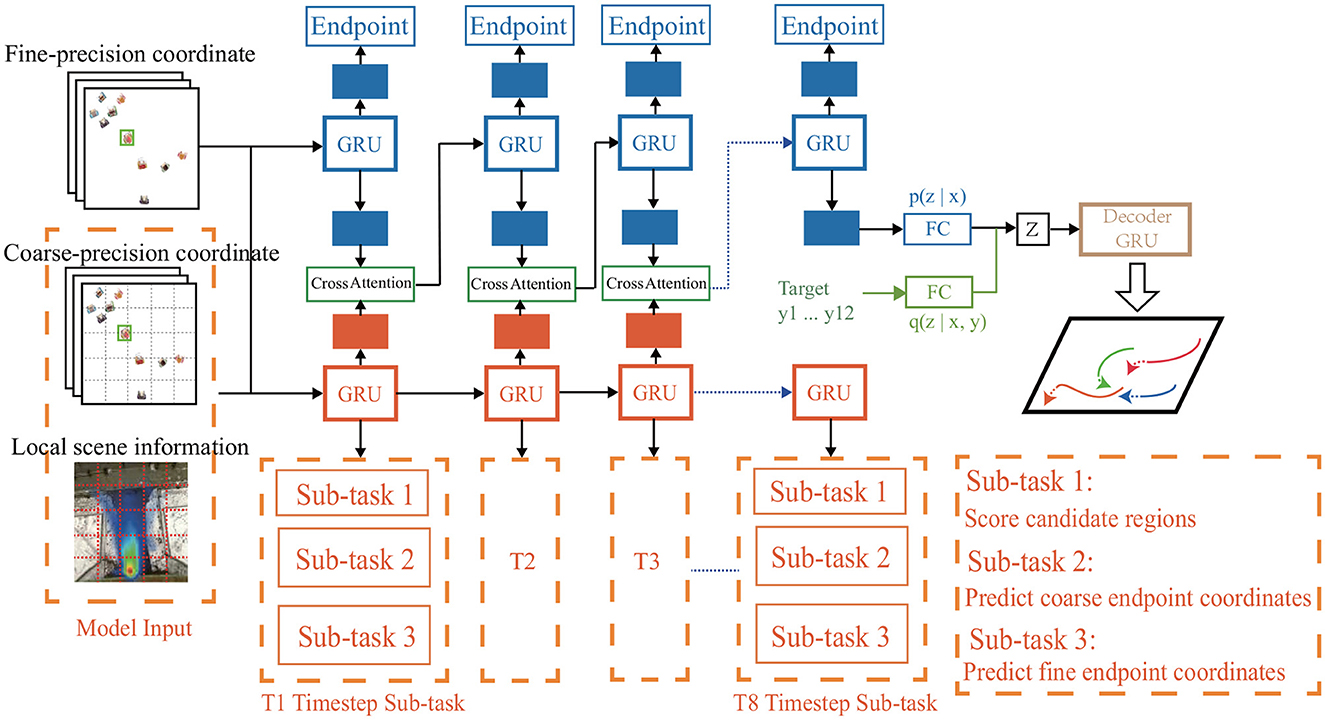
Figure 2. Overview of our proposed DTDNet. Take fine-precision, coarse-percision pedestrian coordinate and local scene information as input, the DTDNet is consisted of three parts: a motion pattern encoding module based on pedestrian historical trajectories (blue), a dynamic multi-task intent analysis module based on multi-precision feature input (orange), a multi-modal trajectory decoding module based on the CVAE freamwork (green and brown). Green part in the CVAE module is used only in the training stage.
3.1 Formulations
We assume that there are N pedestrians in the scene I, the position coordinates of pedestrian i at time step t is denoted as . Our model uses historical trajectories to predict the future locations and minimize the distance between prediction and future trajectory .
3.2 Multi-precision data construction
We get three kinds of data for the model to perform the multi-precision modeling, namely fine-precision coordinates, coarse-precision coordinates, and dynamic local scene information.
3.2.1 Coarse precision coordinate generation
A schematic diagram of coarse-precision coordinates is shown on the left in Figure 2, the model divides the global scene into multiple sub-regions. The region coordinates are the input coarse-precision coordinates, which retain the physical information of the scene location and are easy to combine with the scene information.
First, we collect coordinate ranges (xmin, xmax, ymin, ymax) of different scenes based on the training data. Following the principle of equal spacing, we get the segmentation space of each region according to the set division resolution R = m×n. Furthermore, we could use the pedestrian's current position Pi, the coordinate range of the scene (xmin, xmax, ymin, ymax), and the length of the region to calculate the coarse precision coordinates. By using Algorithm 1, we could get the pedestrians' coarse precision coordinates PR as shown in Algorithm 1.
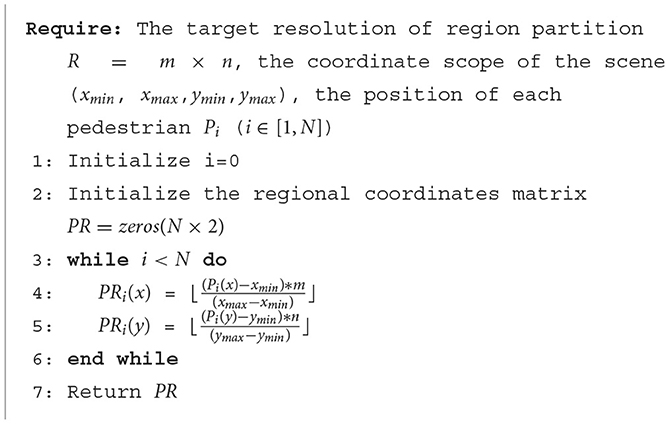
Algorithm 1. Strategy of coarse-precision coordinate generation.
3.2.2 Fine precision coordinate generation
After obtaining the coarse-precision coordinates of pedestrians, we perform data pre-processing on both fine-precision coordinates and coarse-precision coordinates. To increase the generation capability of the model, we set the position (xTobs, yTobs) of the target pedestrian at the last observation time step as the origin, and convert the absolute position into relative position according to the position of origin.
We adopt the same data pre-processing method as Trajectron++ (Salzmann et al., 2020). In addition to the position coordinates, the input data also uses the first-order derivation and second-order derivation of position to calculate the speed information and acceleration information in both x and y direction. And we augment the training dataset by rotating all trajectories every 15 degrees around the origin point.
3.2.3 Dynamic scene information
Most existing methods use semantic segmentation of the scene image to model scene information. Although semantic segmentation information has proved useful in 3D stereo reconstruction and other fields, this information is ambiguous and lacks the interaction semantics between scenes and pedestrians. For example, the lawn beside the road is defined the same as the lawn in the park. However, the lawn in the park is allowed for pedestrians to walk, and the roadside lawn is generally prohibited for pedestrians. The two have the same semantic information, but different social rules.
To solve the ambiguity of pedestrian interaction with semantic segmentation and make the scene information guide pedestrian future movement more accurately, DTDNet uses the method of STHGLU (Wang et al., 2022) to get the probability heatmap of each scene generated from historical trajectory collections. This method could provide the distribution of pedestrian movable area and the corresponding probability information. Coarse-precision coordinates keeps the spatial location information of the scene, combined with the regional information to get the local scene information.
Assuming that the coarse precision of the scene is R = m×n, we divide each sub-region with the precision of 9 × 9, and obtain the global scene information with the precision of R = 81 × m×n. At each moment, the model dynamically models the local scene s based on the pedestrian coarse-precision coordinate, provides information to guide the pedestrian future movement and avoid the pedestrian moving into the unreasonable area.
3.3 Motion pattern encoding sub-network
As shown in the upper blue part of Figure 2, the backbone of motion pattern encoding module is GRU, which inputs the fine-precision coordinates of pedestrians to model the motion pattern feature of pedestrians.
In Equation 1, we encode three input trajectory data including the position xt, yt, velocity Δxt, Δyt and acceleration axt, ayt to the pedestrian motion hidden representation et. In addition to the pedestrian motion state et, as shown in Equation 2, the model includes the pedestrian target intent vector gt. At each moment, the endpoint decoding module uses the MLP as fgoal to map the output of GRU to the endpoint coordinates of pedestrian, as shown in Equation 3. The goal prediction is trained with Lossdes, as shown in Equation 4. The goal prediction is trained with Lossdes, which is the distance between the real and the predict goal. Generation of the target intention vector gt from ht will be introduced in detail in Section 3.4.2.
3.4 Dynamic pedestrian target prediction
3.4.1 Multi-precision pedestrian intention analysis sub-network
In the model, the output ht is used to predict the pedestrian target coordinates at each time step, using the mean square error as loss can not guarantee complete converge at. In order to model the pedestrian's target intention and achieve a better convergence effect, we design a pedestrian dynamic intent prediction sub-network to update the pedestrian's intent dynamically.
The model input of the sub-network consists of three parts: the fine-precision coordinate pf, the coarse-precision coordinate pc, the scene information s. It is the same as Equation 1, the multi-layer perceptron encodes the fine-precision pf and coarse-precision pc coordinate and obtains embeddings ef and ec, respectively. As shown in Equation 5, the model uses the convolutional neural network (CNN) to encode the local scene information st to obtain .
In order to model the time series features and fuse them with the modeling information of the main network, we also use GRU to model the sequence of three kinds of information input by the sub-network. As shown in Equation 6, the input of the GRU model of the sub-network contains , , three dimensions of information, the output is the intent embedding predicted by the sub-network at time t, and WGRUsub is the training parameters.
3.4.2 Multi-precision pedestrian intention analysis sub-tasks
To extract the pedestrian intention feature, in addition to predicting the fine-precision coordinates of the target coordinate, DTDNet proposes two additional sub-tasks to model the pedestrian intent information, namely predicting the coarse-precision endpoint region and score the pedestrian intent destination region.
The first sub-tasks is shown in Equation 7. The model uses the MLP ff to map the pedestrian motion intention embedding to predict the fine-precision coordinates of the pedestrian intention, where Wf are trainable parameters.
The second sub-tasks is shown in Equation 8. The model uses the MLP fc to map the pedestrian motion intention vector to predict the coarse-precision coordinates of the pedestrian's endpoint, where Wc are the model update parameters.
The third sub-task is to estimate the likelihood of all sub-regions. First, the model uses the MLP fscore to map , where Wscore are the model update parameters. Then uses the Softmax function to score R = m×n sub-regions in the scene, as shown in Equation 9. Because there is only one ground truth region, we set the score of the true region to 1 and the scores of other regions to 0.
Through the above introduction, the loss function of the sub-network consists of three parts as shown in Equation 10. Where is the endpoint coordinate predicted by the model, p is the actual endpoint coordinate, score is the region scoring result, the label is the actual region scoring label, and LCE is the cross-entropy function.
However, since the current sub-network and the main network are decoupled, the main network cannot use the sub-networks loss function to assist in the model update. In order to use the back-propagation of the model to update the two networks synchronously, we design two network fusion schemes to couple the two parts of the network.
The first method is to fuse the motion state of the main network with the important scene information selected by the sub-network. The sub-network of the model scores the importance of m×n sub-regions at each moment and selects the Top K with the highest scores. The target sub-region is used as the key region, and the CNN shown in Equation 5 encodes the selected K regions, respectively.
After encoding K regions, the model uses Equation 11 to fuse K scene information to obtain the crucial regional information that pedestrians need to consider. Finally, the multi-attention mechanism and residual connection are used to combine the two networks to get the target intention vector gt.
Where < ·, ·> is the inner product operator, and r∈{1, …, p}, WQ, WK and WV are trainable parameters, ht is the output of the motion encoding network GRU of time step t, D is the embedding dimension of ht, p is the number of heads in the multi-head attention mechanism, sr is the attention score, and gt is the target intent embedding.
The fusion method introduced in Algorithm 1 directly combines K important scene information, which may introduce excessively artificially set rule information. It is difficult to determine the optimal value of parameter K. Therefore, we attempt to directly fuse the output of the sub-network with the GRU output ht of the main network using the attention mechanism introduced in Equations 12, 13.
3.5 Trajectory decoding sub-network
This sub-network utilizes CVAE based framework to generate multi-modal trajectories. CVAE framework is composed by an encoding module and a decoding module. The encoding network is further divided into a recognition distribution network qψ(z|Ph, Pf) and a prior distribution network pθ(z|Ph) given future ground truth trajectory as .
As shown in Equation 14, the model encodes the pedestrian historical and future motion feature, and generates the mean μ and variance σ corresponding to a Gaussian distribution, and samples high-dimensional latent variable z from Gaussian distribution N(μ, σ). Then combines the sampled high-dimensional latent variable z with the GRU output ht to obtain the hidden state , and iterate the hidden state at each time step, as shown in Equations 15, 16. Finally use the decoding module Equation 17 to predict the complete future trajectory.
Where qψ, fmlp,fpred,fdecoder are implemented as MLPs, and ⊕ represents the concatenate operation. represents the initial embedding of decoder GRU(D-GRU), hobs is the motion information of the pedestrian at time Tobs, z represents the latent variable generated by the CVAE framework; ,ŷt represents the pedestrian position predicted by the model at time step t.
In the testing phase, the latent variable z is directly sampled from pθ(z|Ph), and the recognition distribution is not calculated. We use KL divergence to make sure that prior distribution is same with the recognition distribution in the training stage, as shown in Equation 18. Finally, the model is trained end-to-end from loss Lossvariety, which is composed by the KL-divergence, sub-tasks loss, goal prediction loss, and the distance between the best prediction and the future trajectory, as shown in Equation 19.
4 Experiments and results
Datasets: We evaluate the performance of our model and report results on two real-world public datasets: ETH-UCY Dataset (Pellegrini et al., 2009; Dendorfer et al., 2021) and Stanford Drone Dataset (Shi et al., 2021). ETH-UCY contains five subsets: ETH, HOTEL, UNIV, ZARA1, ZARA2. It contains 1,536 pedestrians and introduces interactions like group interactions, collision avoidance. We follow the experimental settings in Trajectron++ (Yu et al., 2020), which convert the data to the world coordinate system and split them into 8 s segments (20 time steps). We use historical 3.2 s (eight time steps) to predict the future 4.8 s (12 time steps). Stanford Drone Dataset contains 20 scenes. We use the data released by NMMP (Tao et al., 2020), whose coordinates of trajectories are provided in pixels, and the experimental settings are the same as ETH-UCY. For the ETH-UCY and Stanford Drone Dataset, we use the leave-one-out evaluation strategy to test different models.
Implementation details: We train our models with Adam optimizer, batch size 64, learning rate 0.0001 on a single NVIDIA Tesla T4 GPU. In coarse-precision modeling, we adopt different partitioning strategies. We divide ETH-UCY into 5 × 5 regions, and Stanford Drone Dataset into 9 × 9 regions. The resolution of scene information for each sub-region is 9 × 9. MLP and GRU hidden layer dimension are set to 256. The dimension of latent variable z is 64, which is sampled from a CVAE framework generated distribution. The hyper-parameter of variety loss weight is set to 20.
4.1 Quantitative evaluation
We compare our method with seven state-of-the-art methods, including PMP-NMMP, Social-STGCNN, STAR, PECNET, Trajectron++. The results are shown in Table 1, which are evaluated with the ADE and FDE metrics. The results indicate that our method significantly outperforms all the competing methods on the ETH and UCY datasets. Our method outperforms Agentformer (Yuan et al., 2021) by 17.4% on the ADE metric, and on the FDE metric, our method outperforms Agentformer by 7.7%.
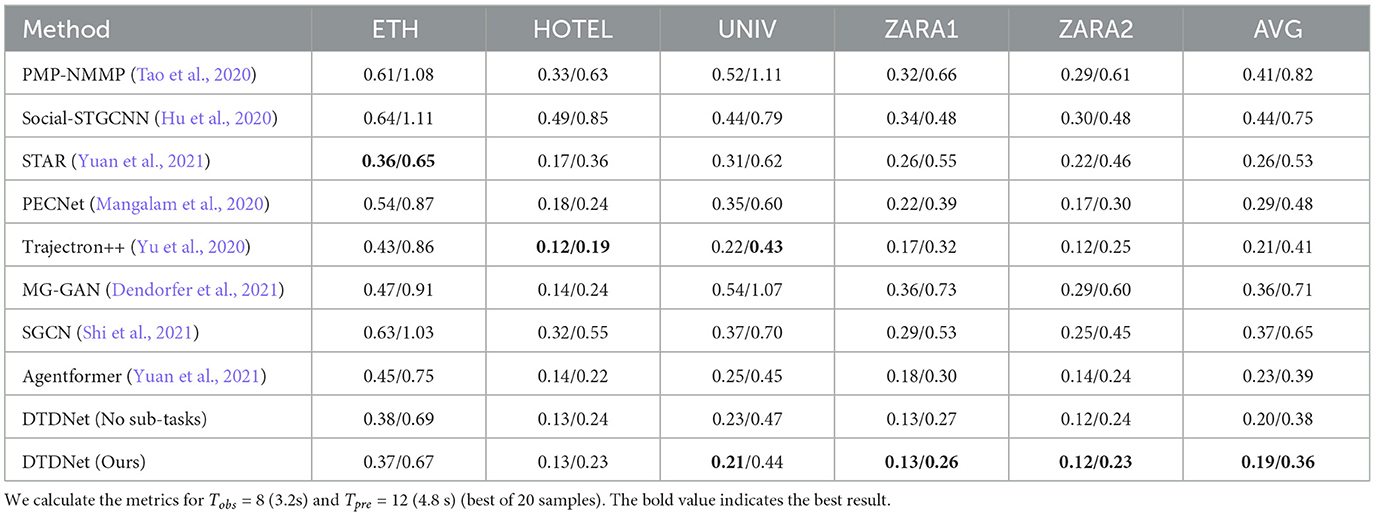
Table 1. Quantitative results of all the previous state-of-the-art methods and our model on ETH-UCY.
To compare the results of deterministic sampling, we compared the past three models, namely STGAT, STAR, and Trajectron++. The experimental results are shown in Table 2. Although our method is consistent with Trajectron++ in ADE metrics, our method is superior to Trajectorn++ by 12.6% in FDE, which shows that the intent prediction module has played a role, and pedestrians' intent coordinates could be predicted more accurately.
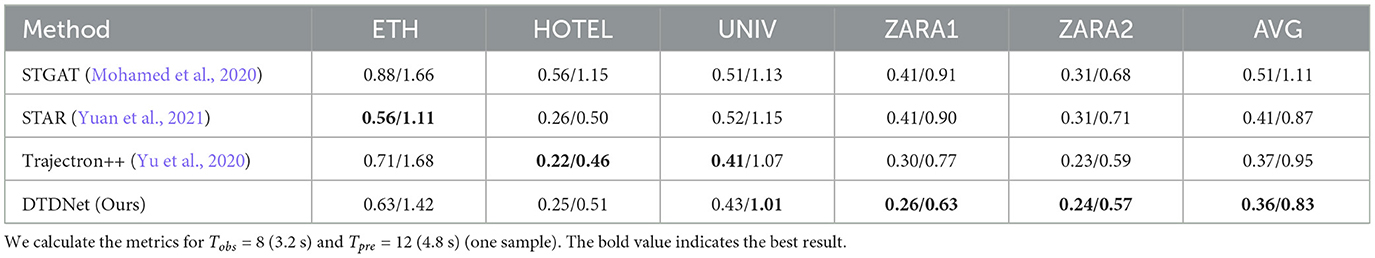
Table 2. Quantitative results of all the previous state-of-the-art methods and our model on ETH-UCY.
Table 3 shows the experimental results of Stanford Drone Dataset. The scenes of Stanford Drone Dataset are rich and various, and our model performs better than all previous works on this dataset. We outperform the best Trajectron++ model on the ADE metrics by 7.1%, and in the FDE metrics, our method outperforms the PECNet model by 3.1%. It means that our model has a better ability in the migration of different scenes.
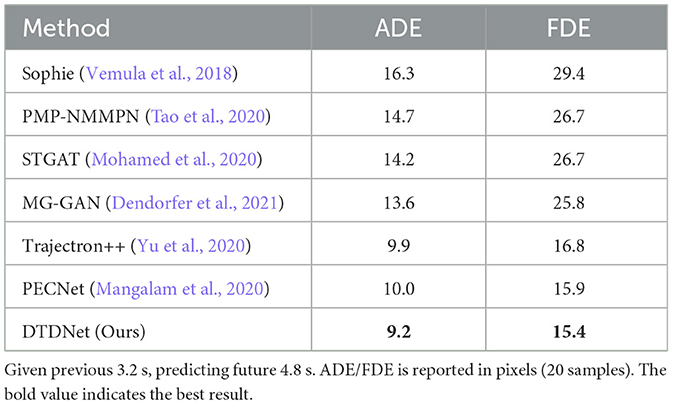
Table 3. Quantitative comparison on Stanford Drone Dataset.
4.2 Ablation study
To verify the role of the auxiliary loss function in the sub-tasks, we designed an ablation experiment on ETH-UCY dataset for comparison in the last two lines of Table 1. The ablation model still retains local scene information and coarse-precision coordinates but does not add the loss function for auxiliary sub-tasks updates. Compared with the ablation model, the whole model can improve the ADE and FDE metrics by 5.0 and 5.6%, respectively.
To evaluate the promotion effect of the three sub-tasks on pedestrian intent prediction, as shown in Table 4, we designed four ablation models on SDD dataset for comparative experiments: (1) Replace the CVAE module with Gaussian noise sampling, (2) without the sub-task of scene scoring, (3) without the coarse-precision prediction sub-task, (4) without the fine-precision prediction sub-task. It shows that the fine-precision prediction task is still the most effective task that affects the trajectory prediction results most significantly. The coarse-precision prediction and scene scoring tasks also could improve the trajectory prediction effect. Our model does not take any pedestrian interaction information into consideration, which shows that only using pedestrian motion features and scene information could achieve sota results.
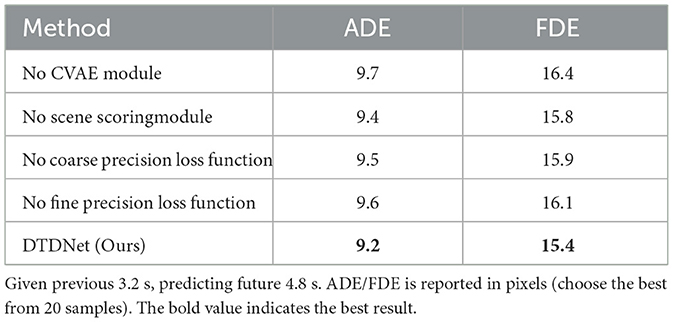
Table 4. Ablation study of DTDNet structure on Stanford Drone Dataset.
To evaluate the effectiveness of the sub-tasks and choose an appropriate region division accuracy, we conduct experiments in Tables 5, 6. In Table 5, we conduct experiments with different coarse precision settings on the SDD dataset, and the ADE/FDE results show that the 9 × 9 precision division results are better than other precision settings. In Table 6, we evaluated the recall for the important region scoring sub-tasks at time step T8 and compared the effects of different region division accuracy and different recall numbers. TP is the number of target regions recalled by the model, P is the number of samples in the test experiment, each sample has only one target region, and Precall is the recall rate, as shown in Equation 20.
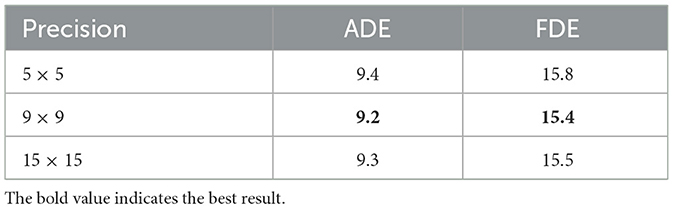
Table 5. Ablation study of different coarse precisions on Stanford Drone Dataset (ADE/FDE is reported).
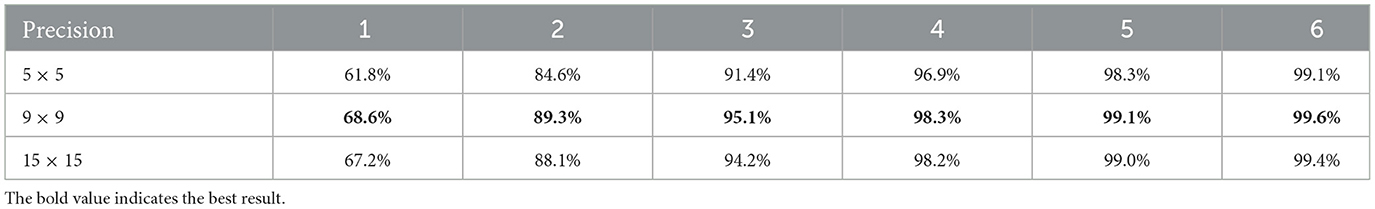
Table 6. Relationship between recall rate P and recall number k under different precisions on Stanford Drone Dataset.
Table 6 shows that the model recalls the Top 1 scored region, and the recall rate of the target area is more than 60%. When the recall number is 6, the recall rate of the target region is close to 100%. The regional scoring task can identify important areas and predict the target region of pedestrians with better accuracy. Table 6 shows that the recall rate of the model in the 9 × 9 precision are better than the 5 × 5 or 15 × 15 precision. This result is consistent with the results in Table 5, so we set the coarse precision size to 9 × 9 on dataset with a larger scene.
4.3 Qualitative evaluation
4.3.1 Visualization of the DTDNet and ground truth
We select two motion modes for display: group motion and pedestrian motion to avoid collision. In Figures 3A, B, multiple groups of pedestrians are moving in the same direction, and the results predicted by our model almost completely fit the actual red trajectories. In Figures 3C, D, the pedestrian motion trajectory avoids collision with surrounding pedestrians and obstacles. Our model predicts the pedestrian's turning motion intention and effectively predicts the pedestrian's offset angle, avoids collision with vehicles and passing pedestrians.
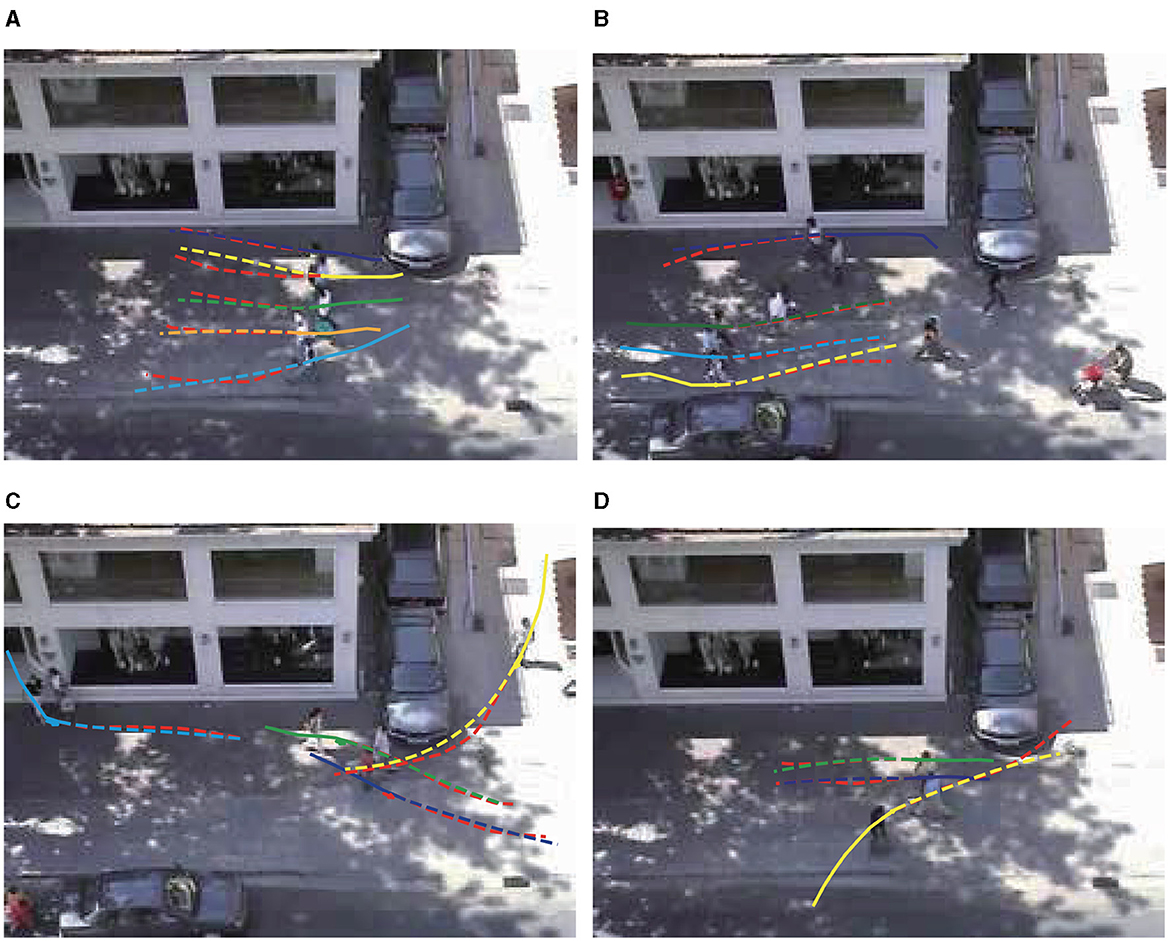
Figure 3. (A–D) Qualitative analysis of DTDNet. For a better view, only part of the pedestrians in the scene is presented. The illustration scenes are selected from ZARA1. Observed trajectories are shown as solid lines, and the predicted trajectories are shown as dashed lines. The red line represents the true trajectory.
4.3.2 Visualization of the trajectory distribution
As shown in the Figure 4, we compare our model (DTDNet) with Social-STGCNN in four different scenarios selected from ETH, HOTEL, ZARA1 and ZARA2 dataset. The dashed line represents the observed trajectory, and the solid line represents ground truth of the prediction and the color density is the predicted trajectory distribution. Figure 4A shows that the future trajectories of the two pedestrians above are slightly shifted downward, DTDNet model predicts the same trajectory distribution, but Social-STGCNN predicts that the pedestrians are still going straight. As shown in Figure 4B, compared with Social-STGCNN, DTDNet can predict the pedestrian's speed and the pedestrian's endpoint more accurately, so it can cover the true trajectory of the pedestrian. We could even predict multiple distribution trends in cases where there may be many likely future trajectories, and our generation framework does not have a mode collapse problem like other methods. As shown in Figure 4C, taking the green trajectory in the figure as example, DTDNet not only predicts the movement of turning upward, but also predicts the trend of downward turning. However, the prediction effect of the model also has certain shortcomings. As shown in Figure 4D, when pedestrians perform a sudden turning in the prediction time region, existing methods cannot predict the turning trend successfully. In future, we will try to introduce interactive information between dynamic obstacles in the predicting period to explore this problem.
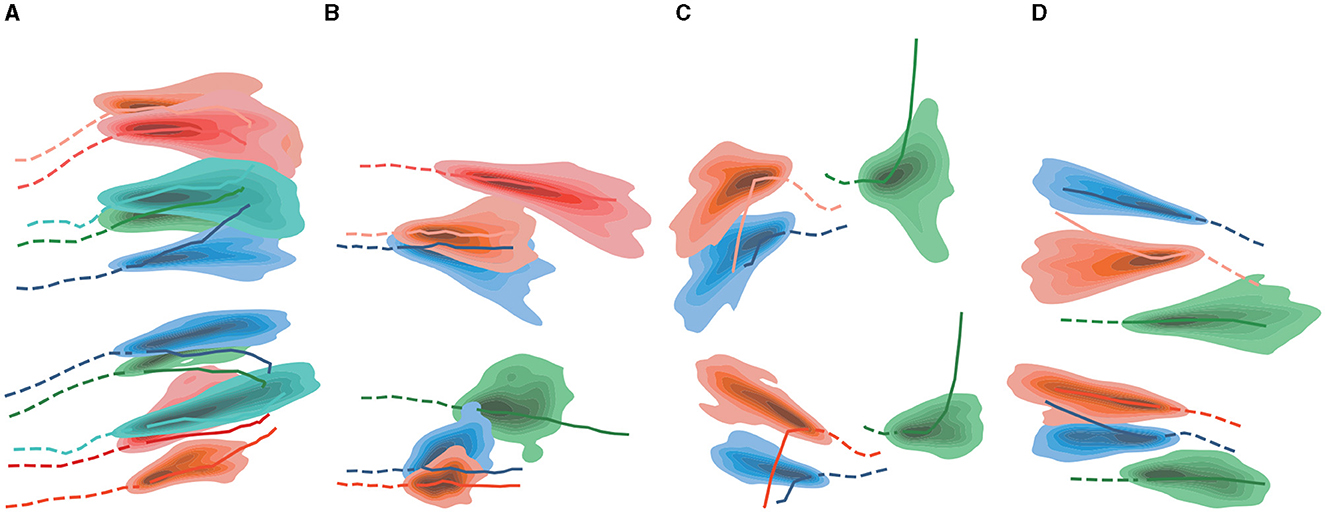
Figure 4. (A–D) Qualitative analysis of DTDNet and Social-STGCNN. Upper ones are from DTDNet, lower ones are from Social-STGCNN.
4.3.3 Visualization of intention prediction
To exhibit the dynamic prediction of pedestrian intent coordinate, we select a scene from the Stanford Drone Dataset and visualize the dynamic pedestrian intent and regional score predicted by the model in Figure 5. The red star represents the future target endpoint, and the yellow star represents the predicted target coordinate at different time steps, the color of each sub-region represents the magnitude of the scene importance score, and the red region represents the high score. In Figure 5, four time step results of pedestrian movement and divide the scene into 81 sub-regions according to the precision of 9 × 9. The model dynamically predicts pedestrian intent coordinates and the importance score of the scene. As the pedestrian moves, the target coordinate of the yellow star predicted by the model gradually approaches the real target. The importance score of the region near the actual location gradually increases. The color of the visualization gradually turns red, such as the region where the red star is located by the yellow at time T1 in Figure 5A becomes red at time T8 in Figure 5D. The number of the red regions near the finish area also increases significantly.
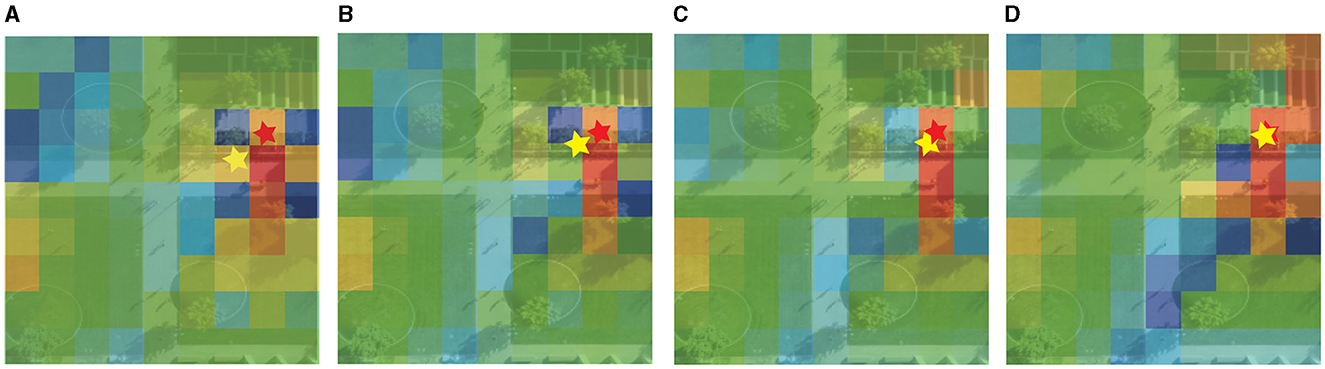
Figure 5. Visualization of dynamic intent prediction by DTDNet. Red star is the future endpoint, and yellow star represents the predicted target. Color of each sub-region represents the scene importance score. Red is the highest, green is the middle and blue is the lowest score. (A) T1. (B) T3. (C) T5. (D) T8.
5 Conclusion
In this work, we propose DTDNet, a Dynamic Target Driven Network for pedestrian trajectory prediction. Different from previous models that predict a fixed endpoint, DTDNet is designed to model the intention of a pedestrian dynamically with a hidden representation. This hidden representation could jointly represents mixture information of intention. We also introduce a multi-precision data representation method and three sub-tasks to analyze pedestrians motion intentions from different precision feature. The three sub-tasks are proved helpful to make sure the hidden representation could converge and be useful to the intention representation at each time step. Our proposed model is a superior to the baseline models in quantitative metrics on two publicly available datasets. Qualitative experiments show that our model could predict pedestrian intention accurately and dynamically. In the future, research should consider the potential effects of bringing related subtasks to help the network hidden representation of pedestrian converge better and add more supervision to the feature. Furthermore, the dynamic modeling of intentions at each timestep, along with predictions, could benefit from a more complicate network architecture that incorporates the modeling of complex interactions among moving objects within the scene to distill involved information.
Data availability statement
Publicly available datasets were analyzed in this study. This data can be found at: https://github.com/StanfordASL/Trajectron-plus-plus/tree/master/experiments/pedestrians/raw.
Author contributions
SL: Conceptualization, Methodology, Supervision, Writing – review & editing. JS: Conceptualization, Methodology, Software, Writing – original draft. PY: Methodology, Validation, Visualization, Writing – review & editing. YZ: Methodology, Validation, Visualization, Writing – review & editing, Software. TM: Conceptualization, Methodology, Project administration, Supervision, Writing – review & editing. ZW: Project administration, Supervision, Writing – review & editing.
Funding
The author(s) declare financial support was received for the research, authorship, and/or publication of this article. This work was supported in part by the Major Program of National Natural Science Foundation of China under Grant 91938301, in part by the National Key Research and Development Program of China under Grant 2020YFB1710400, in part by the Youth Program of National Natural Science Foundation of China under Grant 62002345, and in part by the Innovation Program of Institute of Computing Technology Chinese Academy of Sciences under Grant E261070.
Conflict of interest
The authors declare that the research was conducted in the absence of any commercial or financial relationships that could be construed as a potential conflict of interest.
Publisher's note
All claims expressed in this article are solely those of the authors and do not necessarily represent those of their affiliated organizations, or those of the publisher, the editors and the reviewers. Any product that may be evaluated in this article, or claim that may be made by its manufacturer, is not guaranteed or endorsed by the publisher.
References
Alahi, A., Goel, K., Ramanathan, V., Robicquet, A., Fei-Fei, L., Savarese, S., et al. (2016). “Social lstm: human trajectory prediction in crowded spaces,” in Proceedings of the IEEE Conference on Computer Vision and Pattern Recognition (Las Vegas, NV: IEEE), 961–971. doi: 10.1109/CVPR.2016.110
Bennewitz, M., Burgard, W., Cielniak, G., and Thrun, S. (2005). Learning motion patterns of people for compliant robot motion. Int. J. Robot. Res. 24, 31–48. doi: 10.1177/0278364904048962
Chandra, R., Guan, T., Panuganti, S., Mittal, T., Bhattacharya, U., Bera, A., et al. (2020). Forecasting trajectory and behavior of road-agents using spectral clustering in graph-lstms. IEEE Robot. Autom. Lett. 5, 4882–4890. doi: 10.1109/LRA.2020.3004794
Dendorfer, P., Elflein, S., and Leal-Taixé, L. (2021). “MG-GAN: a multi-generator model preventing out-of-distribution samples in pedestrian trajectory prediction,” in 2021 IEEE/CVF International Conference on Computer Vision (ICCV) (Montreal, QC), 13138–13147. doi: 10.1109/ICCV48922.2021.01291
Gu, J., Sun, C., and Zhao, H. (2021). “Densetnt: end-to-end trajectory prediction from dense goal sets,” in Proceedings of the IEEE/CVF International Conference on Computer Vision (Montreal, QC: IEEE), 15303–15312. doi: 10.1109/ICCV48922.2021.01502
Gupta, A., Johnson, J., Fei-Fei, L., Savarese, S., and Alahi, A. (2018). “Social Gan: socially acceptable trajectories with generative adversarial networks,” in Proceedings of the IEEE Conference on Computer Vision and Pattern Recognition (Salt Lake City, UT: IEEE), 2255–2264. doi: 10.1109/CVPR.2018.00240
Helbing, D., and Molnar, P. (1995). Social force model for pedestrian dynamics. Phys. Rev. E 51:4282. doi: 10.1103/PhysRevE.51.4282
Hu, Y., Chen, S., Zhang, Y., and Gu, X. (2020). “Collaborative motion prediction via neural motion message passing,” in Proceedings of the IEEE/CVF Conference on Computer Vision and Pattern Recognition (Seattle, WA: IEEE), 6319–6328. doi: 10.1109/CVPR42600.2020.00635
Huang, Y., Bi, H., Li, Z., Mao, T., and Wang, Z. (2019). “STGAT: modeling spatial-temporal interactions for human trajectory prediction,” in Proceedings of the IEEE/CVF International Conference on Computer Vision (Seoul: IEEE), 6272–6281. doi: 10.1109/ICCV.2019.00637
Huang, Z., Hasan, A., Shin, K., Li, R., and Driggs-Campbell, K. (2021). Long-term pedestrian trajectory prediction using mutable intention filter and warp lstm. IEEE Robot. Autom. Lett. 6, 542–549. doi: 10.1109/LRA.2020.3047731
Kosaraju, V., Sadeghian, A., Martín-Martín, R., Reid, I., Rezatofighi, H., and Savarese, S. (2019). “Social-BiGAT: multimodal trajectory forecasting using bicycle-GAN and graph attention networks,” in Proceedings of the 33rd International Conference on Neural Information Processing Systems (Red Hook, NY: Curran Associates Inc.).
Lerner, A., Chrysanthou, Y., and Lischinski, D. (2007). “Crowds by example,” in Computer graphics forum, Vol. 26 (Hoboken, NJ: Wiley Online Library), 655–664. doi: 10.1111/j.1467-8659.2007.01089.x
Ma, Y., Zhu, X., Zhang, S., Yang, R., Wang, W., Manocha, D., et al. (2019). ‘Trafficpredict: trajectory prediction for heterogeneous traffic-agents,. Proc. AAAI Conf. Artif. Intell. 33, 6120–6127. doi: 10.1609/aaai.v33i01.33016120
Mangalam, K., Girase, H., Agarwal, S., Lee, K.-H., Adeli, E., Malik, J., et al. (2020). “It is not the journey but the destination: endpoint conditioned trajectory prediction,” in Computer Vision-ECCV 2020: 16th European Conference, Glasgow, UK, August 23–28, 2020, Proceedings, Part II 16 (Cham: Springer), 759–776. doi: 10.1007/978-3-030-58536-5_45
Mohamed, A., Qian, K., Elhoseiny, M., and Claudel, C. (2020). “Social-STGCNN: a social spatio-temporal graph convolutional neural network for human trajectory prediction” in Proceedings of the IEEE/CVF Conference on Computer Vision and Pattern Recognition (Seattle, WA: IEEE), 14424–14432. doi: 10.1109/CVPR42600.2020.01443
Oh, S., Hoogs, A., Perera, A., Cuntoor, N., Chen, C.-C., Lee, J. T., et al. (2011). “A large-scale benchmark dataset for event recognition in surveillance video,” in CVPR 2011 (Colorado Springs, CO: IEEE), 3153–3160. doi: 10.1109/CVPR.2011.5995586
Oliveira, D. D., Rampinelli, M., Tozatto, G. Z., Andreão, R. V., and Müller, S. M. (2021). Forecasting vehicular traffic flow using MLP and LSTM. Neural Comput. Appl. 33, 17245–17256. doi: 10.1007/s00521-021-06315-w
Pellegrini, S., Ess, A., Schindler, K., and Van Gool, L. (2009). “You'll never walk alone: modeling social behavior for multi-target tracking,” in 2009 IEEE 12th International Conference on Computer Vision (Kyoto: IEEE), 261–268. doi: 10.1109/ICCV.2009.5459260
Rasouli, A., Kotseruba, I., Kunic, T., and Tsotsos, J. K. (2019). “PIE: a large-scale dataset and models for pedestrian intention estimation and trajectory prediction,” in 2019 IEEE/CVF International Conference on Computer Vision (ICCV) (Seoul: IEEE), 6261–6270. doi: 10.1109/ICCV.2019.00636
Robicquet, A., Sadeghian, A., Alahi, A., and Savarese, S. (2016). “Learning social etiquette: human trajectory understanding in crowded scenes,” in Computer Vision-ECCV 2016: 14th, European Conference, Amsterdam, The Netherlands, October 11–14, 2016, Proceedings, Part VIII 14 (Cham: Springer), 549–565. doi: 10.1007/978-3-319-46484-8_33
Salzmann, T., Ivanovic, B., Chakravarty, P., and Pavone, M. (2020). “Trajectron++: dynamically-feasible trajectory forecasting with heterogeneous data,” in Computer Vision-ECCV 2020: 16th, European Conference, Glasgow, UK, August 23–28, 2020, Proceedings, Part XVIII 16 (Cham: Springer), 683–700. doi: 10.1007/978-3-030-58523-5_40
Shi, L., Wang, L., Long, C., Zhou, S., Zhou, M., Niu, Z., et al. (2021). “SGCN: sparse graph convolution network for pedestrian trajectory prediction,” in 2021 IEEE/CVF Conference on Computer Vision and Pattern Recognition (CVPR) (Nashville, TN: IEEE), 8990–8999. doi: 10.1109/CVPR46437.2021.00888
Sultani, W., Chen, C., and Shah, M. (2018). “Real-world anomaly detection in surveillance videos,” in Proceedings of the IEEE Conference on Computer Vision and Pattern Recognition (Salt Lake City, UT: IEEE), 6479–6488. doi: 10.1109/CVPR.2018.00678
Tao, C., Jiang, Q., Duan, L., and Luo, P. (2020). “Dynamic and static context-aware lstm for multi-agent motion prediction,” in European Conference on Computer Vision (Cham: Springer), 547–563. doi: 10.1007/978-3-030-58589-1_33
Vemula, A., Muelling, K., and Oh, J. (2018). “Social attention: modeling attention in human crowds,” in 2018 IEEE international Conference on Robotics and Automation (ICRA) (Brisbane, QLD: IEEE), 4601–4607. doi: 10.1109/ICRA.2018.8460504
Wang, C., Wang, Y., Xu, M., and Crandall, D. J. (2022). Stepwise goal-driven networks for trajectory prediction. IEEE Robot. Autom. Lett. 7, 2716–2723. doi: 10.1109/LRA.2022.3145090
Yao, Y., Atkins, E., Johnson-Roberson, M., Vasudevan, R., and Du, X. (2021). Bitrap: bi-directional pedestrian trajectory prediction with multi-modal goal estimation. IEEE Robot. Autom. Lett. 6, 1463–1470. doi: 10.1109/LRA.2021.3056339
Yu, C., Ma, X., Ren, J., Zhao, H., and Yi, S. (2020). “Spatio-temporal graph transformer networks for pedestrian trajectory prediction,” in Computer Vision-ECCV 2020: 16th, European Conference, Glasgow, UK, August 23-28, 2020, Proceedings, Part XII 16 (Cham: Springer), 507–523. doi: 10.1007/978-3-030-58610-2_30
Yuan, Y., Weng, X., Ou, Y., and Kitani, K. M. (2021). “Agentformer: agent-aware transformers for socio-temporal multi-agent forecasting,” in Proceedings of the IEEE/CVF International Conference on Computer Vision (Montreal, QC: IEEE), 9813–9823. doi: 10.1109/ICCV48922.2021.00967
Zhang, X., Xu, Y., and Shao, Y. (2022). Forecasting traffic flow with spatial-temporal convolutional graph attention networks. Neural Comput. Appl. 34, 15457–15479. doi: 10.1007/s00521-022-07235-z
Keywords: multimodal trajectory prediction, pedestrian intention prediction, multi-precision motion prediction, multi-task neural network, trajectory endpoint prediction
Citation: Liu S, Sun J, Yao P, Zhu Y, Mao T and Wang Z (2024) DTDNet: Dynamic Target Driven Network for pedestrian trajectory prediction. Front. Neurosci. 18:1346374. doi: 10.3389/fnins.2024.1346374
Received: 29 November 2023; Accepted: 11 April 2024;
Published: 30 April 2024.
Edited by:
Krishna Kumar Mohbey, Central University of Rajasthan, IndiaReviewed by:
Neha Sharma, Delhi Technological University, IndiaZhe Huang, University of Illinois at Urbana-Champaign, United States
Copyright © 2024 Liu, Sun, Yao, Zhu, Mao and Wang. This is an open-access article distributed under the terms of the Creative Commons Attribution License (CC BY). The use, distribution or reproduction in other forums is permitted, provided the original author(s) and the copyright owner(s) are credited and that the original publication in this journal is cited, in accordance with accepted academic practice. No use, distribution or reproduction is permitted which does not comply with these terms.
*Correspondence: Tianlu Mao, bHRtQGljdC5hYy5jbg==