
94% of researchers rate our articles as excellent or good
Learn more about the work of our research integrity team to safeguard the quality of each article we publish.
Find out more
ORIGINAL RESEARCH article
Front. Neurol., 07 July 2022
Sec. Pediatric Neurology
Volume 13 - 2022 | https://doi.org/10.3389/fneur.2022.934755
 Pratima Gaulee1*†
 Zhihui Yang2†
 Livia Sura1Haiyan Xu2Candace Rossignol1
 Michael D. Weiss1
 Nikolay Bliznyuk3
Objective: To determine the concentrations of four neuroprotein biomarkers and 68 miRNAs in neonates with low cord pH and/or mild hypoxic-ischemic encephalopathy (HIE).
Study Design: A prospective cohort study enrolled neonates with low cord pH (n = 18), moderate-severe HIE (n = 40), and healthy controls (n = 38). Groups provided serum samples at 0–6 h of life. The concentrations of biomarkers and miRNAs were compared between cohorts.
Result: The low cord pH and moderate-severe HIE groups had increased concentrations of GFAP, NFL and Tau compared to controls (P < 0.05, P < 0.001, respectively). NFL concentrations in mild HIE was higher than controls (P < 0.05) but less than moderate-severe HIE (P < 0.001). Of 68 miRNAs, 36 in low cord pH group and 40 in moderate-severe HIE were upregulated compared to controls (P < 0.05). Five miRNAs in low cord pH group (P < 0.05) and 3 in moderate-severe HIE were downregulated compared to controls (P < 0.05).
Conclusion: A biomarker panel in neonates with low cord pH may help clinicians make real-time decisions.
Mild hypoxic-ischemic encephalopathy (HIE) in neonates is defined as a neonate with a low cord pH and a perinatal adverse event who meets one or more abnormal category-modified Sarnat staging criteria within 6 h of birth and does not have evidence of moderate to severe encephalopathy (1). Classically, neonates with mild HIE have been excluded from neuroprotective intervention studies due to their lack of adverse long-term outcomes based on early data (2). However, recent studies have cast doubt on withholding neuroprotective interventions from neonates with mild HIE. A systematic review involving 20 studies showed abnormal long-term outcomes in at least 25% of neonates with mild HIE (3). In addition, mild HIE has been associated with abnormal MRI findings, specifically involving the watershed areas of the brain in 20–40% of neonates with mild HIE (4). The PRIME study examined neonates with mild HIE and found that 52% had adverse short-term outcomes as defined by an abnormal amplitude EEG, an abnormal brain MRI at <30 days of life, and/or an abnormal neurological exam (5). Neonates involved in the PRIME study were assessed at 18–22 months of age for neurodevelopmental outcomes and 16% were found to have disability. Of those with disability, 40% had Bayley scores <85 in the domains of cognition, motor, or language (6). In the NICHD trial, 25% of neonates with perinatal acidosis who did not qualify for therapeutic hypothermia had abnormal short-term outcomes including feeding difficulties, an abnormal MRI at discharge, seizures, or a need for gastrostomy tube feedings (7). Even a mild degree of acidemia at birth was associated with higher odds of short-term morbidity compared to neonates with no acidemia. The risk of morbidity progressed as umbilical artery pH decreased (8).
Due to the decreased severity of injury in neonates with mild HIE, not all neonates need a neuroprotective intervention such as hypothermia therapy. However, we currently do not have a reliable method of differentiating those at high risk of long-term injury. Additionally, cooling all neonates with mild HIE may lengthen their hospital stay without producing a universal benefit. In a retrospective study done in Canada, neonates with mild HIE received either hypothermia treatment or standard normothermia. Neonates treated with hypothermia had a longer hospital stay in tertiary care NICUs and required longer durations of respiratory support (invasive and non-invasive) but had lower odds of brain injury measured by brain MRI (9). An effective screening tool is needed to identify neonates who may benefit from neuroprotective interventions among those with mild HIE and severe acidemia, which will avoid unnecessary treatments.
Biomarkers are a tool that might help selectively identify neonates with acidemia and/or mild HIE with brain injury. These neonates could have adverse long-term outcomes and would benefit from early neuroprotective interventions. Brain injury biomarkers are molecules released into the blood after brain injury that can help predict the location, degree, or timing of injury. Extensive research is being conducted on biomarkers as a bedside tool for clinicians working with neonates with moderate and severe HIE to assess severity, timing, pattern of brain injury, and correlations with biomarker serum concentrations and long-term outcomes (10). Glial fibrillary acidic protein (GFAP) is a cytoskeleton intermediate filament specific to astrocytes involved in regeneration and gliosis after brain injury (11). GFAP concentrations are higher in neonates with moderate-severe HIE vs. mild HIE within 0–6 h of birth and is predictive of motor developmental outcomes (12). Ubiquitin carboxy terminal hydrolase (UCH-L1) is a neuronal specific protein predominantly concentrated in cortical neurons, resistant to endogenous brain proteases, and elevated after acute cortical damage (13, 14). Previously, our group found that UCH-L1 serum concentrations were elevated in neonates with HIE compared to controls. UCH-L1 concentrations were elevated within 0–6 h of age and continued to be higher than control concentrations for the first 24 h of sampling. Also, the concentrations of UCH-L1 at 12 h correlated with adverse developmental motor outcomes in neonates with HIE (12). Tau protein is a microtubule-associated protein abundant in neuronal axons that accumulates intracellularly in HIE and leads to axonal injury. The presence of Tau protein in serum correlates to brain injury up to 5 days after insult and is related to functional outcomes at 1 year (15). Neurofilament Light Chain (NFL) is the most abundant cytoskeleton protein in myelinated axons of CNS (16). NFL is released after axonal injury into the CSF and blood. As a biomarker at 24 h, it can predict unfavorable MRI outcomes in neonates with moderate-severe HIE undergoing hypothermia treatment (17).
A miRNA is a non-coding RNA 21-22 nucleotides in length that binds to the 3'-untranslated region of a target gene and regulates gene expression by inducing mRNA degradation or by inhibiting translation (18, 19). Concentrations of miRNAs are altered in neonates with hypoxia-ischemia (20). MiR-210 is one of the major miRNAs involved in the hypoxic response by inducing microglial activation and regulating microglia-mediated neuroinflammation in neonates with HIE (21). Because miRNA and neuroprotein biomarkers are found in neonates with moderate to severe HIE, a biomarker panel may provide clinicians with objective information that will help them identify neonates with mild HIE at risk for brain injury.
As a first step in moving a panel of neuroprotein biomarkers to the bedside to allow the clinician to selectively identify neonates with mild HIE who would benefit from neuroprotective interventions, we evaluated the serum concentrations of GFAP, UCH-L1, NFL, and Tau proteins in neonates. The neonates who participated in our study had low cord pH and did or did not have evidence of mild HIE on neurologic exam and were compared with healthy controls and neonates with moderate-severe HIE. We also screened a panel of 68 miRNAs that could complement the neuroprotein biomarkers. We compared the concentrations of these miRNAs from healthy controls with neonates with low cord pH group and moderate-severe HIE. We hypothesized that the neonates with low cord pH, with or without evidence of mild HIE, would have lower serum concentrations of these biomarkers than neonates with moderate-severe HIE. The serum concentrations of any neonate with HIE would be higher than the serum concentrations of healthy controls. Furthermore, we compared the biomarker panel concentrations with physiologic parameters and neurologic exams. We hypothesized that serum concentration of miRNAs would be different in the healthy control neonates compared with the neonates with low cord pH or moderate-severe HIE.
The University of Florida Institutional Review Board and Ethics committee approved all aspects of this study.
In the Neonatal Intensive Care Unit (NICU) at UF Health Gainesville, a sample of blood was obtained from the umbilical artery and vein of all inborn neonates. The worse pH was taken into consideration as there can be errors during labeling or identifying vessels. If the neonate's umbilical cord pH was between 7.11–7.15, a Neonatology Fellow or Nurse Practitioner was notified, and bedside serial neurologic exams using the modified Sarnat scoring was performed every 1–2 h up to 6 h of life to assess for changes in the Sarnat score. If neonates had a worsening Sarnat score, neonates were transitioned to the NICU to be evaluated for therapeutic hypothermia. If the cord pH was ≤ 7.1, neonates were transitioned to the NICU for closer monitoring, collection of a blood sample for analysis (CK, CK-MB, troponin, PT/PTT, fibrinogen, LFT, ABG, lactate), and aEEG monitoring. Regardless of the pH, if the neonate had a normal neurologic exam, normal labs and/or an aEEG with no evidence of hypoxic-ischemic injury for the 6-h monitoring period, the neonate was transitioned back to the mother. Neonates that evolved and met the criteria for therapeutic hypothermia during the 6-h observation period received cooling therapy (see below). Neonates with a pH between 7.11–7.15 had clinical labs drawn at the discretion of the attending physician. While obtaining the clinical samples, an additional 1 ml of arterial blood in BD vacutainer gold top serum separator was obtained for serum neuroprotein biomarker evaluation. The study team had 24 h from the time of sample collection to obtain informed consent for the biomarker study. If the mother did not consent, the sample was discarded. Neonates who had 1–2 abnormal findings on the modified Sarnat exam met the criteria for mild HIE.
Neonates with HIE who were eligible for hypothermia therapy were enrolled in our biorepository. Entry criteria for hypothermia therapy included a gestational age of 35 weeks or greater, a birth weight of 1.8 kg or greater, and ≤6 h of age. Enrolled neonates had evidence of encephalopathy as defined by seizures or three or more abnormalities on a modified Sarnat exam (6). Evidence of hypoxia-ischemia was defined by (1) a pH of 7.0 or less and/or a base deficit of >16, or (2) a pH between 7.01 and 7.15 and/or a base deficit between 10 and 15.9, or (3) an acute perinatal event (cord prolapse, heart rate decelerations, or uterine rupture) and an APGAR of 5 or less at 5 min of life or mechanical ventilation at 10 min of life if no blood gas was available (6). Neonates who were transitioned to the NICU for a cord pH of ≤7.10, declined over 6 h, and met the criteria for therapeutic hypothermia were also included in this cohort. Prior to initiation of therapeutic hypothermia, neonates had blood drawn to assess CK, CK-MB, troponin, PT/PTT, fibrinogen, liver function, ABG, and lactate at 0–6 h of life. During that period, 1 ml of arterial blood in BD vacutainer gold top serum separator was obtained for biomarker evaluation.
Healthy full-term neonates born at University of Florida Health, Gainesville, FL, with APGAR scores of 8 or more at 5 min of life served as controls. A single sample of blood was collected from the umbilical cord (artery or vein) at the time of birth for the assessment of biomarkers.
Serum samples (1 ml) were collected using a 3.5 ml serum separator tube (SST, BD Vacutainer® SST Plus Blood Collection Tube, Franklin Lakes, NJ). Samples were allowed to clot in an upright position at room temperature for 30 min in the processing lab (45 ± 15 min from time of collection), then centrifuged at 1,200 g at room temperature for 15 min in a fixed angle centrifuge rotor. Immediately following centrifugation, the serum was transferred from the SST using a disposable transfer pipette into a 2 ml cryovial with a red cap insert (USA Scientific, Orlando, FL). The serum samples were stored at 4 °C. A fiberboard cryogenic storage box (Fisher Scientific, Pittsburgh, PA) was used to store serum aliquots at −80°C until assay analysis. Blood collection from neonates was completed in accordance with common practice as well as state and federal regulations.
Investigators blinded to the clinical data measured GFAP, UCH-L1, NFL, and Tau concentrations using the same batch of reagents using a Simoa® Neurology 4-plex A Assay kit in an SR-X™ immunoassay analyzer (Quanterix Corp, Boston, MA, USA), which runs ultrasensitive paramagnetic bead-based ELISAs.
Multiplex miRNAs were measured using a Firefly miRNA particle assay system coupled with a portable flow cytometer/reader (Guava® easyCyte™ 6HT, Millipore, Burlington, MA). Sixty-eight neurological miRNA targets were screened using FirePlex™ miRNA neurology panel V2 (cat# ab218371, Abcam, Waltham, MA). Briefly, according to the protocol from the manufacturer, RNA samples were extracted by incubating 20 ul serum, 20 ul RNase-free water, and 40 ul Lysis Mix for 45 min at 60°C while shaking. Then, in a 96-well filter plate, the Firefly miRNA kit was incubated with 25 ul Hybridization Buffer and 25 ul extracted RNA at 37°C for 60 min. After rinsing to remove unbound RNA, 75 ul of Labeling Buffer was added to each well, and the plate was incubated for 60 min at room temperature. Adapted-modified miRNAs were released from the particles by incubating with Rnase-free water for 30 min at 62.5°C, and PCR amplified using a fluorescently-labeled primer set. The PCR product was hybridized to fresh Firefly particles at 37°C for 30 min and re-suspended in Run Buffer for readout. Particles were scanned on an EMD Millipore Guava 6HT flow cytometer. The raw output was background subtracted, normalized using the geometric mean of the normalizer miRNAs, and log transformed.
Data analyses were performed using SAS software (9.4, SAS Institute Inc, Cary, NC) and R (R 4.0.3 and 1.3, 2014). Logarithmic concentrations of biomarkers were used to respond to skewness toward large values. In our analysis, one-way ANOVA model was used. Since the data does not always satisfy the normality or homogeneity of variances assumptions of the classical normal-theory inference, non-parametric statistical testing (Kruskal-Wallis) was used to test the null hypothesis of no group difference for each biomarker; this was used as the baseline approach. To confirm the results from non-parametric tests that may be less powerful than parametric tests when model assumptions are met (at least, approximately), we also performed classical parametric ANOVA tests (F-tests) with and without the assumption of equal variances. Specifically, for each biomarker homogeneity of variances (among groups) hypothesis was tested using Bartlett's test; if the null hypothesis (of equal variances) is not rejected, classical (unweighted) ANOVA tests may be used; else Welch test would be used. In the retrospect, the outcomes/conclusions of this parametric testing strategy matched closely with non-parametric testing using Kruskal-Wallis test. Analysis of variance (ANOVA) was performed to compare the expression of the 68 differentially expressed miRNAs in mild HIE and controls.
The demographics of neonates with a low cord pH, with or without evidence of mild HIE and moderate-severe HIE, were comparable in gestational age, birth weight, sex, and Caesarian section rates (Table 1). All neonates in the low cord pH group were inborn, whereas 50% of the neonates in the moderate-severe HIE group were outborn and transferred for therapeutic hypothermia. The APGAR scores in the moderate-severe HIE group at 1 and 5 min were lower, 1.89 ± 1.55 and 4.78 ± 1.8, respectively, compared to neonates in the low cord pH group, 3.8 ± 3.14 and 7.2 ± 1.8, respectively (Table 1, P < 0.05).
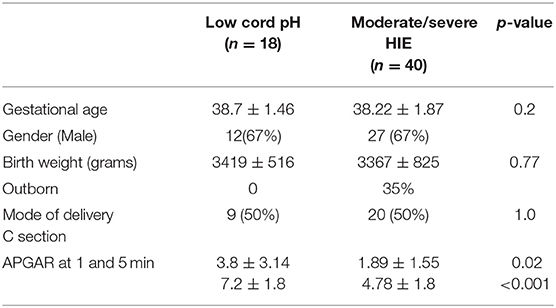
Table 1. Demographic data.
Among the 18 neonates in the low cord pH group, 10 neonates had evidence of a low cord pH without evidence of encephalopathy. Eight neonates in the low cord pH group had evidence of mild HIE, Sarnat 1. We further compared the demographics of the low cord pH neonates without HIE with neonates with mild HIE and did not find a difference in gestational age, birthweight, or APGAR scores (Table 2). The mean cord pH for the low cord pH group without evidence of HIE was 7.05 ± 0.55 compared with 7.07 ± 0.05 in the low pH group with mild HIE. The mean cord base deficit for the low cord pH group without evidence of HIE was −11.25 ± 3.5 vs. −11.41 ± 3.5 in neonates with a low cord pH and mild HIE. Nine of the ten neonates in the low cord pH group without evidence of mild HIE had evidence of respiratory acidosis (defined by PaCo2 > 60) in cord blood whereas 7 out of 8 neonates in the low pH group with mild HIE had evidence of respiratory acidosis with a mean PaCo2 of 84.2 ± 11.3 and 74.66 ± 16.5, respectively.
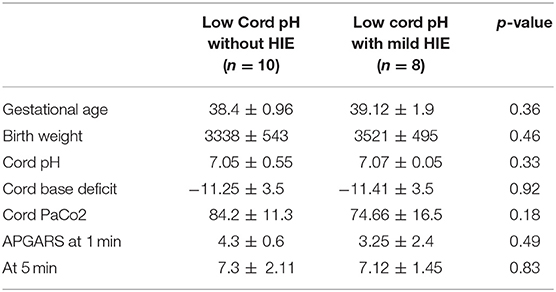
Table 2. Demographic data.
The concentrations of biomarkers were measured from each cohort using serum samples obtained at 0–6 h of life. The serum concentrations of GFAP, NFL and Tau were increased in neonates with low cord pH compared to control neonates (P < 0.001, Figure 1). Serum concentration of NFL was lower in neonates with a low cord pH compared to neonates with moderate-severe HIE (P < 0.01, Figure 1) but GFAP, tau and UCHL-1 concentration were similar between neonates with low cord pH and moderate-severe HIE. Further comparison of neonates with mild HIE (n = 8) vs. neonates with moderate-severe HIE showed that NFL was also lower in neonates with mild HIE compared to neonates with moderate-severe HIE (P < 0.01, Figure 2). GFAP, NFL, UCH-L1 and Tau concentrations were increased in neonates with moderate to severe HIE compared to control neonates (P < 0.001, Figure 1). The mean concentration of four biomarkers in 3 cohorts of control neonates, low cord pH group and moderate-severe HIE is outlined in Table 3.
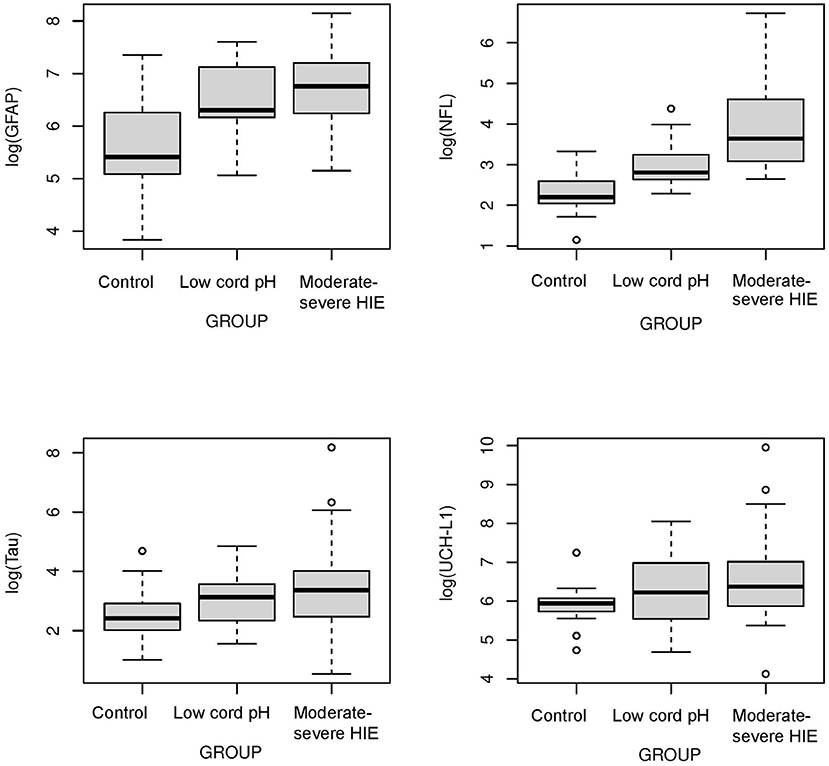
Figure 1. Comparison of neuroprotein Biomarkers GFAP, NFL, Tau, UCHL-1 among Control, low cord pH neonates and moderate-severe HIE neonates. Compared to Control group, serum concentrations of GFAP, NFL and Tau were higher in low cord pH group (P < 0.05) and moderate -severe HIE group (P < 0.001). The concentrations of UCHL-1 were increased in neonates with moderate-severe HIE compared to control neonates (P < 0.001). Concentrations of UCH-L1 was not different between controls and neonates with low cord pH, with/without mild HIE, at 0–6 h of life. Compared to moderate-severe HIE, serum concentration of NFL was lower in mild HIE group (P < 0.01).
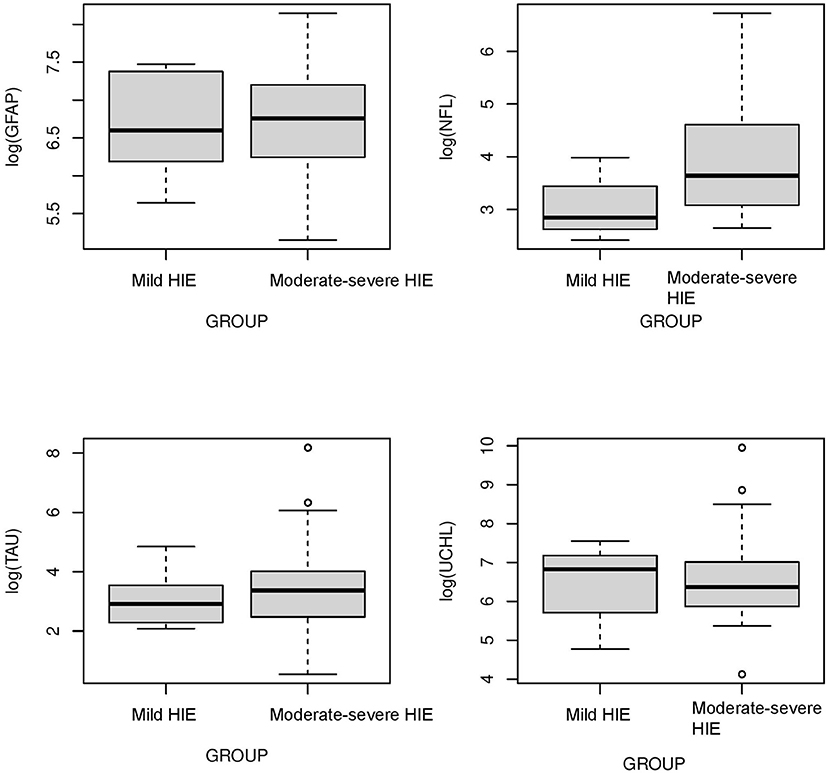
Figure 2. Comparison of neuroprotein biomarkers GFAP, NFL, Tau, and UCHL1 between mild HIE and moderate-severe HIE. Compared to moderate-severe HIE, serum concentration of NFL was lower in mild HIE group (P < 0.01). Concentration of GFAP, Tau and UCHL-1 was not different between neonates with mild HIE and moderate -severe HIE.
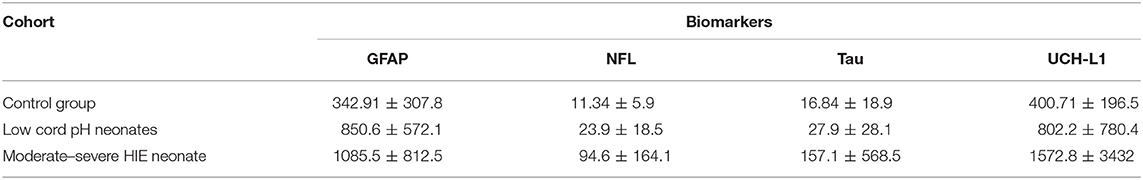
Table 3. Comparison of Mean values of biomarker concentration among 3 cohorts.
Eighteen neonates with low cord pH, with or without mild HIE, were further analyzed using physiologic parameters such as pH, lactate, base deficit, and the presence of sentinel events to examine if any of these parameters correlated with the concentrations of the four neuroproteins in the biomarker panel. The cohort of 18 neonates was divided into 2 groups for each of these 4 parameters: a pH ≤7 (n = 3) compared to a pH of 7 or higher (n = 15), a serum lactate concentration of ≥7 (n = 5) compared to <7 (n = 13), a base deficit equal to or greater than 13 (n = 7) compared to <13 (n = 11), and neonates with sentinel events (n = 3) compared to neonates without sentinel events (n = 15). The criteria for grouping of the subjects were chosen because a pH <7 is associated with a higher risk of long-term neurologic deficits, a lactate >7 is associated with a higher risk of encephalopathy, and a base deficit >13 represents a severe metabolic acidosis (22–25). The presence of a sentinel event allowed for some understanding of the timing of the rise in the biomarkers. Sentinel events were defined as umbilical cord mishap (cord prolapse), uterine rupture, placental abruption, shoulder dystocia and major maternal hemorrhage, trauma, cardiorespiratory arrest, or seizures immediately preceding delivery (26).
The serum concentrations of GFAP Tau, and UCH-L1 were higher in neonates with a pH ≤7 compared to neonates with a pH higher than 7 (P < 0.05, Figure 3). No difference in serum concentration of NFL was noted in neonates with pH ≤7 compared to neonates with pH higher than 7. UCH-L1 concentration was higher in neonates with a base deficit of 13 or greater (P < 0.05, Figure 4). Neonates with a known sentinel event had no difference in serum biomarkers when compared to neonates without history of sentinel events. No differences in biomarker profile were noted in neonates with lactate ≤7 vs. neonates with lactates more than 7.
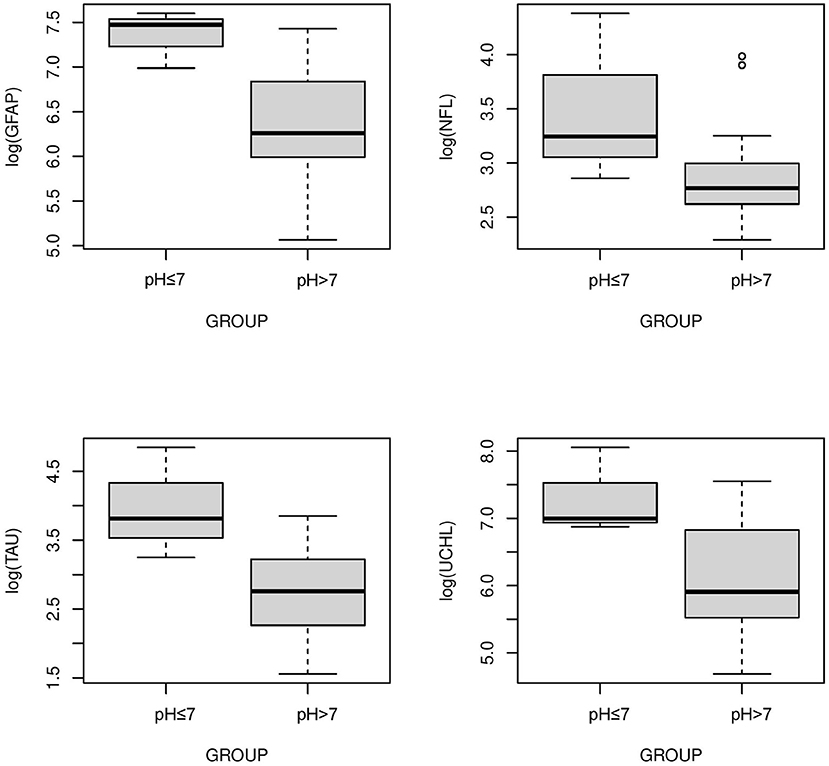
Figure 3. Serum concentrations of GFAP, NFL, Tau, and UCH-L1 in neonates with a pH ≤7 compared to a pH >7. GFAP, Tau and UCHL1 serum concentrations were higher in neonates with a pH ≤7 compared to neonates with a pH >7 (P < 0.05) (Mean ± STD). Serum concentration of NFL was similar between neonates with pH ≤7 and neonates with pH >7.
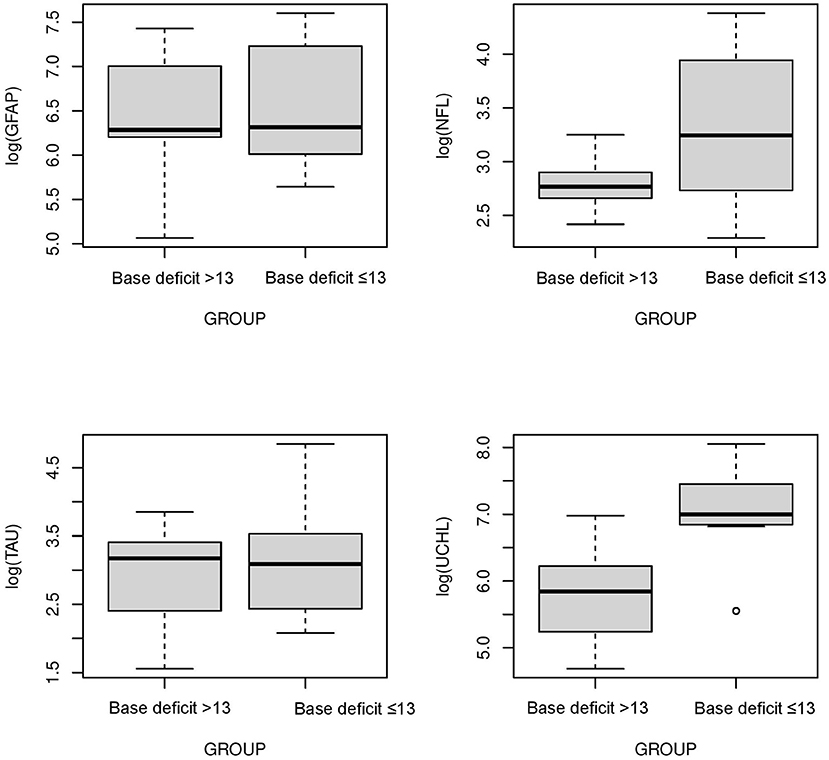
Figure 4. Serum concentrations of GFAP, NFL, Tau, and UCH-L1 in neonates with a base deficit of 13 or greater compared to neonate with base deficit <13. UCH-L1 low concentration was higher in neonates with a base deficit of 13 or greater (P < 0.05) (Mean ± STD). Serum concentration of GFAP, NFL and Tau were similar between neonates with base deficit of 13 or greater and base deficit <13.
The cohort of 18 neonates was divided into two groups, neonates with a normal neurologic exam, Sarnat 0 (n = 10, without mild HIE), and neonates with a Sarnat 1 exam (n = 8, mild HIE). No difference in biomarker profile was noted between neonates with Sarnat 0 vs. neonates with Sarnat 1.
A panel of 68 miRNAs were analyzed among these 3 cohorts from the blood samples obtained at 0–6 h of life. When comparing the neonates with low cord pH neonate group to control neonates, 41 out of 68 miRNA concentrations were different (P < 0.05). Of these 41 miRNAs, 36 were upregulated and 5 were downregulated in the low cord pH neonates when compared to the controls. In comparing neonates in the moderate-severe HIE group to control neonates, 43 out of 68 miRNA concentrations were different (P < 0.05). Out of these 43 miRNAs, 40 were upregulated and 3 were downregulated in the moderate-severe HIE group compared to the healthy controls (Table 4).
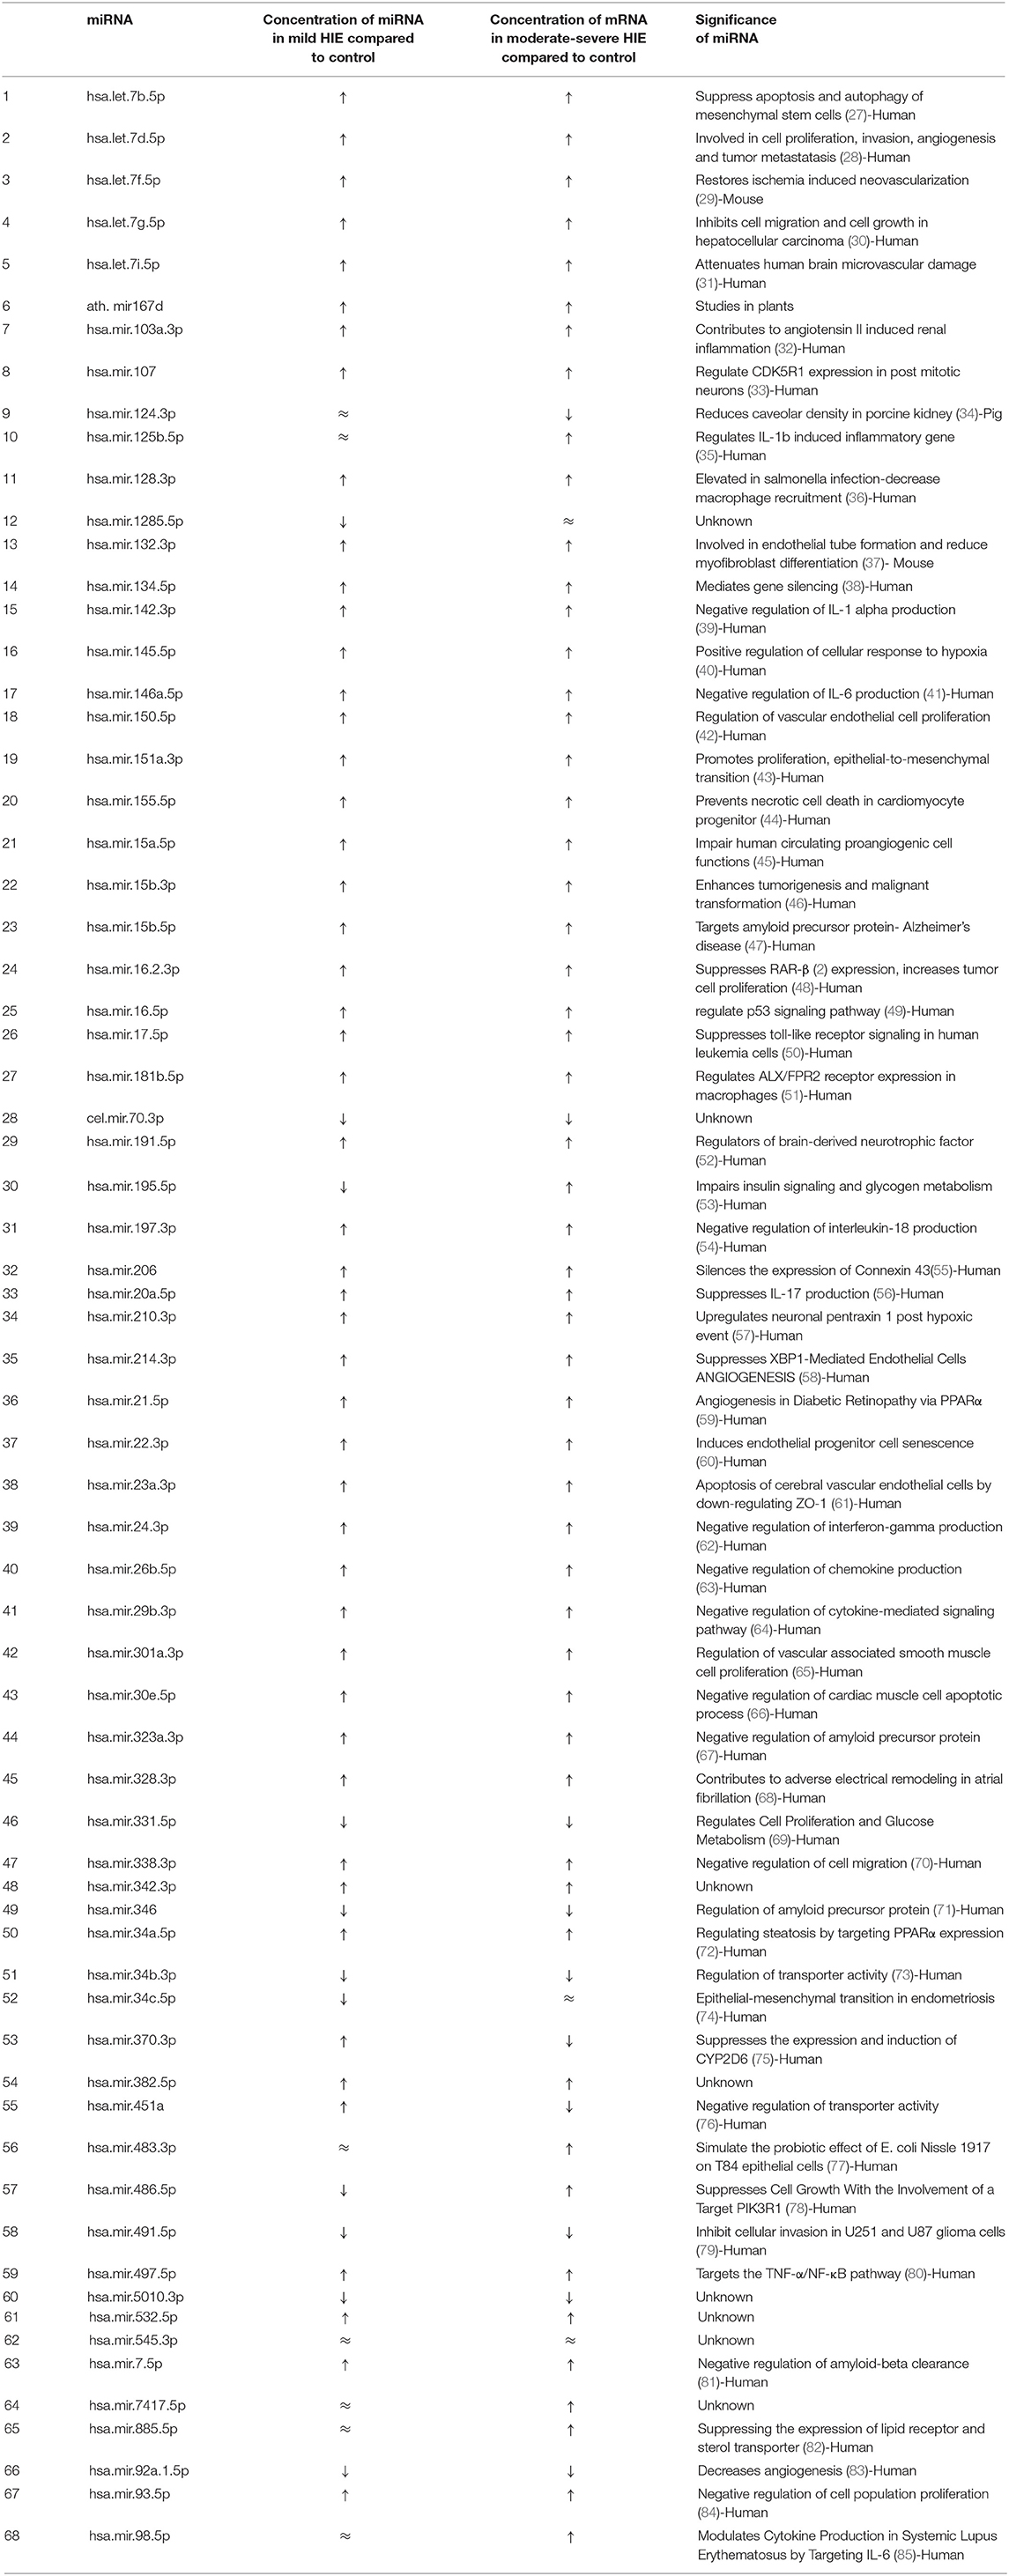
Table 4. p-value of miRNA concentration in mild HIE verses healthy control, moderate to severe HIE verses healthy control and mild HIE verses moderate-severe HIE respectively.
This study evaluated the serum concentrations of a novel panel of four neuroprotein biomarkers and 68 miRNAs from neonates with low cord pH, with and without evidence of mild HIE, compared to healthy control neonates and neonates with moderate to severe HIE. The serum concentrations of biomarkers GFAP, NFL and Tau were increased in the low cord pH group and the moderate to severe HIE group compared to the control group at 0–6 h of life. The serum concentrations of biomarkers UCH-L1 were higher in neonates with moderate to severe HIE compared to the control group. When physiologic parameters were examined in neonates with low cord pH, serum concentration of GFAP, Tau and UCH-L 1 were higher in neonates with a pH ≤7 compared to neonates with pH more than 7. UCH-L1 was higher in neonates with a base deficit of 13 or greater compared to neonates with base deficit <13. No difference in biomarker profile was noted in neonates with or without sentinel events and neonates with lactate greater or equal to 7 verses neonates with lactate <7. Often the exact timing of the potential neurologic injury was unknown. This lack of injury timing adds variability to the interpretation of biomarkers' serum concentrations following birth. To the best of our knowledge, this prospective study is the first to examine a brain-specific screening method to help clinicians identify neonates with the potential for brain injury using cord pH and a panel of serum neuroproteins. In addition, this study's comparison of a panel of 68 miRNA serum concentrations between 3 cohorts is the most extensive to date.
Chalak et al. compared the umbilical cord concentrations of biomarkers like GFAP and UCHL-1 in 7 neonates with mild HIE with 20 neonates with moderate-severe HIE. They found that concentration of GFAP and UCH-L1 increased with severity of HIE (86). Our study had similar finding. NFL concentration was higher in neonates with moderate-severe HIE compared to neonates with low cord pH/mild HIE. Unlike the Chalak study, our study included a control group of healthy neonates. Our study found increased serum concentrations of NFL in both cohorts of mild and moderate-severe HIE compared to healthy controls at 0–6 h of life.
Shah et al. studied the temporal change in NFL concentrations in neonates with mild, moderate, and severe HIE (17). The study recruited 11 term neonates with acidosis and/or mild HIE and neonates with moderate to severe HIE who met the criteria for therapeutic hypothermia. Of the neonates with mild HIE, 3 out of 11 babies had a detectable or raised NFL level at 24 h of life (17, 87). Our study had 18 neonates with acidosis, with or without mild HIE. NFL serum concentrations were higher in neonates with mild HIE compared with controls but lower than neonates with moderate to severe HIE who qualified for therapeutic hypothermia. Our data demonstrated an elevation in NFL earlier than 24 h. This finding suggests that during the 6 h that an acidotic neonate, with or without mild HIE, is undergoing evaluation for a neuroprotective intervention, NFL may be useful to distinguish neonates with injury.
In our study, neonates with moderate-severe HIE had increased serum concentrations of GFAP, NFL UCHL-1, and Tau compared to healthy controls. This study, our prior studies, and the works of others demonstrate that neonates with moderate-severe HIE undergoing hypothermia have increased concentrations of these four biomarkers compared to control subjects (86, 88, 89).
The cohort of neonates with a low cord pH were divided based on physiologic parameters including pH, lactate, and base excess. These physiologic parameters have been associated with outcomes and were used because we lacked short-term MRI data or long-term developmental testing (22–25). Three out of four serum biomarkers were higher in neonates with a pH ≤ 7. We also compared neonates with known sentinel events to neonates who did not have a sentinel event In neonatal HIE biomarker research, the exact timing of injury is often unknown (90, 91). Biomarker serum concentrations change over time. The lack of exact timing may cause dilution of the concentration when looking at a cohort because those neonates with sentinel events may be earlier in the injury pathophysiology compared to those neonates without a sentinel event. We did not find differences in biomarkers in neonates with or without sentinel events. Of note, we had only 3 neonates with sentinel events vs. 15 neonates without sentinel events. Our previous research showed that UCH-L1 peaks within 0–6 h (12).
In animal models of hypoxia-ischemia, miRNA 210 has a role in regulating microglia-mediated neuroinflammation (92). Based on a neonatal rat model, Bo Li et al. studied the pathway of miRNA following hypoxia-ischemia and identified miR-210 as a novel regulator of microglial activation. This study demonstrated that miR-210 expression is induced in activated microglia after hypoxic ischemia. This miR-210 induction leads to an enhanced innate proinflammatory immune response (21). Other miRNAs have been studied in adult stroke, neurogenic disorders, and cancer pathogenesis. Studies have demonstrated involvement of miRNAs such as miR-150, miT-181a, miR-17-92 T cell and B cell differentiation (93). After recognition of toll-like receptors, miRNAs such as miR-146, miR-155, and miR-223 activate innate and acquired immune responses (94). A study by Sullivan et al. showed that neonates with HIE had decreased concentrations of 3 miRNAs, namely miR-374a-5p, miR-376c-3p, miR-181b-5p, when compared to healthy controls (20). Looney et al. also demonstrated downregulation of miR-181b in neonates with HIE compared to controls (95). In our study, when compared to controls, the concentration of miR-181b-5p was higher in neonates with mild HIE (P < 0.01) and moderate-severe HIE (P < 0.001). In addition, when compared to controls, concentrations of MiR-210 were higher in mild HIE (P < 0.02) and moderate-severe HIE (P < 0.001). Casey et al. studied miRNA expression in a piglet model of HI and demonstrated 32 out of 55 miRNAs were upregulated and 23 out of 55 were downregulated. However, this study was unable to show differences in miRNA between mild HIE vs. moderate and severe HIE (96). Our study demonstrated 36 out of 68 miRNAs were upregulated and 5 out of 68 were downregulated in neonates with mild HIE compared to healthy controls. In addition, we detected 40 out of 68 miRNAs upregulated and 3 out of 68 miRNAs downregulated in neonates with moderate-severe HIE compared to healthy controls. Our study clearly showed that the concentrations of miRNAs are different in healthy controls vs. neonates with mild HIE and moderate-severe HIE. Expression of miRNA could be an on/off phenomenon after hypoxia-ischemia. Therefore, miRNAs can be useful markers to differentiate neonates with any severity of HIE from healthy control neonates.
As outlined above, few published studies exist that have examined prospective biomarker concentrations in neonates with metabolic acidosis at birth with or without mild HIE. Most of the biomarker studies have measured the concentrations of biomarkers in neonates with moderate-severe HIE undergoing therapeutic hypothermia. Some of these studies included only a small number of neonates with mild HIE who did not qualify for hypothermia and compared them with neonates with moderate-severe HIE rather than control subjects. This study is the first to explore the serum concentrations of a panel of 4 biomarker profiles and to compare these concentrations in neonates with mild HIE, healthy controls, and neonates with moderate-severe HIE. This study is also the first to examine a panel of 68 miRNAs. Neonates with mild HIE have subtly abnormal neurologic exams with borderline lab parameters that give a false impression of unklikely brain injury, even though multiple prior studies have shown that 25% of these neonates might have abnormal neurologic outcomes. As our data demonstrates, a panel of biomarkers with miRNAs could be a useful tool for clinicians to identify neonates with mild HIE with evidence of some form of brain injury. Our samples were collected within 0–6 h and preferably within the first hour of birth. The early differentiation of this sub-cohort of neonates with mild HIE that have higher concentrations of GFAP, NFL and Tau might be a useful tool to identify neonates with brain injury. These identified neonates could benefit from interventions such as therapeutic hypothermia or erythropoietin therapy. However, further studies must establish these biomarkers' serum concentrations that can best predict brain injury with increased sensitivity and specificity.
Our study had limitations. The number of neonates with a low cord pH was smaller compared to neonates in the moderate-severe HIE and healthy control cohorts. In addition, the neonates with low cord pH did not undergo an MRI or developmental testing as part of their care. To effectively use the panel of biomarkers' serum concentrations for bedside decision making, a short-term outcome of brain injury identified on MRI and a long-term outcome measured at 22–24 months with a Bayley score are required. Despite the limitations, this pilot study yielded important data that show a panel of biomarkers offers promise in assisting the bedside clinician in selectively identifying neonates with brain injury.
A biomarker panel approach in neonates with a low cord pH may help the bedside clinician with real-time decision making. However, this observation warrants further evaluation in a larger cohort to examine the relationship between serum biomarker concentrations and outcomes both short- (MRI injury) and long-term (Bayley scores at 22–24 months of age).
The raw data supporting the conclusions of this article will be made available by the authors, without undue reservation.
The studies involving human participants were reviewed and approved by University of Florida. Written informed consent to participate in this study was provided by the participants' legal guardian/next of kin.
PG and ZY were responsible for project design, data cleaning, data analysis and interpretation, and drafting of the article. LS was responsible for data acquisition and manuscript editing. NB and ZY were responsible for data analysis and graphing. CR was responsible for tissue processing, storage, and handling. MW was responsible for concept of the project, data analysis and interpretation, drafting the article, and final approval of the version to be published. All authors contributed to the article and approved the submitted version.
This study was funded by the University of Florida.
The authors declare that the research was conducted in the absence of any commercial or financial relationships that could be construed as a potential conflict of interest.
All claims expressed in this article are solely those of the authors and do not necessarily represent those of their affiliated organizations, or those of the publisher, the editors and the reviewers. Any product that may be evaluated in this article, or claim that may be made by its manufacturer, is not guaranteed or endorsed by the publisher.
We thank all the families for participating in clinical research, which allows us to continue to improve care for neonates and Melissa Lamb, M.S. of Lamb Consulting, Llc. for editing our final manuscript.
HIE, Hypoxic-Ischemic Encephalopathy; UCH-L1, Ubiquitin carboxyl-terminal esterase L1; GFAP, Glial fibrillary acidic protein; NFL, Neurofilament light chain; miRNAs, MicroRNAs; NICU, Neonatal Intensive Care Unit.
1. Shankaran S, Laptook AR, Ehrenkranz RA, Tyson JE, McDonald SA, Donovan EF, et al. Whole-body hypothermia for neonates with hypoxic-ischemic encephalopathy. N Engl J Med. (2005) 353:1574–84. doi: 10.1056/NEJMcps050929
2. Robertson CM, Finer NN. Long-term follow-up of term neonates with perinatal asphyxia. Clin Perinatol. (1993) 20:483–500. doi: 10.1016/S0095-5108(18)30405-6
3. Conway JM, Walsh BH, Boylan GB, Murray DM. Mild hypoxic ischaemic encephalopathy and long term neurodevelopmental outcome - A systematic review. Early Hum Dev. (2018) 120:80–7. doi: 10.1016/j.earlhumdev.2018.02.007
4. Walsh BH, Inder TE. MRI as a biomarker for mild neonatal encephalopathy. Early Hum Dev. (2018) 120:75–9. doi: 10.1016/j.earlhumdev.2018.02.006
5. Prempunpong C, Chalak LF, Garfinkle J, Shah B, Kalra V, Rollins N, et al. Prospective research on infants with mild encephalopathy: the PRIME study. J Perinatol. (2018) 38:80–5. doi: 10.1038/jp.2017.164
6. Chalak LF, Nguyen KA, Prempunpong C, Heyne R, Thayyil S, Shankaran S, et al. Prospective research in infants with mild encephalopathy identified in the first six hours of life: neurodevelopmental outcomes at 18-22 months. Pediatr Res. (2018) 84:861–8. doi: 10.1038/s41390-018-0174-x
7. DuPont TL, Chalak LF, Morriss MC, Burchfield PJ, Christie L, Sanchez PJ. Short-term outcomes of newborns with perinatal acidemia who are not eligible for systemic hypothermia therapy. J Pediatr. (2013) 162:35–41. doi: 10.1016/j.jpeds.2012.06.042
8. Bailey EJ, Frolova AI, Lopez JD, Raghuraman N, Macones GA, Cahill AG. Mild neonatal acidemia is associated with neonatal morbidity at term. Am J Perinatol. (2020) 38:e155–61. doi: 10.1055/s-0040-1708800
9. Goswami IR, Whyte H, Wintermark P, Mohammad K, Shivananda S, Louis D, et al. Characteristics and short-term outcomes of neonates with mild hypoxic-ischemic encephalopathy treated with hypothermia. J Perinatol. (2020) 40:275–83. doi: 10.1038/s41372-019-0551-2
10. Graham EM, Everett AD, Delpech JC, Northington FJ. Blood biomarkers for evaluation of perinatal encephalopathy: state of the art. Curr Opin Pediatr. (2018) 30:199–203. doi: 10.1097/MOP.0000000000000591
11. Middeldorp J, Hol EM. GFAP in health and disease. Prog Neurobiol. (2011) 93:421–43. doi: 10.1016/j.pneurobio.2011.01.005
12. Douglas-Escobar MV, Heaton SC, Bennett J, Young LJ, Glushakova O, Xu X, et al. UCH-L1 and GFAP serum levels in neonates with hypoxic-ischemic encephalopathy: a single center pilot study. Front Neurol. (2014) 5:273. doi: 10.3389/fneur.2014.00273
13. Lewis SB, Wolper R, Chi YY, Miralia L, Wang Y, Yang C, et al. Identification and preliminary characterization of ubiquitin C terminal hydrolase 1 (UCHL1) as a biomarker of neuronal loss in aneurysmal subarachnoid hemorrhage. J Neurosci Res. (2010) 88:1475–84. doi: 10.1002/jnr.22323
14. Douglas-Escobar M, Yang C, Bennett J, Shuster J, Theriaque D, Leibovici A, et al. A pilot study of novel biomarkers in neonates with hypoxic-ischemic encephalopathy. Pediatr Res. (2010) 68:531–6. doi: 10.1203/PDR.0b013e3181f85a03
15. Massaro AN, Wu YW, Bammler TK, Comstock B, Mathur A, McKinstry RC, et al. Plasma biomarkers of brain injury in neonatal hypoxic-ischemic encephalopathy. J Pediatr. (2018) 194:67–75 e1. doi: 10.1016/j.jpeds.2017.10.060
16. Petzold A. Neurofilament phosphoforms: surrogate markers for axonal injury, degeneration and loss. J Neurol Sci. (2005) 233:183–98. doi: 10.1016/j.jns.2005.03.015
17. Shah DK, Ponnusamy V, Evanson J, Kapellou O, Ekitzidou G, Gupta N, et al. Raised plasma neurofilament light protein levels are associated with abnormal MRI outcomes in newborns undergoing therapeutic hypothermia. Front Neurol. (2018) 9:86. doi: 10.3389/fneur.2018.00086
18. Bartel DP. MicroRNAs: target recognition and regulatory functions. Cell. (2009) 136:215–33. doi: 10.1016/j.cell.2009.01.002
19. Lytle JR, Yario TA, Steitz JA. Target mRNAs are repressed as efficiently by microRNA-binding sites in the 5' UTR as in the 3' UTR. Proc Natl Acad Sci U S A. (2007) 104:9667–72. doi: 10.1073/pnas.0703820104
20. O'Sullivan MP, Looney AM, Moloney GM, Finder M, Hallberg B, Clarke G, et al. Validation of altered umbilical cord blood MicroRNA expression in neonatal hypoxic-ischemic encephalopathy. JAMA Neurol. (2019) 76:333–41. doi: 10.1001/jamaneurol.2018.4182
21. Li B, Dasgupta C, Huang L, Meng X, Zhang L. MiRNA-210 induces microglial activation and regulates microglia-mediated neuroinflammation in neonatal hypoxic-ischemic encephalopathy. Cell Mol Immunol. (2020) 17:976–91. doi: 10.1038/s41423-019-0257-6
22. MacLennan A. A template for defining a causal relation between acute intrapartum events and cerebral palsy: international consensus statement. BMJ. (1999) 319:1054–9. doi: 10.1136/bmj.319.7216.1054
23. Kelly R, Ramaiah SM, Sheridan H, Cruickshank H, Rudnicka M, Kissack C, et al. Dose-dependent relationship between acidosis at birth and likelihood of death or cerebral palsy. Arch Dis Child Fetal Neonatal Ed. (2018) 103:F567–F72. doi: 10.1136/archdischild-2017-314034
24. Shah S, Tracy M, Smyth J. Postnatal lactate as an early predictor of short-term outcome after intrapartum asphyxia. J Perinatol. (2004) 24:16–20. doi: 10.1038/sj.jp.7211023
25. Low JA, Lindsay BG, Derrick EJ. Threshold of metabolic acidosis associated with newborn complications. Am J Obstet Gynecol. (1997) 177:1391–4. doi: 10.1016/S0002-9378(97)70080-2
26. Bonifacio SL, Glass HC, Vanderpluym J, Agrawal AT, Xu D, Barkovich AJ, et al. Perinatal events and early magnetic resonance imaging in therapeutic hypothermia. J Pediatr. (2011) 158:360–5. doi: 10.1016/j.jpeds.2010.09.003
27. Ham O, Lee S-Y, Lee CY, Park J-H, Lee J, Seo H-H, et al. let-7b suppresses apoptosis and autophagy of human mesenchymal stem cells transplanted into ischemia/reperfusion injured heart 7by targeting caspase-3. Stem Cell Res Ther. (2015) 6:147. doi: 10.1186/s13287-015-0134-x
28. Kolenda T, Przybyła W, Teresiak A, Mackiewicz A, Lamperska KM. The mystery of let-7d - a small RNA with great power. Contemp Oncol. (2014) 18:293–301. doi: 10.5114/wo.2014.44467
29. Dhahri W, Dussault S, Haddad P, Turgeon J, Tremblay S, Rolland K, et al. Reduced expression of let-7f activates TGF-β/ALK5 pathway and leads to impaired ischaemia-induced neovascularization after cigarette smoke exposure. J Cell Mol Med. (2017) 21:2211–22. doi: 10.1111/jcmm.13144
30. Ji J, Zhao L, Budhu A, Forgues M, Jia H-L, Qin L-X, et al. Let-7g targets collagen type I alpha2 and inhibits cell migration in hepatocellular carcinoma. J Hepatol. (2010) 52:690–7. doi: 10.1016/j.jhep.2009.12.025
31. Xiang W, Tian C, Peng S, Zhou L, Pan S, Deng Z. Let-7i attenuates human brain microvascular endothelial cell damage in oxygen glucose deprivation model by decreasing toll-like receptor 4 expression. Biochem Biophys Res Commun. (2017) 493:788–93. doi: 10.1016/j.bbrc.2017.08.093
32. Lu Q, Ma Z, Ding Y, Bedarida T, Chen L, Xie Z, et al. Circulating miR-103a-3p contributes to angiotensin II-induced renal inflammation and fibrosis via a SNRK/NF-κB/p65 regulatory axis. Nat Commun. (2019) 10:2145. doi: 10.1038/s41467-019-10116-0
33. Moncini S, Salvi A, Zuccotti P, Viero G, Quattrone A, Barlati S, et al. The role of miR-103 and miR-107 in regulation of CDK5R1 expression and in cellular migration. PLoS ONE. (2011) 6:e20038. doi: 10.1371/journal.pone.0020038
34. Yang S, Liu X, Li X, Sun S, Sun F, Fan B, et al. MicroRNA-124 reduces caveolar density by targeting caveolin-1 in porcine kidney epithelial PK15 cells. Mol Cell Biochem. (2013) 384:213–9. doi: 10.1007/s11010-013-1800-x
35. Rasheed Z, Rasheed N, Abdulmonem WA, Khan MI. MicroRNA-125b-5p regulates IL-1β induced inflammatory genes via targeting TRAF6-mediated MAPKs and NF-κB signaling in human osteoarthritic chondrocytes. Sci Rep. (2019) 9:6882. doi: 10.1038/s41598-019-42601-3
36. Zhang T, Yu J, Zhang Y, Li L, Chen Y, Li D, et al. Salmonella enterica serovar enteritidis modulates intestinal epithelial miR-128 levels to decrease macrophage recruitment via macrophage colony-stimulating factor. J Infect Dis. (2014) 209:2000–11. doi: 10.1093/infdis/jiu006
37. Katare R, Riu F, Mitchell K, Gubernator M, Campagnolo P, Cui Y, et al. Transplantation of human pericyte progenitor cells improves the repair of infarcted heart through activation of an angiogenic program involving micro-RNA-132. Circ Res. (2011) 109:894–906. doi: 10.1161/CIRCRESAHA.111.251546
38. Ye W, Lv Q, Wong C-KA, Hu S, Fu C, Hua Z, et al. The effect of central loops in miRNA:MRE duplexes on the efficiency of miRNA-mediated gene regulation. PLoS One. (2008) 3:e1719-e. doi: 10.1371/journal.pone.0001719
39. Motsch N, Alles J, Imig J, Zhu J, Barth S, Reineke T, et al. MicroRNA profiling of Epstein-Barr virus-associated NK/T-cell lymphomas by deep sequencing. PLoS ONE. (2012) 7:e42193. doi: 10.1371/journal.pone.0042193
40. Cai D, Wei D, Chen S, Chen X, Li S, Chen W, et al. MiR-145 protected the cell viability of human cerebral cortical neurons after oxygen-glucose deprivation by downregulating EPHA4. Life Sci. (2019) 231:116517. doi: 10.1016/j.lfs.2019.05.073
41. Wu W, Li Y. Lung injury caused by paraquat poisoning results in increased interleukin-6 and decreased microRNA-146a levels. Exp Ther Med. (2018) 16:406–12. doi: 10.3892/etm.2018.6153
42. Luo Z, Wen G, Wang G, Pu X, Ye S, Xu Q, et al. MicroRNA-200C and−150 play an important role in endothelial cell differentiation and vasculogenesis by targeting transcription repressor ZEB1. Stem Cells. (2013) 31:1749–62. doi: 10.1002/stem.1448
43. Daugaard I, Sanders KJ, Idica A, Vittayarukskul K, Hamdorf M, Krog JD, et al. miR-151a induces partial EMT by regulating E-cadherin in NSCLC cells. Oncogenesis. (2017) 6:e366-e. doi: 10.1038/oncsis.2017.66
44. Liu J, van Mil A, Vrijsen K, Zhao J, Gao L, Metz CHG, et al. MicroRNA-155 prevents necrotic cell death in human cardiomyocyte progenitor cells via targeting RIP1. J Cell Mol Med. (2011) 15:1474–82. doi: 10.1111/j.1582-4934.2010.01104.x
45. Spinetti G, Fortunato O, Caporali A, Shantikumar S, Marchetti M, Meloni M, et al. MicroRNA-15a and microRNA-16 impair human circulating proangiogenic cell functions and are increased in the proangiogenic cells and serum of patients with critical limb ischemia. Circ Res. (2013) 112:335–46. doi: 10.1161/CIRCRESAHA.111.300418
46. Wei S, Peng L, Yang J, Sang H, Jin D, Li X, et al. Exosomal transfer of miR-15b-3p enhances tumorigenesis and malignant transformation through the DYNLT1/Caspase-3/Caspase-9 signaling pathway in gastric cancer. J Exp Clin Cancer Res. (2020) 39:32. doi: 10.1186/s13046-019-1511-6
47. Liu H-Y, Fu X, Li Y-F, Li X-L, Ma Z-Y, Zhang Y, et al. miR-15b-5p targeting amyloid precursor protein is involved in the anti-amyloid eflect of curcumin in swAPP695-HEK293 cells. Neural Regen Res. (2019) 14:1603–9. doi: 10.4103/1673-5374.255979
48. Hu Y, Correa AM, Hoque A, Guan B, Ye F, Huang J, et al. Prognostic significance of differentially expressed miRNAs in esophageal cancer. Int J Cancer. (2011) 128:132–43. doi: 10.1002/ijc.25330
49. Cai B, Ma M, Chen B, Li Z, Abdalla BA, Nie Q, et al. MiR-16-5p targets SESN1 to regulate the p53 signaling pathway, affecting myoblast proliferation and apoptosis, and is involved in myoblast differentiation. Cell Death Dis. (2018) 9:367. doi: 10.1038/s41419-018-0403-6
50. Bomben R, Gobessi S, Dal Bo M, Volinia S, Marconi D, Tissino E, et al. The miR-17~92 family regulates the response to Toll-like receptor 9 triggering of CLL cells with unmutated IGHV genes. Leukemia. (2012) 26:1584–93. doi: 10.1038/leu.2012.44
51. Pierdomenico AM, Recchiuti A, Simiele F, Codagnone M, Mari VC, Davì G, et al. MicroRNA-181b regulates ALX/FPR2 receptor expression and proresolution signaling in human macrophages. J Biol Chem. (2015) 290:3592–600. doi: 10.1074/jbc.M114.592352
52. Varendi K, Kumar A, Härma MA, Andressoo JO. miR-1, miR-10b, miR-155, and miR-191 are novel regulators of BDNF. Cell Mol Life Sci. (2014) 71:4443–56. doi: 10.1007/s00018-014-1628-x
53. Yang WM, Jeong HJ, Park SY, Lee W. Saturated fatty acid-induced miR-195 impairs insulin signaling and glycogen metabolism in HepG2 cells. FEBS Lett. (2014) 588:3939–46. doi: 10.1016/j.febslet.2014.09.006
54. Chen L, Li C, Peng Z, Zhao J, Gong G, Tan D. miR-197 Expression in peripheral blood mononuclear cells from hepatitis B virus-infected patients. Gut Liver. (2013) 7:335–42. doi: 10.5009/gnl.2013.7.3.335
55. Calderón JF, Retamal MA. Regulation of connexins expression levels by MicroRNAs, an update. Front Physiol. (2016) 7:558. doi: 10.3389/fphys.2016.00558
56. Chang R, Yi S, Tan X, Huang Y, Wang Q, Su G, et al. MicroRNA-20a-5p suppresses IL-17 production by targeting OSM and CCL1 in patients with Vogt-Koyanagi-Harada disease. Br J Ophthalmol. (2018) 102:282–90. doi: 10.1136/bjophthalmol-2017-311079
57. Pulkkinen K, Malm T, Turunen M, Koistinaho J, Ylä-Herttuala S. Hypoxia induces microRNA miR-210 in vitro and in vivo ephrin-A3 and neuronal pentraxin 1 are potentially regulated by miR-210. FEBS Lett. (2008) 582:2397–401. doi: 10.1016/j.febslet.2008.05.048
58. Duan Q, Yang L, Gong W, Chaugai S, Wang F, Chen C, et al. MicroRNA-214 is upregulated in heart failure patients and suppresses XBP1-mediated endothelial cells angiogenesis. J Cell Physiol. (2015) 230:1964–73. doi: 10.1002/jcp.24942
59. Chen Q, Qiu F, Zhou K, Matlock HG, Takahashi Y, Rajala RVS, et al. Pathogenic role of microRNA-21 in diabetic retinopathy through downregulation of PPARα. Diabetes. (2017) 66:1671–82. doi: 10.2337/db16-1246
60. Zheng Y, Xu Z. MicroRNA-22 induces endothelial progenitor cell senescence by targeting AKT3. Cell Physiol Biochem. (2014) 34:1547–55. doi: 10.1159/000366358
61. Hu YL, Wang H, Huang Q, Wang G, Zhang HB. MicroRNA-23a-3p promotes the perihematomal edema formation after intracerebral hemorrhage via ZO-1. Eur Rev Med Pharmacol Sci. (2018) 22:2809–16. doi: 10.26355/eurrev_201805_14980
62. Fayyad-Kazan H, Hamade E, Rouas R, Najar M, Fayyad-Kazan M, El Zein N, et al. Downregulation of microRNA-24 and−181 parallels the upregulation of IFN-γ secreted by activated human CD4 lymphocytes. Hum Immunol. (2014) 75:677–85. doi: 10.1016/j.humimm.2014.01.007
63. Liu S, Gao L, Wang X, Xing Y. Respiratory syncytial virus infection inhibits TLR4 signaling via up-regulation of miR-26b. Cell Biol Int. (2015) 39:1376–83. doi: 10.1002/cbin.10518
64. Li Y, Xie J, Xu X, Liu L, Wan Y, Liu Y, et al. Inducible interleukin 32 (IL-32) exerts extensive antiviral function via selective stimulation of interferon λ1 (IFN-λ1). J Biol Chem. (2013) 288:20927–41. doi: 10.1074/jbc.M112.440115
65. Brock M, Haider TJ, Vogel J, Gassmann M, Speich R, Trenkmann M, et al. The hypoxia-induced microRNA-130a controls pulmonary smooth muscle cell proliferation by directly targeting CDKN1A. Int J Biochem Cell Biol. (2015) 61:129–37. doi: 10.1016/j.biocel.2015.02.002
66. Sun T, Li M-Y, Li P-F, Cao J-M. MicroRNAs in cardiac autophagy: small molecules and big role. Cells. (2018) 7:104. doi: 10.3390/cells7080104
67. Delay C, Calon F, Mathews P, Hébert SS. Alzheimer-specific variants in the 3'UTR of amyloid precursor protein affect microRNA function. Mol Neurodegener. (2011) 6:70. doi: 10.1186/1750-1326-6-70
68. Lu Y, Zhang Y, Wang N, Pan Z, Gao X, Zhang F, et al. MicroRNA-328 contributes to adverse electrical remodeling in atrial fibrillation. Circulation. (2010) 122:2378–87. doi: 10.1161/CIRCULATIONAHA.110.958967
69. Calvier L, Chouvarine P, Legchenko E, Hoffmann N, Geldner J, Borchert P, et al. PPARγ Links BMP2 and TGFβ1 pathways in vascular smooth muscle cells, regulating cell proliferation and glucose metabolism. Cell Metab. (2017) 25:1118–34.e7. doi: 10.1016/j.cmet.2017.03.011
70. Chen JT, Yao KH, Hua L, Zhang LP, Wang CY, Zhang JJ. MiR-338-3p inhibits the proliferation and migration of gastric cancer cells by targeting ADAM17. Int J Clin Exp Pathol. (2015) 8:10922–8.
71. Hébert SS, Horré K, Nicolaï L, Bergmans B, Papadopoulou AS, Delacourte A, et al. MicroRNA regulation of Alzheimer's amyloid precursor protein expression. Neurobiol Dis. (2009) 33:422–8. doi: 10.1016/j.nbd.2008.11.009
72. Ding J, Li M, Wan X, Jin X, Chen S, Yu C, et al. Effect of miR-34a in regulating steatosis by targeting PPARα expression in nonalcoholic fatty liver disease. Sci Rep. (2015) 5:13729. doi: 10.1038/srep13729
73. Zhou Y, Zhao RH, Tseng KF, Li KP, Lu ZG, Liu Y, et al. Sirolimus induces apoptosis and reverses multidrug resistance in human osteosarcoma cells in vitro via increasing microRNA-34b expression. Acta Pharmacol Sin. (2016) 37:519–29. doi: 10.1038/aps.2015.153
74. Luo Y, Wang D, Chen S, Yang Q. The role of miR-34c-5p/Notch in epithelial-mesenchymal transition (EMT) in endometriosis. Cell Signal. (2020) 72:109666. doi: 10.1016/j.cellsig.2020.109666
75. Zeng L, Chen Y, Wang Y, Yu LR, Knox B, Chen J, et al. MicroRNA hsa-miR-370-3p suppresses the expression and induction of CYP2D6 by facilitating mRNA degradation. Biochem Pharmacol. (2017) 140:139–49. doi: 10.1016/j.bcp.2017.05.018
76. Kovalchuk O, Filkowski J, Meservy J, Ilnytskyy Y, Tryndyak VP, Chekhun VF, et al. Involvement of microRNA-451 in resistance of the MCF-7 breast cancer cells to chemotherapeutic drug doxorubicin. Mol Cancer Ther. (2008) 7:2152–9. doi: 10.1158/1535-7163.MCT-08-0021
77. Boudeau J, Glasser AL, Julien S, Colombel JF, Darfeuille-Michaud A. Inhibitory effect of probiotic Escherichia coli strain Nissle 1917 on adhesion to and invasion of intestinal epithelial cells by adherent-invasive E. coli strains isolated from patients with Crohn's disease. Aliment Pharmacol Ther. (2003) 18:45–56. doi: 10.1046/j.1365-2036.2003.01638.x
78. Huang XP, Hou J, Shen XY, Huang CY, Zhang XH, Xie YA, et al. MicroRNA-486-5p, which is downregulated in hepatocellular carcinoma, suppresses tumor growth by targeting PIK3R1. FEBS J. (2015) 282:579–94. doi: 10.1111/febs.13167
79. Kurogi R, Nakamizo A, Suzuki SO, Mizoguchi M, Yoshimoto K, Amano T, et al. Inhibition of glioblastoma cell invasion by hsa-miR-145-5p and hsa-miR-31-5p co-overexpression in human mesenchymal stem cells. J Neurosurg. (2018) 130:44–55. doi: 10.3171/2017.8.JNS1788
80. Ding J, Huang S, Wang Y, Tian Q, Zha R, Shi H, et al. Genome-wide screening reveals that miR-195 targets the TNF-α/NF-κB pathway by down-regulating IκB kinase alpha and TAB3 in hepatocellular carcinoma. Hepatology. (2013) 58:654–66. doi: 10.1002/hep.26378
81. Fernández-de Frutos M, Galán-Chilet I, Goedeke L, Kim B, Pardo-Marqués V, Pérez-García A, et al. MicroRNA 7 impairs insulin signaling and regulates Aβ levels through posttranscriptional regulation of the insulin receptor substrate 2, insulin receptor, insulin-degrading enzyme, and liver X receptor pathway. Mol Cell Biol. (2019) 39:e00170-19. doi: 10.1128/MCB.00170-19
82. Raitoharju E, Seppälä I, Lyytikäinen L-P, Viikari J, Ala-Korpela M, Soininen P, et al. Blood hsa-miR-122-5p and hsa-miR-885-5p levels associate with fatty liver and related lipoprotein metabolism—The young finns study. Sci Rep. (2016) 6:38262. doi: 10.1038/srep38262
83. Jiang M, Li X, Quan X, Li X, Zhou B. MiR-92a family: a novel diagnostic biomarker and potential therapeutic target in human cancers. Front Mol Biosci. (2019) 6:98. doi: 10.3389/fmolb.2019.00098
84. Yu X-F, Zou J, Bao Z-J, Dong J. miR-93 suppresses proliferation and colony formation of human colon cancer stem cells. World J Gastroenterol. (2011) 17:4711–7. doi: 10.3748/wjg.v17.i42.4711
85. Yuan S, Tang C, Chen D, Li F, Huang M, Ye J, et al. miR-98 modulates cytokine production from human PBMCs in systemic lupus erythematosus by targeting IL-6 mRNA. J Immunol Res. (2019) 2019:9827574. doi: 10.1155/2019/9827574
86. Chalak LF, Sanchez PJ, Adams-Huet B, Laptook AR, Heyne RJ, Rosenfeld CR. Biomarkers for severity of neonatal hypoxic-ischemic encephalopathy and outcomes in newborns receiving hypothermia therapy. J Pediatr. (2014) 164:468–74 e1. doi: 10.1016/j.jpeds.2013.10.067
87. Shah DK, Ponnusamy V, Evanson J, Kapellou O, Ekitzidou G, Gupta N, et al. Raised plasma neurofilament light protein levels after rewarming are associated with adverse neurodevelopmental outcomes in newborns after therapeutic hypothermia. Fromt Neurol. (2010) 11:562510. doi: 10.3389/fneur.2020.562510
88. Zaigham M, Lundberg F, Hayes R, Undén J, Olofsson P. Umbilical cord blood concentrations of ubiquitin carboxy-terminal hydrolase L1 (UCH-L1) and glial fibrillary acidic protein (GFAP) in neonates developing hypoxic-ischemic encephalopathy. J Matern Fetal Neonatal Med. (2016) 29:1822–8. doi: 10.3109/14767058.2015.1064108
89. Lv HY, Wu SJ, Gu XL, Wang QL, Ren PS, Ma Y, et al. Predictive value of neurodevelopmental outcome and serum tau protein level in neonates with hypoxic ischemic encephalopathy. Clin Lab. (2017) 63:1153–62. doi: 10.7754/Clin.Lab.2017.170103
90. Badawi N, Kurinczuk JJ, Keogh JM, Alessandri LM, O'Sullivan F, Burton PR, et al. Intrapartum risk factors for newborn encephalopathy: the Western Australian case-control study. BMJ. (1998) 317:1554–8. doi: 10.1136/bmj.317.7172.1554
91. Nelson KB, Bingham P, Edwards EM, Horbar JD, Kenny MJ, Inder T, et al. Antecedents of neonatal encephalopathy in the vermont oxford network encephalopathy registry. Pediatrics. (2012) 130:878–86. doi: 10.1542/peds.2012-0714
92. Vannucci RC, Vannucci SJ. Perinatal hypoxic-ischemic brain damage: evolution of an animal model. Dev Neurosci. (2005) 27:81–6. doi: 10.1159/000085978
93. Chen CZ Li L, Lodish HF, Bartel DP. MicroRNAs modulate hematopoietic lineage differentiation. Science. (2004) 303:83–6. doi: 10.1126/science.1091903
94. Perry MM, Williams AE, Tsitsiou E, Larner-Svensson HM, Lindsay MA. Divergent intracellular pathways regulate interleukin-1beta-induced miR-146a and miR-146b expression and chemokine release in human alveolar epithelial cells. FEBS Lett. (2009) 583:3349–55. doi: 10.1016/j.febslet.2009.09.038
95. Looney AM, Walsh BH, Moloney G, Grenham S, Fagan A, O'Keeffe GW, et al. Downregulation of umbilical cord blood levels of miR-374a in neonatal hypoxic ischemic encephalopathy. J Pediatr. (2015) 167:269–73.e2. doi: 10.1016/j.jpeds.2015.04.060
96. Casey S, Goasdoue K, Miller SM, Brennan GP, Cowin G, O'Mahony AG, et al. Temporally altered miRNA expression in a piglet model of hypoxic ischemic brain injury. Mol Neurobiol. (2020) 57:4322–44. doi: 10.1007/s12035-020-02018-w
Low cord pH neonates: Neonates with cord pH (arterial/venous) ≤7.1 or neonates with cord pH (arterial/venous) between 7.11–7.15 with worsening sarnat exam during serial assessment in the first 6 h of life with evidence of mild hypoxic ischemic encephalopathy.
Perinatal adverse events: Events occurring during perinatal period with potential to result in acute disruption of placental blood flow such as uterine rupture, placental abruption, umbilical cord prolapse, shoulder dystocia, maternal cardiac arrest, amniotic air embolism etc.
Mild hypoxic ischemic encephalopathy: Neonates with low cord pH with one or more abnormal category in modified sarnat staging criteria within 6 h of life and does not have evidence of moderate-severe encephalopathy.
Moderate-severe hypoxic ischemic encephalopathy: Neonates with cord pH <7 and/or a base deficit >16 with evidence of moderate-severe encephalopathy (defined as seizures or 3 or more abnormalities on a modified sarnat exam), or pH between 7.01–7.15 and/or base deficit between 10–15.9 and acute perinatal adverse event and an APGAR of 5 or less at 5 min or mechanical ventilation at 10 min of life if no blood gas was available.
Keywords: HIE, UCH-L1, GFAP, NFL, miRNAs, Tau
Citation: Gaulee P, Yang Z, Sura L, Xu H, Rossignol C, Weiss MD and Bliznyuk N (2022) Concentration of Serum Biomarkers of Brain Injury in Neonates With a Low Cord pH With or Without Mild Hypoxic-Ischemic Encephalopathy. Front. Neurol. 13:934755. doi: 10.3389/fneur.2022.934755
Received: 03 May 2022; Accepted: 13 June 2022;
Published: 07 July 2022.
Edited by:
Anna Maria Lavezzi, University of Milan, ItalyReviewed by:
Serafina Perrone, University of Parma, ItalyCopyright © 2022 Gaulee, Yang, Sura, Xu, Rossignol, Weiss and Bliznyuk. This is an open-access article distributed under the terms of the Creative Commons Attribution License (CC BY). The use, distribution or reproduction in other forums is permitted, provided the original author(s) and the copyright owner(s) are credited and that the original publication in this journal is cited, in accordance with accepted academic practice. No use, distribution or reproduction is permitted which does not comply with these terms.
*Correspondence: Pratima Gaulee, cHJhdGltYWF0c2FseWFuQHlhaG9vLmNvbQ==
†These authors have contributed equally to this work
Disclaimer: All claims expressed in this article are solely those of the authors and do not necessarily represent those of their affiliated organizations, or those of the publisher, the editors and the reviewers. Any product that may be evaluated in this article or claim that may be made by its manufacturer is not guaranteed or endorsed by the publisher.
Research integrity at Frontiers
Learn more about the work of our research integrity team to safeguard the quality of each article we publish.