


- Naturwissenschaftliches und Medizinisches Institut an der Universität Tübingen, Reutlingen, Germany
Chemical stimulation of cells is inherently cell type selective in contrast to electro-stimulation. The availability of a system for localized application of minute amounts of chemical stimulants could be useful for dose related response studies to test new compounds. It could also bring forward the development of a novel type of neuroprostheses. In an experimental setup microdroplets of an acetylcholine solution were ejected from a fluidic microsystem and applied to the bottom of a nanoporous membrane. The solution traveled through the pores to the top of the membrane on which TE671 cells were cultivated. Calcium imaging was used to visualize cellular response with temporal and spatial resolution. Experimental demonstration of chemical stimulation for both threshold gated stimulation as well as accumulated dose–response was achieved by either employing acetylcholine as chemical stimulant or applying calcein uptake, respectively. Numerical modeling and simulation of transport mechanisms involved were employed to gain a theoretical understanding of the influence of pore size, concentration of stimulant and droplet volume on the spatial-temporal distribution of stimulant and on the cellular response. Diffusion, pressure driven flow and evaporation effects were taken into account. Fast stimulation kinetic is achieved with pores of 0.82 μm diameter, whereas sustained substance delivery is obtained with nanoporous membranes. In all cases threshold concentrations ranging from 0.01 to 0.015 μM acetylcholine independent of pore size were determined.
Introduction
State of the art neuroprostheses are based on the electrical stimulation of cells by means of microelectrodes. Typical examples thereof are cochlear implants (Rebscher et al., 2007, 2008; Gani et al., 2007), deep brain stimulators (Hodaie et al., 2002; Echauz et al., 2007; Birdno and Grill, 2008; Vitek, 2008) and retina implants (Zrenner et al., 1999, 2008; Chow et al., 2004). Cardiac pacemakers (Gregoratos, 2005; The Royal Australian College of General Practitioner) or other muscle stimulators address only a single type of cells (muscle cells) and no particularly high spatial resolution is required. In neuroprosthesis applications such as artificial retina prosthesis the situation is different. Here, image resolution certainly depends on the lateral spacing of stimulation sites. The retina also contains various layers comprising different types of neuronal cells (e.g., on- and off-bipolar, horizontal, amacrine, and ganglion cells) with a complex array of interneurons forming synapses between the photoreceptors and optic nerve (Kolb, 1994). All of these cells may be stimulated electrically (Humayun et al., 1994, 1996, 1999; Rizzo and Wyatt, 1997; Stett et al., 2000). Since all cells up to a certain maximum distance from the stimulation electrodes are excited, the stimulation is basically unselective. In order to provide a more physiological input to the retina by a neuroprosthesis, a stimulation paradigm allowing for cell type selective stimulation would be highly desirable. This may only be achieved by the localized application of a chemical stimulant on a large number of application spots located in close vicinity to the retina.
Finally, localized chemical stimulation could also be used for a novel type of substance screening assays. Today, there is a trend toward “high content screening” assays usually meaning cell based assays (Korn and Krausz, 2007). In order to determine a dose–response correlation the acquisition of a large number of data points is required. Sample wells with cells cultured therein are incubated with the substance under investigation employing a certain range of concentrations. Our results demonstrate how one could use a single well to acquire a dose related response correlation in a “one shot” experiment.
Microsystem technology provides for a comprehensive set of tools to fabricate microfluidic systems that may handle minute amounts of fluid at volumes ranging from μL to pL. Fishman et al. (Noolandi et al., 2003; Peterman et al., 2003a,b, 2004a,b) have previously proposed such a system comprising microchannels and microapertures to chemically stimulate adherent cells. However, no means were provided to prevent passive leakage by diffusion or convection of the chemical stimulant. Yet, leakage and the continuous stimulation resulting from it may cause undesirable desensitization of cells.
For this reason the task at hand is to devise a microfluidic system allowing for externally triggered substance release while avoiding passive leakage. In our experimental approach acetylcholine sensitive TE671 cells were cultivated on nano- and microporous membranes. Microdroplets (Vdroplet = 20 pL) were applied to the bottom side of these membranes by means of an inkjet printhead via an air space. The utilization of an air space efficiently prevents any leakage from the printhead into the cell culture vessel. Cellular response was observed by time resolved fluorescence imaging employing Ca2+-sensitive dyes and related to numerically calculated concentration of the stimulant.
The goals of this study were (i) to devise an experimental setup for localized chemical stimulation while avoiding leakage, (ii) to experimentally demonstrate the feasibility of this approach, (iii) to establish a model for numerical simulation, and (iv) to validate it for consistency with respect to experimental results and the potential for application in neuroprosthetics, drug delivery and substance screening.
Materials and Methods
Cells and Cell Culture Procedures
TE671 cells comprise two different kinds of acetylcholine receptors, namely muscle type nicotinic (ionotropic) and muscarinic (metabotropic). This cell line is used as a model of human medulloblastoma (Stratton et al., 1989). The stimulation of nicotinic receptors leads to influx of sodium through the membrane channels and depolarization (Fryer and Lukas, 1999; Reitstetter et al., 1999; Fitch et al., 2003). Through a signaling cascade (IP3-receptors and ryanodine receptors) the stimulation of muscarinic receptors leads to the release of Ca2+ from the reservoirs into the cytoplasma (Bencherif and Lukas, 1991; Grassi et al., 1993; Giovannardi et al., 1994; Edahiro et al., 2004). This allows for the observation of the response of a large number of cells located within the field of view area by calcium imaging techniques.
TE671-cells were thawed and cultivated in Dulbecco’s Modified Eagle’s Medium (DMEM, 4.5 g/l glucose) supplemented with 10% fetal calf serum, 2 mM glutamine, penicillin and streptomycin at 37°C and 5% CO2. After 24 h the medium was exchanged. For cell transfer medium was removed, adherent cells were washed and subsequently incubated with buffer containing trypsin (0.5 mg/ml) and EDTA (0.22 mg/ml) to release cells from the substrate. Cells were transferred to a centrifuge vessel, sedimented at 1200 rpm and resuspended in warm culture medium. Cells were then seeded at a density of 3 × 10⁵/ml in a T75 flask and cultivated for 4 days. A maximum number of 35 passages were performed before a new lot of cells was retrieved from the cryo stock.
Membranes with pore diameters ranging from 50 to 820 nm were obtained from Whatman (Table 1) and were used for construction of cell culture vessels. SEM images of membranes (not shown) were taken in order to confirm manufactures data with respect to pore size and porosity.
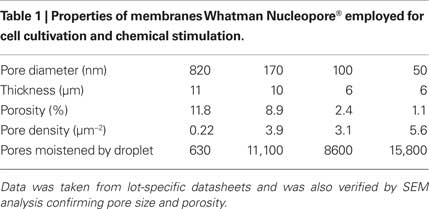
Table 1. Properties of membranes Whatman Nucleopore® employed for cell cultivation and chemical stimulation.
Prior to cell seeding the membranes were treated with air plasma for 60 s (Harrick plasma cleaner) and subsequently coated by incubation in a 25 μg/ml laminin solution for 3 h (Zibek et al., 2007). Cells were seeded on the top side of nano- or microporous membranes.
Experimental Setup
In Figure 1 the experimental setup is shown. Cells are cultured in a vessel consisting of a glass ring (diameter 25 mm) with the porous membrane glued to its bottom. During a stimulation experiment, the cell culture vessel is mounted above an inkjet printhead with a bubble jet actuator allowing for the application of droplets (Vdroplet = 20 pL) to the bottom face of the membrane. The distance between the inkjet apertures and the membrane was 2–3 mm, providing for an air space (Hu et al., 2007; Zibek et al., 2007) which effectively prevents any leakage of the stimulant from the printhead into the cell culture vessel. The printhead chip (Olivetti), comprising 208 nozzles and multiplexing electronics was integrated into a homemade electronics board and operated using a digital I/O board (National Instruments) controlled by a LabView® application. This setup allowed for the arbitrary choice of a particular nozzle as well as for the number of droplets applied and the droplet frequency. The relative position of printhead and cell culture dish was adjusted manually. The density of pores is high and their lateral spacing small (Table 1) compared to the size of a droplet (diameter approx. 60 μm). As a result even in case of the largest pore size a large number of pores are always moistened. Thus, no particular alignment between pores and printhead is required.
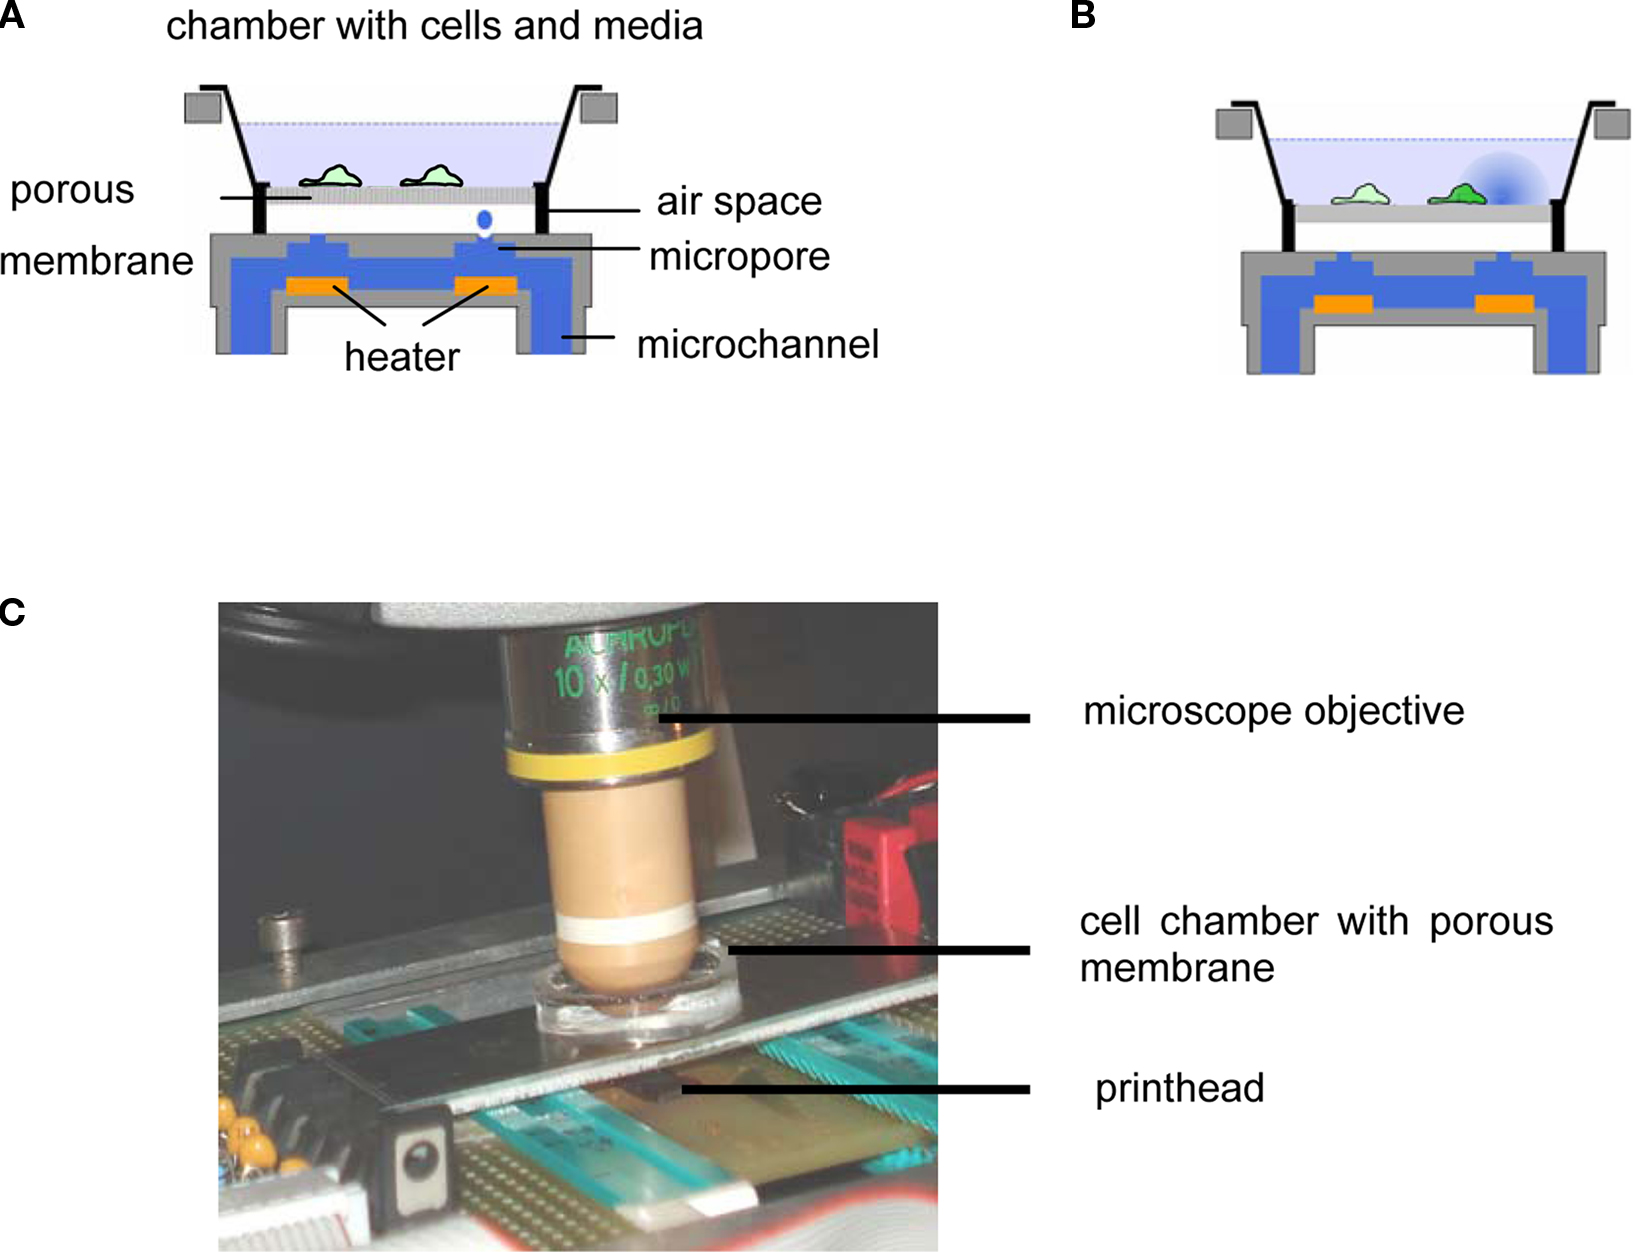
Figure 1. (A) Schematic depiction of setup and mode of operation. A cell culture vessel consisting of a glass ring with a porous membrane glued to its bottom is placed above an inkjet printhead allowing for the application of droplets containing a chemical stimulant to the bottom face of the membrane via an air space. (B) Distribution of stimulus and stimulated cell. (C) Closeup of the setup.
The setup was operated at ambient temperature and humidity.
Modeling and Numerical Simulation
We modeled the substance transport from a sessile droplet underneath the membrane into the culture vessel via a porous membrane and the spatio-temporal distribution within the vessel and simulated it numerically (Figure 2A). Thus, a detailed understanding of the processes involved in substance delivery was gained. Also, quantitative data of substance transport and spatio-temporal distribution that could be related to experimental data on cellular response was obtained.

Figure 2. (A) Schematic depiction of the various contributions considered in the model of substance transport across porous membranes and within the chamber. (B–G) Example of calculated distribution of stimulant within the culture vessel at three different times after application of droplet to the bottom face of the membrane. Cross-section in the x–z-plane are shown, dimensions are in μm. Concentration of the stimulant in droplet was 1 mM, pore diameter was 50 nm (left column) or 820 nm (right column), respectively. Note the distinctly different kinetic and level of delivery of the stimulant to the culture vessel in both cases.
Mass transfer from the bottom side through the pores of the membrane into the cell chamber side is denoted as transmembrane flux Jsum according to Figure 2A and Eq. 1.

Jsum comprises two main contributions, namely diffusion and pressure driven flow, JD and JP, respectively, as is outlined in Section “Introduction” and “Materials and Methods” below. In addition, evaporation of the sessile droplet is considered in Section “Results and Discussion.”
1. Diffusive transport of molecules, JD, due to the difference in concentration between droplet and medium in the culture vessel. Fick’s first law (Eq. 2) was employed for the calculation of this contribution (Bruus, 2008).
with the diffusion coefficient, D = 5.35×10⁻¹⁰ m2/s (Siddiqi and Lucas, 1986), the concentration difference, Δc, between droplet and the cell culture media at the upper surface of the membrane, Npore the number of pores, the pore radius, rpore, and dmembrane as diffusion length (Table 1).
2. Pressure driven flow, JP, occurs as a result of the surface tension of the droplet and may be calculated employing Hagen–Poiseuille’s law (Eq. 3) (Bruus, 2008).
Here, rpore is the pore radius, Δpcapillary the pressure difference between droplet and the cell culture medium at the upper surface of the membrane, Npore the number of pores within the contact area of the droplet, cdroplet the concentration of the applied stimulant, η the viscosity and dmembrane the pore length (i.e., thickness of the membrane).
For this calculation it was assumed that the contact area between droplet and membrane remains constant during the transfer of substance through the membrane. This is reasonable because the rim of the droplet is pinned by capillary forces of the pores. As the droplet volume decreases the contact angle decreases as well, followed by the pressure driving the fluid through the pores. Under these conditions, the pressure p within the droplet can be calculated as a function of the droplet radius Rdroplet, surface tension σ and the contact angle θ according to Bohl and Elmendorf (2008):

3. Finally, evaporation of the fluid in the sessile droplet showed a significant effect on the transport process, particularly when using the nanoporous membranes. Evaporation rate  was calculated according to Eq. 5 employing the diffusion based approach of Birdi and Vu (1993), Birdi et al. (1989) and Rowan et al. (1995).
where V is droplet volume, t is the time, ρ is the density of water, h is the height of the sessile droplet, Dwater is the diffusion coefficient of water in air, c0 = 0.0231 kg/m3 is the concentration at the droplet surface which equals the saturation concentration (100% humidity at 25°C, 1013 mbar) whereas c∞ = 0.0093 kg/m3 (42% humidity at 25°C, 1013 mbar) is defined by the humidity of the ambient atmosphere.
Fluorescence microscopy measures intensity integrated along the z-direction. In order to compare simulation results to fluorescence microscopy observations of fluorescent dye distribution, the amount n(x, t) of fluorescent dye delivered to volume elements with a footprint of 2 × 2 μm were calculated from c(r, t) according to
with A denoting the footprint area of the volume element (here 4 μm2), c(r, t) the concentration as obtained from the simulation, and h the height of the fluid in the cell culture vessel. Here, z = 0 denotes the upper surface of the membrane.
Transport processes and spatio-temporal distribution within the chamber were calculated numerically employing a combined diffusion and convection approach (Figure 2A; Bruus, 2008). Velocity fields were calculated using Navier Stokes equations for incompressible fluids. FlexPDE® software was used for all calculations.
Fluorescence Assays
Fluorescence dye
First we applied droplets of the dye to the bottom face of the membrane. Afterwards we were able to validate the model described above and the numerical simulation of transport processes by fluorescence microscopic observation of the spatio-temporal distribution of Eosin Y dye solution (1 mM).
Calcium imaging
Prior to stimulation cells were incubated with Fluo-4-AM, a calcium sensitive dye, at a concentration of 2.3 mM for 30 min. The dye is enzymatically converted in the cytosol of the cells into Fluo-4 which is retained in the cells thereafter. Subsequently, cells were washed with phosphate buffered salt solution (PBS) containing Ca2+, Mg2+, and Glucose to remove any excessive dye not taken up by cells.
Upon excitation, intracellular calcium levels increase as a consequence of triggering the intracellular signal cascade. Starting from muscarinic acetylcholine receptors this gives rise to an increase of fluorescence intensity of Fluo-4 dye and thus provides for readout of cellular excitation. In order to obtain the time course of the fluorescence intensity of a particular cell a region of interest [regions of interest (ROI), Ø = 10 μm] was defined and the intensity (averaged over the ROI) was determined by an automated routine from a series of frames using ImageJ® or Matlab®. Fluorescence intensity  as the change of intensity within the ROI of a cell at the coordinates x, y was calculated according to

In this equation It<0(x, y) is the intensity prior to stimulation at the x- and y-coordinates with respect to the center of the application spot and It>0(x, y) the intensity after stimulation. Relative change of fluorescence intensity was calculated and used to determine onset of excitation at 10% of maximum signal.
Ca2+-imaging was performed using a fluorescence microscope (Zeiss, Oberkochen, Germany) and cameras with either 8 or 12 bit resolution.
A mixture of acetylcholine (0.01–1 mM) and Eosin Y (1–10 μM) was filled into the microchannel of an inkjet printhead. Eosin Y is employed as tracer to confirm the arrival of a stimulation droplet at the bottom face of the nanoporous membrane. When used as tracer in combination with acetylcholine, its concentration was by a factor of at least 100 smaller than that of the Fluo-4 dye the cells had been incubated with previously. Therefore, only at the application spot appreciable fluorescence intensity due to Eosin Y was detected whereas signal obtained in the periphery was solely due to Fluo-4 fluorescence. In addition, in independent experiments no uptake of Eosin Y dye into cells was observed.
The EC50 level is a well-known quantity used in pharmacology and toxicology to calculate the efficacy of a substance from a dose–response curve. There, it represents the dose at which 50% of the maximum efficacy is observed.
Calcein assay
For the analysis of accumulated dose–response the microchannel was filled with a mixture of calcein-AM (250 μM) and Eosin Y (10 μM). Again Eosin Y is employed as tracer to confirm the arrival of a stimulation droplet. After applying the mixture calcein-AM diffuses into the cells and is converted enzymatically to fluorescent calcein whereas calcein-AM is non-fluorescent. To determine changes of intensity a ROI within each cell is defined and analyzed by software as described above for the case of acetylcholine stimulation experiments.
Results and Discussion
Modeling and Numerical Simulation
Relative contributions of different transport processes and kinetics of transmembrane transport
In Figure 3 the contributions of diffusive, JD, and pressure driven flow, JP, to the overall volume flow, Jsum, are plotted for the different pore sizes and porosities calculated in this study. In case of d = 50 nm (Figure 3A), diffusive transport dominates the substance transport. A pronounced peak in JD is due to the increase of the concentration within the droplet as a consequence of evaporation. This results in an increase of the concentration gradient between droplet and medium in the tissue vessel. On the other hand the concentration within the medium is continuously increasing, which tends to reduce the gradient. Both effects combined result in a peak in substance delivery after 1.4 s.
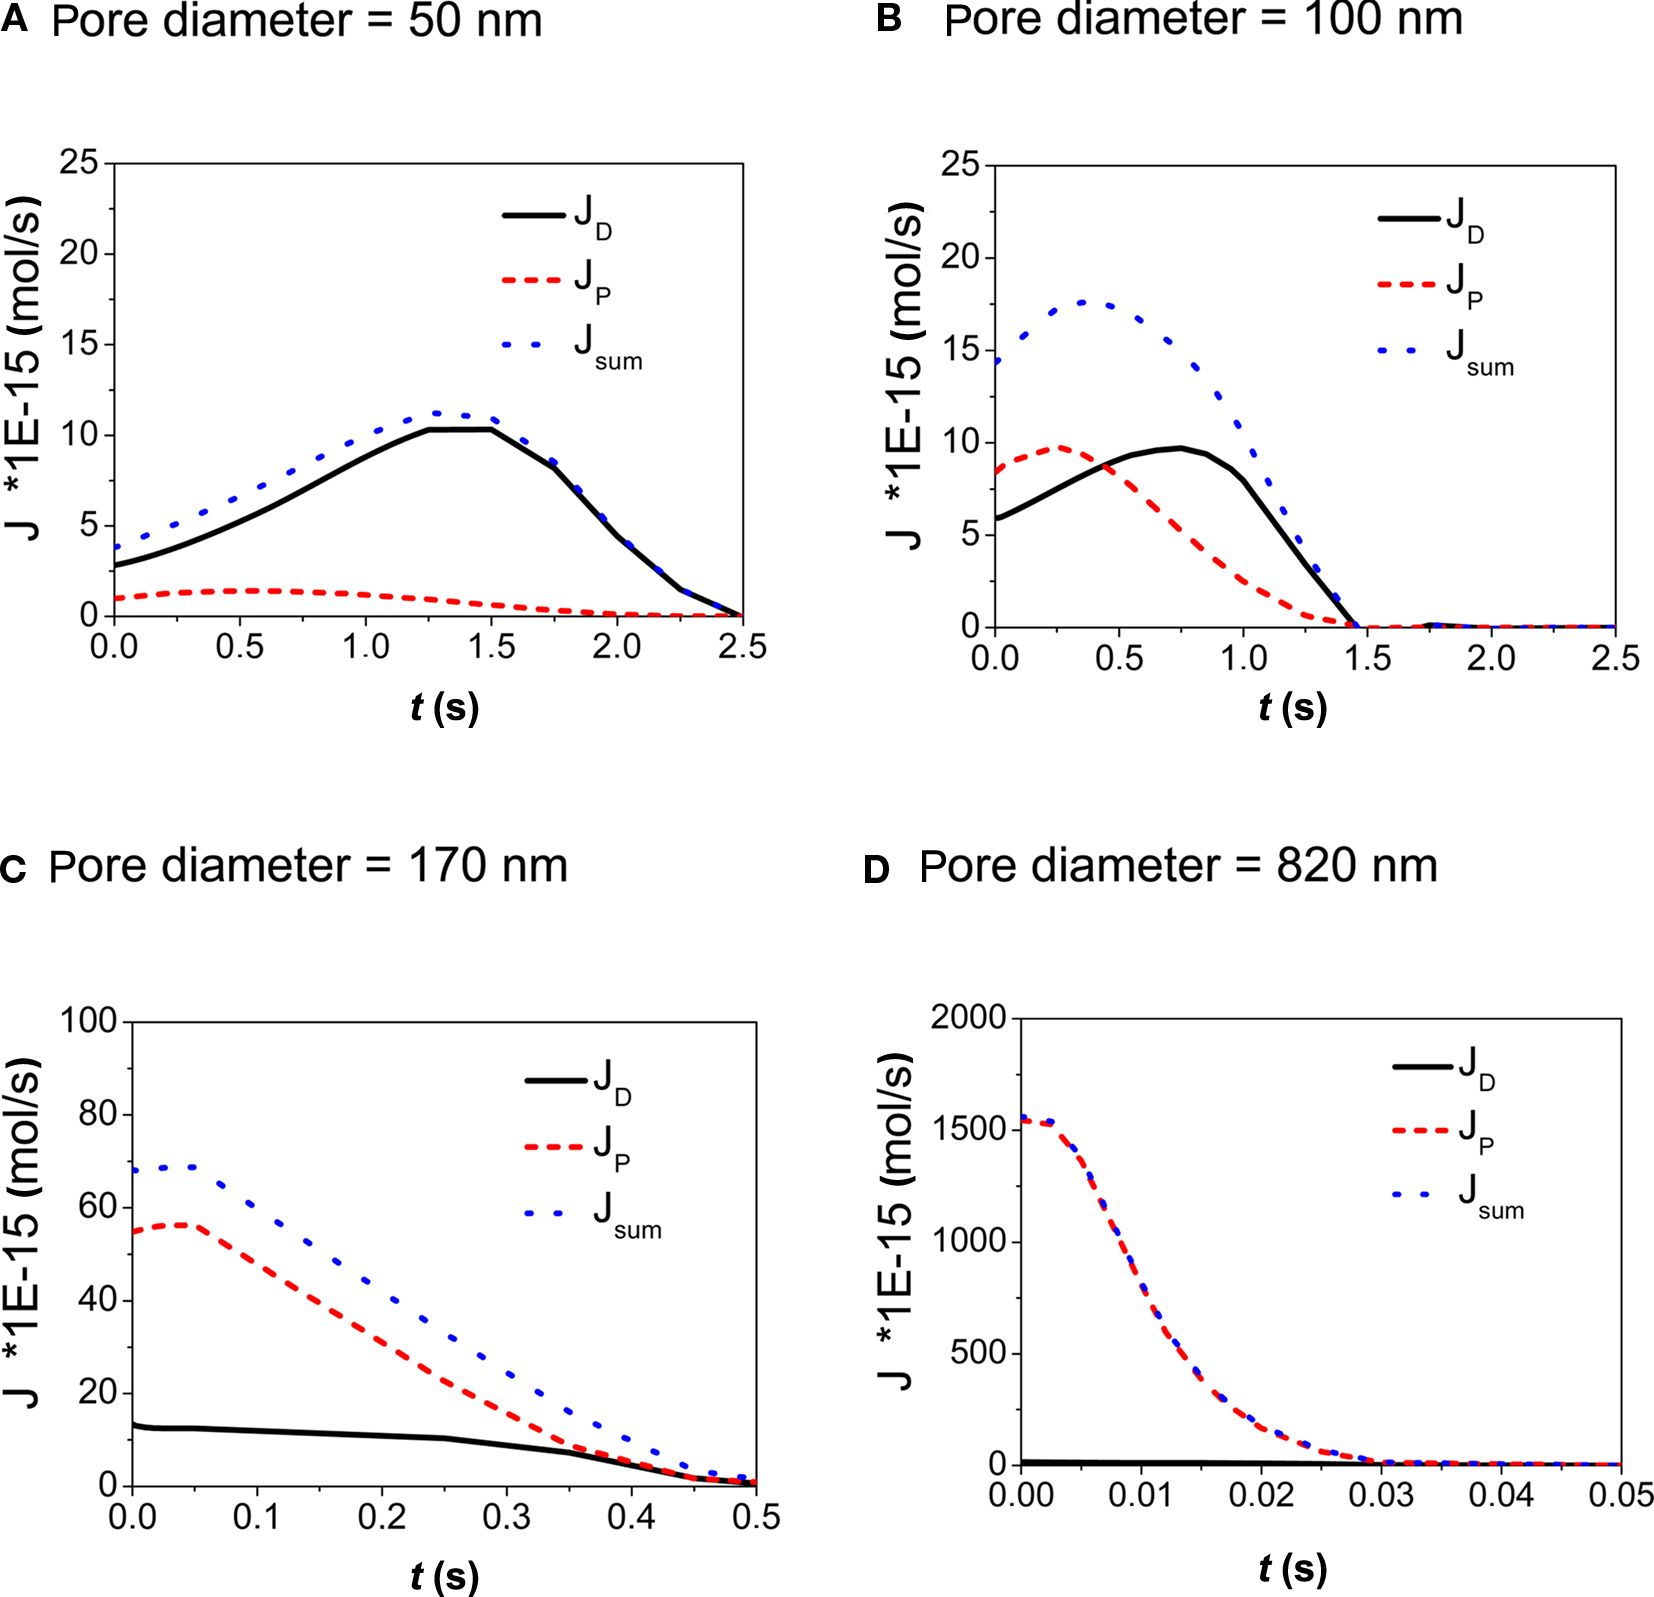
Figure 3. (A–D) Calculation of the contributions of diffusive and convective flow to the overall volume flow through the pores of the membrane as a function of time. The contact area wetted by the droplet was A = 2826 μm2, concentration of stimulant within the droplet was 1 mM. Pore diameters ranged from 50 to 820 nm.
Diffusive and convective transport provide similar contributions for membranes with a pore diameter of d = 100 nm (Figure 3B). However with pressure driven flow transport attains its peak value at 0.25 s whereas diffusive transport reaches a maximum value at 0.75 s. This again is an effect of evaporation and its associated increase of concentration in the droplet.
Looking at membranes with pore diameters of d = 170 nm (Figure 3C) and d = 820 nm (Figure 3D), pressure driven flow is the dominant contribution. As a result, the substance delivery peaks at earlier times and reaches higher concentration values when compared to the situation observed in membranes with small pore diameters. This demonstrates how the kinetics of substance delivery may be controlled by an appropriate choice of the pore diameter. The pulse duration (or life time of the applied sessile droplet) as a function of the droplet volume Vdroplet is shown in Figure 4.
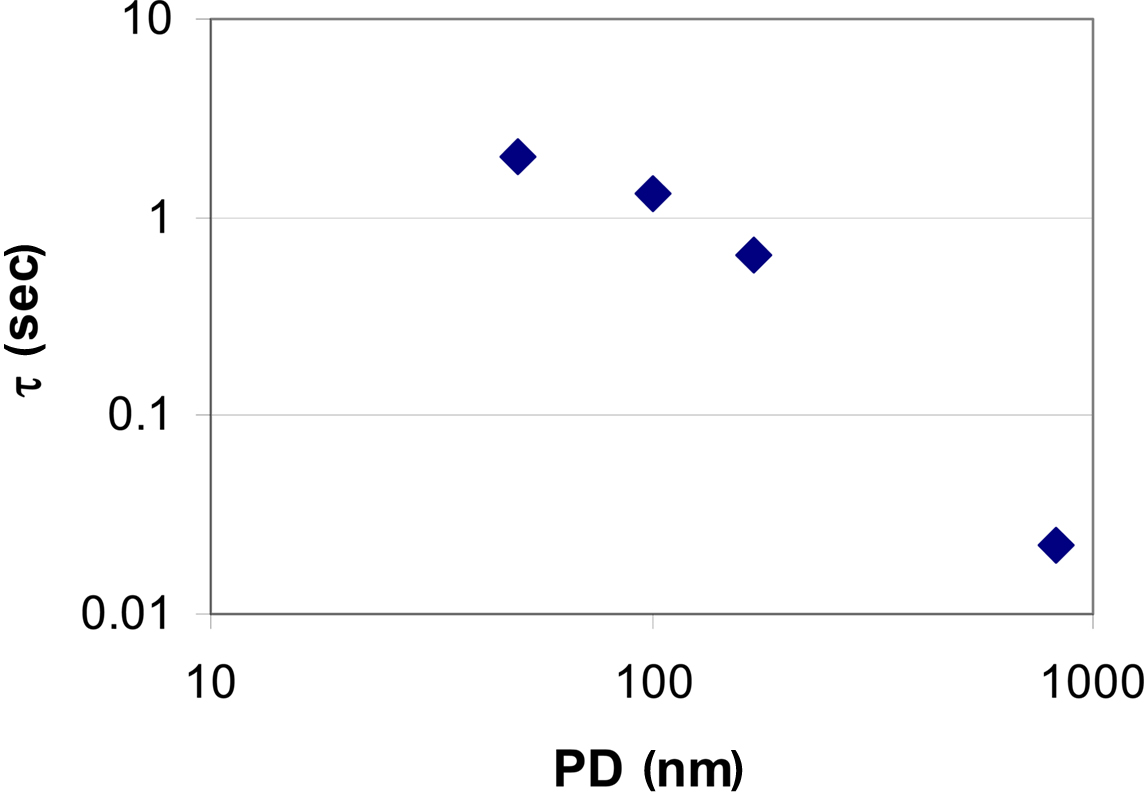
Figure 4. Droplet lifetime on membranes with different pore diameter (PD). Volume loss is caused by pressure driven flow due to surface tension and by evaporation, respectively. Evaporation of the droplet (V = 20 pL) is dominant in case of very small pore diameters (see also Figure 3). Complete evaporation of a droplet takes about 2 s according to Eq. 5. This value also reflects the maximum pulse duration achievable under the given experimental conditions. A repeated application was considered after achieving 1 pL of the preceding droplet volume. On the other hand, in case of micropores, evaporation is practically negligible and pressure driven flow is dominant thus allowing for very short stimulation pulses.
Spatio-temporal distribution of stimulant within cell chamber and validation of the model with experimental results
The distribution of the chemical stimulant within the vessel, c(r, t), r being the radial distance from the center of the applied droplet, was calculated employing a combined diffusion and convection approach (Figure 2A). The distribution of the stimulant in the (x,z) -plane of the model is shown in Figure 2B–G for two different membrane pore sizes. From these data, c(r, t) was calculated at the surface of the membrane where cells would be located (z = 10 μm).
In order to validate the theoretical model, the amount n(x, t) of Eosin Y delivered to a small volume element positioned at various distances x = 40, 50, and 60 μm from the center of the application spot was recorded. The volume element had a quadratic base area (side length l = 2 μm), its height spanning the fluid height in the cell culture vessel. In Figure 5 traces of the fluorescence intensity obtained from the application of droplets of Eosin Y solution onto the membrane are calculated as the absolute amount, n(x, t), of dye (Figures 5A–D). Particularly in case of the smaller pore diameters significant deviations between calculation and measurement during the initial phase of the stimulation can be observed (Figures 5A,B). The increase of the measured amount of stimulant occurs faster than is predicted by the calculation. This discrepancy can be accounted for by the simplicity of the evaporation model implemented into the numerical simulation. Evaporation is particularly important in case of the nanoporous membranes where droplet lifetime, τ, is on the order of several seconds (Figures 4 and 5A,B). According to literature evaporation rate is increasing as droplet height on the bottom surface of the membrane (Figure 1A), is decreasing (Guena et al., 2007; Tan et al., 2007).
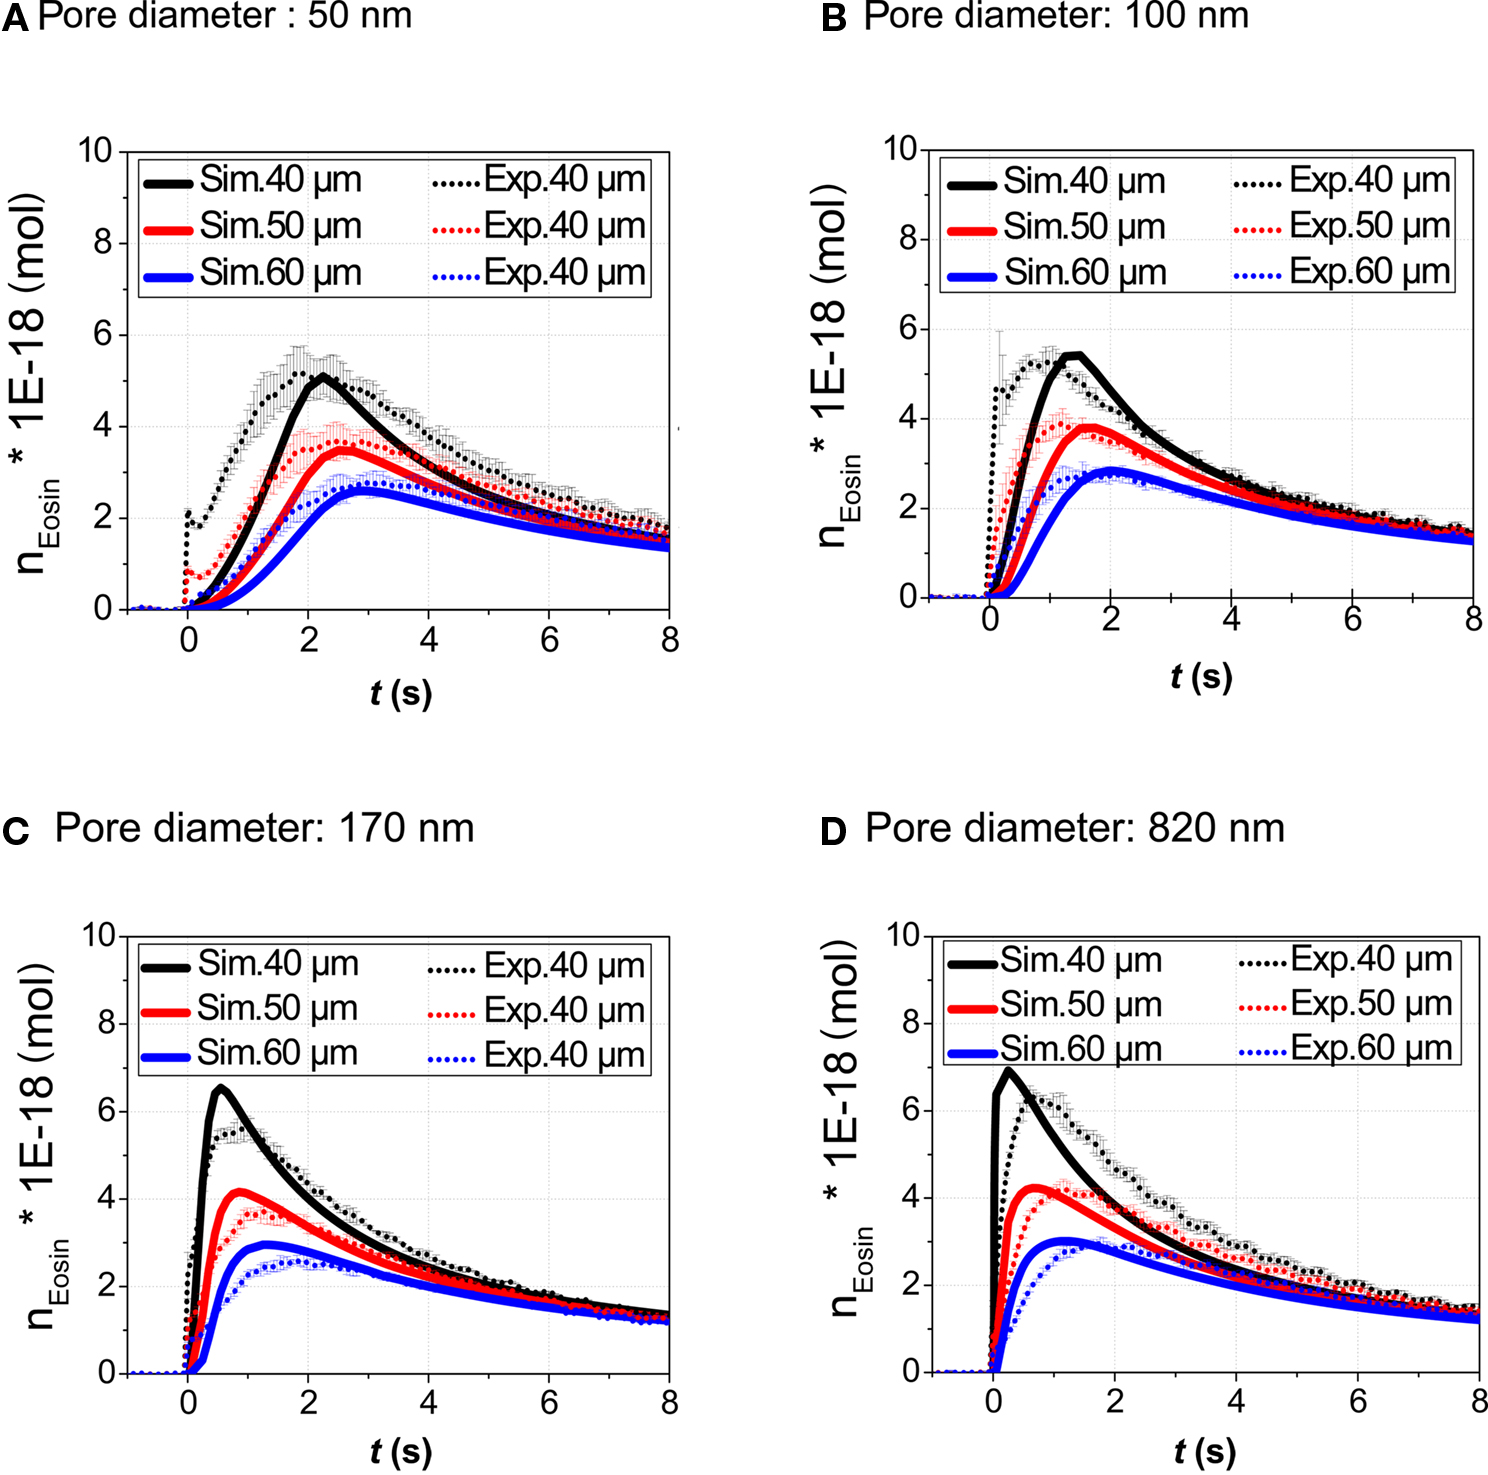
Figure 5. Validation of the model. The amount n(x, t) (volume-integral of concentration) of the stimulant in a volume element on the top surface of the membrane in the cell chamber was both calculated and determined experimentally. Eosin Y dye (droplet concentration 1 mM) was used as fluorescent tracer. Data was recorded for three different distances (40, 50, and 60 μm) with respect to the application spot and four types of membranes. Pore diameters: (A) 50 nm, (B) 100 nm, (C) 170 nm, (D) 820 nm. The volume element had a quadratic base area (side length l = 2 μm), its height spanning the fluid height in the cell culture vessel.
Spatio-temporal concentration profiles, c(r, t), allow for a relation of stimulant concentration experienced by a cell to experimentally observed stimulation thresholds at a certain location with respect to the application spot (Figure 7).
In summary, numerical modeling demonstrated how by a proper choice of pore size and porosity, the kinetics of substance delivery may be tailored to a particular experimental requirement. Table 2 summarizes the peak concentration cmax achievable in the cell culture vessel in a volume element above the application spot.
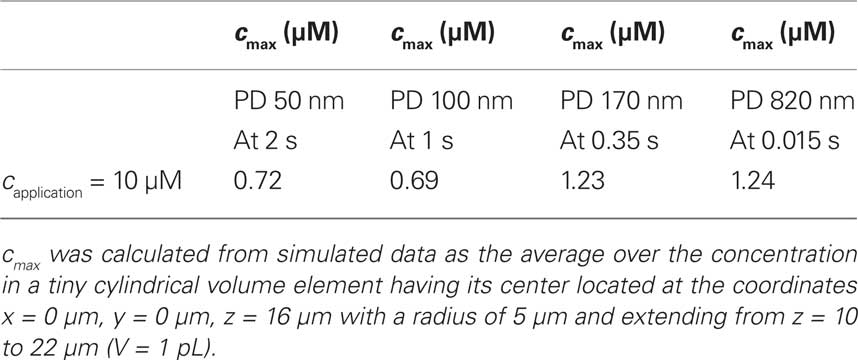
Table 2. Peak substance concentration cmax that may be obtained upon application of a droplet of the stimulant.
Localized Functional Chemical Stimulation by Acetylcholine
The excitation of TE671 cells upon stimulation with a mixture of acetylcholine and Eosin Y was monitored via Ca2+-imaging. Eosin Y was added to indicate the position of the application spot. The dye does not stain or stimulate the cells as independent measurements confirmed. The increase of the fluorescence intensity observed within the cells is solely due to intracellular Ca2+ release which occurs as a result of the stimulation. A typical example of how the excitation progresses within the cell culture from the center (application spot) to the periphery is shown in Figure 6. In this case the pore diameter was 820 nm, acetylcholine concentration was 1 mM and Eosin Y concentration was 1 μM. In the graph at t = 3 s, some ROI which were used to calculate the integrated fluorescence intensity of cells are indicated (white circles). These data were retrieved from the frames of a video recording of the stimulation experiment and plotted as a function of time according to Eq. 7 chapter 2.4.
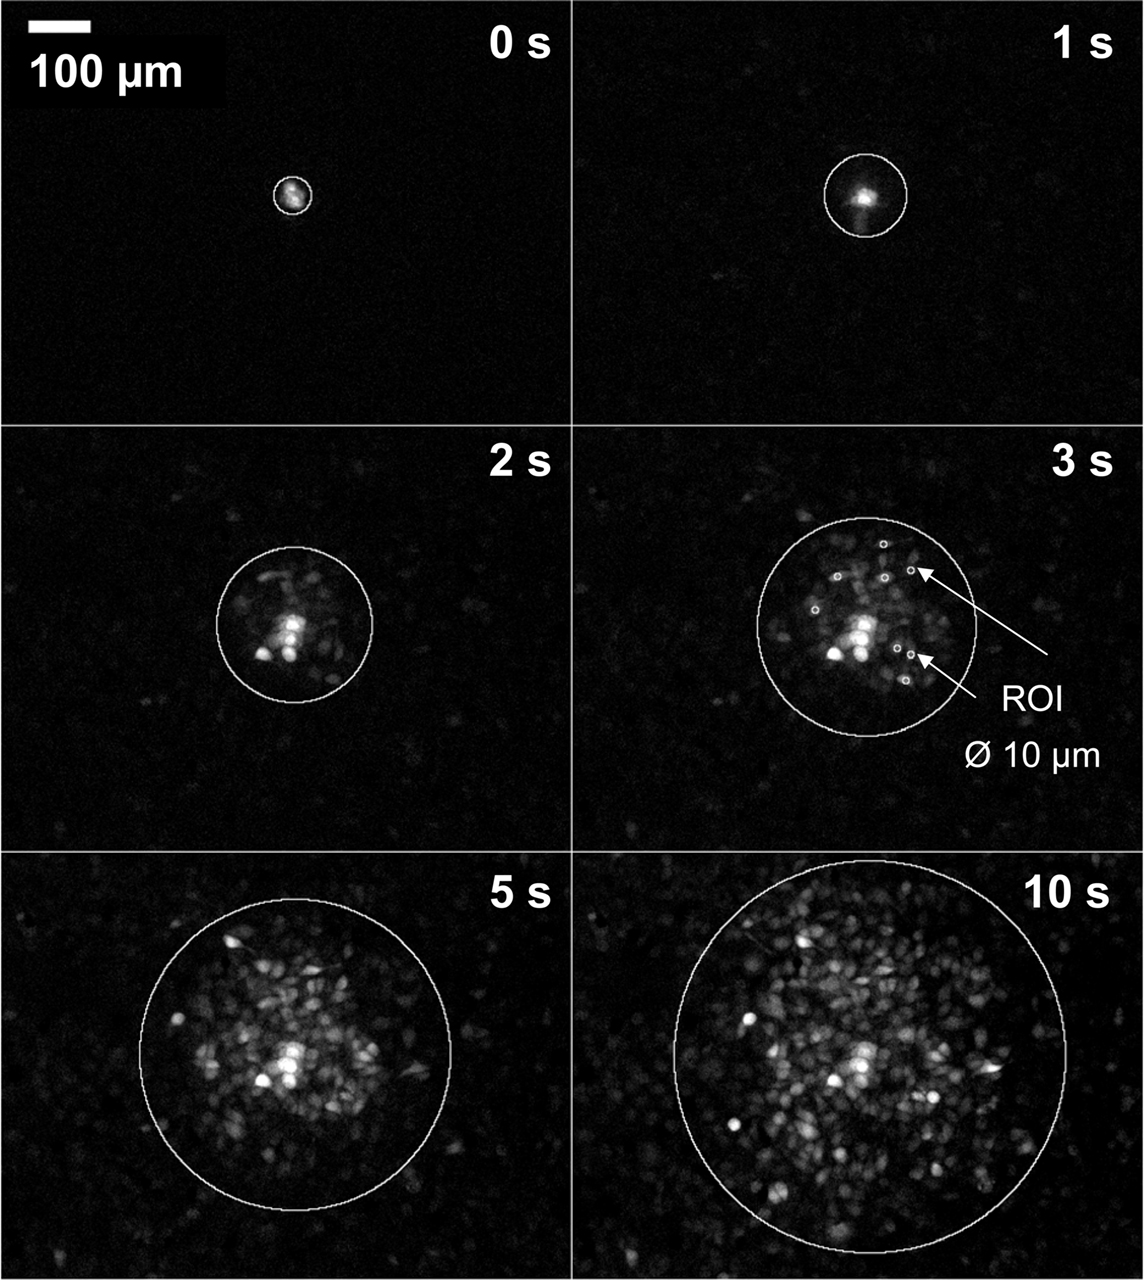
Figure 6. Series of fluorescence micrographs of stimulated TE671 cells cultivated on a porous membrane (pore size 820 nm) after application of a 20 pL droplet of acetylcholine (1 mM)/Eosin Y (1 μM). The dye indicates the position of the application spot (wetted area schematically shown in picture t = 0 s). Eosin Y is not taken up by the cells as was confirmed in separate experiments (not shown). Fluorescence observed within cells is solely due to a change of intracellular Ca2+ concentration as a result of excitation of the cells and the related change in Fluo-4 fluorescence. White circles indicate the approximate range of chemical stimulation at the respective time.
Figure 7A shows that the slope of the intensity plot toward the excitation maximum generally decreases with increasing distance of the respective cell from the application spot. Also, an increase of the delay between stimulation and cellular response is observed with increasing distance. This delay reflects the diffusion of the stimulant from the application spot to the site of the cell. The intensity plots,  can be related to c(r, t) obtained from the numerical simulation of the stimulant concentration (Figure 7B). The onset of the excitation (at 10% of the maximum value of the fluorescence intensity trace) of the cellular response coincides with a common threshold concentration of approximately ∼0.01 μM acetylcholine in all four cells considered in Figure 7A. For the sake of clarity, results of only four cells located at largely different distances from the application spot are displayed in this graph. An excitation level larger than 10% of the maximum value of the fluorescence was considered above threshold according to the general observation, that at this level the signals were well beyond noise contributions and excitation could be determined in a robust manner. This result was also verified in independent experiments with different membranes (not shown). As was expected and indeed observed in the experiments, the threshold concentration is independent of pore size and location of the cells. A threshold concentration value of ∼0.01 μM acetylcholine for TE671 cells was obtained in all cases.
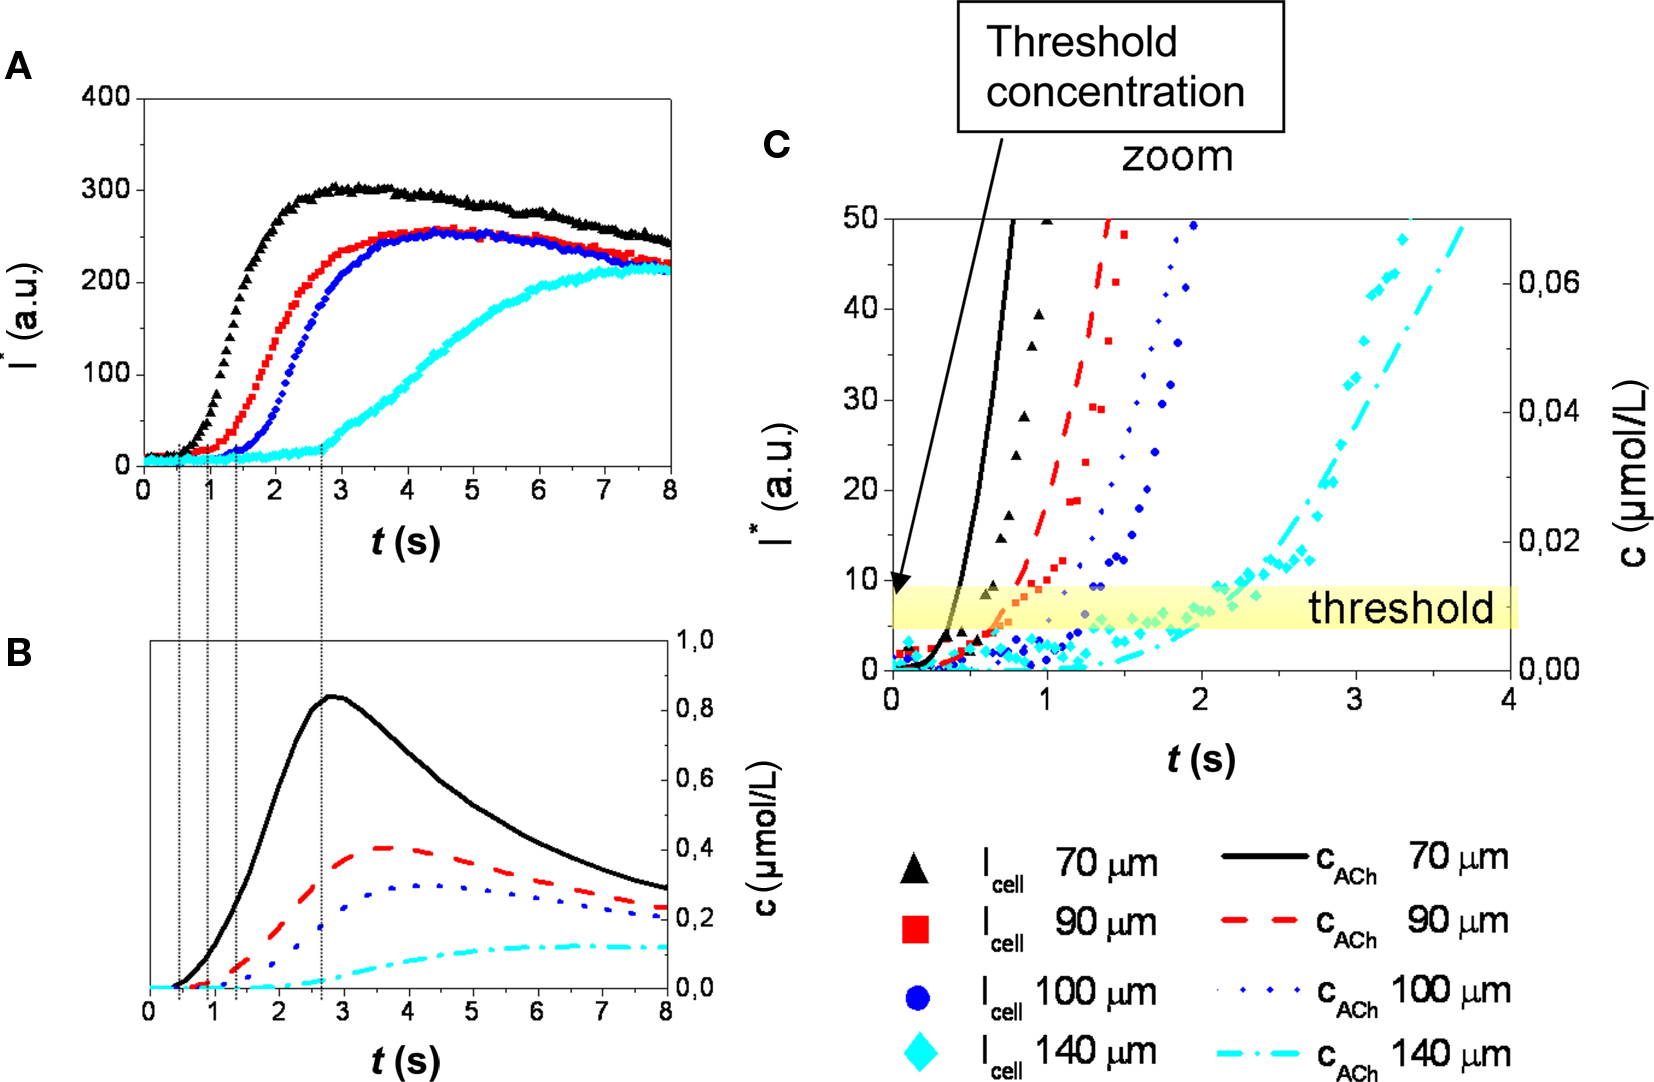
Figure 7. (A) Time course of stimulation related fluorescence intensity change (Ca2+-imaging) obtained from the ROI of cells located at distances between 70 and 140 μm from the center of the application spot (Figure 6). (B) Stimulant concentration as a function of time obtained from numerical simulation. The delay in the onset of the cellular response of cells at different distances is in agreement with the respective concentration functions. (C) A common threshold concentration of ∼0.01 μM can be retrieved from the combination of measurement and simulation (stimulant concentration: 100 μM acetylcholine, PD = 50 nm).
These experiments demonstrate how the stimulation threshold concentration may be determined from a single chemical stimulation experiment by evaluation of Ca2+ signals obtained from a number of cells located at different distances from the application spot.
The dose related response of TE671 cells upon stimulation with acetylcholine was determined from the slope of the excitation plots. Data obtained from multiple experiments (at least three independent experiments on each membrane with three different droplet concentrations from 0.01 to 1 mM) on membranes with different pore sizes were combined (Figure 8). For each data point, the threshold concentration and the peak concentration at the site of a particular cell were calculated employing c(r, t) as previously obtained from numerical simulation. The slope of the excitation curve was retrieved from the measurement of the fluorescence intensity of that cell. Even though considerable scatter of data points is observed, a sigmoidal response as a function of stimulus can be fitted to these data yielding an EC50 value of 27 ± 4 μM. So far, there are no independent literature reports available concerning threshold concentration and EC50 value for the muscarinic acetylcholine receptors (mAChR) of TE671 cells after stimulation by acetylcholine. However, mAChR have been investigated in different cell types, namely chick embryo cells (Oettling et al., 1985) and human melanoma cells (Noda et al., 1998). In these cell types somewhat lower EC50 values ranging from 3.4 to 4.3 μM acetylcholine were observed.
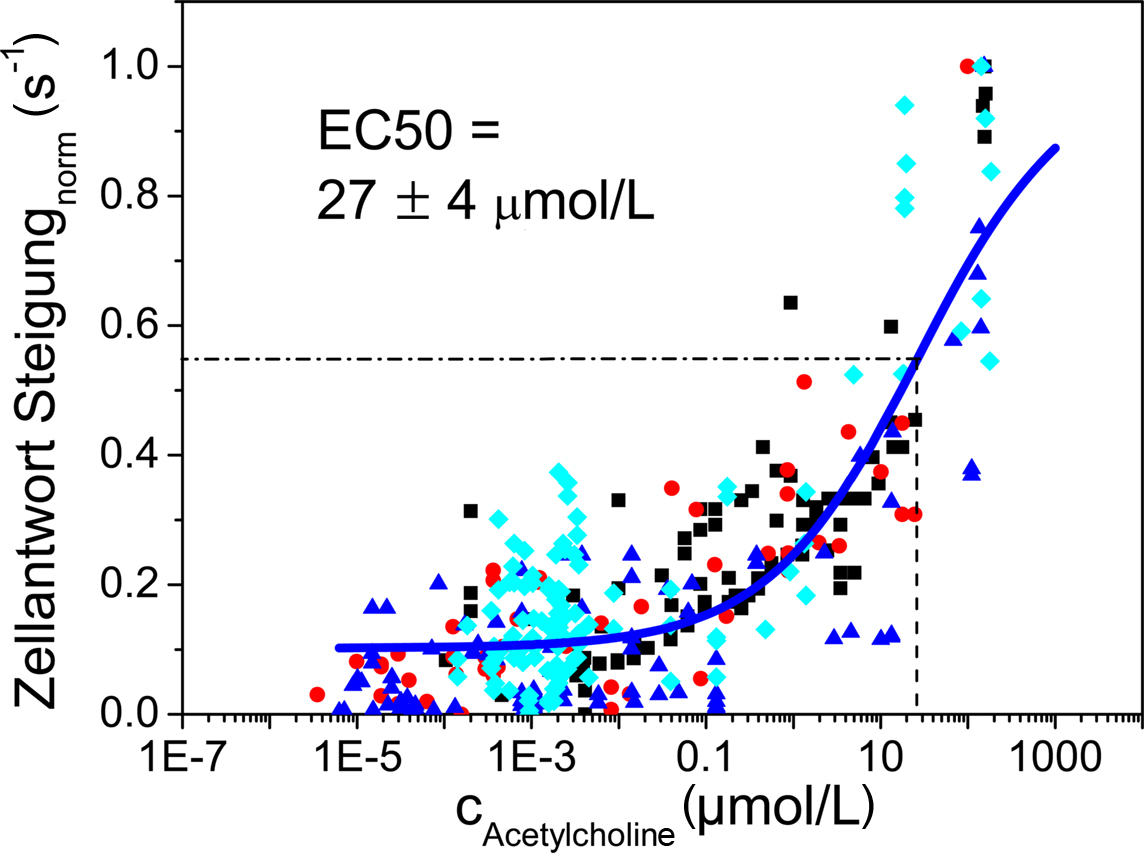
Figure 8. Dose–response curve obtained by fitting a sigmoidal curve to data obtained from stimulation of TE671 cells using an acetylcholine concentration ranging from 0. 01 to 1 mM. An EC50 value of 27 ± 4 μM was obtained.
We consider this result a first proof of principle for the measurement of dose–response curves employing this chemical stimulation setup. However, these data also show that while there are many data points at very low stimulant concentrations, there is somewhat a lack of data points at or even beyond saturation concentration. This is due to the fact that stimulant concentration decays approximately according to 1/r2 with increasing distance from the application spot. On the other hand, the number of cells experiencing a certain concentration, c(r, t), increases according to r2 with increasing distance assuming constant density of cells on the membrane. As a consequence relatively few cells that have been subjected to high concentration of the stimulant are recorded in any given experiment. In conclusion, in an optimized experimental protocol stimulant concentrations in excess of the saturation concentration have to be applied in order to determine saturation concentration.
Localized Functional Chemical Stimulation by Calcein
In addition to the transient stimulation of cells discussed above where threshold and peak concentration of the stimulant determine the response, there are cellular processes which rely on the accumulation of the stimulant so that cells respond according to the integral of the concentration c(r, t):

As a model system, cellular uptake of calcein-AM and its conversion to fluorescent calcein was studied. Calcein is retained in the cells, i.e., no outflux needs to be considered. In these experiments, we assumed that the uptake rate of calcein-AM (Zibek et al., 2007) would be proportional to the concentration at the surface of the cell. Fluorescence micrographs in Figure 9 show a typical stimulation result. Figure 10A displays the fluorescence intensity of individual cells measured as a function of time and distance with respect to the application spot. In Figure 10B, fluorescence intensity of individual cells measured at six different times after application of calcein is plotted as a function of distance from the application spot. The lines in these plots are guides for the eye, connecting fluorescence intensity values recorded at the time indicated. Since the function c(r, t) is available from the simulation (Figure 10D), the integral, i.e., the total stimulus, may be calculated for any given location on the membrane (Figure 10C). Figure 10C shows that saturation of the stimulus is almost reached within less than a minute. On the other hand, the onset of fluorescence is delayed with respect to the stimulation signal. This may be explained by the enzymatic conversion of calcein-AM to fluorescent calcein by unspecific esterases. Here, several acetoxymethyl groups have to be esterified. Also, the cell culture was kept at room temperature during the experiment probably slowing down cell metabolism. The detailed origin of this discrepancy between calculation and experimental observations is subject to further investigation.
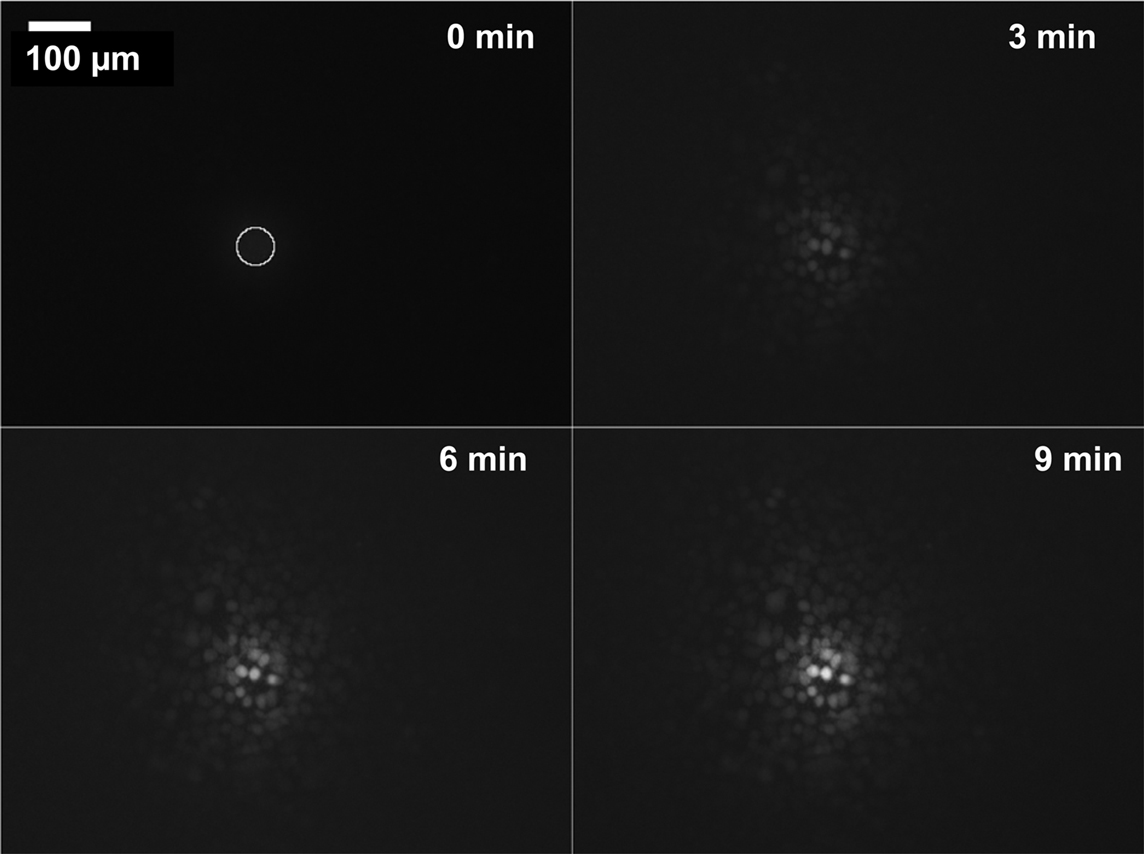
Figure 9. Accumulated dose–response: cell response after application of 20 droplets (400 pL) of calcein-AM to the bottom of the membrane PD = 820 nm. The first image at t = 0 s also displays the application spot (circle), subsequent images show increasing uptake and conversion of calcein-AM to fluorescent calcein over time. Brightness of cells decreases with distance to the application spot. Diameter of the stimulated region is >150 μm (see also Figure 10B). Application of only 10 droplets resulted in a response of cells only within the area wetted by the droplet (application spot A = 2826 μm2) (data not shown).
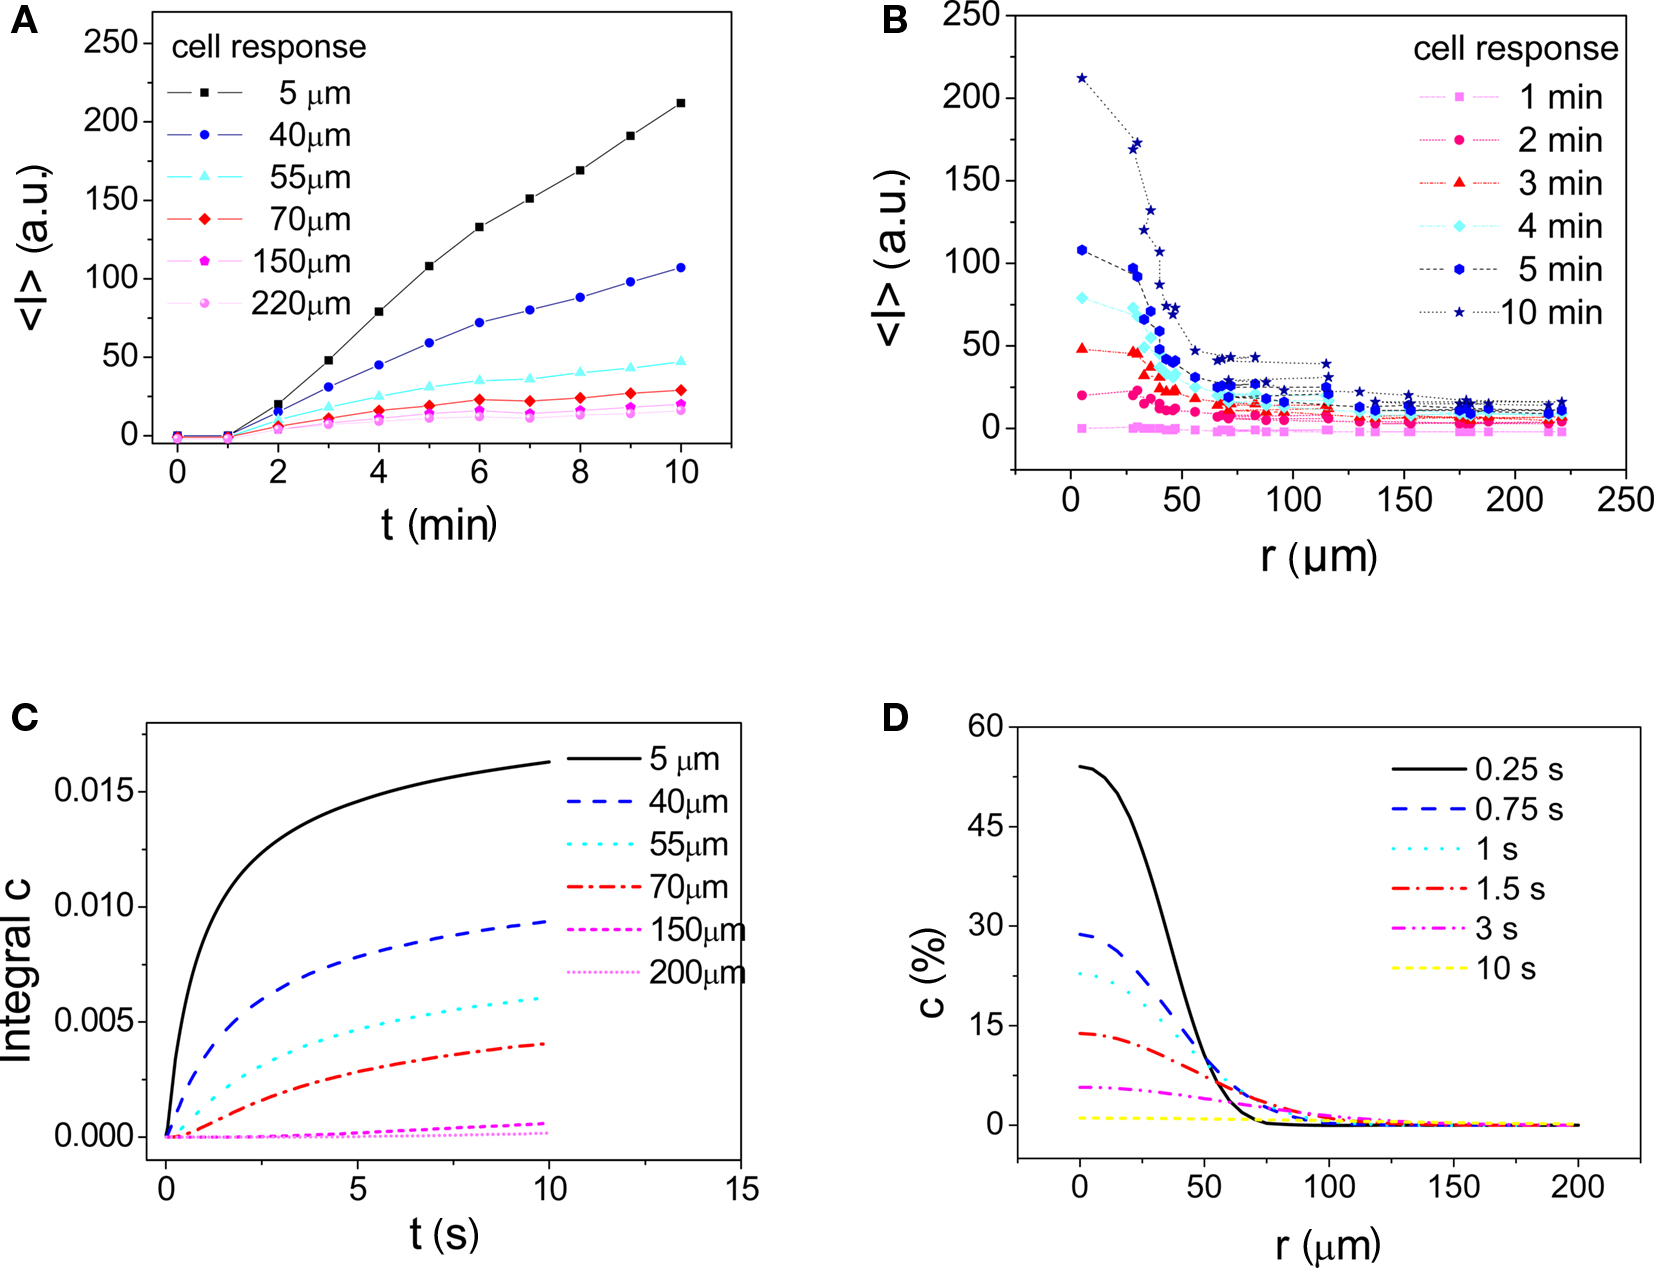
Figure 10. Experimental parameters as in Figure 9. (A) Fluorescence intensity I* as a function of time recorded in cells located at different distances from the application center. Peak brightness attained is higher for cells located closer to the application spot. (B) Fluorescence intensity distribution (i.e., response) as a function of distance from the application spot. For each cell I* is plotted at different times after stimulation. Lines are guides for the eye. (C) Integral of c(r, t) calculated from numerical modeling results indicating the total dose applied to cells at the given distance. (D) Relative concentration distribution calculated as fraction of maximum concentration achievable obtained from numerical modeling data.
Conclusion
In this study the feasibility for both threshold gated stimulation and accumulated dose–response by localized droplet application was demonstrated employing a novel concept for localized chemical stimulation of cells adhering on a porous membrane.
Numerical simulation of substance transport showed that the kinetics of the stimulus may be tailored to a particular application by variation of pore size. Small pore size provides for a longer, continuous stimulation whereas larger pore size produces transient stimuli with higher initial stimulation amplitude and faster decay. In addition, the concentration of the stimulant in the solution can be adjusted as well: chemical stimulation at a given flow yet with varying kinetic pattern becomes feasible. Limitations exist, however, for the following reasons: firstly, as the solubility of compounds will always be limited, the maximum flow achievable by delivery through small pores will never reach the flow rates accessible when using large pores. Secondly, upper pore size limit is dominated by surface tension considerations, as a pore diameter which is too large will result in leakage of medium through the membrane rendering the system useless.
The degree of lateral resolution of chemical stimulation that is achievable not only depends on the size of the application spot but also on the particular stimulation mechanism, the concentration of the stimulant and the threshold concentration. For instance, in case of acetylcholine the spatial resolution of the stimulation is determined by the distance from the application spot at which the stimulant concentration has decayed below the stimulation threshold of the cells.
Numerical models were established providing quantitative predictions of chemical stimuli. Dose–response curves were obtained for stimulation of TE671 cells with acetylcholine. The EC50 values were compared to the available literature data of EC50 values obtained from different cell types which were nevertheless of comparable magnitude.
For further validation of this chemical stimulation scheme experiments employing substances with well-known response characteristics are needed. There, it will be important to employ sufficiently high concentrations of the stimulant solution in order to obtain an adequate number of responses from cells close or beyond the saturation concentration.
Future research will also be directed toward the development and integration of gateable microapertures with low leakage in microsystems for possible application in neural prostheses.
Conflict of Interest Statement
The authors declare that the research was conducted in the absence of any commercial or financial relationships that could be construed as a potential conflict of interest.
Acknowledgments
Helpful discussions with Peter Koltay, Thorsten Göttsche, Timo Lindemann, and Roland Zengerle are acknowledged. The printheads were a generous gift of the Zengerle Group (IMTEK). Funding was in part provided by the Landesstiftung Baden-Württemberg through grant “Artificial Synapse.” Dietmar Gleinser and Susanne Faix helped in the development of software for printhead control and for the automated analysis of Ca2+ imaging results. Proof reading and editing of the manuscript by Johanna Stelzle is acknowledged.
References
Bencherif, M., and Lukas, R. J. (1991). Ligand binding and functional characterization of muscarinic acetylcholine receptors on the TE671/RD human cell line. J. Pharmacol. Exp. Ther. 257, 946–953.
Birdi, K. S., and Vu, D. T. (1993). Wettability and the evaporation rates of fluids from solid surfaces. J. Adhes. Sci. Technol. 7, 485–493.
Birdi, K. S., Vu, D. T., and Winter, A. (1989). A study of the evaporation rates of small water drops placed on a solid surface. J. Phys. Chem. 93, 3702–3703.
Birdno, M. J., and Grill, W. M. (2008). Mechanisms of deep brain stimulation in movement disorders as revealed by changes in stimulus frequency. Neurotherapeutics 5, 14–25.
Bohl, W., and Elmendorf, W. (2008). Technische Strömungslehre: Stoffeigenschaften von Flüssigkeiten und Gasen, Hydrostatik, Aerostatik, Inkompressible Strömungen, Kompressible Strömungen, Strömungsmesstechnik: Vogel.
Chow, A. Y., Chow, V. Y., Packo, K. H., Pollack, J.S., Peyman, G. A., and Schuchard, R. (2004). The artificial silicon retina microchip for the treatment of vision loss from retinitis pigmentosa. Arch. Ophthalmol. 122, 460–469.
Echauz, J., Georgoulas, G., Smart, O., Gardner, A., Firpi, H., Lift, B., and Vachtsevanos, G. (2007). “Monitoring, Signal Analysis, and Control of Epileptic Seizures: A Paradigm in Brain Research,” in Control and Automation, MED ‘07. Mediterranean Conference on Athens, Greece, 2007.
Edahiro, S., Yoshikawa, H., Iwasa, K., Hashii, M., and Yamada, M. (2004). Cytosolic Ca2+ alteration mediates both ryanodine receptor and IP3 receptor in TE671/RD Cells. Biomed. Res. 25, 255–261.
Fitch, R. W., Xiao, Y., Kellar, K. J., and Daly, J. W. (2003). Membrane potential fluorescence: a rapid and highly sensitive assay for nicotinic receptor channel function. Proc. Natl. Acad. Sci. U.S.A. 100, 4909–4914.
Fryer, J. D., and Lukas, R. J. (1999). Noncompetitive functional inhibition at diverse, human nicotinic acetylcholine receptor subtypes by bupropion, phencyclidine, and ibogaine. J. Pharmacol. Exp. Ther. 288, 88–92.
Gani, M., Valentini, G., Sigrist, A., Kós, M., and Boëx, C. (2007). Implications of deep electrode insertion on cochlear implant fitting. JARO: J. Assoc. Res. Otolaryngol. 8, 69–83.
Giovannardi, S., Cesare, P., and Peres, A. (1994). Rapid synchrony of nuclear and cytosolic Ca2+ signals activated by muscarinic stimulation in the human tumor line TE671/RD. Cell Calcium 16, 491–499.
Grassi, F., Giovannelli, A., Fucile, S., Mattei, E., and Eusebi, F. (1993). Cholinergic responses in cloned human TE671/RD tumor cells. Pflügers Arch. 425, 117–125.
Gregoratos, G. (2005). Indications and recommendations for pacemaker therapy. Am. Fam. Physician 71, 1563–1570.
Guena, G., Poulard, C., and Cazabat, A. M. (2007). The leading edge of evaporating droplets. J. Colloid Interface Sci. 312, 164–171.
Hodaie, M., Wennberg, R. A., Dostrovsky, J. O., and Lozano, A. M. (2002). Chronic anterior thalamus stimulation for intractable epilepsy. Epilepsia 43, 603–608.
Hu, Lindemann, Göttsche, Kohnle, Zengerle, and Koltay. (2007). Discrete chemical release from a microfluidic chip. J. Microelectromech. Syst. (JMEMS) 16, 786–794.
Humayun, M., Propst, R., de Juan, Jr. E., McCormick, K., and Hickingbotham, D. (1994). Bipolar surface electrical stimulation of the vertebrate retina. Arch. Ophthalmol. 112, 110–116.
Humayun, M. S., de Juan, Jr. E., Dagnelie, G., Greenberg, R. J., Probps, R. H., and Phillips, D. H. (1996). Visual perception elicited by electrical stimulation of retina in blind humans. Arch. Ophthalmol. 114, 40–46.
Humayun, M. S., de Juan, Jr. E., Weiland, J. D., Dagnelie, G., Katona, S., Greenberg, R. J., and Suzuki, S. (1999). Pattern electrical stimulation of the human retina. Vision Res. 39, 2569–2576.
Kolb, H. (1994). The architecture of functional neural circuits in the vertebrate retina. Invest. Ophthalmol. Vis. Sci. 35, 2385–2402.
Korn, K., and Krausz, E. (2007). Cell-based high-content screening of small-molecule libraries. Curr.Opin.Chem.Biol. 11, 503–510.
Noda, S., Lammerding-Köppel, M., Oettling, G., and Drews, U. (1998). Characterization of muscarinic receptors in the human melanoma cell line SK-Mel-28 via calcium mobilization. Cancer Lett. 133, 107–114.
Noolandi, J., Peterman, M. C., Huie, P., Lee, C., Blumenkranz, M. S., and Fishman, H. A. (2003). Toward a Neurotransmitter-Based Retinal Prosthesis Using an Inkjet Print-head. Biomed. Microdevices 5, 195–199.
Oettling, G., Schmidt, H., and Drews, U. (1985). The muscarinic receptor of chick embryo cells: correlation between ligand binding and calcium mobilization. J. Cell Biol. 100, 1073–1081.
Peterman, M. C., Bloom, D. M., Lee, C., Bent, S. F., Marmor, M. F., Blumenkranz, M. S., and Fishman, H. A. (2003a). Localized neurotransmitter release for use in a prototype retinal interface. Invest. Ophthalmol. Vis. Sci. 44, 3144–3149.
Peterman, M. C., Mehenti, N. Z., Bilbao, K. V., Lee, C. J., Leng, T., Noolandi, J., Bent, S. F., Blumenkranz, M. S., and Fishman, H. A. (2003b). The artificial synapse chip: a flexible retinal interface based on directed retinal cell growth and neurotransmitter stimulation. Artif. Organs 27, 975–985.
Peterman, M. C., Noolandi, J., Blumenkranz, M. S., and Fishman, H. A. (2004a). Fluid flow past an aperture in a microfluidic channel. Anal. Chem. 76, 1850–1856.
Peterman, M. C., Noolandi, J., Blumenkranz, M. S., and Fishman, H.A. (2004b). Localized chemical release from an artificial synapse chip. Proc. Natl. Acad. Sci. U.S.A. 101, 9951–9954.
Rebscher, S. J., Hetherington, A. M., Snyder, R. L., Leake, P. A. and Bonham, B. H. (2007). Design and fabrication of multichannel cochlear implants for animal research. J. Neurosci. Methods 166, 1–12.
Rebscher, S. J., Hetherington, A., Bonham, B., Wardrop, P., Whinney, D., and Leake, P. A. (2008). Considerations for the design of future cochlear implant electrode arrays: Electrode array stiffness, size and depth of insertion. J. Rehabil. Res. Dev. 45, 731–748.
Reitstetter, R., Lukas, R. J., and Gruener, R. (1999). Dependence of nicotinic acetylcholine receptor recovery from desensitization on the duration of agonist exposure. J. Pharmacol. Exp. Ther. 289, 656–660.
Rowan, S. M., Newton, M. I., and McHale, G. (1995). Evaporation of microdroplets and the wetting of solid surfaces. J. Phys. Chem. 99, 13268–13271.
Siddiqi, M. A., and Lucas, K. (1986). Correlations for prediction of diffusion in liquids. Can. J. Chem. Eng. 64, 839–843.
Stett, A., Barth, W., Weiss, S., Haemmerle, H., and Zrenner, E. (2000). Electrical multisite stimulation of the isolated chicken retina. Vision Res. 40, 1785–1795.
Tan, S.-X., Zhang, X-y, Zhao, N., and Jian, X. (2007). Simulation of sessile water-droplet evaporation on superhydrophobic polymer surfaces. Chin. J. Chem. Phys. 20, 140–144.
Toogood, G. (2007). The Royal Australian College of General Practitioners, RACGP. Pacemaker Therapies in Cardiology. Aust. Fam. Physician 36, 518–519, 521–524.
Vitek, J. L. (2008). Deep brain stimulation: how does it work? Cleve. Clin. J. Med. 75(Suppl. 2), S59–S65.
Zibek, S., Stett, A., Koltay, P., Hu, M., Zengerle, R., Nisch, W., and Stelzle, M. (2007). Localized functional chemical stimulation of TE 671 cells cultured on nanoporous membrane by calcein and acetylcholine. Biophys. J. 92(1), L04–L06-L04–L06.
Zrenner, E., Gekeler, F., Gabel, V., Graf, H., Graf, M., Guenther, E., Haemmerle, H., Hoefflinger, B., Kobuch, K., Kohler, K., Nisch, W., Sachs, H., Schloßhauer, B., Schubert, M., Schwahn, H., Stelzle, M., Stett, A., Troeger, B., and Weiss, S. (2001). Subretinales Mikrophotodioden-Array als Ersatz für degenerierte Photorezeptoren? Der Ophthalmologe 98, 357–363.
Keywords: chemical stimulation, neurotechnology, microfluidic system, nanoporous membrane, acetylcholine, calcium imaging, numeric modeling
Citation: Zibek S, Hagmeyer B, Stett A and Stelzle M (2010) Chemical stimulation of adherent cells by localized application of acetylcholine from a microfluidic system. Front. Neuroeng. 3:113. doi: 10.3389/fneng.2010.00113
Received: 03 March 2010;
Accepted: 18 October 2010;
Published online: 26 November 2010.
Edited by:
Ulrich G. Hofmann, University of Lübeck, GermanyReviewed by:
Ulrich G. Hofmann, University of Lübeck, GermanyMichelle Kuykendal, Georgia Institute of Technology, USA
Copyright: © 2010 Zibek, Hagmeyer, Stett and Stelzle. This is an open-access article subject to an exclusive license agreement between the authors and the Frontiers Research Foundation, which permits unrestricted use, distribution, and reproduction in any medium, provided the original authors and source are credited.
*Correspondence: Martin Stelzle, Natural and Medical Sciences Institute at the University of Tübingen, Markwiesenstrasse 55, D-72770 Reutlingen, Germany. e-mail:c3RlbHpsZUBubWkuZGU=