 Liangqing Sun1,2Lanjie Zhao1Hui Huang1
 Yuexin Zhang
1Junjuan Wang1
Yuexin Zhang
1Junjuan Wang1
 Xuke Lu
1Shuai Wang1
Xuke Lu
1Shuai Wang1
 Delong Wang
1Xiugui Chen1Chao Chen1Lixue Guo1Nan Xu1Hong Zhang1Jing Wang1Cun Rui1Mingge Han1Yapeng Fan1Taili Nie2*
Delong Wang
1Xiugui Chen1Chao Chen1Lixue Guo1Nan Xu1Hong Zhang1Jing Wang1Cun Rui1Mingge Han1Yapeng Fan1Taili Nie2*
 Wuwei Ye
1*
Wuwei Ye
1*- 1 Institute of Cotton Research of Chinese Academy of Agricultural Sciences/Zhengzhou Research Base, State Key Laboratory of Cotton Biology, School of Agricultural Sciences, Zhengzhou University, Anyang, China
- 2 Cotton Research Institute of Jiangxi Province, Jiujiang, China
Glycosyltransferases mainly catalyse the glycosylation reaction in living organisms and widely exists in plants. UGTs have been identified from G. raimondii, G. arboreum and G. hirsutum. However, Genome-wide systematic analysis of UGTs superfamily have not been studied in G. barbadense. 752 UGTs were identified from four cotton species and grouped into 18 clades, of which R was newly discovered clades. Most UGTs were clustered at both ends of the chromosome and showed a heterogeneous distribution. UGT proteins were widely distributed in cells, with the highest distribution in chloroplasts. UGTs of the same clade shared similar intron/exon structural features. During evolution, the gene family has undergone strong selection for purification. UGTs were significantly enriched in “transcriptional activity (GO:0016758)” and “metabolic processes (GO:0008152)”. Genes from the same clade differed in function under various abiotic stresses. The analysis of cis-acting element and qRT–PCR may indicate that GHUGTs play important roles in plant growth, development and abiotic stress. We further found that GHUGT74-2 plays an important role under submergence. The study broadens the understanding of UGTs in terms of gene characteristics, evolutionary processes, and gene function in cotton and provides a new way to systematically and globally understand the structure–function relationship of multigene families in the evolutionary process.
Introduction
Glycosyltransferases (GTs) mainly catalyse the glycosylation reaction in living organisms, and transfers the sugar group from the activated donor molecule to the acceptor molecule, thereby forming a variety of glycoside compounds (Vogt and Jones, 2000). Glycosyltransferases are a highly differentiated family of superenzymes. According to the similarity of glycosyltransferase sequences, the specificity of the catalytic substrate and the stereochemical structure of the catalytic product, the online website CAZy (http://www.cazy.org) has divided GTs into 114 families (GT1∼GT114) by the end of 2021 (Campbell et al., 1997; Coutinho et al., 2003). Uridine diphosphate-glucose is the most common plant glycosyl donor, and plant glycosyltransferases are also known as UGTs (Hughes and Hughes, 1994; Ross et al., 2001). The glycosyl acceptor substrates of glycosyl-transferases in plant are diverse, including not only monosaccharides, oligosaccharides, and polysaccharides but also various noncarbohydrates, such as proteins, antibiotics, and lipids (Keegstra and Raikhel, 2001; Ross et al., 2001; Bowles et al., 2005; Wilson and Tian, 2019). Glycosylation directly affects biological activity and stability of compounds (Li et al., 2001; Lepak et al., 2015).
UGT family genes have a conserved sequence of 44 amino acids in the C-terminal region, known as the plant secondary product glycosyltransferase (PSPG) motif (Ross et al., 2001; Yonekura-Sakakibara and Hanada, 2011). Genome-wide analysis has identified numerous UGT family members in multiple species, including 107 in Arabidopsis (Ross et al., 2001), 147 in Zea mays (Li et al., 2014), 96 in Cicer arietinum (Sharma et al., 2014), 137 in Linum usitatissimum (Barvkar et al., 2012), 130 in Prunus mume (Zhang et al., 2018), 179 in Triticum aestivum (He et al., 2018), and 121 in Manihot esculenta (Wu et al., 2021). The Arabidopsis UGT gene family is divided into 14 distinct clades (A-N) (Li et al., 2001; Ross et al., 2001). The O clade and P clade were found in Triticum aestivum, Zea mays, etc., (Li et al., 2014; He et al., 2018). The O clade is primarily responsible for the glycosylation of plant hormones (Caputi et al., 2012). The group Q of UGTs was lost in Poales and Brassicales (Wilson and Tian, 2019). With the mining of new UGTs, the evolutionary classification of UGT gene families is constantly being improved. The gene and function of the UGTs superfamily in 65 species have been studied by Alexander E. (Wilson and Tian, 2019).
UGTs play important roles in response to plant growth and development, secondary metabolism and stress (Jones and Vogt, 2001; Bowles et al., 2005). The first glycosyltransferase gene discovered in plants was flavonoid glucosyltransferase (UFGT) (Dooner and Nelson, 1977). Plant UGTs can modify plant endogenous hormones by glycosylation, affecting the content and activity of plant endogenous hormones and thereby regulating plant growth and development. Glycosyltransferases related to auxin (UGT75D1, UGT84B1, UGT74D1) (Zhang et al., 2016; Aoi et al., 2020; Mateo-Bonmatí et al., 2021), abscisic acid (UGT71B6) (Priest et al., 2006), and brassinolide (UGT73C5) (Poppenberger et al., 2005) have been identified in plants. Some glycosyltransferases related to stress were identified by gene silencing or overexpression of UGT in plants, such as those related to salt stress (UGT85A5) (Sun et al., 2013), cold stress resistance (UGT80B1) (Mishra et al., 2015) and drought stress (UGT87A2) (Li et al., 2017).
Cotton is an important model crop for studying the evolution of plant polyploidy and supergene family. A total of 142, 146 and 196 UGTs have been identified from G. raimondii, G. arboreum and G. hirsutum, respectively (Huang et al., 2015). However, there have been no studies on the genome-wide analysis of UGTs from G. barbadense or reports on the structure–evolutionary function of the cotton UGT gene family. Based on newly released cotton genome data, we identified members of the UGT gene family from four cotton species. Bioinformatic methods were used to comprehensively analyse the physicochemical properties, gene structure, chromosome distribution, phylogeny, gene duplication, collinearity/syntaxy and expression profiles of UGTs under different tissues and stresses in cotton. In conclusion, the study of the UGTs superfamily provides new insights into the systematic and global understanding of the structure–function relationship of multigene families during evolution.
Results
Identification of UGT family members
The hidden Markov model (HMM) file of PF00201.20 was used as a query tool to search for UGTs in G. hirsutum, G. arboreum, G. raimondii, G. barbadense and A. thaliana with an e value of 1e-5. We identified 818 UGTs from five different plant species, of which 752 UGTs were evaluated from four cotton species. 226, 228, 146, and 152 UGTs were identified from G. hirsutum, G. barbadense, G. arboreum and G. raimondii, respectively (Figure 1). We renamed the UGTs of five plant species (Supplementary Table S1). We further analysed the UGT gene of four cotton species, including gene location, gene length, transcript length, length and GC content of CDS, mean exons/intron length, protein length, molecular weight (MW), charge, and isoelectric points (pI) (Supplementary Table S2). Taking the most widely used polyploid model plant, G. hirsutum, as an example, we analysed its biophysical properties. All 226 UGTs encoded proteins varying from 341 (GHUGT71-12) to 963 (GHUGT71-10) amino acids. The pI varied from 4.804 (GHUGT74-10) to 8.296 (GHUGT89-11) with a mean of 6.283, and the MWs ranged from 38.149 kDa (GHUGT83-10) to 108.765 kDa (GHUGT71-10). A total of 78.89% of the 226 GHUGT proteins were hydrophobic, while 26.11% were hydrophilic. Other information on gene location, gene length, transcript length, length and GC content of CDS, exon number, mean exons/intron length and charge of every GHUGT is given in Supplementary Table S2. The prediction of subcellular localization indicates that there are 439 UGT proteins located in the chloroplast, 160 in the cytoplasm, 56 in the nucleus, 39 in the extracellular matrix, 17 in the peroxisome, 14 in the endoplasmic reticulum, 11 in the vacuole, 10 in the cytoskeleton, five in the plasma membrane and one in the mitochondria (Figure 1B). We took GHUGT74-2 proteins as an example and found that GHUGT74-2 proteins were located in the nucleus (Figure 1C).
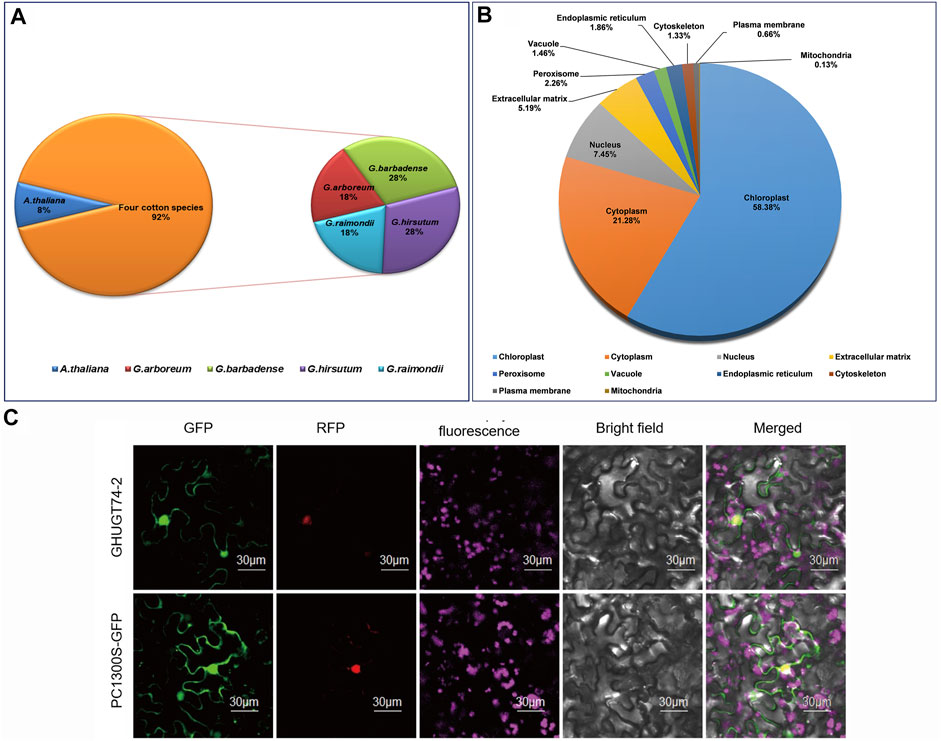
FIGURE 1. (A) Distribution of 818 UGTs from five plant species. (B) Subcellular localization of 752 UGT proteins from four cotton species. (C) Subcellular localization of GHUGT74-2 proteins carried out in tobacco leaves.
Phylogenetic analysis of UGTs
To study the evolutionary history of UGTs in cotton, we constructed an unrooted phylogenetic tree by Maximum Likelihood (ML) method (Figure 2). We constructed a GHUGTs phylogenetic tree of G. hirsutum based on the taxonomic relationship of the A. thaliana UGT protein family (Wilson and Tian, 2019). A total of 226 GHUGTs were classified into 18 clades, and Clade E had the highest proportion (41 GHUGTs). The distribution of other UGTs among different clades was as follows: D (29), A (27), L (27), H (15), B (14), G (14), F (12), I (11), P (9), OG (6), J (5), M (4), R (4), C (2), K (2), N (2), O (2) and Q (0) (Figure 2C). Similarly, we built another unrooted tree of 752 UGT proteins from Gossypium with a similar method (Figure 2B). A total of 752 UGTs were classified into 18 clades according to the criterion proposed by Alexander E. (Wilson and Tian, 2019), which were unevenly distributed (Figure 2B). The UGTs of these four species were present in almost every clade. Among them, Clade E contained the most UGT members, and Clade N had the fewest members. The number of UGT members in Clades E and N was distributed as 137 and 5, accounting for 18.21% and 0.66% of the number of UGTs, respectively. Clade Q was lost. The distribution of other UGT members among different clades was as follows: D (105), L (93), A (87), H (44), G (42), B (42), P (39), I (39), F (35), OG (18), J (18), M (15), R (15), O (6), K (6), and C (6) (Figure 2C, Supplementary Table S5). Clade E contained the most members among the five plants, suggesting that it may be an ancient clade. Interestingly, UGTs in the four species had corresponding homologous genes in almost every clade, indicating that UGTs of these species are closely related to each other. The ratio of UGTs in allotetraploid G. hirsutum and G. barbadense was close to 1:1, and the ratio of UGTs in diploid G. raimondii and G. arboreum was also close to 1:1. The ratio of UGTs in allotetraploid cotton and diploid cotton was less than 2:1, which may be the result of evolutionary selection in the process of hybridizing two diploid cotton plants to form allotetraploid cotton.
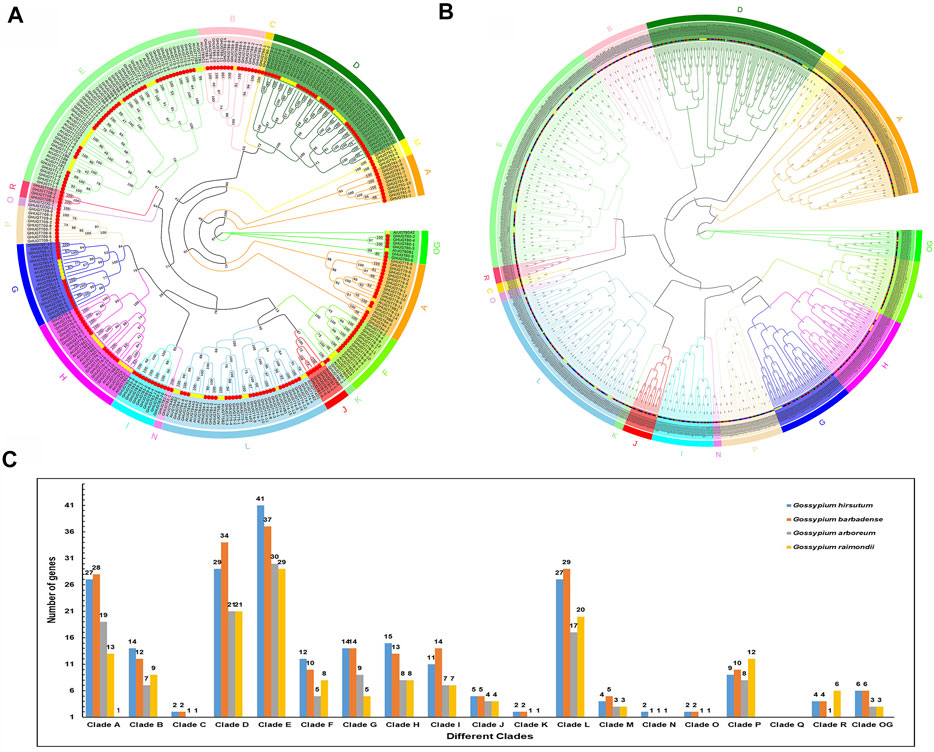
FIGURE 2. UGT gene family phylogenetic tree in five plant species. (A) Phylogenetic tree of 292 UGTs from A. thaliana and G. hirsutum. (B) Phylogenetic relationship of 752 identified UGTs from four cotton species. (C) Distribution of UGTs into their different clades from five plant species.
Chromosomal localization of UGTs
To understand the physical location of UGTs on chromosomes, chromosome maps of 752 UGTs were constructed in four cotton species (Figure 3). A total of 745 of the 752 UGTs were located to specific chromosomes, the other seven UGTs were assigned to unmapped scaffolds, indicating a higher evolutionary maturity of the UGT family (Figure 3, Supplementary Table S6). Most UGTs were distributed on both ends of chromosomes. In addition, the number of genes in the heterologous tetraploid cotton (G. hirsutum and G. barbadense) At/Dt subgenome was less than the number of genes in the diploid cotton A/D genome (Supplementary Figure S1, Supplementary Table S6), indicating that the UGT family may have been lost during evolution. Two genes were clustered together to form a gene pair, forming a total of 146 gene pairs, including 40 in G. hirsutum, 31 in G. barbadense, 41 in G. arboreum, and 34 in G. raimondii (Figure 3). This indicated that gene duplication occurred during the evolution of the UGT family.
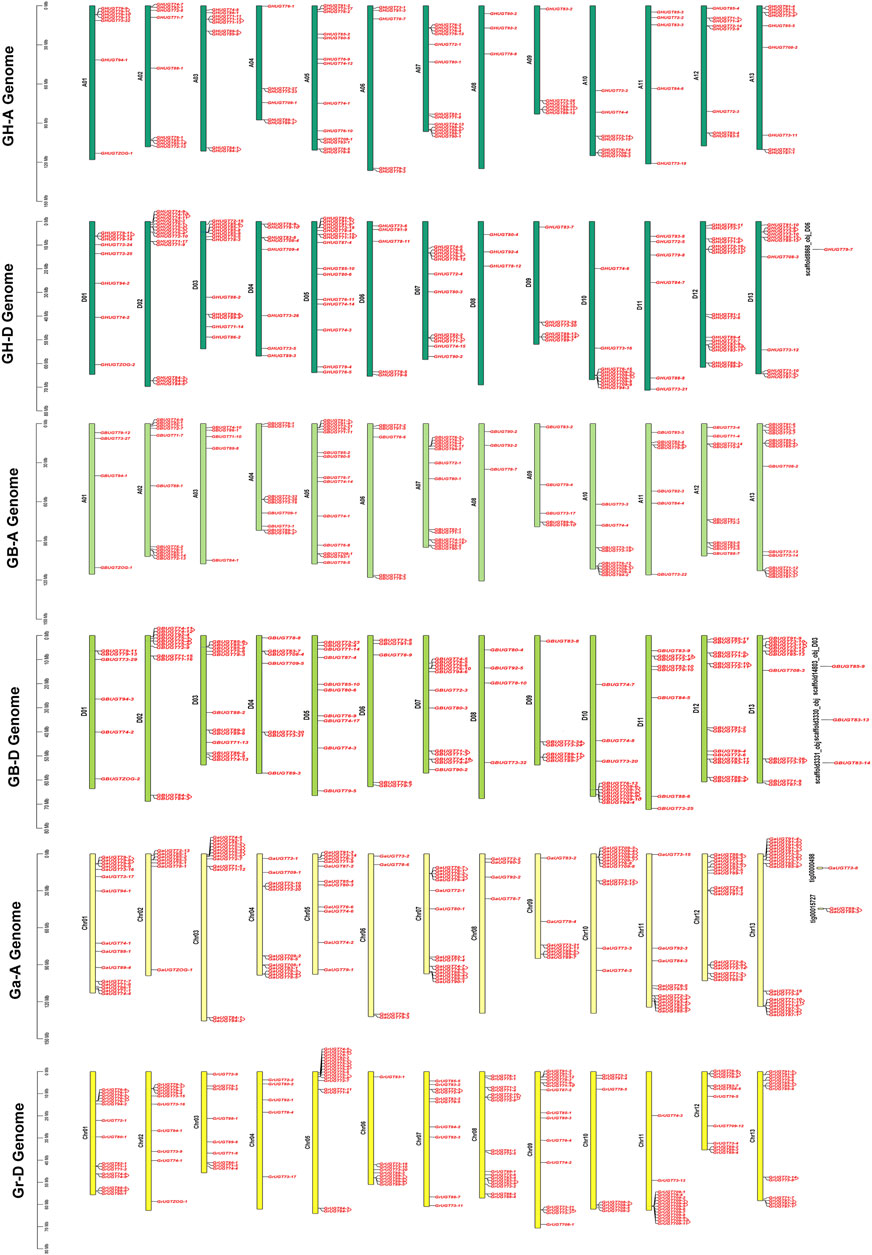
FIGURE 3. Location of UGTs in four cotton species. Gene pairs have been annotated on the chromosome with gene ID. The vertical bars represent the location of UGTs and the length of chromosomes.
Among 226 UGTs identified in G. hirsutum, 100 members were located on 13 chromosomes on the At subgenome (GHAt), 125 UGTs were distributed on 13 chromosomes on the Dt subgenome (GHDt), and one UGT was on a scaffold (Figure 3). For subgenome GHAt, GHAt-05 and GHAt-07 had the most UGT members (13), while GHAt-06 and GHAt-11 had the least number of genes (5). For the subgenome GHDt, GHDt-12 had the largest number of UGT members (16), while GHDt-08 had the smallest number of UGT members (3) (Supplementary Figure S1A, Supplementary Table S6). Similarly, 225 out of 228 UGTs from G. barbadense were mapped on their 26 chromosomes, and the remaining three UGTs were on scaffolds. The subgenome (GBAt) contained 109 genes, and the Dt subgenome (GBDt) contained 116 UGTs (Figure 3). For the GBAt subgenome, GBAt-05 and GBAt-13 had the most UGT members (14), while GBAt-08 had the least number of genes (3). For the GBDt subgenome, GBDt-12 had the largest number of UGT members (14), while GBDt-08 had the smallest number of UGT members (3) (B, Supplementary Table S6). In G. arboreum, 143 genes were mapped to chromosomes, and three UGTs were not annotated to chromosomes (Figure 3). Chr13 (A13), Chr12 (A12) and Chr07 (A07) had more UGTs on chromosomes 18, 16, and 15, respectively. Chr06 (A06) and Chr08 (A08) had the least number of eight chromosomes (Supplementary Figure S1C, Supplementary Table S6). For G. raimondii, all 152 UGTs were distributed on 13 chromosomes (Figure 3). Chr08 (D08), Chr01 (D01) and Chr05 (D05) chromosomes had relatively more UGTs, 17, 16 and 16, respectively (Supplementary Figure S1D, Supplementary Table S6). In conclusion, the UGTs from the four cotton species were heterogeneously distributed on their chromosomes, with more genes located on the D genome/subgenome than on the A genome/subgenome.
Sequence logos analysis of UGT proteins
To study the evolutionary conservation of UGT genes in cotton, we constructed conserved amino acid sequence logos (Figure 4). We found a highly conserved sequence PSPG box consisting of 44 amino acid residues at the C-terminus of UGT sequences from five plant species (Mackenzie et al., 1997; Mackenzie et al., 2005) (Figure 4). Compared with consensus sequences, sequence logos describe sequence similarity more abundantly and more precisely and quickly reveal important features of sequence alignments (Crooks et al., 2004). Our results may indicate that the domain sequence of UGT is highly conserved in the five plant species.
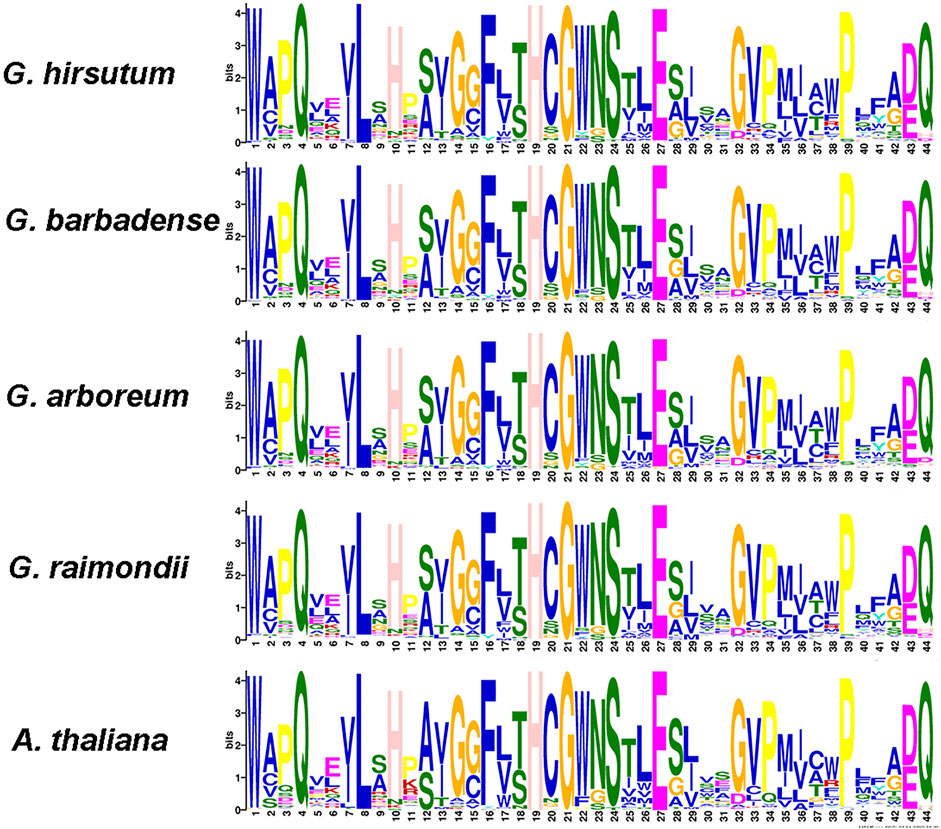
FIGURE 4. Consensus sequence logos of the PSPG-box in five plant species.
Conserved motif and exon–intron structure analysis in G. hirsutum
Genes are composed of coding regions and noncoding regions. The structure and arrangement of introns and exons can be used to analyse the evolutionary relationship between members of different gene families. Previous studies have shown that the gene exon–intron structural features are related to their biological functions (Malik et al., 2020). In the GHUGT gene family, the gene sequence of the longest gene (GHUGT85-6) is approximately 93336 bp, while the shortest gene (GHUGT71-12) is only 1,026 bp. To further explore the possible structural evolutionary history of the GHUGT family, the phylogenetic and gene structure map of G. hirsutum were constructed (Figures 5A,C). Our results demonstrated that the distribution number of exon regions in GHUGTs varied from 1 to 15, while GHUGTs of the same clade had similar intron/exon structural features in terms of exon number and length (Figures 5A,C). Among the 226 GHUGTs, approximately 55.54% (121) had no introns, approximately 39.94% (88) had only one intron, and only 7.52% (17) had two or more introns (Figure 5C). The characteristics of fewer introns in GHUGT gene family members may indicate that this gene family was highly conserved. Overall, we found that GHUGTs had a strong evolutionary relationship between gene features and phylogeny, and displayed a conserved pattern of gene structure.
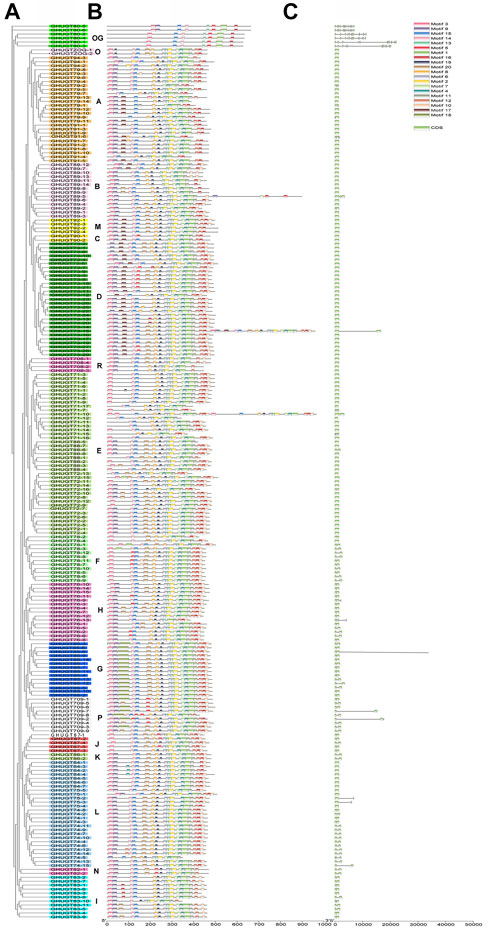
FIGURE 5. Phylogenetic tree, motifs and exon/intron structures of GHUGTs in G. hirsutum. (A) Phylogenetic tree of GHUGTs. (B) Conserved motifs of GHUGT proteins. (C) Exon/intron structures of GHUGTs.
To further demonstrate the evolutionary relationships of GHUGT gene family members, we constructed a phylogenetic tree (Figure 5A) and motif distribution (Figure 5B) of all 226 GHUGT proteins. Our results showed that each GHUGT protein had various conserved motifs ranging from 7 to 35. GHUGT proteins with the same motif distribution pattern distributed in the same clade and clustered next to each other. Different clades had unique distribution patterns of conserved motifs. For example, Clade OG all had Motif 3, 15, 14, 13, 16, 1, and 5. Motif one was contained in all 18 evolutionary clades. The C-terminal protein sequence of GHUGT was more conserved than the N-terminal sequence. Overall, we found that the GHUGT gene family also had a strong evolutionary conserved pattern between gene structure and protein motif distribution.
Duplication and collinearity relationship of UGTs
To understand the evolutionary relationship of GHUGTs from the diploid ancestral G. arboreum (A genome) and G. raimondii (D genome) and allotetraploid G. hirsutum and G. barbadense (AD genome), we constructed syntenic and collinear relationship maps of gene duplication pairs from four cotton species (Figures 7, 8). In this study, we obtained a total of 2,203 duplicated gene pairs, including 276 segmental duplications and 146 tandem duplications, in 752 UGTs from four cotton species (Figure 6, Supplementary Table S10). The remaining 1781 orthologous gene pairs underwent whole genome duplication (WGD), resulting in a large-scale expansion of the UGT gene family in cotton. Similar to previous findings, we also found that GHAt/GHDt and GBAt/GBDt had their orthologous UGTs in the A and D genomes. We identified a total of 896 orthologous/paralogous gene pairs, of which 295 were predicted to be segmental duplications that form paralogous gene pairs within the GHAt/GHDt and GBAt/GBDt subgenomes. Only 71 duplication gene pairs underwent tandem duplication, while all 530 duplication gene pairs underwent WGD. Polyploidy, segmental duplication and tandem duplication were the main factors for the large-scale expansion of the UGT gene family.
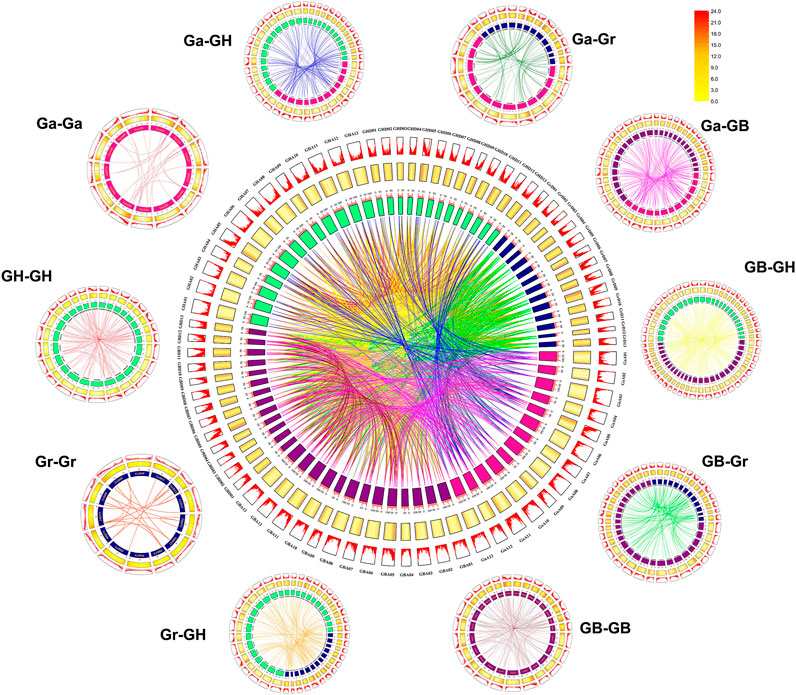
FIGURE 6. Syntenic relationship of UGT duplicated gene pairs in cotton. Chromosomal lines represented by different colours indicate various inter genome and intra genomic syntenic regions. The line map and heatmap of the outer rings represent the density of genes on chromosomes. G. hirsutum At subgenome “GHA”, G. hirsutum Dt subgenome “GHD”, G. barbadense At subgenome “GBA”, G. barbadense Dt subgenome “GBD”, G. arboreum A-genome “GaA”, and G. raimondii D-subgenome “GrD”.
In addition, homology analysis of UGTs from four cotton species showed the collinearity of the different genomes with each other. Chromosomes A-05, A-11, A-12, and A-13 contributed the most collinear genes from the A genome (G. arboreum) to the AD genome (G. hirsutum and G. barbadense). However, D-01, D-02, D-03, D-12, and D-13 from the D genome (G. raimondii) contained a higher number of collinear genes with the AD genome (G. hirsutum and G. barbadense). The A genome (G. arboreum) had 211 and 289 duplication gene pairs with G. hirsutum and G. barbadense, respectively. Similarly, the diploid D-genome was found to contain 311 and 310 duplicate gene pairs for each tetraploid species (G. hirsutum and G. barbadense) (Figure 7, Supplementary Table S10). Overall, we obtained 2,203 duplicated gene pairs among 752 UGTs in four cotton species, which laid the foundation for the polyploidy and large-scale expansion of the UGT gene family during evolution.
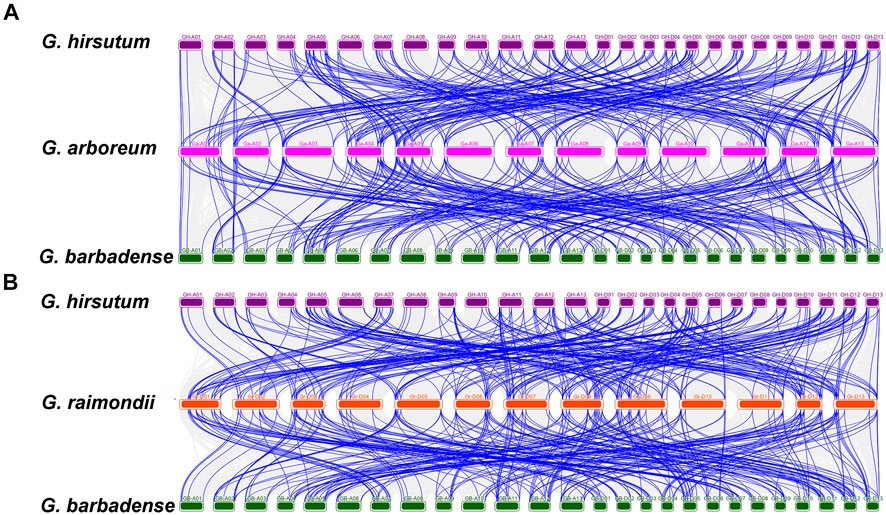
FIGURE 7. Multiple collinearity analysis of GHUGTs and GBUGTs compared with their ancestor species G. arboreum and G. raimondii. (A) Collinearity analysis of GHUGTs and GBUGTs compared with G. arboreum. (B) Collinearity analysis of GHUGTs and GBUGTs compared with G. raimondii. Dense grey lines in the background showed collinear blocks, while green lines revealed syntenic UGT gene pairs.
Selection pressure analysis
To investigate the effect of Darwinian positive selection and selection pressure on the evolution of UGTs, we calculated the ratio of Ka and Ks for orthologous/paralogous pairs from four cotton species (Figure 8, Supplementary Table S7). We identified 1,501 orthologous/paralogous pairs from four cotton species (GH, GB, Ga, and Gr). The Ka/Ks values of 1,456 (97.00%) orthologous/paralogous pairs were all less than 1. Among them, there were 1,196 orthologous/paralogous pairs with Ka/Ks values less than 0.5 and 260 orthologous/paralogous pairs with Ka/Ks values between 0.5 and 0.99. This indicated that the UGT gene family underwent overall strong purifying selection during evolution, leading to similar functions. Only 45 (3.00%) orthologous/paralogous pairs had a Ka/Ks ratio greater than 1, and these orthologous/paralogous genes may have undergone relatively rapid evolution after duplication and may have undergone positive selection. The Ka/Ks values of Ga-Ga, Gr-Gr and Ga-Gr were all less than 1, indicating that the paralogous genes from diploid cotton were all selected by purifying selection. Given that most Ka/Ks values were less than 1, we speculate that the UGT gene family has undergone strong purifying selection pressure with limited functional differentiation after segmental duplication and WGD (Figures 8A,B, Supplementary Table S7). We further calculated the segmental duplication time periods for these genes, as shown in Supplementary Table S7. Duplications of UGT gene segments from G. hirsutum showed a duplication history between 0.42 Mya and 155.73 Mya. Similarly, segmental duplication of UGTs in G. raimondii and G. arboreum occurred between 20.27 Mya and 140.74 Mya and 4.05 Mya and 121.55 Mya, respectively. G. barbadense showed an evolutionary background from 0.41 Mya to 119.44 Mya (Supplementary Table S7).
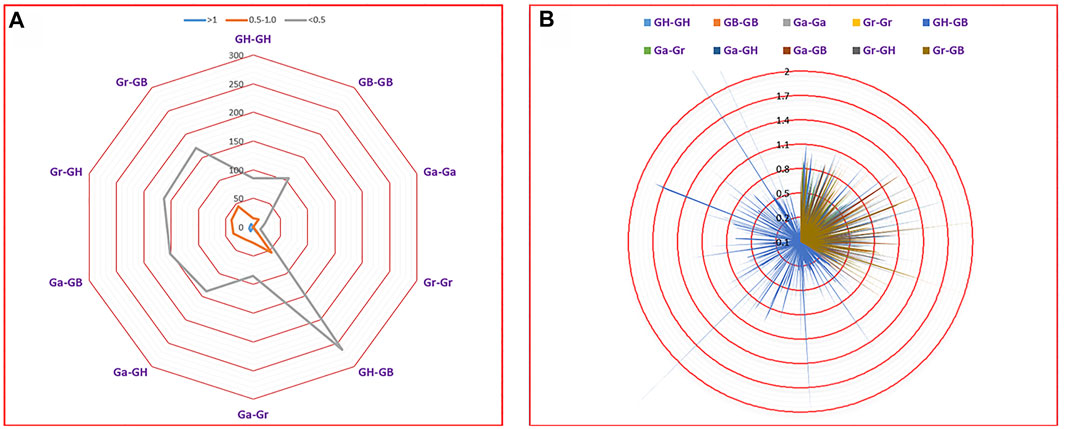
FIGURE 8. Selection pressure analysis based on Ka/Ks. (A) Number of duplicate gene pairs in different genomes of four cotton species. (B) Ka/Ks divergence values for GH-GH, GB-GB, Gr-Gr, Ga–Ga, GH-GB, Ga-Gr, Ga-GH, Ga-GB, Gr-GH and Gr-GB are displayed in a circular chart.
Gene ontology analysis of four cotton species
Gene Ontology is an internationally standardized gene function classification system that provides a dynamically updated set of controlled vocabulary to comprehensively describe the properties of genes and gene products in organisms. For GO analysis, we predicted the regulatory functions of 752 UGTs from four cotton species. We obtained data from CottonFGD (Zhu et al., 2017) and divided it into two categories: molecular functions and biological processes. For molecular functions, all 752 UGTs were involved in “transferase activity (GO:0016758)”. For biological processes, all UGTs were annotated to “metabolic process (GO:0008152)”, and the genes annotated to” lipid glycosylation (GO:0030259)” included six GHUGTs (2.65%), six GBUGTs (2.63%), three GaUGTs (2.05%), and three GrUGTs (1.97%). Altogether, the GO terms indicated that all 752 UGTs from the four cotton species were annotated to “transferase activity (GO:0016758)” and “metabolic process (GO:0008152)” (Figure 9, Supplementary Table S8).
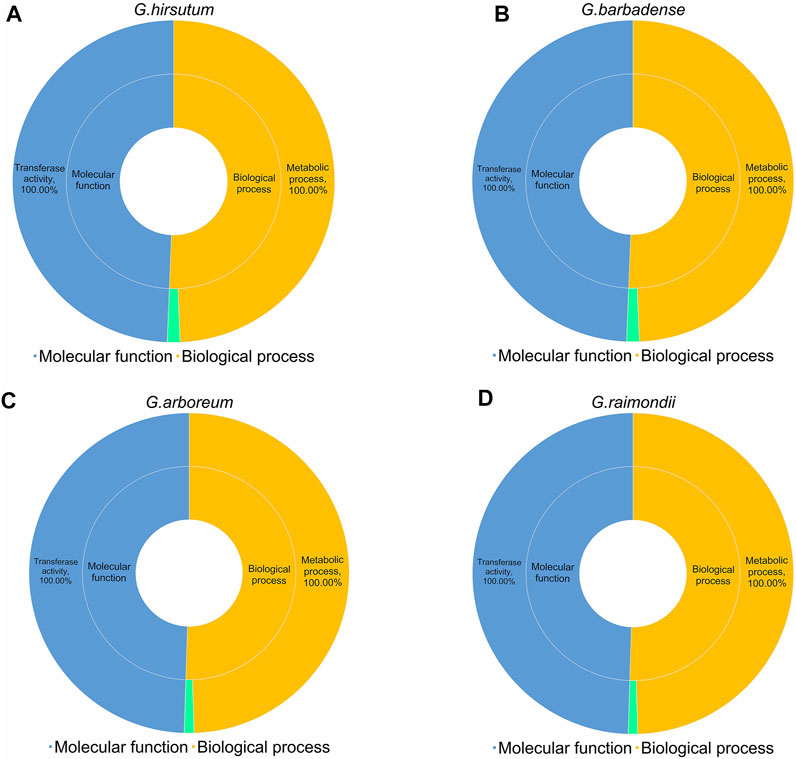
FIGURE 9. GO analysis of 752 UGTs from four cotton species. (A) G. hirsutum. (B) G. barbadense (C) G. arboreum (D) G. raimondii.
Analysis of diversified expression profiles and cis-acting elements
A cis-acting element is a sequence present in the flanking sequence of a gene that can affect gene expression and is mainly involved in the regulation of gene expression. Cis-acting elements include promoters, enhancers, regulatory sequences, and inducible elements, among others. We analysed the promoter regions of 226 GHUGTs, mainly including DNA sequences 2000 bp upstream of the transcription start site (TTS). In the promoter regions of the GHUGT gene family, we found a large number of cis-acting elements involved in various cellular physiological processes. There were differences in the cis-acting elements of GHUGTs from different clades. A large number of cis-acting elements related to the light response, a total of 29 cis-acting elements, were widely distributed in all clades. Box4, G-Box, GT1-motif, TCT-motif, GATA-motif, and MRE were the most abundant light-responsive elements, accounting for 90.71%, 74.34%, 73.45%, 56.19%, 45.13%, and 43.36% of the total GHUGTs, respectively (Figure 10 and Supplementary Table S9). A total of 9 cis-acting elements were found from the biotic/abiotic stress response category, and ARE (anaerobic induction), As-1 (low temperature responsive), WUN-motif (wound response) and LTR (low temperature responsive) were present in 83.19%, 62.83%, 56.19% and 50.88% of GHUGTs, respectively (Figure 10 and Supplementary Table S9). There were 11 cis-acting elements in the plant hormone response category, including ABRE (abscisic acid responsiveness), CGTCA-motif (MeJA-responsiveness), TGACG-motif (MeJA-responsiveness), TCA-element (salicylic acid responsiveness), TGA-element (auxin responsiveness) and P-box (gibberellin-responsive element), which accounted for 66.81%, 62.83%, 62.83%, 41.15%, 32.30%, and 26.55% of the total GHUGTs, respectively (Figure 10 and Supplementary Table S9). Similarly, 10 cis-acting elements were also found in the growth and development category. CAT-box (meristem expression) was the most abundant growth and developmental response element, accounting for 42.92% of the total number of GHUGTs, followed by the AT-rich element (binding site of AT-rich DNA-binding protein) (21.24%) and GCN4_motif (endosperm expression) (19.03%). Cis-acting elements related to stress, hormone response and growth and development were abundantly found in GHUGTs, indicating that they may play important roles in plant growth and development, plant hormone response and different stresses.
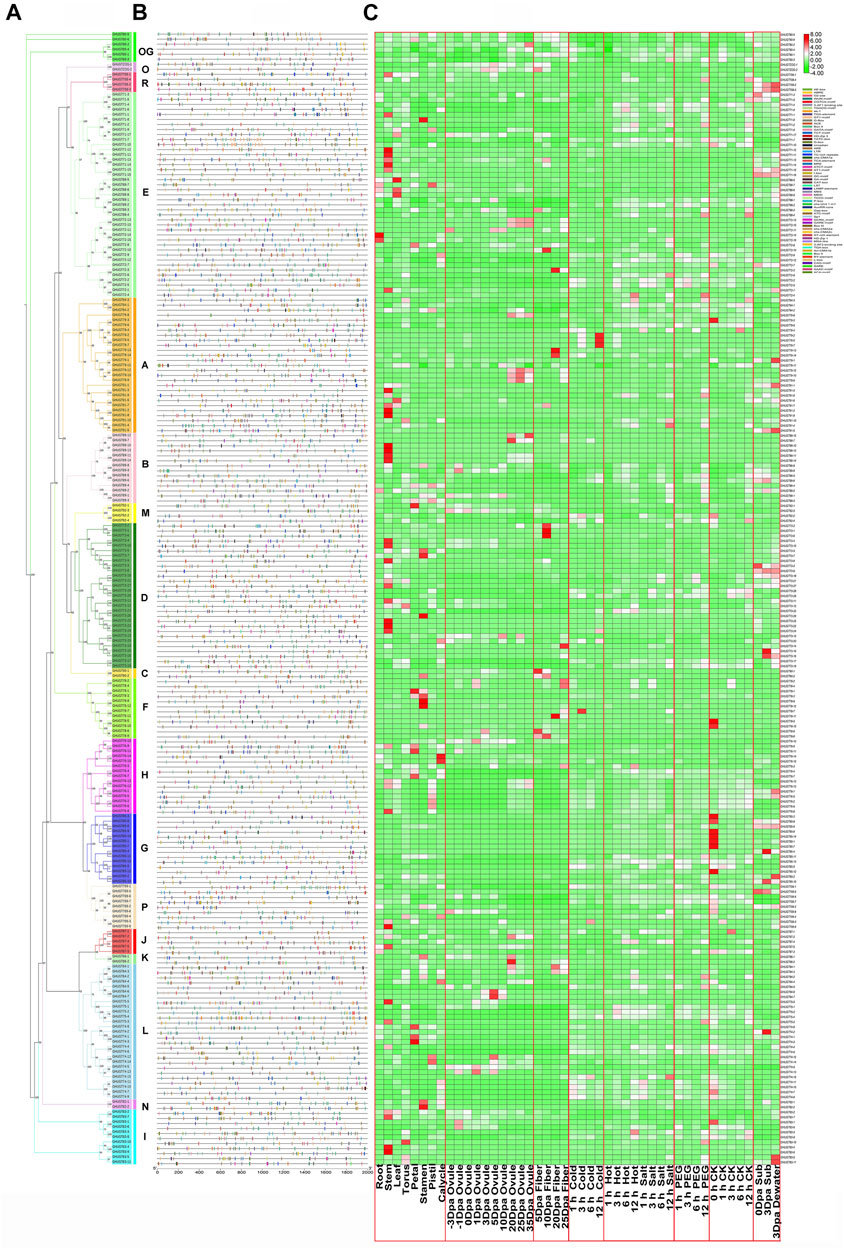
FIGURE 10. Promoters and differentially expressed gene analysis of the GHUGT family. (A) Phylogenetic tree of GHUGTs. (B) Cis-elements in the promoters of GHUGTs. (C) Differentially expressed genes of GHUGTs under cold, hot, salt, PEG and submergence stress and tissue-specific expression patterns. The change from green to red represents the change in gene expression level from low to high.
Since gene expression is closely related to cis-acting elements, we examined GHUGTs for abiotic stresses such as salt, drought, water, heat and cold, and tissue-specific expression patterns in roots, stems, leaves, fibres, etc. RNA-seq data were downloaded from the NCBI and analysed. RNA-Seq data from 10 tissues in G. hirsutum showed different expression patterns of GHUGTs within the same clade (Figures 10A,C). Moreover, genes from the same clade may be functionally different despite similar motifs under different abiotic stresses (Figures 9A,C). In conclusion, the expression analysis of GHUGTs under different abiotic stresses and in various tissues indicates that the GHUGT gene family is important in plant growth and development.
Validation analysis of the expression levels of GHUGTs
To further understand the tissue-specific expression profiles and responses to abiotic stresses of the GHUGT gene family, we analysed 18 GHUGTs from 18 clades. We found that 18 GHUGTs had different expression patterns in different tissues. For example, GHUGT90-2, GHUGT73-29, and GHUGTZOG-1 were highly expressed in leaves and expressed at low levels in roots and stems. GHUGT89-6, GHUGT85-10, and GHUGT87-3 were highly expressed in stems and expressed at low levels in roots and leaves. GHUGT92-4 and GHUGT82-1 were highly expressed in roots and expressed at low levels in leaves and stems (Figure 11). In addition, GHUGTs responded differently to various abiotic stresses (Figure 12). For example, GHUGT85-10 and GHUGT83-11 were highly expressed under cold stress but expressed at low levels under drought and heat stress; GHUGT74-2 was only highly expressed under heat stress. The above results further verified that the GHUGT gene family may be closely related to cotton growth and development.
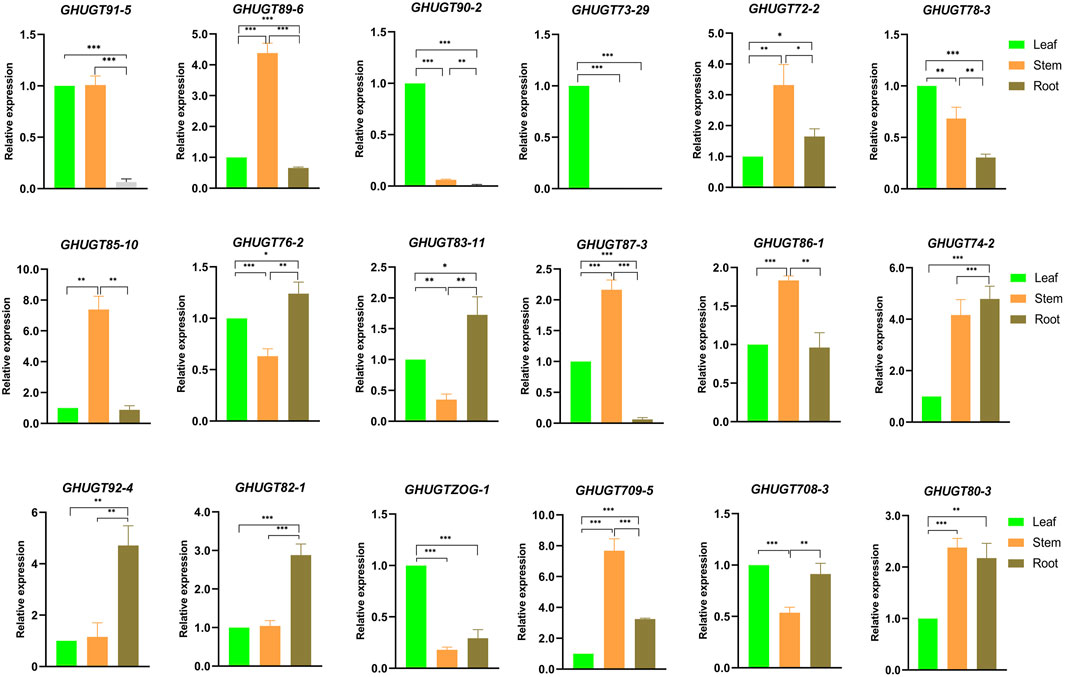
FIGURE 11. Tissue-specific expression of 18 GHUGT members differentially expressed genes. *: p < 0.05, **: p < 0.01 and ***: p < 0.001. Error bars are the standard deviation (SD) of three biological replicates in each treatment group. The statistical test is Student’s t-test.
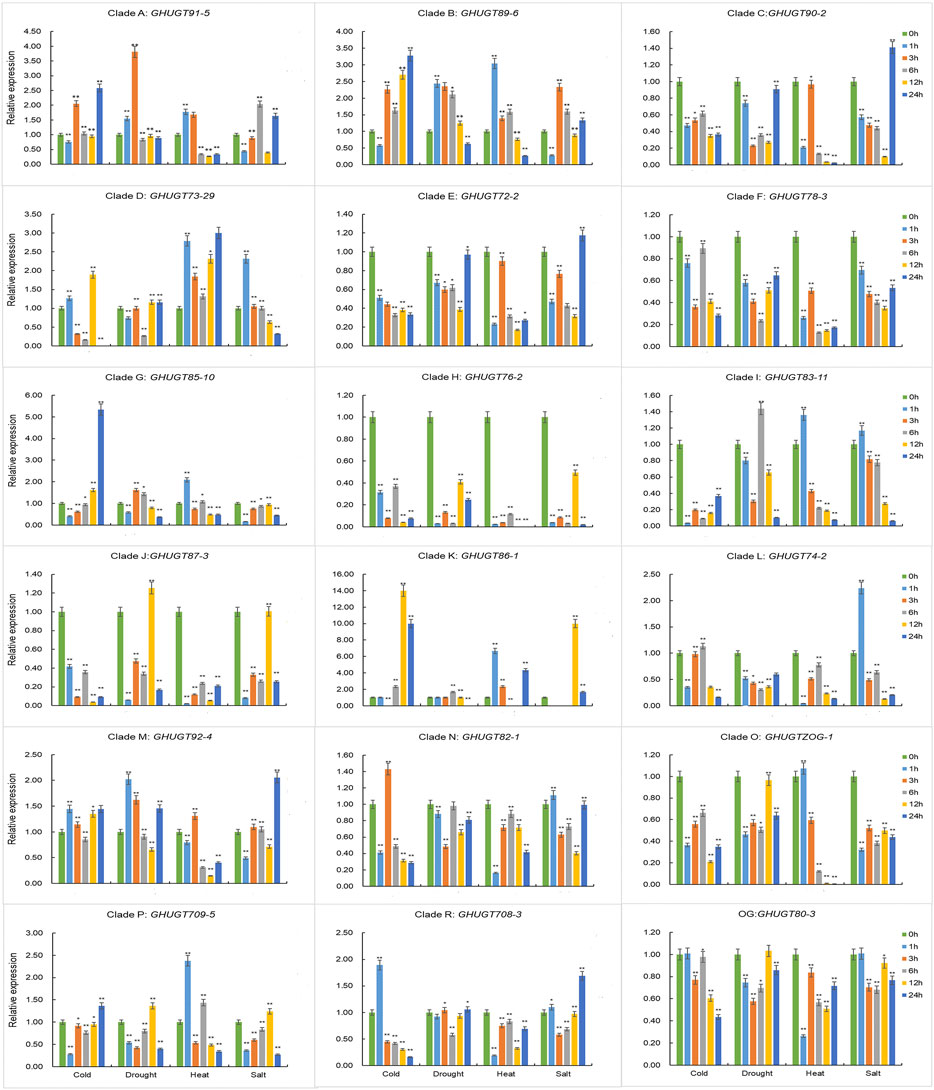
FIGURE 12. The expression levels of 18 GHUGT members at different times under abiotic stresses, including cold, drought, heat and salt. Error bars represent the SD between three biological replicates in each treatment group. The statistical test is Student’s t-test. *: p < 0.05, **: p < 0.01.
Function validation of GHUGT74-2
Virus-induced gene silencing (VIGS) is a powerful tool for the study of gene function (Lu et al., 2003; Senthil-Kumar and Mysore, 2011). To further investigate the function of UGT gene in abiotic stress, gene silencing analysis of GHUGT74-2 was performed by VIGS (Figure 13). When cotton grew to the three-leaf stage, the plants injected with pYL156:PDS appeared albino, indicating that GHUGT74-2 was successfully silenced. Under normal growth conditions, the expression level of the silent plant (Number: pYL156:GHUGT74-2) was significantly lower than that of the control (Number: pYL156). When submerged for 3 days, the phenotypic changes of the plants injected with pYL 156:GHUGT74-2 were more obvious than those of the plants injected with the pYL156 vector, and the leaves appeared more obvious wilting and browning (Figure 13A). The expression level of the silent plants (Number: pYL156:GHUGT74-2) was significantly lower than that of the control (Number: pYL156). At the same time, the chlorophyll content of the silent plants (Number: pYL156:GHUGT74-2) was significantly lower than that of the control (Number: pYL156). Studies have shown that GHUGT74-2 helps alleviate submergence stress).
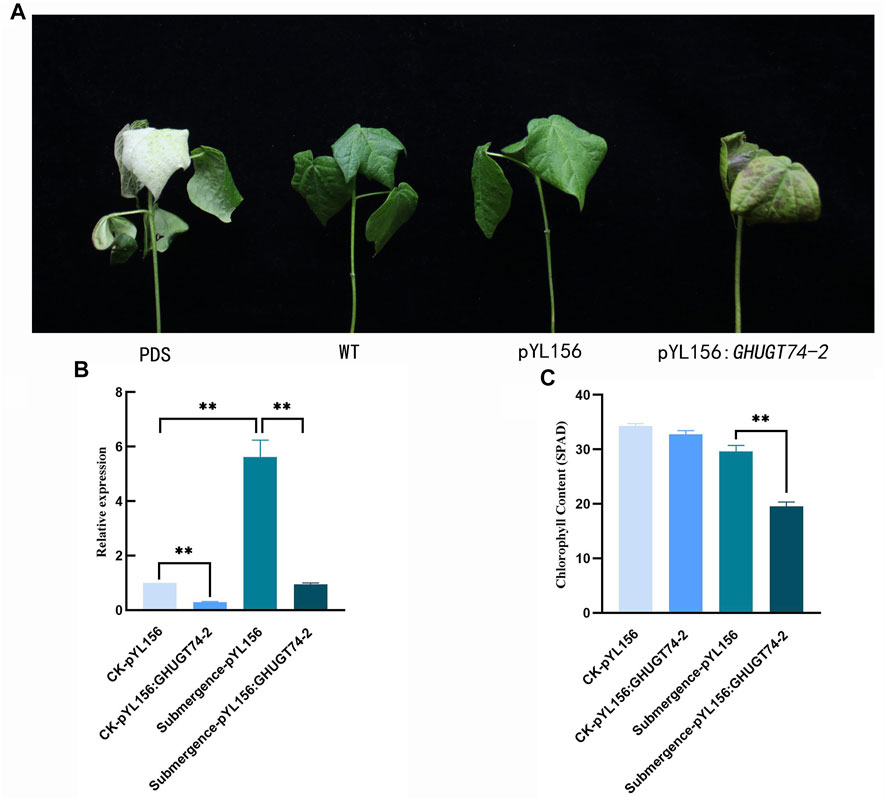
FIGURE 13. Phenotypic and biochemical indicators of cotton after GHUGT74-2 gene silencing under submergence. (A) Phenotypic of cotton after GHUGT74-2 gene silencing under submergence. (B) Expression level of GHUGT74-2 in control and GHUGT74-2-silenced plants. (C) Chlorophyll content in control and GHUGT74-2-silenced plants. PDS: albino cotton injected with pYL 156: PDS.; WT: normal growth cotton; pYL 156: blank control cotton injected with pYL 156 vector; pYL156:GHUGT74-2: silenced cotton injected with pYL 156: GHUGT74-2. *: p < 0.05, **: p < 0.01.
Discussion
UGTs are widespread in all plants. Compared with Arabidopsis (Ross et al., 2001), Zea mays (Li et al., 2014), Cicer arietinum (Sharma et al., 2014), Linum usitatissimum (Barvkar et al., 2012), Brassica rapa (Yu et al., 2017), Prunus mume (Zhang et al., 2018), Triticum aestivum (He et al., 2018), Manihot esculenta (Wu et al., 2021), G. hirsutum and G. barbadense contain the highest number of UGTs. This may be because the allopolyploid G. hirsutum and G. barbadense have undergone whole-genome duplication, as well as a large number of segmental duplications and tandem duplications during evolution (Malik et al., 2022). In the present study, 226, 228, 146, and 152 UGTs were identified in G. hirsutum, G. barbadense, G. arboreum, and G. raimondii, accounting for 0.31% (226/72761), 0.30% (228/75071), 0.36% (146/40960) and 0.41% (152/37505) of the total number of genes in its genome, respectively. The large variation in sequence lengths (from 1,026 to 93336 bps) and diverse gene structures (different numbers of introns from 1 to 15) of UGTs from the four cotton species suggest a divergence within the UGT gene family. Changes in protein motifs also hint at their evolution in gene families. In recent years, with the development of cotton genome resequencing and genomics, genome assembly and annotation have become more precise, making it possible to systematically assess the evolution and structural characteristics of the UGT gene family in cotton.
Structural analysis of the UGT gene family
Understanding the distribution of genes on chromosomes helps us to discover enriched regions of gene function. We found that most UGTs were distributed on both ends of the chromosome and showed a nonuniform distribution (Figure 4). UGTs were usually distributed on chromosomes in clusters of 2–12 genes. Genes in the same cluster showed a high degree of sequence similarity and were often grouped into the same clade. A total of 146 tandem duplication pairs were found in four cotton species (Figure 3). These gene clusters may be gene-enriched regions. Four UGT auxin-related genes were knocked out in Arabidopsis which are arranged in tandem in the genome (Mateo-Bonmatí et al., 2021).
Previous studies have shown that exon–intron distribution patterns in genes are related to their biological functions (Malik et al., 2020). Mainly taking the polyploid model plant allotetraploid G. hirsutum as the research object, the relationship between the structure and function of the UGT gene family was studied. Studies have shown that approximately 55.54% of GHUGTs have no introns, and approximately 39.94% have only one intron. GHUGTs of the same clade have similar structures and arrangements in terms of intron number and exon length (Figures 5A,C). There is a highly conserved sequence PSPG-box in the C-terminal region of UGT proteins, while the protein motifs in the N-terminal region vary greatly (Figure 5B). This suggests that the C-terminal region is involved in the binding of the UDP moiety of the nucleotide sugar substrate (Li et al., 2001). We found that the GHUGT gene family has a strong evolutionary relationship between gene structure and protein motif distribution and exhibits a conserved pattern of gene structure and protein motifs.
Evolutionary analysis of the UGT gene family
Phylogenetic analysis helped us to understand the differences in UGT family genes and analyse their evolutionary processes. According to the criterion proposed by Alexander E. (Wilson and Tian, 2019), we divided 752 UGTs into 18 clades and named them the A-P, R and OG clades. The 18 clades included 14 conserved clades (A-N) that exist in A. thaliana (Li et al., 2001; Ross et al., 2001) and Clades O, P, R, and OG (Figure 2). We classified the glycosyltransferase genes annotated as cytokinin glycosyltransferase (ZOG), 7-deoxyglycine glucosyltransferase (UGT709C), sterol 3-β-glucosyltransferase (UGT80A), and cyclodextrin glycosyltransferase (CTG) as the O, P, OG, and R clades, respectively. O and P clades have also been found in some plants (Huang et al., 2015; Zhou et al., 2017). The OG and R clades have not been reported in cotton (Huang et al., 2015), and are newly discovered in this study. The Q clade was not found from four cotton species, which is consistent with the finding in Poales and Brassicales (Wilson and Tian, 2019). During cotton evolution, four clades (A, D, E, G, and L) expanded more than others, which is consistent with previous findings (Caputi et al., 2012). Clade E had the largest number of UGT members (136), accounting for 18.09% of the UGTs. Clade R was not found in G. hirsutum, which may be related to gene loss during G. hirsutum evolution. Gene duplication provides the raw material for gene function innovation, which facilitates not only large-scale gene amplification but also speciation and adaptation to the environment (Hittinger and Carroll, 2007; Conant and Wolfe, 2008; He et al., 2020). There are three main methods of gene amplification: WGD, segmental duplication and tandem duplication. WGD, also known as polyploidy, is one of the methods of gene amplification. Angiosperm polyploidy is closely related to evolution (He et al., 2020). Allotetraploid G. hirsutum is a model crop for studying polyploidy (Li et al., 2015). Our results show that allotetraploid cotton (G. hirsutum and G. barbadense) has almost double the number of UGTs as monodiploid cotton (G. arboreum and G. raimondii) (Figure 1). At the same time, 80.84% (1781/2,203) of duplicated gene pairs underwent WGD. This also verifies that G. hirsutum and G. barbadense were produced by interspecific hybridization between the ancestor species with the A genome and the ancestor species with the D genome (Wendel and Cronn, 2003; Paterson et al., 2012; Li et al., 2015). Interestingly, 226, 228, 146, and 152 UGTs were identified in G. hirsutum, G. barbadense, G. arboreum, and G. raimondii, respectively. The total number of UGTs from tetraploids was less than twice the total number of UGTs from diploids, suggesting that gene loss occurred during the evolution of allotetraploid cotton. Similar results have also been reported before, such as gene loss in glutaredoxin (Malik et al., 2020), bZIP transcription factor (Wang et al., 2020), choline kinase (Wang et al., 2021) and ABC protein family (Malik et al., 2022). Moreover, we obtained a total of 2,203 duplicated gene pairs in four cotton species, including 276 segmental duplications and 146 tandem duplications (Figure 6). WGD, segmental duplication and tandem duplication have all played important roles in the large-scale amplification of the cotton UGT gene family, which is consistent with previous reports (Wu et al., 2021).
Gene families face selection pressure after gene amplification. People often use Ka/Ks to determine which type of selection pressure plays a major role. If Ka/Ks > 1, the gene is considered to be subject to positive selection; if Ka/Ks = 1, the gene is considered to be subject to neutral evolution; if Ka/Ks < 1, the gene is considered to be subject to purifying selection. In this study, 97.00% (1,456) of orthologous/paralogous pairs had Ka/Ks ratios less than 1, indicating that UGTs from four cotton species had undergone a high degree of purifying selection pressure (Figures 8A,B, Supplementary Table S7). At the same time, we found 45 (3.00%) orthologous/paralogous pairs with a Ka/Ks ratio greater than 1, and these orthologous/paralogous genes experienced positive selection pressure after duplication. In general, after the UGT family experienced WGD, segmental duplication and tandem duplication in the evolutionary process, most genes were subjected to purification selection, and only a few genes faced positive selection pressure.
Function analysis of the UGT gene family
UGTs play an important role in plant growth and development. OsIAGT1 regulates rice growth and development by regulating auxin homeostasis (Liu et al., 2019). Our results show that 10 cis-acting elements are related to growth and development, mainly including CAT-box (meristem expression), AT-rich element (binding site of AT-rich DNA-binding protein) and GCN4_motif (endosperm expression), and 11 cis-acting elements are involved in the regulation of plant hormone responses. At the same time, we found that GHUGTs had expression specificity in different tissues. For example, GHUGT90-2, GHUGT73-29 and GHUGTZOG-1 were highly expressed in leaves, and GHUGT89-6, GHUGT85-10 and GHUGT87-3 were highly expressed in stems (Figure 11). These results may indicate that UGTs are involved in cotton growth and developmental processes.
The UGT gene family is widely involved in plant responses to biotic and abiotic stresses, such as detoxification responses (Poppenberger et al., 2003), defence responses (Meißner et al., 2008; Huang et al., 2021), drought (Li et al., 2018), low temperature (Zhao et al., 2019), etc. A total of 9 cis-acting elements were found in the biotic/abiotic stress response categories, including ARE (anaerobic induction), As-1 (low temperature responsive), WUN-motif (wound response) and LTR (low temperature responsive). (Supplementary Table S9). For example, GHUGT74-2 was only highly expressed under high-temperature stress. GHUGT85-10 and GHUGT83-11 were highly expressed under cold stress and expressed at low levels under drought and heat stress. The above results further verify that the GHUGT gene family plays an important role in responding to biotic and abiotic stresses.
Conclusion
The UGT gene family is one of the plant supergene families, ubiquitous in all organisms, and involved in plant growth and development and biotic and abiotic stress responses. We identified a total of 752 UGTs from G. hirsutum, G. barbadense, G. arboreum, and G. raimondii and divided them into 18 clades. Each UGT gene contains a conserved PSPG motif. The chromosomal distribution, biochemical properties, conserved motifs, and exon/intron location features of the UGT gene family provide a useful material (structural) basis for understanding the function of the UGT gene family. Orthologue/paralogue comparison, selection pressure analysis, and phylogenetic analysis help to understand the evolutionary processes of the UGT gene family. Analysis of GO enrichment, RNA-seq data, cis-acting elements, qRT–PCR, and subcellular localization can help understand the function of the UGT gene family. Through the joint analysis of the structure–function evolution of the gene family, this study is helpful for understanding the evolutionary processes of the cotton UGT superfamily and the evolutionary mechanisms of polyploidy formation and for providing a new way to systematically and globally understand the structure–function relationship of multigene families (Figure 14).
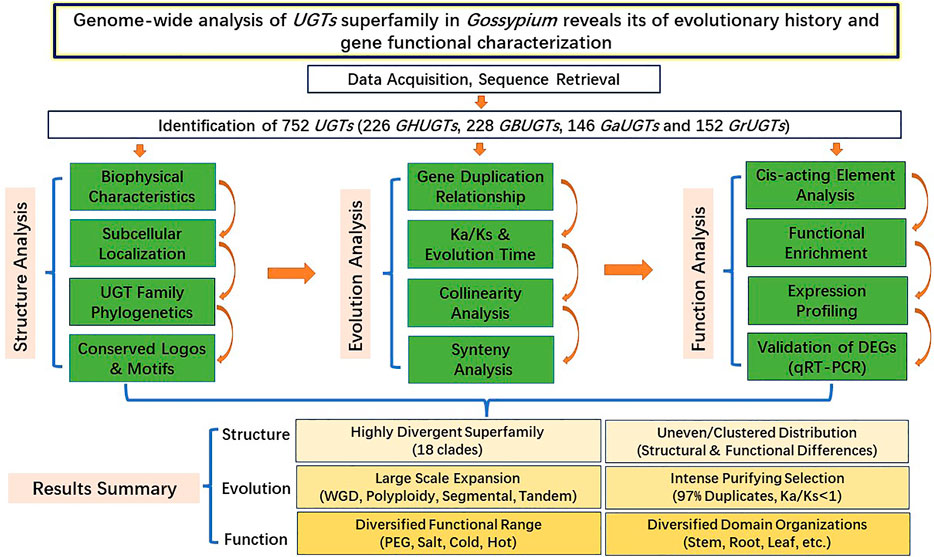
FIGURE 14. Systematic analysis diagram of UGT gene family structure, evolution and function.
Materials and methods
Databases
We downloaded the latest genome and protein files of G. arboreum (CRI, Ver. 1.0), G. raimondii (JGI, Ver. 2.0), G. hirsutum (ZJU, Ver. 2.1) and G. barbadense (ZJU, Ver. 1.1) from the Cotton Functional Genomics Database (CottonFGD) (https://cottonfgd.org/) (Zhu et al., 2017). The representative reference sequences file of Arabidopsis thaliana was retrieved from TAIR 10 (http://www.arabidopsis.org/) (Wilson and Tian, 2019).
Identification of UGTs
The known conserved domain of UGT proteins is PF00201.20 (Huang et al., 2015). The hidden Markov model (HMM) (Ver. 35.0) profile of PF00201.20 was downloaded from the online website Pfam (https://pfam.xfam.org/). The UGT gene containing PF00201.20 was obtained as a candidate gene for a UGT gene family member using native software HMMER 3.0. We retained redundant genes with e-values less than 1E-05. We further assessed our genes by NCBI Batch CD-Search (www.ncbi.nlm.nih.gov/Structure/bwrpsb/bwrpsb.cgi) (Lu et al., 2020) and manually deleted genes with incomplete C and N ends. Based on the conserved PF00201 domain of the UGT gene family, the protein sequences of UGTs from four cotton species were screened and downloaded from CottonFGD (Zhu et al., 2017). According to the location of UGTs on the chromosome, we renamed UGTs of G. hirsutum (GH), G. barbadense (GB), G. arboreum (Ga), G. raimondii (Gr), respectively (Supplementary Table S1). We further retrieved various biophysical and chemical properties of UGTs from four cotton species by using CottonFGD, including transcript lengths, exon/intron lengths, molecular weights (MWs), protein lengths, grand average hydropathy and charge (Supplementary Table S2) (Zhu et al., 2017).
Phylogenetic and sequence alignments
The UGT amino acid sequences of the four plant species are given in Supplementary Table S3. We used ClustalW (Ver. 2.0) with the default setting for amino acid sequence complete alignments (Larkin et al., 2007) and then constructed the phylogenetic tree in Toolbox for Biologists software (TBtools, Ver. 1.098693) using the maximum likelihood (ML) method with 5,000 bootstrap number (Chen et al., 2020).
Chromosomal locations of UGTs
Gene annotation files (GFF3 format) of four cotton species were obtained from CottonFGD (Zhu et al., 2017). Toolbox for Biologists software (TBtools, Ver. 1.098693) was used to visualize the physical locations of UGTs on chromosomes from four cotton genomes (Chen et al., 2020).
Analysis of the conserved protein motifs and gene structure
We used the online webtool MEME (Ver. 5.4.1) (https://meme-suite.org/meme/tools/meme) to predict the conserved protein motifs of UGT proteins (Bailey et al., 2009). A GHUGT phylogenetic tree, conserved motifs and gene structures were drawn with TBTools (Ver. 1.098693) by using a NWK file for the phylogenetic tree, the gff3 file of G. hirsutum and MAST file obtained from the MEME (Ver. 5.4.1) website (Bailey et al., 2009; Chen et al., 2020).
Collinearity analysis of UGTs
Synteny relations between duplicated gene pairs from G. barbadense, G. hirsutum, G. arboreum and G. raimondii were analysed by MCScanX software (Wang et al., 2012). The graphical results were displayed using TBtools software (Chen et al., 2020).
Analysis of selection pressure
Duplicated gene pairs of four cotton species were obtained by using alignment in MEGA 7.0. We calculated the nonsynonymous (Ka) and synonymous (Ks) substitution rates of UGT duplicated genes to investigate the selection pressure using TBtools software (Chen et al., 2020). We calculated the evolutionary time of duplicate pairs using the following formula: T = Ks/2λ × 10–6 (Mya) and λ = 1.5 × 10⁻⁸ (Malik et al., 2022).
Cis-acting element analysis and gene expression profiling of GHUGTs
DNA sequences in upstream 2000 bp regions of GHUGTs were downloaded from CottonFGD (https://cottonfgd.org) (Zhu et al., 2017) as promoters. We used the oneline site PlantCARE (http://bioinformatics.psb.ugent.be/webtools/plantcare/html/) to predict cis-acting elements in GHUGT promoter regions. We further analysed cis-acting elements related to light response, plant growth and development, phytohormones and abiotic stresses.
RNA-Seq data (accession: PRJNA780360, PRJNA248163) were downloaded from the NCBI database (https://www.ncbi.nlm.nih.gov/) to examine the expression profiling of GHUGTs in different tissues, including stem, root, leaf, torus, petal, stamen, pistil, calycle, ovule and fibre development, and under abiotic stress, including PEG, salt, cold, submergence and heat stress, with various time laps (Hu et al., 2019). We obtained heatmaps with FPKM values for UGT relative expression analysis by TBtools software (Chen et al., 2020).
qRT–PCR analysis of GHUGTs
Tissue-specific expression profiles of different GHUGTs in roots, stems, and leaves and responses of different GHUGTs to abiotic stresses, such as salt (250 mM NaCl), drought (15% PEG), cold (-4 C°), and heat (42 C°) at different time intervals (0 h, 1 h, 3 h, 6 h, 12 h, and 24 h), were analysed by qRT–PCR. ZNL2067 seeds were sown in a medium (sand and vermiculite mixed at 1:1.5) and cultivated in a light incubator (25°C, 16 h/8 h day/night) until the three-leaf stage. Abiotic stress treatment and tissue sampling of roots, stems, and leaves were performed at the three-leaf stage, and each experiment used three independent biological replicates. We used the EASYspin Plus Plant RNA Kit (Aidlab Co., LTD., Beijing, China) to extract total RNA from cotton samples and then synthesized cDNA following the instruction manual of TransStart Top Green qPCR SuperMix (TransGene Biotech Co., LTD., Beijing, China). RT–qPCR primers for 18 GHUGTs were designed on the online tool GenScript (https://www. genscript. com/tools/real-time-pcr-taqman-primer-design-tool). All primer sequences of 18 UGTs are given in Supplementary Table S4. RT–qPCR experiments were performed on the Bio–Rad 7,500 rapid real-time PCR platform. The relative expression of GHUGTs was calculated using the 2−ΔΔCt method. VIGS Technology refers to Zhang Yuexin et al. (Zhang et al., 2022).
Data availability statement
The original contributions presented in the study are included in the article/Supplementary Material, further inquiries can be directed to the corresponding author.
Author contributions
Conceived and designed the experiments: WY, LS, and TN; methodology: LS, HH, JW, XL, DW, and XC; experiment: LS, LZ, YZ, JW, and SW; analysis of data: LS, YZ, CR, YF, MH, NX, HZ, and JW; writing-original draft preparation: LS; writing-review and editing: LS, HH, SW, LZ, CC, TN, and LG; supervision: WY and TN. All writing and modification of the manuscript are completed by the author.
Funding
This study was supported by China Agriculture Research System of MOF and MARA, Agricultural Science and Technology Innovation Program of Chinese Academy of Agricultural Sciences, Jiangxi Agriculture Research System (JXARS-22).
Conflict of interest
The authors declare that the research was conducted in the absence of any commercial or financial relationships that could be construed as a potential conflict of interest.
Publisher’s note
All claims expressed in this article are solely those of the authors and do not necessarily represent those of their affiliated organizations, or those of the publisher, the editors and the reviewers. Any product that may be evaluated in this article, or claim that may be made by its manufacturer, is not guaranteed or endorsed by the publisher.
Supplementary material
The Supplementary Material for this article can be found online at: https://www.frontiersin.org/articles/10.3389/fmolb.2022.965403/full#supplementary-material
Abbreviations
GO, Gene Ontology; UGT, UDP-glycosyltransferase; PSPG, Plant secondary product glycosyltransferase; GT, Glycosyltransferase; UFGT, Flavonoid glucosyltransferase; Gossypium hirsutum, G. hirsutum; Gossypium arboreum, G. arboreum; Gossypium raimondii, G. raimondii; Gossypium barbadense, G. barbadense
References
Aoi, Y., Hira, H., Hayakawa, Y., Liu, H., Fukui, K., Dai, X., et al. (2020). UDP-glucosyltransferase UGT84B1 regulates the levels of indole-3-acetic acid and phenylacetic acid in Arabidopsis. Biochem. Biophysical Res. Commun. 532, 244–250. doi:10.1016/j.bbrc.2020.08.026
Bailey, T. L., Boden, M., Buske, F. A., Frith, M., Grant, C. E., Clementi, L., et al. (2009). Meme suite: Tools for motif discovery and searching. Nucleic acids Res. 37, W202–W208. doi:10.1093/nar/gkp335
Barvkar, V. T., Pardeshi, V. C., Kale, S. M., Kadoo, N. Y., and Gupta, V. S. (2012). Phylogenomic analysis of UDP glycosyltransferase 1 multigene family in Linum usitatissimum identified genes with varied expression patterns. BMC genomics 13, 1–13. doi:10.1186/1471-2164-13-175
Bowles, D., Isayenkova, J., Lim, E.-K., and Poppenberger, B. (2005). Glycosyltransferases: Managers of small molecules. Curr. Opin. plant Biol. 8, 254–263. doi:10.1016/j.pbi.2005.03.007
Campbell, J. A., Davies, G. J., Bulone, V., and Henrissat, B. (1997). A classification of nucleotide-diphospho-sugar glycosyltransferases based on amino acid sequence similarities. Biochem. J. 326, 929–939. doi:10.1042/bj3260929u
Caputi, L., Malnoy, M., Goremykin, V., Nikiforova, S., and Martens, S. (2012). A genome-wide phylogenetic reconstruction of family 1 UDP-glycosyltransferases revealed the expansion of the family during the adaptation of plants to life on land. Plant J. 69, 1030–1042. doi:10.1111/j.1365-313x.2011.04853.x
Chen, C., Chen, H., Zhang, Y., Thomas, H. R., Frank, M. H., He, Y., et al. (2020). TBtools: An integrative toolkit developed for interactive analyses of big biological data. Mol. plant 13, 1194–1202. doi:10.1016/j.molp.2020.06.009
Conant, G. C., and Wolfe, K. H. (2008). Turning a hobby into a job: How duplicated genes find new functions. Nat. Rev. Genet. 9, 938–950. doi:10.1038/nrg2482
Coutinho, P. M., Deleury, E., Davies, G. J., and Henrissat, B. (2003). An evolving hierarchical family classification for glycosyltransferases. J. Mol. Biol. 328, 307–317. doi:10.1016/s0022-2836(03)00307-3
Crooks, G. E., Hon, G., Chandonia, J.-M., and Brenner, S. E. (2004). WebLogo: A sequence logo generator: Figure 1. Genome Res. 14, 1188–1190. doi:10.1101/gr.849004
Dooner, H. K., and Nelson, O. E. (1977). Controlling element-induced alterations in UDPglucose:flavonoid glucosyltransferase, the enzyme specified by the bronze locus in maize. Proc. Natl. Acad. Sci. U.S.A. 74, 5623–5627. doi:10.1073/pnas.74.12.5623
He, P., Zhang, Y., and Xiao, G. (2020). Origin of a subgenome and genome evolution of allotetraploid cotton species. Mol. Plant 13, 1238–1240. doi:10.1016/j.molp.2020.07.006
He, Y., Ahmad, D., Zhang, X., Zhang, Y., Wu, L., Jiang, P., et al. (2018). Genome-wide analysis of family-1 UDP glycosyltransferases (UGT) and identification of UGT genes for FHB resistance in wheat (Triticum aestivum L.). BMC Plant Biol. 18, 67–20. doi:10.1186/s12870-018-1286-5
Hittinger, C. T., and Carroll, S. B. (2007). Gene duplication and the adaptive evolution of a classic genetic switch. Nature 449, 677–681. doi:10.1038/nature06151
Hu, Y., Chen, J., Fang, L., Zhang, Z., Ma, W., Niu, Y., et al. (2019). Gossypium barbadense and Gossypium hirsutum genomes provide insights into the origin and evolution of allotetraploid cotton. Nat. Genet. 51, 739–748. doi:10.1038/s41588-019-0371-5
Huang, J., Pang, C., Fan, S., Song, M., Yu, J., Wei, H., et al. (2015). Genome-wide analysis of the family 1 glycosyltransferases in cotton. Mol. Genet. Genomics 290, 1805–1818. doi:10.1007/s00438-015-1040-8
Huang, X. X., Wang, Y., Lin, J. S., Chen, L., Li, Y. J., Liu, Q., et al. (2021). The novel pathogen‐responsive glycosyltransferase UGT73C7 mediates the redirection of phenylpropanoid metabolism and promotes SNC1 ‐dependent Arabidopsis immunity. Plant J. 107, 149–165. doi:10.1111/tpj.15280
Hughes, J., and Hughes, M. A. (1994). Multiple secondary plant product UDP-glucose glucosyltransferase genes expressed in cassava (Manihot esculenta Crantz) cotyledons. DNA Seq. 5, 41–49. doi:10.3109/10425179409039703
Jones, P., and Vogt, T. (2001). Glycosyltransferases in secondary plant metabolism: Tranquilizers and stimulant controllers. Planta 213, 164–174. doi:10.1007/s004250000492
Keegstra, K., and Raikhel, N. (2001). Plant glycosyltransferases. Curr. Opin. plant Biol. 4, 219–224. doi:10.1016/s1369-5266(00)00164-3
Larkin, M. A., Blackshields, G., Brown, N. P., Chenna, R., McGettigan, P. A., McWilliam, H., et al. (2007). Clustal W and clustal X version 2.0. bioinformatics 23, 2947–2948. doi:10.1093/bioinformatics/btm404
Lepak, A., Gutmann, A., Kulmer, S. T., and Nidetzky, B. (2015). Creating a water-soluble resveratrol-based antioxidant by site-selective enzymatic glucosylation. ChemBioChem 16, 1870–1874. doi:10.1002/cbic.201500284
Li, F., Fan, G., Lu, C., Xiao, G., Zou, C., Kohel, R. J., et al. (2015). Genome sequence of cultivated Upland cotton (Gossypium hirsutum TM-1) provides insights into genome evolution. Nat. Biotechnol. 33, 524–530. doi:10.1038/nbt.3208
Li, P., Li, Y. j., Wang, B., Yu, H. m., Li, Q., and Hou, B. k. (2017). TheArabidopsisUGT87A2, a stress-inducible family 1 glycosyltransferase, is involved in the plant adaptation to abiotic stresses. Physiol. Plant. 159, 416–432. doi:10.1111/ppl.12520
Li, Y.-j., Li, P., Wang, T., Zhang, F.-j., Huang, X.-x., and Hou, B.-k. (2018). The maize secondary metabolism glycosyltransferase UFGT2 modifies flavonols and contributes to plant acclimation to abiotic stresses. Ann. Bot. 122, 1203–1217. doi:10.1093/aob/mcy123
Li, Y., Baldauf, S., Lim, E.-K., and Bowles, D. J. (2001). Phylogenetic analysis of the UDP-glycosyltransferase multigene family of Arabidopsis thaliana. J. Biol. Chem. 276, 4338–4343. doi:10.1074/jbc.m007447200
Li, Y., Li, P., Wang, Y., Dong, R., Yu, H., and Hou, B. (2014). Genome-wide identification and phylogenetic analysis of Family-1 UDP glycosyltransferases in maize (Zea mays). Planta 239, 1265–1279. doi:10.1007/s00425-014-2050-1
Liu, Q., Chen, T.-T., Xiao, D.-W., Zhao, S.-M., Lin, J.-S., Wang, T., et al. (2019). OsIAGT1 is a glucosyltransferase gene involved in the glucose conjugation of auxins in rice. Rice (N Y) 12, 92–13. doi:10.1186/s12284-019-0357-z
Lu, R., Martin-Hernandez, A. M., Peart, J. R., Malcuit, I., and Baulcombe, D. C. (2003). Virus-induced gene silencing in plants. Methods 30, 296–303. doi:10.1016/s1046-2023(03)00037-9
Lu, S., Wang, J., Chitsaz, F., Derbyshire, M. K., Geer, R. C., Gonzales, N. R., et al. (2020). CDD/SPARCLE: The conserved domain database in 2020. Nucleic acids Res. 48, D265–D268. doi:10.1093/nar/gkz991
Mackenzie, P. I., Owens, I. S., Burchell, B., Bock, K. W., Bairoch, A., Belanger, A., et al. (1997). The UDP glycosyltransferase gene superfamily: Recommended nomenclature update based on evolutionary divergence. Pharmacogenetics 7, 255–269. doi:10.1097/00008571-199708000-00001
Mackenzie, P. I., Walter Bock, K. W., Burchell, B., Guillemette, C., Ikushiro, S., Iyanagi, T., et al. (2005). Nomenclature update for the mammalian UDP glycosyltransferase (UGT) gene superfamily. Pharmacogenet Genomics 15, 677–685. doi:10.1097/01.fpc.0000173483.13689.56
Malik, W. A., Afzal, M., Chen, X., Cui, R., Lu, X., Wang, S., et al. (2022). Systematic analysis and comparison of ABC proteins superfamily confer structural, functional and evolutionary insights into four cotton species. Industrial Crops Prod. 177, 114433.
Malik, W. A., Wang, X., Wang, X., Shu, N., Cui, R., Chen, X., et al. (2020). Genome-wide expression analysis suggests glutaredoxin genes response to various stresses in cotton. Int. J. Biol. Macromol. 153, 470–491. doi:10.1016/j.ijbiomac.2020.03.021
Mateo‐Bonmatí, E., Casanova‐Sáez, R., Šimura, J., and Ljung, K. (2021). Broadening the roles of UDP‐glycosyltransferases in auxin homeostasis and plant development. New Phytol. 232, 642–654. doi:10.1111/nph.17633
Meißner, D., Albert, A., Böttcher, C., Strack, D., and Milkowski, C. (2008). The role of UDP-glucose: Hydroxycinnamate glucosyltransferases in phenylpropanoid metabolism and the response to UV-B radiation in Arabidopsis thaliana. Planta 228, 663–674. doi:10.1007/s00425-008-0768-3
Mishra, M. K., Singh, G., Tiwari, S., Singh, R., Kumari, N., and Misra, P. (2015). Characterization of Arabidopsis sterol glycosyltransferase TTG15/UGT80B1 role during freeze and heat stress. Plant Signal. Behav. 10, e1075682. doi:10.1080/15592324.2015.1075682
Paterson, A. H., Wendel, J. F., Gundlach, H., Guo, H., Jenkins, J., Jin, D., et al. (2012). Repeated polyploidization of Gossypium genomes and the evolution of spinnable cotton fibres. Nature 492, 423–427. doi:10.1038/nature11798
Poppenberger, B., Berthiller, F., Lucyshyn, D., Sieberer, T., Schuhmacher, R., Krska, R., et al. (2003). Detoxification of the Fusarium mycotoxin deoxynivalenol by a UDP-glucosyltransferase from Arabidopsis thaliana. J. Biol. Chem. 278, 47905–47914. doi:10.1074/jbc.m307552200
Poppenberger, B., Fujioka, S., Soeno, K., George, G. L., Vaistij, F. E., Hiranuma, S., et al. (2005). The UGT73C5 of Arabidopsis thaliana glucosylates brassinosteroids. Proc. Natl. Acad. Sci. U.S.A. 102, 15253–15258. doi:10.1073/pnas.0504279102
Priest, D. M., Ambrose, S. J., Vaistij, F. E., Elias, L., Higgins, G. S., Ross, A. R., et al. (2006). Use of the glucosyltransferase UGT71B6 to disturb abscisic acid homeostasis inArabidopsis thaliana. Plant J. 46, 492–502. doi:10.1111/j.1365-313x.2006.02701.x
Ross, J., Li, Y., Lim, E.-K., and Bowles, D. J. (2001). Higher plant glycosyltransferases. Genome Biol. 2, REVIEWS3004–6. doi:10.1186/gb-2001-2-2-reviews3004
Senthil-Kumar, M., and Mysore, K. S. (2011). New dimensions for VIGS in plant functional genomics. Trends plant Sci. 16, 656–665. doi:10.1016/j.tplants.2011.08.006
Sharma, R., Rawat, V., and Suresh, C. (2014). Genome-wide identification and tissue-specific expression analysis of UDP-glycosyltransferases genes confirm their abundance in Cicer arietinum (Chickpea) genome. PLoS One 9, e109715. doi:10.1371/journal.pone.0109715
Sun, Y.-G., Wang, B., Jin, S.-H., Qu, X.-X., Li, Y.-J., and Hou, B.-K. (2013). Ectopic expression of Arabidopsis glycosyltransferase UGT85A5 enhances salt stress tolerance in tobacco. PLoS one 8, e59924. doi:10.1371/journal.pone.0059924
Vogt, T., and Jones, P. (2000). Glycosyltransferases in plant natural product synthesis: Characterization of a supergene family. Trends plant Sci. 5, 380–386. doi:10.1016/s1360-1385(00)01720-9
Wang, J., Zhang, Y., Xu, N., Zhang, H., Fan, Y., Rui, C., et al. (2021). Genome-wide identification of CK gene family suggests functional expression pattern against Cd2+ stress in Gossypium hirsutum L. Int. J. Biol. Macromol. 188, 272–282. doi:10.1016/j.ijbiomac.2021.07.190
Wang, X., Lu, X., Malik, W. A., Chen, X., Wang, J., Wang, D., et al. (2020). Differentially expressed bZIP transcription factors confer multi-tolerances in Gossypium hirsutum L. Int. J. Biol. Macromol. 146, 569–578. doi:10.1016/j.ijbiomac.2020.01.013
Wang, Y., Tang, H., DeBarry, J. D., Tan, X., Li, J., Wang, X., et al. (2012). MCScanX: A toolkit for detection and evolutionary analysis of gene synteny and collinearity. Nucleic acids Res. 40, e49. doi:10.1093/nar/gkr1293
Wendel, J. F., and Cronn, R. C. (2003). Polyploidy and the evolutionary history of cotton. Adv. Agron. 78, 78004–78008. doi:10.1016/s0065-2113(02)78004-8
Wilson, A. E., and Tian, L. (2019). Phylogenomic analysis of UDP‐dependent glycosyltransferases provides insights into the evolutionary landscape of glycosylation in plant metabolism. Plant J. 100, 1273–1288. doi:10.1111/tpj.14514
Wu, C., Dai, J., Chen, Z., Tie, W., Yan, Y., Yang, H., et al. (2021). Comprehensive analysis and expression profiles of cassava UDP-glycosyltransferases (UGT) family reveal their involvement in development and stress responses in cassava. Genomics 113, 3415–3429. doi:10.1016/j.ygeno.2021.08.004
Yonekura‐Sakakibara, K., and Hanada, K. (2011). An evolutionary view of functional diversity in family 1 glycosyltransferases. Plant J. 66, 182–193. doi:10.1111/j.1365-313X.2011.04493.x
Yu, J., Hu, F., Dossa, K., Wang, Z., and Ke, T. (2017). Genome-wide analysis of UDP-glycosyltransferase super family in Brassica rapa and Brassica oleracea reveals its evolutionary history and functional characterization. Bmc Genomics 18, 1–18. doi:10.1186/s12864-017-3844-x
Zhang, G.-Z., Jin, S.-H., Jiang, X.-Y., Dong, R.-R., Li, P., Li, Y.-J., et al. (2016). Ectopic expression of UGT75D1, a glycosyltransferase preferring indole-3-butyric acid, modulates cotyledon development and stress tolerance in seed germination of Arabidopsis thaliana. Plant Mol. Biol. 90, 77–93. doi:10.1007/s11103-015-0395-x
Zhang, Y., Rui, C., Fan, Y., Xu, N., Zhang, H., Wang, J., et al. (2022). Identification of SNAT family genes suggests GhSNAT3D functional reponse to melatonin synthesis under salinity stress in cotton. Front. Mol. Biosci. 9, 843814. doi:10.3389/fmolb.2022.843814
Zhang, Z., Zhuo, X., Yan, X., and Zhang, Q. (2018). Comparative genomic and transcriptomic analyses of family-1 UDP glycosyltransferase in Prunus mume. Ijms 19, 3382. doi:10.3390/ijms19113382
Zhao, M., Jin, J., Gao, T., Zhang, N., Jing, T., Wang, J., et al. (2019). Glucosyltransferase CsUGT78A14 regulates flavonols accumulation and reactive oxygen species scavenging in response to cold stress in Camellia sinensis. Front. Plant Sci. 10, 1675. doi:10.3389/fpls.2019.01675
Zhou, K., Hu, L., Li, P., Gong, X., and Ma, F. (2017). Genome-wide identification of glycosyltransferases converting phloretin to phloridzin in Malus species. Plant Sci. 265, 131–145. doi:10.1016/j.plantsci.2017.10.003
Keywords: gene family, UDP-glycosyltransferase, evolution, gene function, cotton
Citation: Sun L, Zhao L, Huang H, Zhang Y, Wang J, Lu X, Wang S, Wang D, Chen X, Chen C, Guo L, Xu N, Zhang H, Wang J, Rui C, Han M, Fan Y, Nie T and Ye W (2022) Genome-wide identification, evolution and function analysis of UGTs superfamily in cotton. Front. Mol. Biosci. 9:965403. doi: 10.3389/fmolb.2022.965403
Received: 09 June 2022; Accepted: 17 August 2022;
Published: 13 September 2022.
Edited by:
Dong-Woo Lee, Yonsei University, South KoreaReviewed by:
Xianzhao Kan, Anhui Normal University, ChinaEduardo Mateo-Bonmati, John Innes Centre, United Kingdom
Copyright © 2022 Sun, Zhao, Huang, Zhang, Wang, Lu, Wang, Wang, Chen, Chen, Guo, Xu, Zhang, Wang, Rui, Han, Fan, Nie and Ye. This is an open-access article distributed under the terms of the Creative Commons Attribution License (CC BY). The use, distribution or reproduction in other forums is permitted, provided the original author(s) and the copyright owner(s) are credited and that the original publication in this journal is cited, in accordance with accepted academic practice. No use, distribution or reproduction is permitted which does not comply with these terms.
*Correspondence: Wuwei Ye, eWV3MTU4QDE2My5jb20=; Taili Nie, bjA3MDYxMDE4QDE2My5jb20=