- 1College of Life Sciences, Anhui Normal University, Wuhu, Anhui, China
- 2Anhui Provincial Key Laboratory of Conservation and Exploitation of Biological Resources, Wuhu, China
Meningitis-like infectious disease (MID) (also known as frog cataract and torticollis) is a disease prone to occur in amphibians and reptiles. It is highly contagious and has a high mortality rate. In this study, we sampled and sequenced microbiomes from oral and intestinal samples of five normal and five diseased bullfrogs. The analysis found that the richness, uniformity, and abundance of the microbial community of the diseased bullfrogs were significantly higher than those of the normal bullfrogs in both the oral cavity and the gut. In the diseased group, the abundance of Elizabethkingia significantly increased and that of Lactococcus significantly decreased. It showed that the structure of the microbial community had changed a lot in diseased frogs. After the pathogenic bacteria infected the body, it might be make the decline in the immune function of the body declined, and resulting in some conditional pathogenic bacteria in the water body further infecting the body. As a result, the richness and composition of the microbial community significantly changed. This study can provide a theoretical basis for the control of MID of bullfrogs.
Introduction
Benefits and challenges of bullfrog farming
Bullfrog, Lithobates catesbeiana, is the most popular large edible frog found globally (Nori et al., 2011). The glands and the bile extracted are of economic value due to the nature of skin, oil, and hormones (Cathers et al., 1997), and play a key role in aquaculture, medicine, and other industries (Bury and Whelan, 1985; Silva et al., 2009). Farmers use various techniques to improve the yield during the rearing of bullfrogs. However, the water body has limited bearing capacity, and the occurrence of diseases is positively correlated with the stocking density. The continuous, large-scale, and hence high-density of bullfrog breeding caused many issues, such as a shortage of biologically healthy food, degradation of germplasm resources (Graves and Anderson, 1987), and deterioration of the breeding environment. The lack of breeding technology has complicated the aforementioned issues. The number of diseases encountered during bullfrog breeding is on the rise becoming more detrimental and resulting in frequent large-scale outbreaks seriously hindering industrial development. The pathogens of bullfrogs that are mainly responsible for diseases include bacteria, viruses, and parasites (Zhe et al., 2013). However, the strains used in aquaculture have usually been derived from wild strains (Kibenge et al., 2012). They may not have had enough time to adapt to high-density confinement in the aquaculture environment (Rodríguez-Ramilo et al., 2011) compared with terrestrial farmed animals. This chronic stress (Yada and Nakanishi, 2002) provides opportunities for the emergence of diseases caused by pathogens that may be harmless under natural conditions. Among several pathogens, Aeromonas hydrophila and A. salmonicida are considered the most common pathogens in freshwater fish, while Vibrio anguillarum and V. parahaemolyticus are the most familiar bacterial pathogens in a marine environment, causing different types of fish diseases such as ulcer disease, carp erythrodermatitis, motile Aeromonas septicemia, and so forth (Lightner, 1985; Martínez Cruz et al., 2012). In December 2021, a strange disease, commonly known as meningitis-like infectious disease (MID), broke out at a bullfrog farm (Figures 1A,B) in Ma’anshan City, Anhui Province. The sick frogs showed symptoms such as head tilt, loss of motor balance, opacity or hyperemia of eye lens, photophobia, and body edema, and even death (Figure 1D).
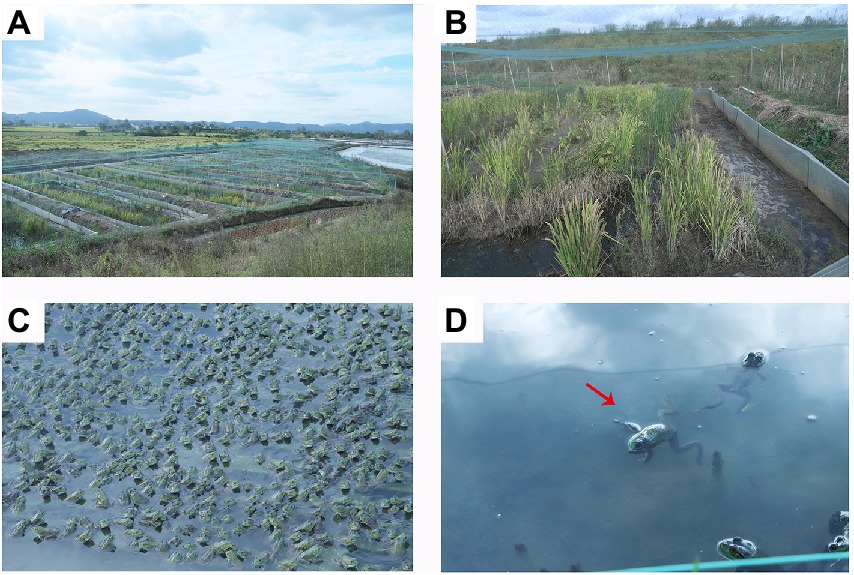
Figure 1. Morphology of the healthy and diseased bullfrogs (Lithobates catesbeiana). (A,B) Farm environment. (C) Breeding density; (D) Morphology of diseased (meningitis-like infectious disease, which causes muscle relaxation in sick frogs) frog morphology (red arrow).
Microbiome and health
Most studies on the gut microbiome have been conducted in mammals, especially laboratory rodents and humans (Kohl and Yahn, 2016). However, studies on the gut microbiome of other vertebrates such as amphibians are lacking (Tong et al., 2019). The composition of frog gut microbiota is affected by season, temperature, and developmental state. Therefore, it is meaningful to study the gut and oral microbes of diseased frogs. The “ecosystem services perspective” treats the microbiota as an ecosystem that provides “services” to humans. Like any ecosystem, the host has some control over the structure of this system and the functional benefits it provides (Shreiner et al., 2015; Foster et al., 2017). The ecosystem services perspective treats the microbiome as an independent ecosystem that provides its host with services required for life and individual well-being (Calow, 1995; Arumugam et al., 2011). Gut microbial communities profoundly influence vertebrate physiology, impacting animal development, nutrition, immune function, and behavior. The gut microbiota are microorganisms (mainly bacteria but also viruses, protozoa, and fungi) and their collective genetic material present in the gastrointestinal tract (Falony et al., 2016). Besides the direct actions on the gut mucosa and enteric nervous system, many chemical mediators produced by the gut microbiome enter the bloodstream and communicate with distal organs such as the brain, heart, and liver (Evans et al., 2013), The symbiotic relationship between microbiota and the host is mutually beneficial. The host provides an important habitat and nutrients for the microbiome, and the gut microbiota support the development of the metabolic system and the maturation of the intestinal immune system by providing beneficial nutrients (D’Argenio and Salvatore, 2015), for example, by the synthesis of vitamins (Kau et al., 2011; Kitamoto et al., 2020) and short-chain fatty acids (Topping and Clifton, 2001; McDermott and Huffnagle, 2014). The oral cavity is a primary gateway to the human body and has the second-largest and most diverse microbiota after the gut, harboring > 770 species of bacteria (Kitamoto et al., 2020). A variety of microbial habitats in the oral cavity (e.g., teeth, buccal mucosa, soft and hard palate, and tongue) makes the ecologic system complex and attracts diverse microorganisms, called the oral microbiome, including bacteria, fungi, and viruses (Kilian, 2018). More than half of microbial species (e.g., Streptococcus and Veillonella) frequently detected in both sites showed evidence of oral–gut translocation, even in healthy individuals (Schmidt et al., 2019). Accumulating evidence indicates that resident oral bacteria can translocate to the gastrointestinal tract through hematogenous and enteral routes. The dissemination of oral microbes to the gut may exacerbate various gastrointestinal diseases, including irritable bowel syndrome, inflammatory bowel disease, and colorectal cancer (Kitamoto et al., 2020).
Meningitis-like infectious disease characteristics and experimental purpose
Meningitis-like infectious disease is a highly contagious and lethal disease for bullfrogs. Once infected, it brings great losses to farmers. In the farmed frogs, the characteristics of MID were anorexia, slow movements, corneal opacity, and a series of neurological symptoms including the onset of torticollis, indifference to stimuli, intermittent motion, and curling up of toes of the limbs. The diseased frogs in this study were lethargic, and most died within a few days. Dissection revealed lesions in multiple internal organs. Histopathological lesions in the liver, spleen, kidney, heart, brain, and muscle of the diseased frogs showed cell degeneration and necrosis (Hu et al., 2017). In these studies about MID, the main pathogens were basically determined to be bacteria of the genus Elizabethkingia (Lei et al., 2019). Relevant cases have been reported in bullfrogs (Mauel et al., 2002), Chinese spiny frogs (Quasipaa spinosa; Lei et al., 2019), black-spotted frogs (Hu et al., 2017; Chang et al., 2021), tiger frogs (Xie et al., 2009), adult northern leopard frogs (Lithobates pipiens), chapa bug-eyed frogs (Theloderma bicolor), Vietnamese warty toads (Bombina microdeladigitora), and Sabana Surinam toads (Pipa parva; Trimpert et al., 2021). This experiment started with gut and oral microbes to examine the differences in the gut and oral microbes between normal and diseased individuals so as to explore the causes of disease outbreaks in bullfrogs raised in Dayutan. The pathogenic-related bacterial communities were revealed through the differences between the biological groups, providing a theoretical basis for the prevention and control of MID in the later stage.
Materials and methods
Oral and gut samples collection
In the study, a total of 10 bullfrogs from Dayutan in Anhui Province in 2021 were prospectively collected. Samples are generally normal, half are sick, and the samples were selected according to the criteria: (1) All samples are from the same culture pond; (2) about the similar size; (3) age < 1 year old; (4) Breeding conditions were the same before collection; The bullfrog was dissected in a sterile environment, and its gut and oral microbiome samples were taken, 10 cases (gut and oral) of sick group (MID), 10 cases (gut and oral) of healthy control group (HC) were finally included in the study and received 16S rDNA amplicon sequencing.
DNA extraction and PCR amplification
Ten bullfrogs were dissected in a sterile environment, the intestines and orals were carefully scraped with a sterile swab, the swabs after sampling were marked, and the water samples were drawn with a 0.22 μm filter membrane in a sterile environment. After filtration, placed the filter membrane in a sterile Ep tube for marking. The genomic DNA of the sample was extracted by CTAB method (Miaomiao et al., 2008), and then the purity and concentration of the extracted DNA were detected by agarose gel electrophoresis.
Library construction and sequencing
PCR amplification of 16S rRNA gene sequences was performed by targeting the V3–V4 regions by using a set of forward and reverse primers according to a previous study (Chen et al., 2022). The sequences of forward and reverse primers used in this experiment were as follows: Pro_341F (5′-ACTCCTACGGGAGGCAGCA-3′) and Pro_806R (5′-GGACTACHVGGGTWTCTAAT- 3′; Nossa et al., 2010). The PCR was carried out in a total volume of 25 μl that contains 2 × KAPA HiFi HotStart Ready Mix (12.5 μl), 400 nM of each primer, ddH2O (7.5 μl) and 3 μl of template DNA. The PCR reaction was carried out in a thermocycler (Px2 Thermal Cycler, Thermo, United States) under the following conditions: initial denaturation at 95°C for 30 s followed by 28 cycles of denaturation at 95°C for 30 s, annealing at 55°C for 30 s and elongation at 72°C for 30 s. The amplicons were confirmed by electrophoresis with 1.5% agarose gel under 110 V for 30 min. After separation using agarose gel electrophoresis, PCR products with expected sizes were purified from the matrix. The amplicons were subjected to sequencing using the pair-end method with the MiSeq Illumina platform (Illumina Inc., San Diego, CA, United States; Quail et al., 2008), following manufacturer instructions. The Nextera XT DNA Library Preparation Kit (Illumina) was used to construct libraries from the isolated DNA.
Operational taxonomic unit (OUT) clustering and species annotation
Using Cutadapt (V1.9.1) cut the low quality part of reads; the sample data were separated from the obtained reads according to Barcode, and the Barcode and primer sequences were truncated to obtain raw reads. The Reads sequence was compared with the species annotation database, the chimera sequence was detected and removed, and the Clean Reads were obtained. All the Clean Reads of all samples were clustered by Uparse software (Uparse v7.0.1001; Edgar, 2013). The sequences were clustered into Operational Taxonomic Units (OTUs), with 97% identity and the sequences with the highest frequency were taken as the representative sequences of OTUs according to the principle of algorithm. Then the species annotation of OTUs sequence was analyzed by Mothur method (Schloss et al., 2009) and SILVA132 SSUrRNA database (Set the threshold to 0.8–1; Apprill et al., 2015), and the taxonomic information was obtained.
Statistical analysis
The differences between groups were compared by calculating the α index (Observed-species, Chao1, Shannon, Simpson) of different groups with t-test. The relative abundance at the genus level was calculated. A Bray–Curtis dissimilarity matrix was calculated based on relative abundance of OTUs and used to perform non-metric multidimensional scaling (NMDS). We used the linear discriminant analysis (LDA) effect size (LEfSe) to identify significant associations between bacterial taxa and different groups. LEfSe can determine the taxonomic units most likely to explain differences between classes by coupling standard tests for statistical signifcancewith additional tests encoding biological consistency and effect relevance (LDA score > 2.0, p < 0.05).
Results
Increased microbiome abundance in the mid group
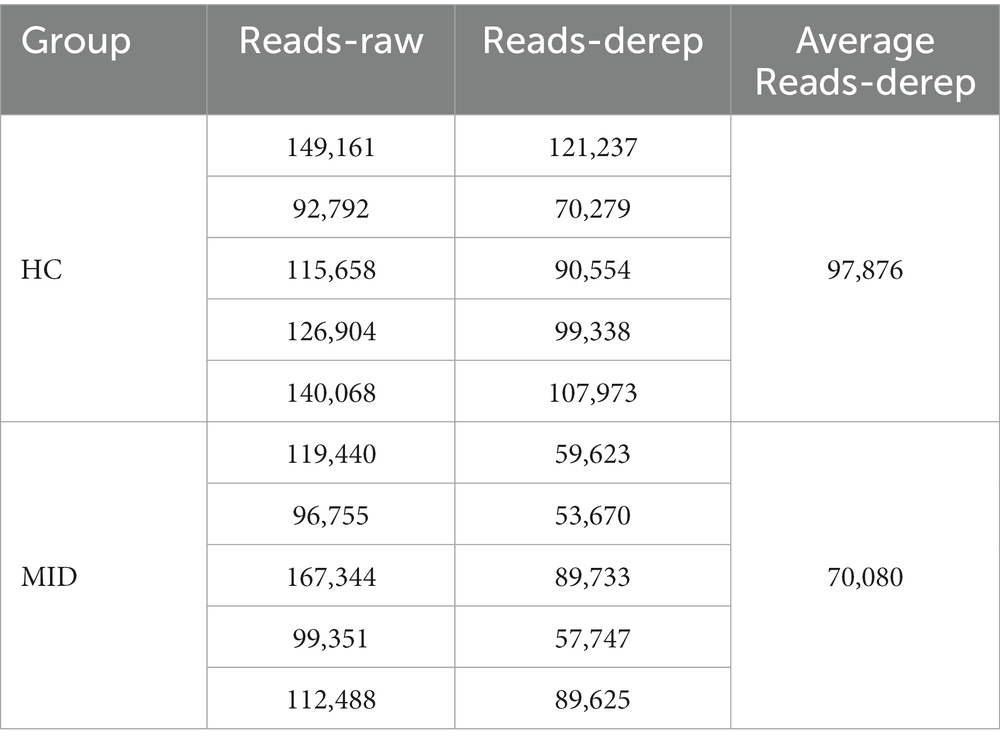
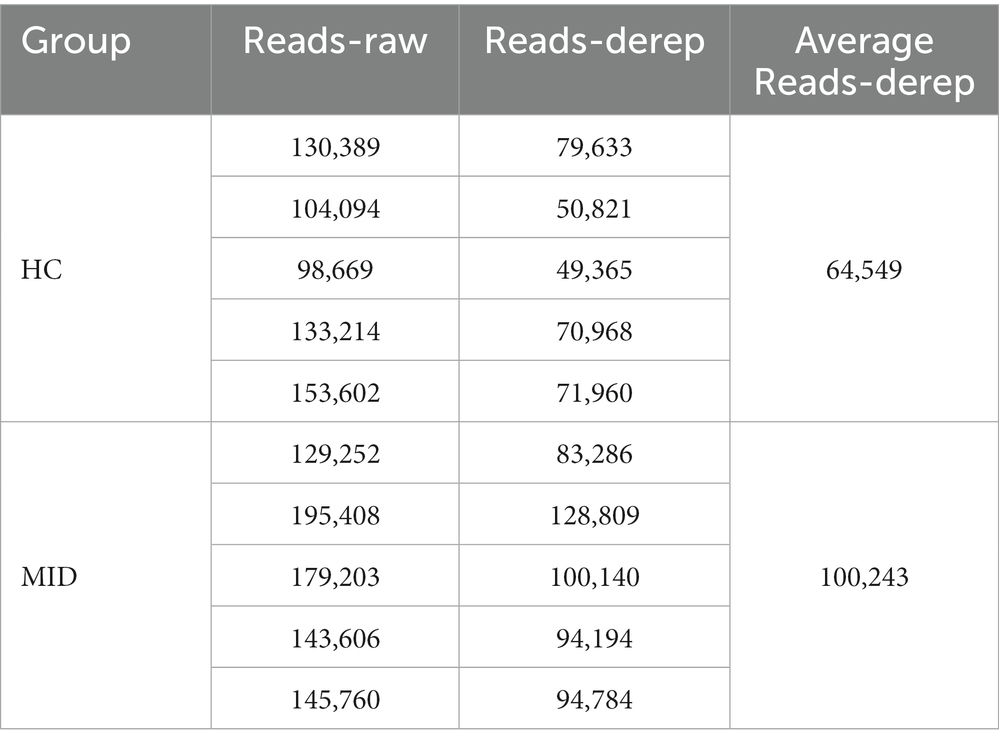
High-throughput sequencing of the 16S rDNA gene V3–V4 region was performed in 20 samples to examine the structure of the gut and oral microbiome. The basic data statistics after sequencing are shown in Tables 1, 2. The accumulation curve analysis showed that the rarefaction curve of the gut (Figure 2A) and oral cavity (Figure 2B) tended to be flat, indicating that the amount of sequencing data was gradually reasonable, and more data would only produce a small number of new species (OTUs). Therefore, the sample size of the study was sufficient, the sequencing depth was up to the standard, and an additional sample size was not required. In the gut cavity, 135 OTUs were obtained; of 78 in the two groups, 45 OTUs were unique to the MID group, and 12 were unique to the HC group (Figure 2C). Further, 299 OTUs were obtained in the oral cavity; of 191 in the two groups, 66 OTUs were unique to the MID group, and 42 were unique to the HC group (Figure 2D).
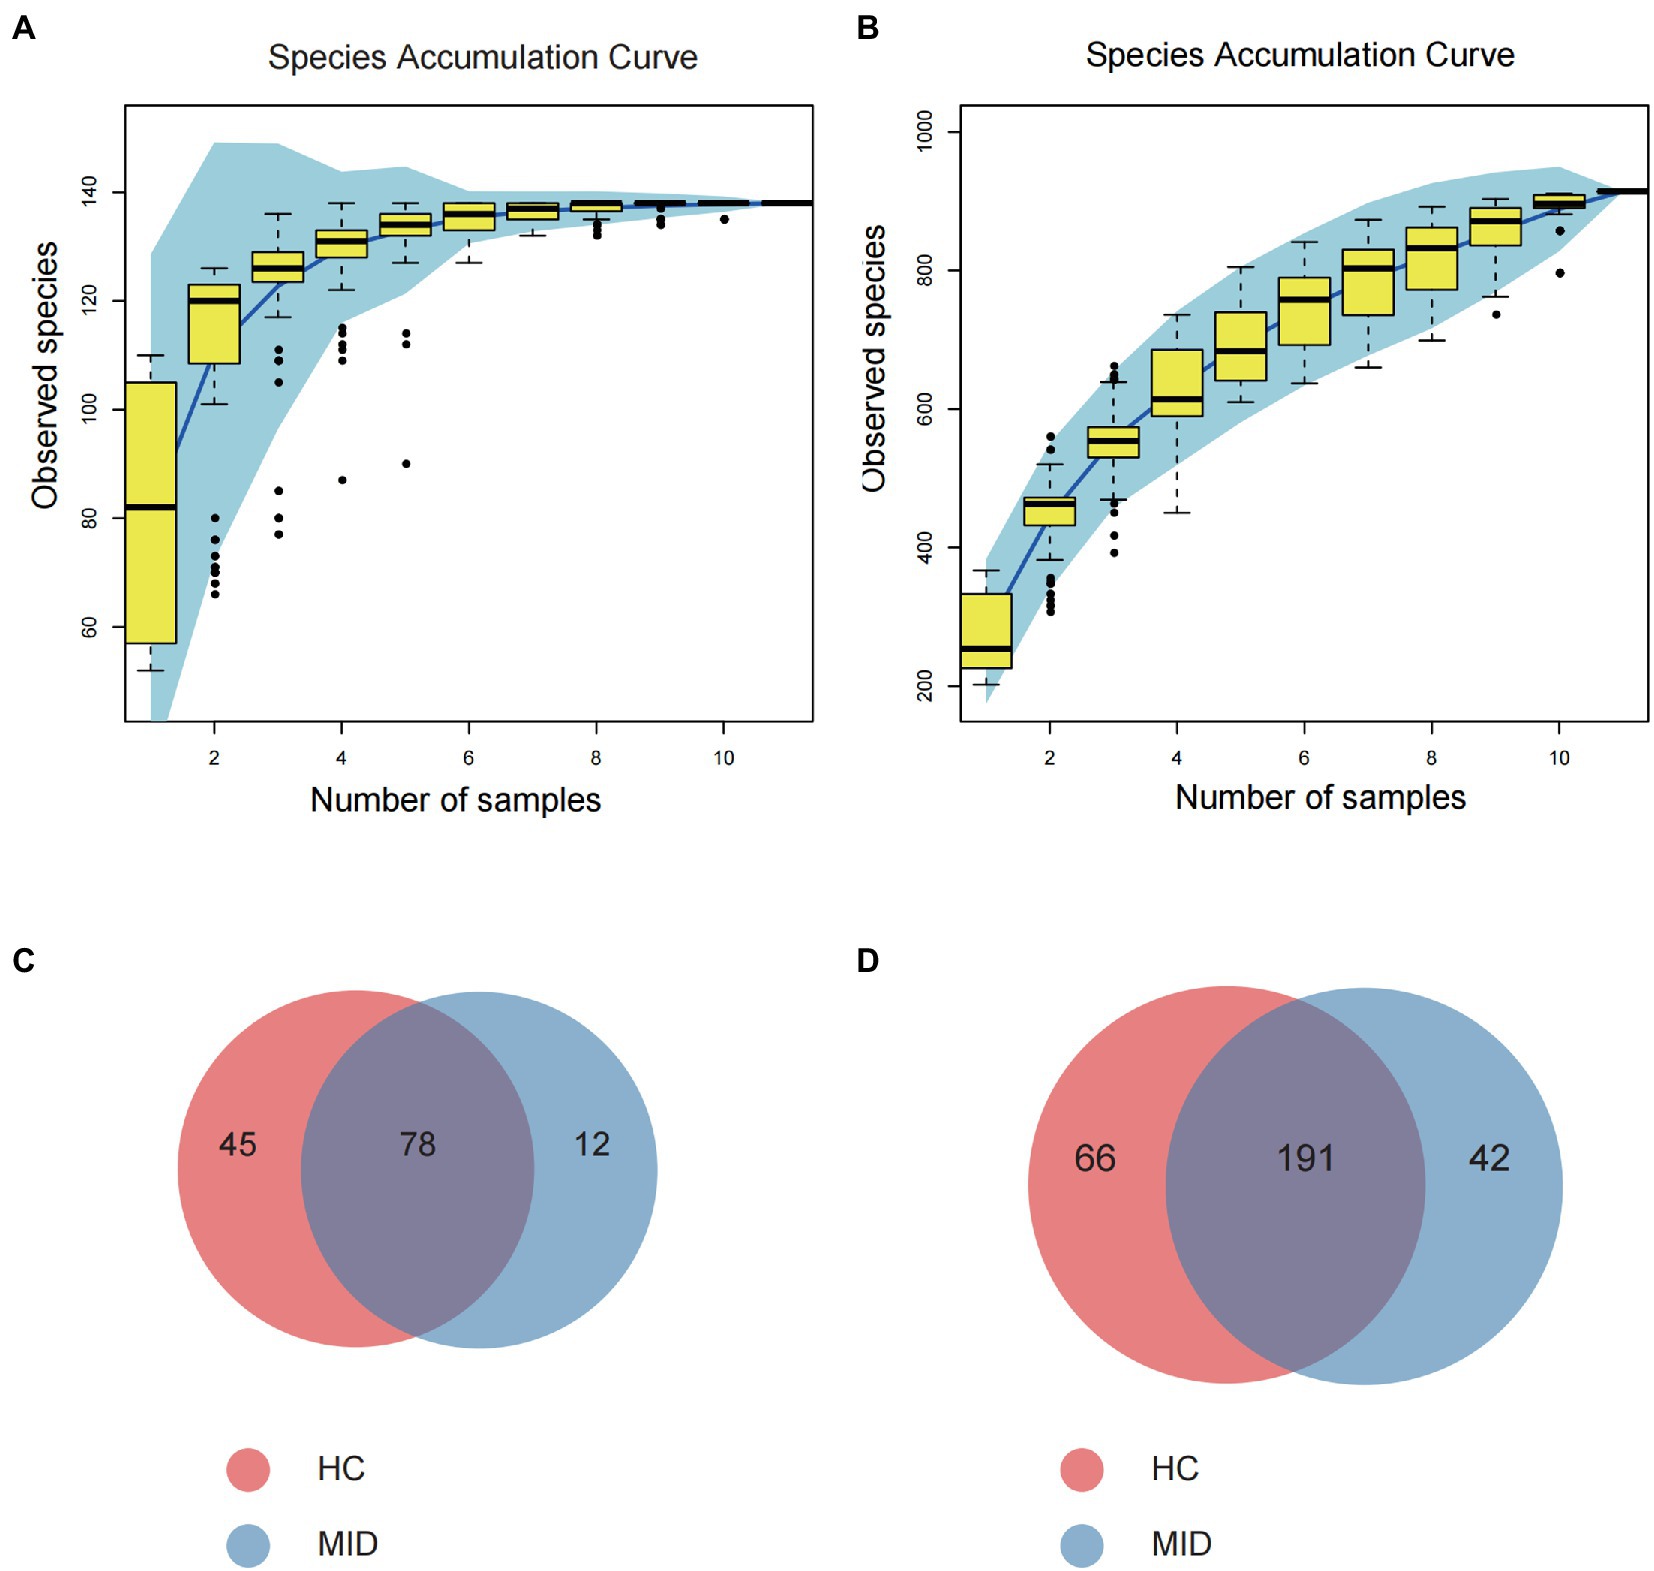
Figure 2. Rationality test of sample number and component difference statistics. Rarefaction Curve, horizontal axis is the number of sequencing strips randomly selected from a sample, and vertical axis is the number of OTU that can be constructed based on the number of sequencing strips, which is used to reflect the sequencing depth. The results showed that with the increase of the sample size, the number of OTU in the gut cavity (A) and oral cavity (B) gradually stabilized, indicating that the sampling number was reasonable. Venn diagram (C,D) showing significantly differential OTU between healthy control (HC) and meningitis-like infectious disease (MID). (C) Shows intestinal results and (D) shows oral results.
Alterations in microbiomes in the mid group
In the oral cavity, the α indexes, observed species (p = 6.014 × 10⁻⁵), Chao1 (p = 1.237 × 10⁻⁵), Shannon (p = 0.001), and Simpson (p = 0.0099; Figures 3A–D), had significant differences. No significant difference was observed in the abundance and evolutionary distance of microorganisms between the HC and MID groups, but a significant difference was observed in the richness and evenness. In the gut cavity, the α indexes were significantly different between the HC and MID groups, including observed species (p = 1.079 × 10⁻⁸), Chao1 (p = 2.439 × 10⁻⁶), Shannon (p = 0.00013), and Simpson (p = 0.0004; Figures 3E–H). Except for Simpson and Shannon, the α indexes had very significant differences. This indicated a large difference in the richness and evenness of microorganisms in the gut cavity between the HC and MID groups.
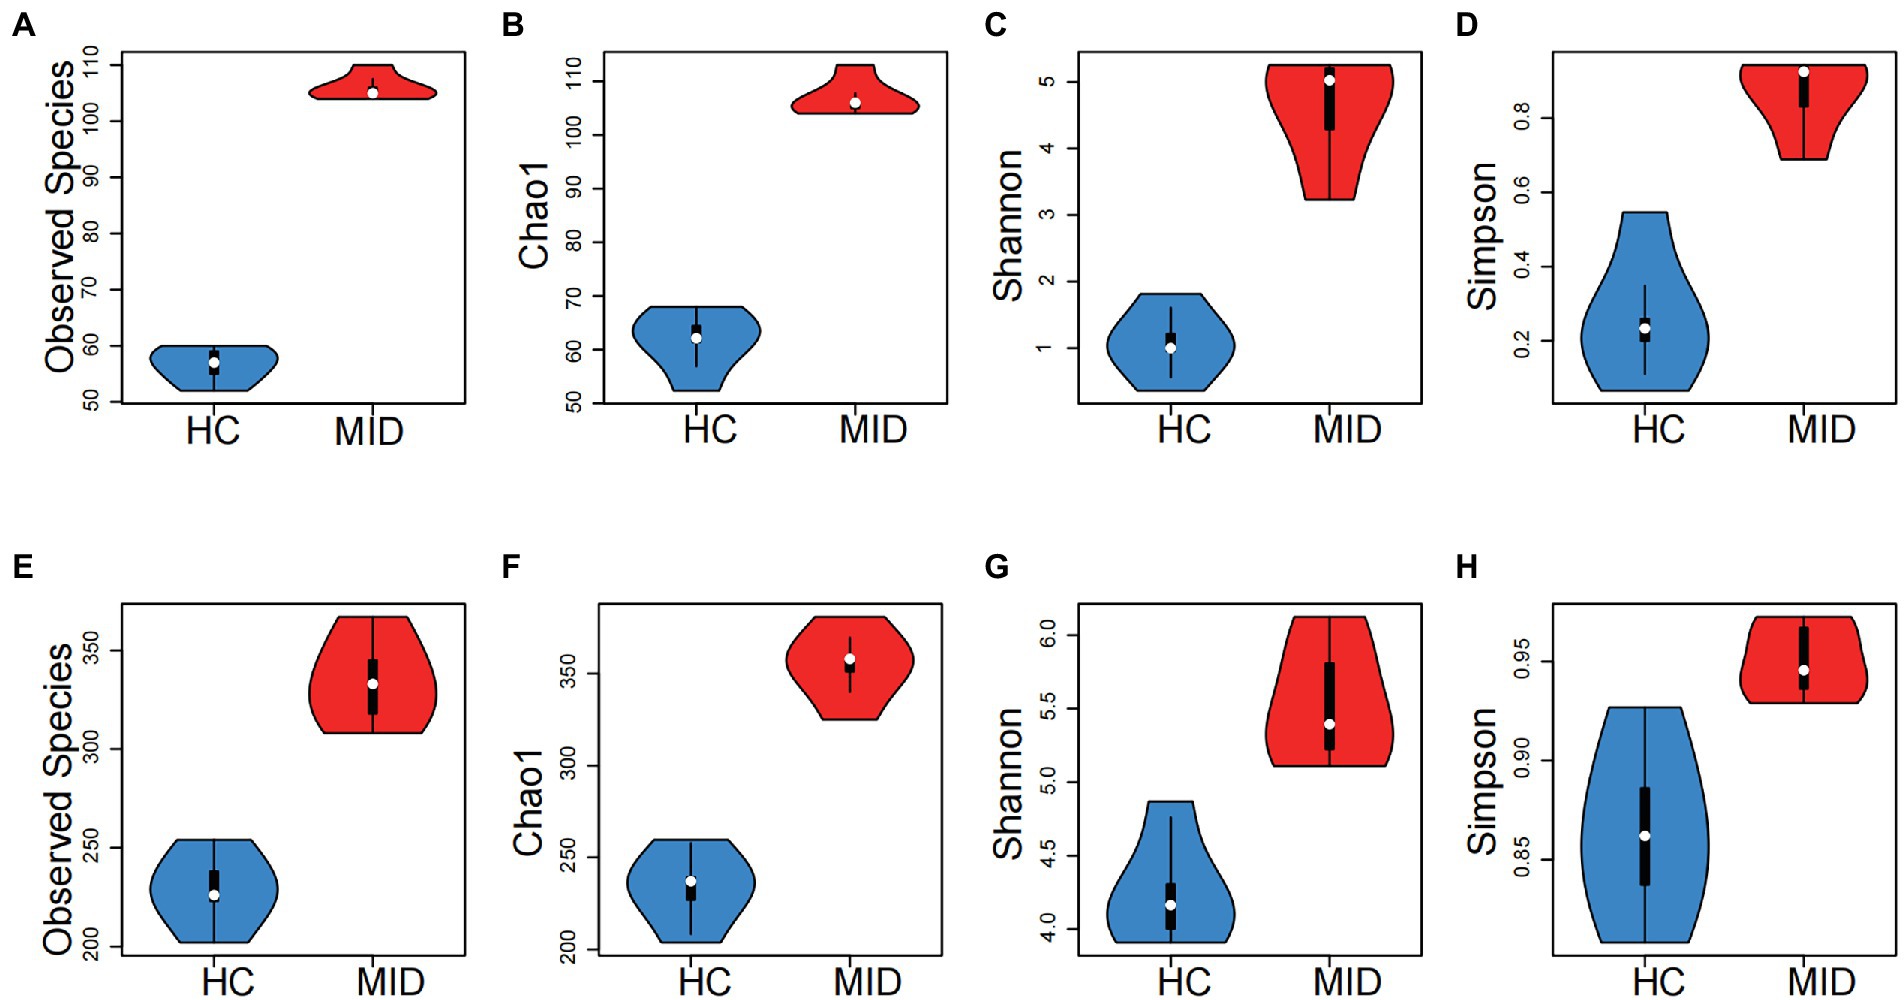
Figure 3. Group differences between oral (A–D) and intestinal (E–H) samples, MID group had significant higher diversity in both oral and intestinal microbiota than that of HC group (p < 0.05 for all tests, t-test). The horizontal axis is the grouping, and the vertical axis is the alpha indexes (Observed specifications, Chao1, Shannon and Simpson). The white point represents the mean value, the outer contour represents the sample distribution, the upper side of the black box in the middle represents the upper 1/4, and the lower side represents the lower 1/4.
Bacterial taxonomic abundance at the phylum and genus levels based on 16S rRNA gene amplicons
The top 15 bacterial phyla in the HC and MID groups were evaluated by examining the changes in the gut and oral microbiota. The results showed that Proteobacteria was the most abundant phylum in the oral cavity in the HC group (Figure 4B), followed by Bacteroidota and Firmicutes. However, the Firmicutes abundance decreased significantly and the Bacteroidota abundance increased significantly in the MID group compared with the HC group. Only eight phyla of microorganisms were found in the gut (Figure 4A). The Firmicutes abundance significantly decreased and the Bacteroidota abundance significantly increased in the MID group, which was consistent with those in the oral cavity. At the genus level, Lactococcus was the dominant bacteria in the gut in the HC group (Figure 4C). However, almost no Lactococcus was found in the MID group, while the relative abundance of Flavobacterium and Acinetobacter increased significantly. The relative abundance of Lactococcus decreased sharply and the relative abundance of Flavobacterium and Acinetobacter increased significantly in the MID group, which was consistent with the abundance in the oral cavity (Figure 4D). Different from the oral manifestations, Flavobacterium and Acinetobacter were the dominant bacteria in the intestinal tract in the MID group.
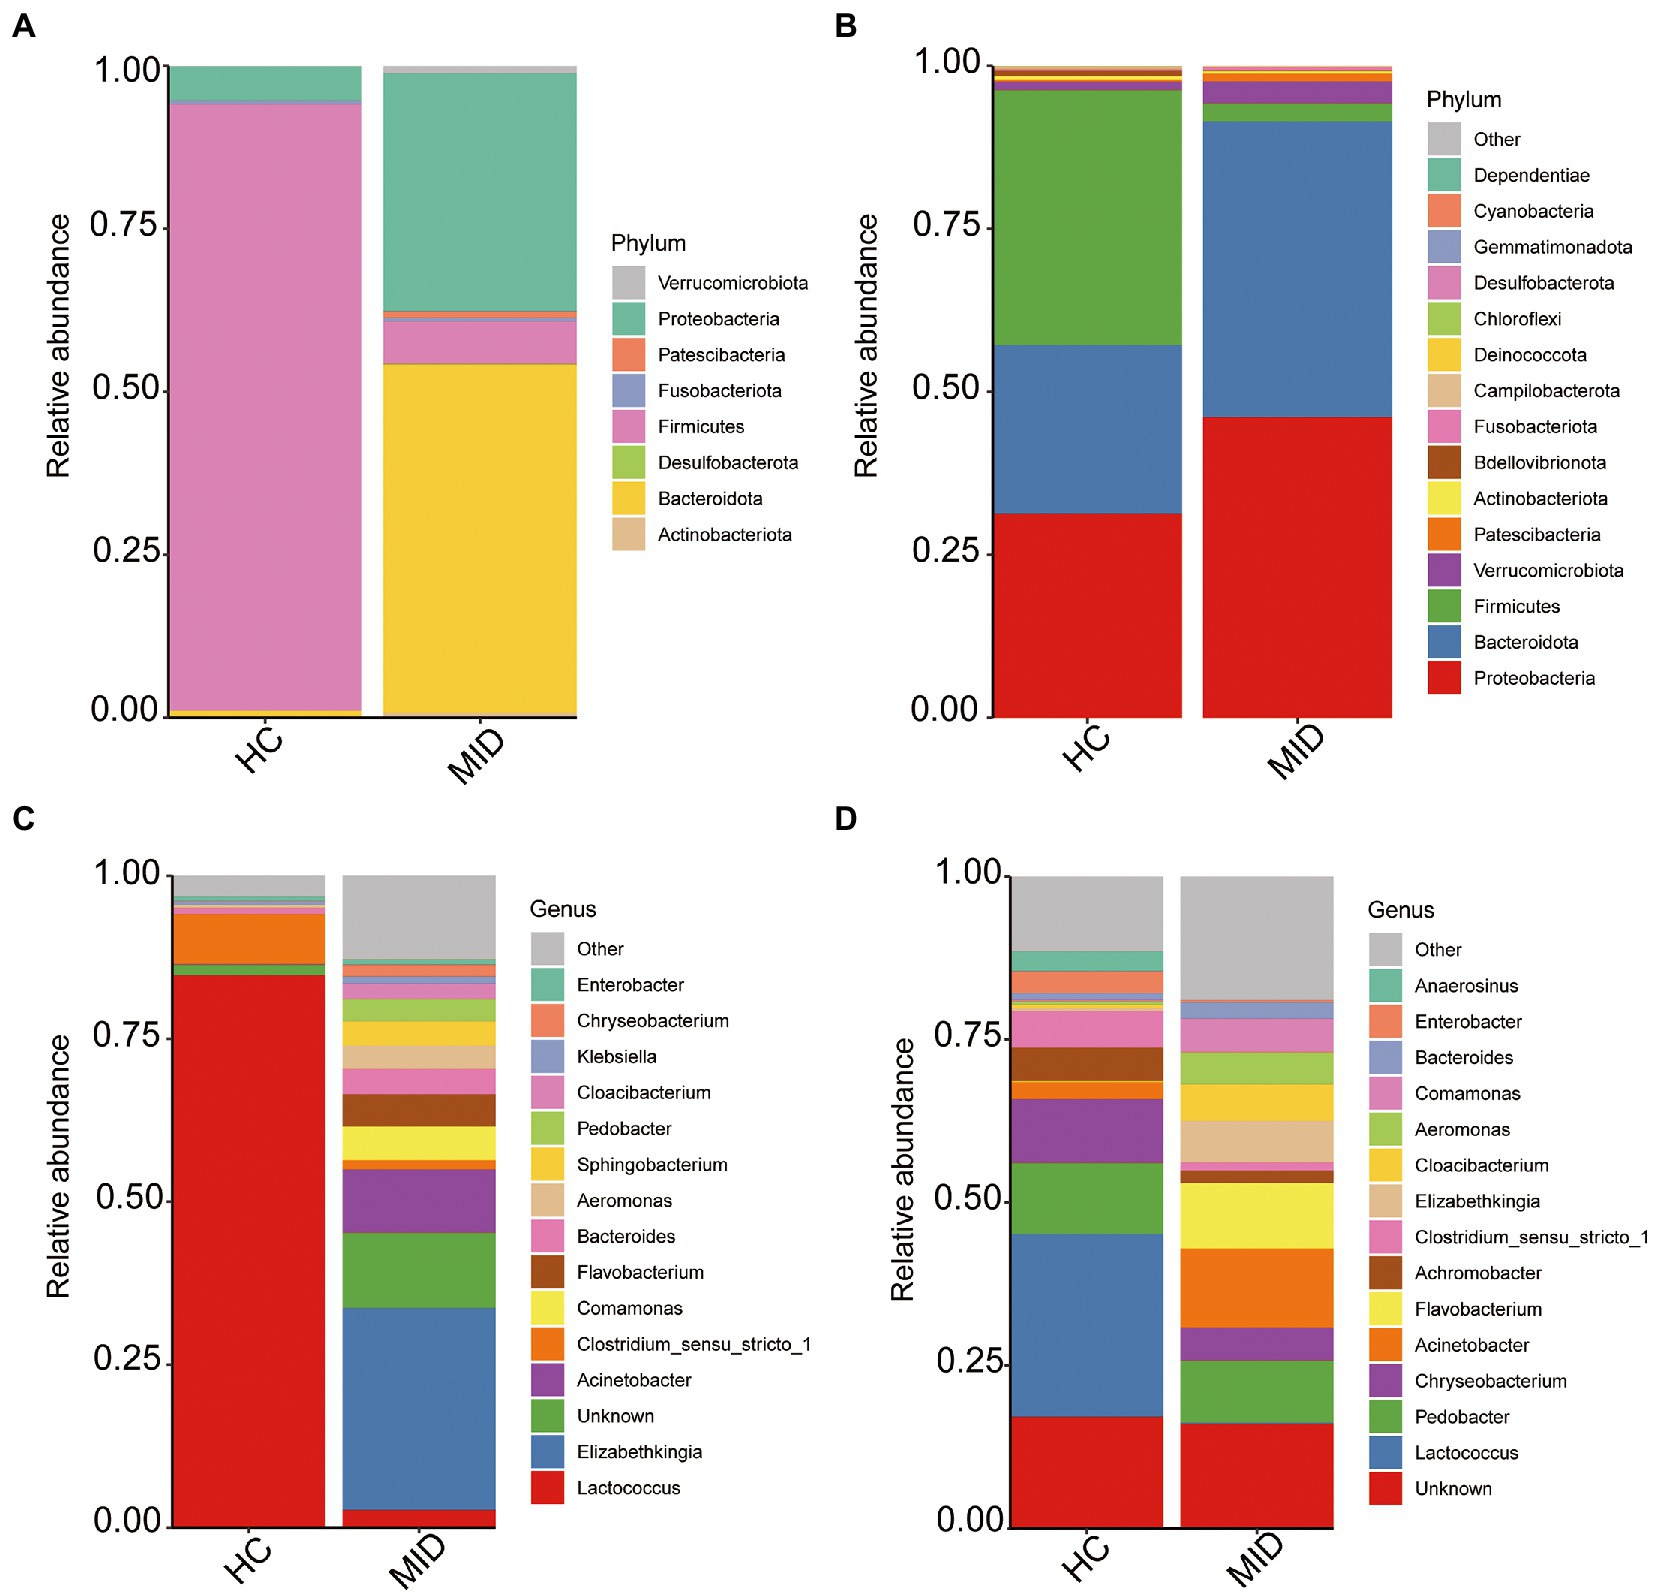
Figure 4. Average relative abundance of phylum and gene levels. The top 15 phylum (A,B), and genus (C,D), with the highest abundance in each group were presented and the rest were set to others.
We considered the relative abundances of the top 35 genera of the samples to determine the microbiota of high abundance. The microbiota of high abundance analysis revealed that Gracilibacteria, Hydrogenophaga, Undibacterium, Aeromonas, Chryseobacterium, Shewanella, Bacteroides, Stenotrophomonas, Ideonella, Flavobacterium, Pedobacter, Anoxybacillus, Brevundimonas, Enhydrobacter, Acinetobacter, and Elizabethkingia were the microbiota of high abundance in the gut in the MID group (Figure 5A). The microbiota of high abundance were Flectobacillus, Cloacibacterium, Acinetobacter, Elizabethkingia, Enhydrobacter, Cetobacterium, Bacteroides, and Aeromonas in the oral cavity (Figure 5B) in the MID group. Elizabethkingia, Enhydrobacter, Bacteroides, and Aeromonas were found in the oral cavity and gut. It was observed that the oral flora structure had changed during the disease process, and excessive reproduction of some pathogenic bacteria had inhibited the structure of the original healthy flora. The structure of the intestinal flora also changed in the gut tract due to the excessive reproduction of pathogenic bacteria. Further, the abundance of pathogenic bacteria overexpressed in the intestinal tract was much higher than that in the oral cavity in the HC group.
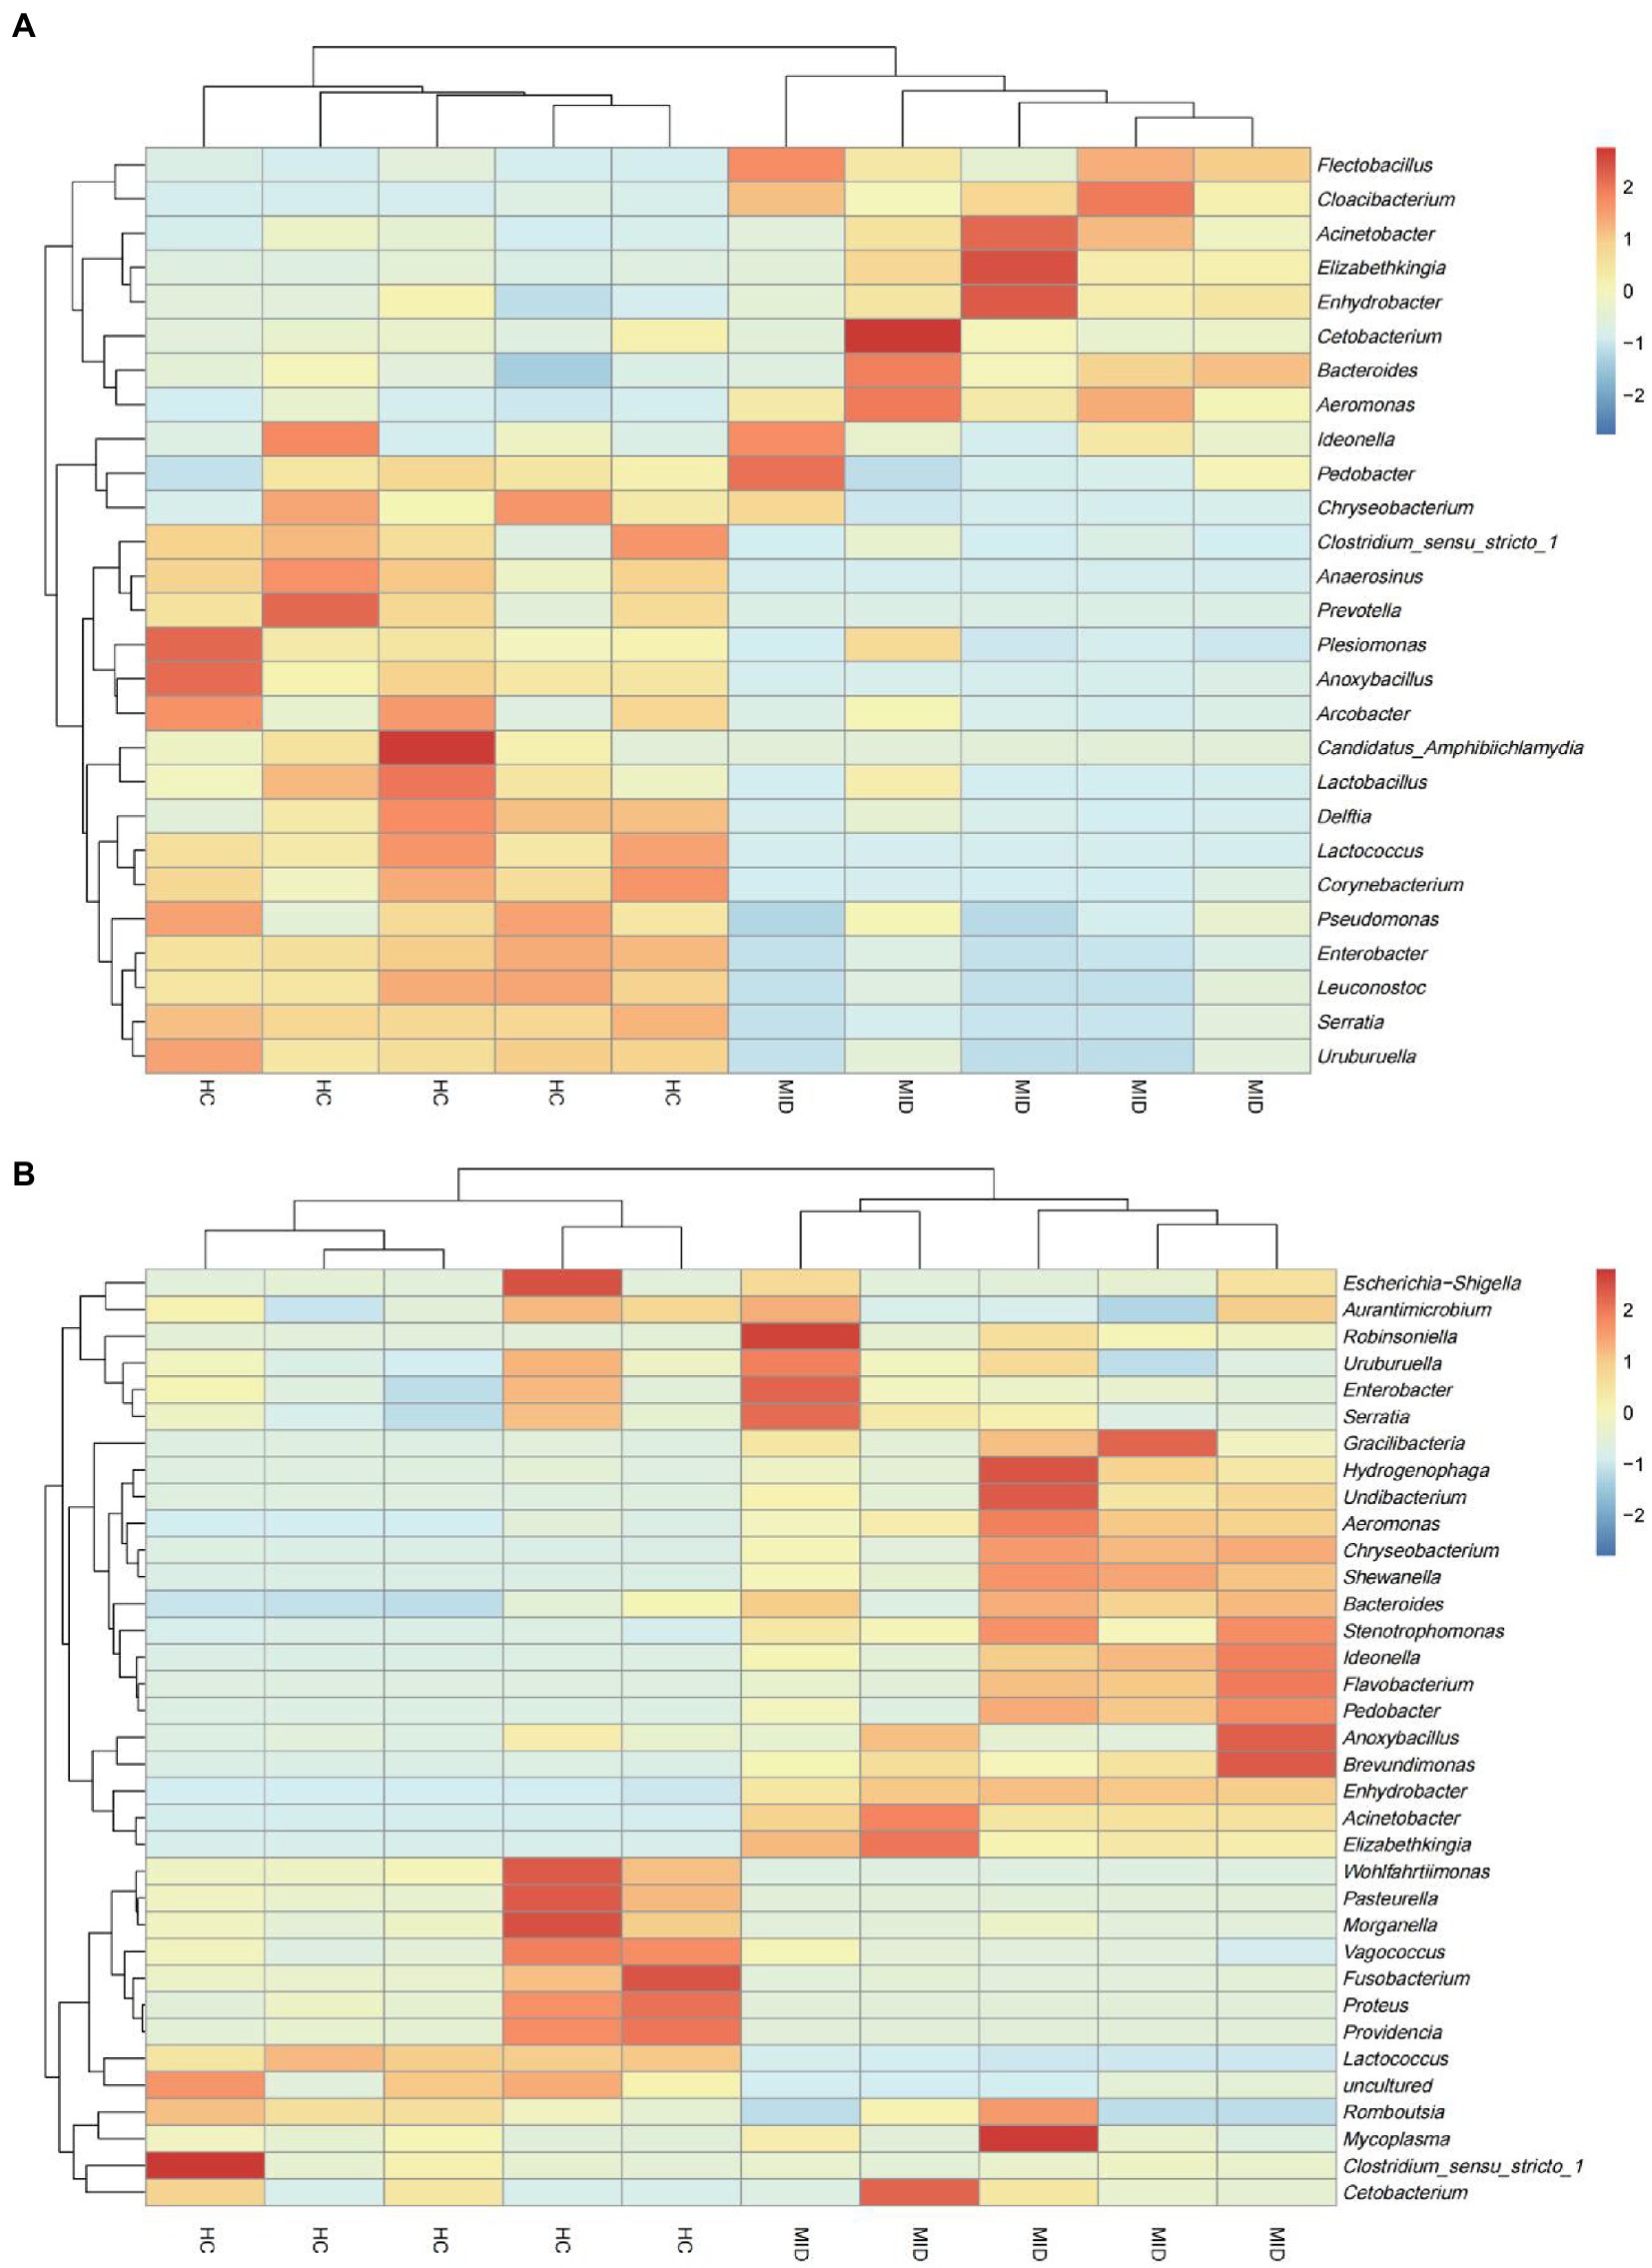
Figure 5. Heat map of the genus of top 35 microbiota in the HC and MID groups. Differences in relative abundance at genus level in different samples. Heat map showed the difference in annotated gene abundance at genus level among groups (showing the relative abundance of the top 35 genus). The row clustering distance method is Pearson correlation, and the default is Euclidean distance. Columns represent a sample and rows represent a genus. Based on the average relative abundance of the genus in the same sample, the expression level higher than the average value is positive and marked in red; on the contrary, the expression level below the average value is negative and marked in blue. The shade of color indicates the degree of difference between the relative abundance and the mean. The dendrogram above the main body of the heatmap clusters the source of the samples, which is convenient for distinguishing different samples (normal and diseased); the dendrogram on the left of the heatmap clusters the relative abundance of genera, and groups the genera with similar relative abundance to For one class, the color difference is more pronounced. In the gut (A), genera with high relative abundance were concentrated in the diseased group, and in the oral cavity (B), genera with high relative abundance were concentrated in the normal group.
Differences in the microbial community structure between HC and mid groups
Non-metric multidimensional scaling (NMDS) showed the structural differences in the microbiota based on two groups. Bray–Curtis showed that gut (Figure 5A) and oral (Figure 5B) microbiota were differentially distributed in the MID and HC groups. Hence, the microbiota of both oral cavity and gut segments could be divided into two distinct groups, and the two groups displayed apparent differences (stress = 0.0012 and 0.0131, respectively).
In the gut, the LEfSe analysis showed that 16 microbial clades exhibited significant differences between the MID and HC groups (Figure 6A). In the HC group, Firmicutes and Bacilli were highly abundant. In the MID group, Bacteroidota had the highest LDA score. In the oral cavity, the LEfSe analysis showed that 14 microbial clades exhibited significant differences between the MID and HC groups (Figure 6B). In the HC group, Firmicutes and Bacilli were highly abundant. In the MID group, Bacteroidota had the highest LDA score (Figure 7).
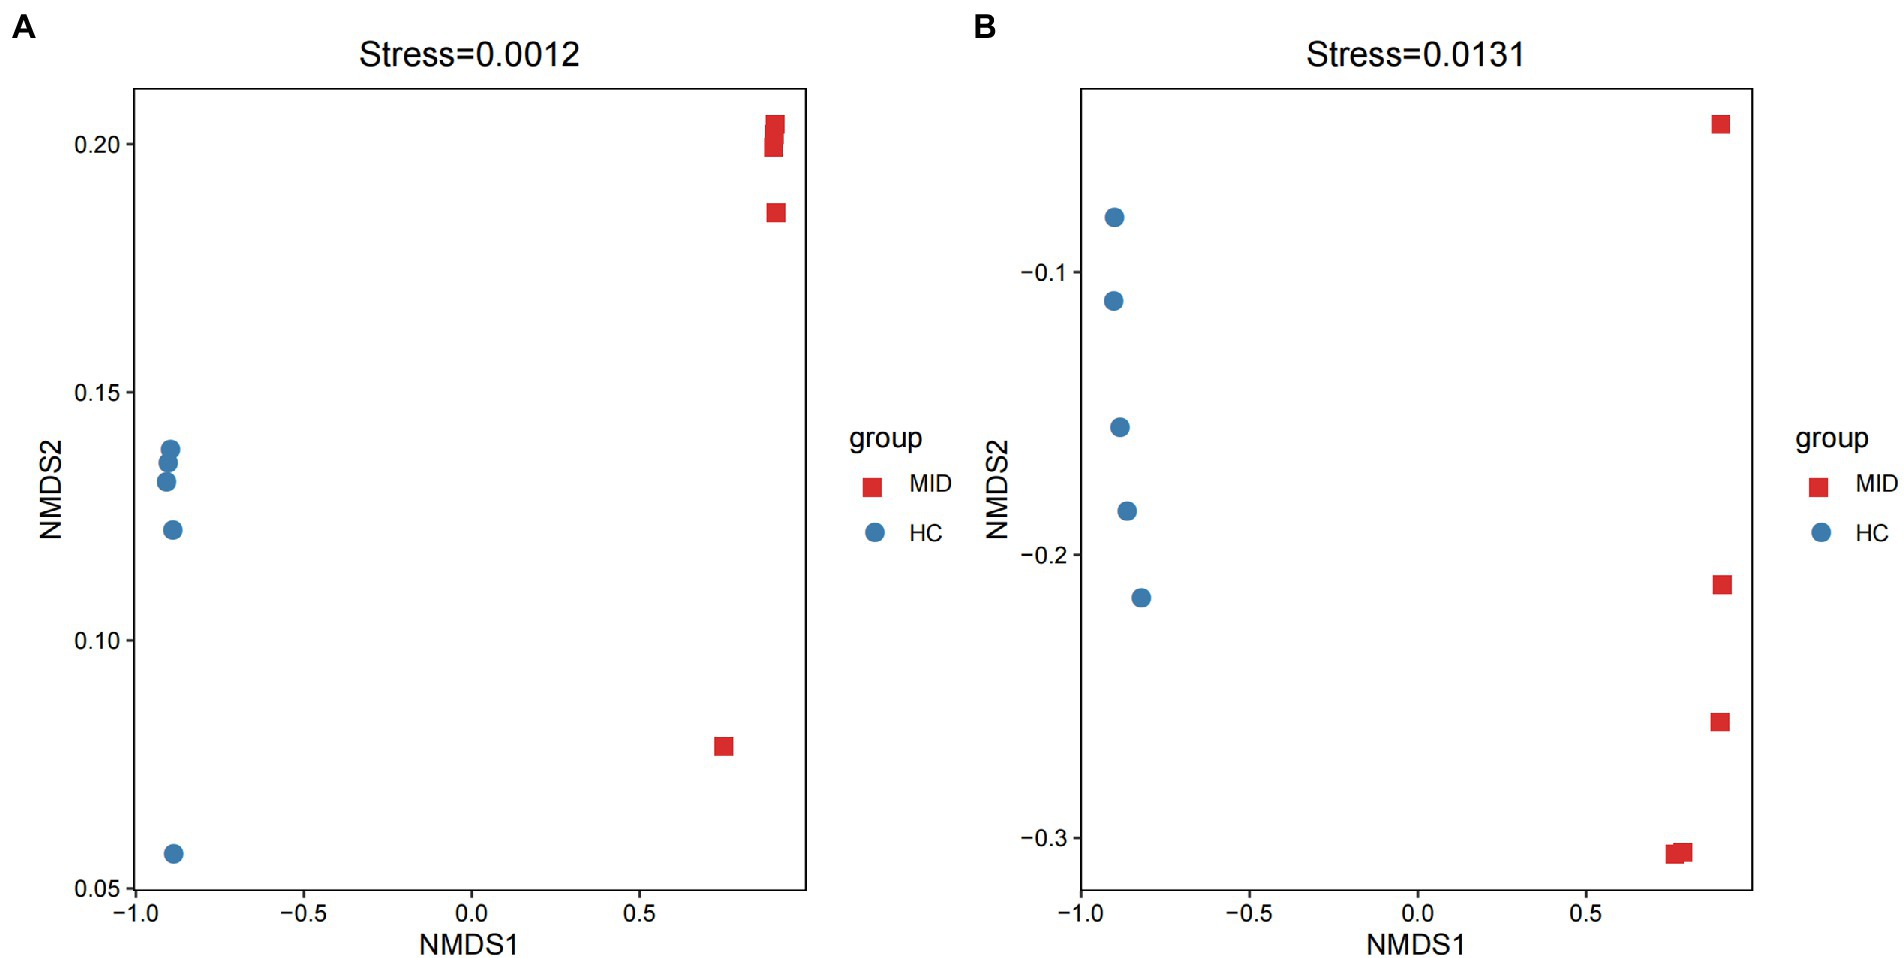
Figure 6. Non-metric multidimensional scaling (NMDS) of the microbial communities of different groups. Both gut (A) and oral (B), all samples can be divided into two categories according to MID and HC.
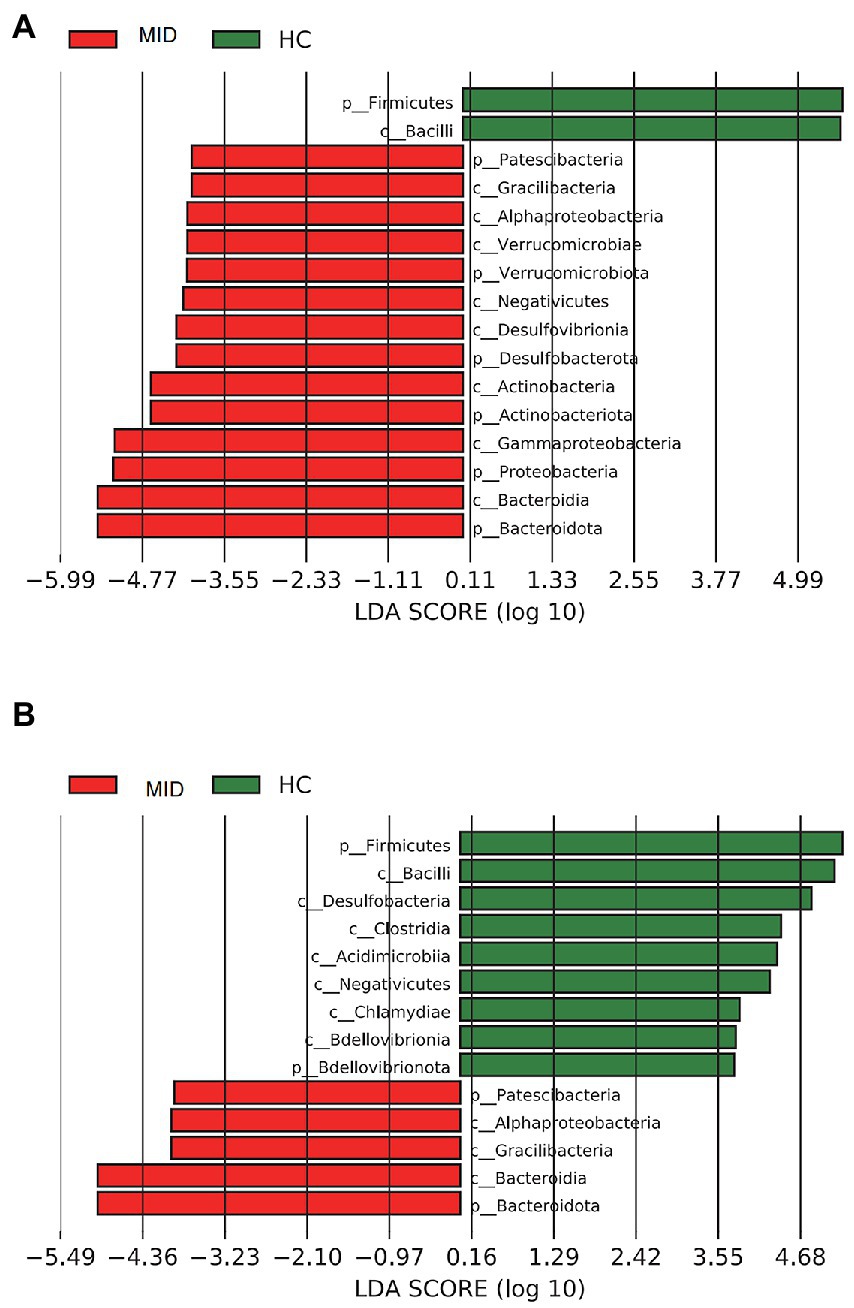
Figure 7. Bacterial of different levels in MID and HC. Samples from MID and HC were compared using LEfSe; the bars depict bacterial with significantly different relative abundance. Bars represent linear discriminant analysis (LDA) scores. A is from a gut sample and B is from an oral sample.
Discussion
In this study, 16S amplicon sequencing was used to detect the differences in gut and oral microbiota composition and population numbers of diseased and normal bullfrogs to find the pathogenic bacteria that caused the disease in bullfrogs.
Differences in microbiome structure
In humans, there are many reports of disease and gut microbes. For example, chronic kidney disease (CKD) will reduce the richness, uniformity and uniformity of intestinal microorganisms (Loomba et al., 2017); Non-alcoholic fatty liver disease (NAFLD) will reduce the diversity of intestinal microorganisms α and β (Astbury et al., 2020). But we calculated the relative abundance of oral and gut microorganisms in normal and diseased frogs and we were found that the diversity, uniformity and richness of the flora in MID increased. It might be due to the decline in the immune function of the body declined after the pathogenic bacteria infected the body resulting in some conditional pathogenic bacteria in the water body, further infecting the body. Thus, the richness of the microbial community increased.
The 16S rRNA gene amplicon sequencing could be used to determine the genetic composition and community function of all microorganisms in environmental samples (Goldfeder et al., 2017). In our study, the results of 16S rRNA gene amplicon sequencing showed that the Chao1 indexes slightly increased in the HC group compared with the MID group, but with no significant difference. Previous studies showed that a balanced gut microbial structure was an important guarantee for the health of an organism. Once the gut microbiota is unbalanced, it causes a variety of diseases; the beneficial bacteria in the gut are the key to maintain the balance of the gut microbial population structure (Qi et al., 2019). In the HC group, the abundance of Bacteroidetes and Firmicutes accounted for 97% of the total bacteria. Lactococcus has been used in dairy fermentation for centuries. These Gram-positive, generally nonpathogenic, nonmotile, and nonsporulating bacteria are members of the Streptococcaceae family, which includes food, commensal, and virulent species. Many probiotics in this genus are beneficial to the survival of the host. Most widely used probiotic bacteria belong to the Lactobacillus and Bifidobacteria genera, but other microorganisms, such as Lactococcus and Enterococcus, are also used as the components of probiotic preparations (Kim et al., 2019).
Elizabethkingia—potential pathogenic bacteria
Currently, the reports only clarified that Elizabethkingia was a pathogenic bacteria, but did not explain the structural and functional changes in microorganisms after infection. In this study, the relative abundance of Elizabethkingia was significantly higher in the MID group than in the HC group. Our study showed that the abundance of Elizabethkingia increased significantly in the MID group compared with the HC group. Many studies showed various pathogenic bacteria of the genus Elizabethkingia, which could cause diseases in amphibians, reptiles, and even humans. Elizabethkingia meningoseptica was detected in tiger frogs with cataracts (Monteagudo-Mera et al., 2011), suggesting that it could cause disease in tiger frogs. Its symptoms are the same as those of the sick frogs in this study. E. meningoseptica has been reported to cause severe sepsis in humans (Xie et al., 2009). Cases of E. meningoseptica causing patient shock have also been reported, suggesting that species in this genus cause disease in humans. The genus Elizabethkingia has six species, two of which have been reported to be pathogenic to organisms; meningitis-like symptoms occur in both cases. Amphibians and mammals are infected by the bacteria, but no infection in reptiles has been reported. It is believed that the bacteria may also infect species similar to crocodiles and other aquatic reptiles, which will be the focus of future investigations. However, in this study, the lack of basic information such as body weight and blood routine led to the inability to analyze the differences in physiological indicators between MID and HC. In future studies, we should pay attention to recording basic data to make the research content more complete.
Conclusion
The structure of the oral and intestinal flora of diseased frogs changed significantly. Also, the Elizabethkingia abundance increased remarkably, implying that the presence of Elizabethkingia might cause diseases in frogs. Further, the proliferation of other bacteria after the illness also further exacerbated the deterioration of the disease. It showed a significant increase in the diversity of microbiomes in both the oral cavity and the intestinal tract after the illness. It might be due to the decline in the immune function of the body after the pathogenic bacterial infection, leading to some conditional pathogenic bacteria in the water body further infecting the body and resulting in an increase in the richness of the microbial community.
Data availability statement
The original contributions presented in the study are publicly available. This data can be found here: NCBI, PRJNA896736.
Author contributions
TP led the research team. TP, LS, and WL designed the research. WL, GF, KS, EL, and TP collected samples. WL, GF, and TP performed research. WL, JRL, JYL, YW, and KS analyzed data. WL, GF, and KS wrote the paper. All authors contributed to the article and approved the submitted version.
Funding
This work was supported by National Natural Science Foundation of China (No. 31872253), Anhui Natural Science Foundation (Youth, 1908085QC127), Outstanding Innovative Research Team for Molecular Enzymology and Detection in Anhui Provincial Universities (2022AH010012), Research start-up funds of Anhui Normal University (No. 751865), Province and Student Innovation and Entrepreneurship Training Program, Anhui Forestry Science and Technology Innovation Project (AHLYCX-2021-01).
Acknowledgments
We thank Liuyang Yang for their help in the wild survey of; thank Jiayue Yang and Naijing Zhang for their help in data analysis. We thank three reviewers for their suggestions. We thanks Dayutan bullfrog farm for supporting the sampling work. Lastly, I thank to my family for their academic support.
Conflict of interest
The authors declare that the research was conducted in the absence of any commercial or financial relationships that could be construed as a potential conflict of interest.
Publisher’s note
All claims expressed in this article are solely those of the authors and do not necessarily represent those of their affiliated organizations, or those of the publisher, the editors and the reviewers. Any product that may be evaluated in this article, or claim that may be made by its manufacturer, is not guaranteed or endorsed by the publisher.
Supplementary material
The Supplementary material for this article can be found online at: https://www.frontiersin.org/articles/10.3389/fmicb.2023.1126195/full#supplementary-material
References
Apprill, A., McNally, S., Parsons, R., and Weber, L. (2015). Minor revision to V4 region SSU rRNA 806R gene primer greatly increases detection of SAR11 bacterioplankton. Aquat. Microb. Ecol. 75, 129–137. doi: 10.3354/ame01753
Arumugam, M., Raes, J., Pelletier, E., Le Paslier, D., Yamada, T., Mende, D. R., et al. (2011). Enterotypes of the human gut microbiome. Nature 473, 174–180. doi: 10.1038/nature09944
Astbury, S., Atallah, E., Vijay, A., Aithal, G. P., Grove, J. I., and Valdes, A. M. (2020). Lower gut microbiome diversity and higher abundance of proinflammatory genus Collinsella are associated with biopsy-proven nonalcoholic steatohepatitis. Gut Microbes 11, 569–580. doi: 10.1080/19490976.2019.1681861
Bury, R. B., and Whelan, J. A. (1985). Ecology and Management of the Bullfrog. Vol. 155, US Department of the Interior. Washington, DC: Fish and Wildlife Service.
Calow, P. (1995). “Ecosystem health—a critical analysis of concepts” in Evaluating and Monitoring the Health of Large-scale Ecosystems (Berlin: Springer), 33–41.
Cathers, T., Lewbart, G. A., Correa, M., and Stevens, J. B. (1997). Serum chemistry and hematology values for anesthetized American bullfrogs (Rana catesbeiana). J. Zoo Wildl. Med. 28, 171–174.
Chang, L., Zhao, T., Zhao, C., Zhu, W., Xu, L., Liu, J., et al. (2021). Microbiomic and transcriptomic insight into the pathogenesis of meningitis-like disease in cultured Pelophylax nigromaculatus. Aquaculture 530:735736. doi: 10.1016/j.aquaculture.2020.735736
Chen, J.-S., Tsai, H.-C., Hsu, Y.-L., Nagarajan, V., Su, H.-Y., Hussain, B., et al. (2022). Comprehensive assessment of bacterial communities and their functional profiles in the Huang gang creek in the Tatun volcano group basin, Taiwan using 16S rRNA amplicon sequencing. Ecotoxicol. Environ. Saf. 234:113375. doi: 10.1016/j.ecoenv.2022.113375
D’Argenio, V., and Salvatore, F. (2015). The role of the gut microbiome in the healthy adult status. Clin. Chim. Acta 451, 97–102. doi: 10.1016/j.cca.2015.01.003
Edgar, R. C. (2013). UPARSE: highly accurate OTU sequences from microbial amplicon reads. Nat. Methods 10, 996–998. doi: 10.1038/nmeth.2604
Evans, J. M., Morris, L. S., and Marchesi, J. R. (2013). The gut microbiome: the role of a virtual organ in the endocrinology of the host. J. Endocrinol. 218, R37–R47. doi: 10.1530/JOE-13-0131
Falony, G., Joossens, M., Vieira-Silva, S., Wang, J., Darzi, Y., Faust, K., et al. (2016). Population-level analysis of gut microbiome variation. Science 352, 560–564. doi: 10.1126/science.aad3503
Foster, K. R., Chluter, J. S., Oyte, K. Z. C., and Rakoff-Nahoum, S. (2017). The evolution of the host microbiome as an ecosystem on a leash. Nature 548, 43–51. doi: 10.1038/nature23292
Goldfeder, R. L., Wall, D. P., Khoury, M. J., Ioannidis, J. P., and Ashley, E. A. (2017). Human genome sequencing at the population scale: a primer on high-throughput DNA sequencing and analysis. Am. J. Epidemiol. 186, 1000–1009. doi: 10.1093/aje/kww224
Graves, B. M., and Anderson, S. H. (1987). Habitat Suitability Index Models: Bullfrog. Washington, DC: National Ecology Center, fish and wildlife service, US Department of the Interior
Hu, R., Yuan, J., Meng, Y., Wang, Z., and Gu, Z. (2017). Pathogenic Elizabethkingia miricola infection in cultured black-spotted frogs, China, 2016. Emerg. Infect. Dis. 23:2055. doi: 10.3201/eid2312.170942
Kau, A. L., Ahern, P. P., Griffin, N. W., Goodman, A. L., and Gordon, J. I. (2011). Human nutrition, the gut microbiome and the immune system. Nature 474, 327–336. doi: 10.1038/nature10213
Kibenge, F., Godoy, M. G., Fast, M., Workenhe, S., and Kibenge, M. (2012). Countermeasures against viral diseases of farmed fish. Antivir. Res. 95, 257–281. doi: 10.1016/j.antiviral.2012.06.003
Kilian, M. (2018). The oral microbiome–friend or foe? Eur. J. Oral Sci. 126, 5–12. doi: 10.1111/eos.12527
Kim, S.-K., Guevarra, R. B., Kim, Y.-T., Kwon, J., Kim, H., Cho, J. H., et al. (2019). Role of probiotics in human gut microbiome-associated diseases. J. Mol. Biol. 29, 1335–1340. doi: 10.4014/jmb.1906.06064
Kitamoto, S., Nagao-Kitamoto, H., Hein, R., Schmidt, T., and Kamada, N. (2020). The bacterial connection between the oral cavity and the gut diseases. J. Dent. Res. 99, 1021–1029. doi: 10.1177/0022034520924633
Kohl, K. D., and Yahn, J. (2016). Effects of environmental temperature on the gut microbial communities of tadpoles. Environ. Microbiol. 18, 1561–1565. doi: 10.1111/1462-2920.13255
Lei, X. P., Yi, G., Wang, K. Y., OuYang, P., Chen, D. F., Huang, X. L., et al. (2019). Elizabethkingia miricola infection in Chinese spiny frog (Quasipaa spinosa). Transbound. Emerg. Dis. 66, 1049–1053. doi: 10.1111/tbed.13101
Lightner, D. V. (1985). A review of the diseases of cultured penaeid shrimps and prawns with emphasis on recent discoveries and developments. SEAFDEC Aquaculture Departments.
Loomba, R., Seguritan, V., Li, W., Long, T., Klitgord, N., Bhatt, A., et al. (2017). Gut microbiome-based metagenomic signature for non-invasive detection of advanced fibrosis in human nonalcoholic fatty liver disease. Cell Metab. 30:e1055. doi: 10.1016/j.cmet.2019.08.002
Martínez Cruz, P., Ibáñez, A. L., Monroy Hermosillo, O. A., and Ramírez Saad, H. C. (2012). Use of probiotics in aquaculture. Int. Sch. Res. Notices 2012:13. doi: 10.5402/2012/916845
Mauel, M. J., Miller, D. L., Frazier, K. S., and Hines, M. E. (2002). Bacterial pathogens isolated from cultured bullfrogs (Rana castesbeiana). J. Vet. Diagn. Investig. 14, 431–433. doi: 10.1177/104063870201400515
McDermott, A. J., and Huffnagle, G. B. (2014). The microbiome and regulation of mucosal immunity. Immunology 142, 24–31. doi: 10.1111/imm.12231
Miaomiao, Y., Guangcheng, W., Xiaohong, P., Huailei, M., and Weizhen, L. (2008). A method suitable for extracting genomic DNA from animal and plant-modified CTAB method. Agric. Sci. Technol. 9, 39–41.
Monteagudo-Mera, A., Caro, I., Rodríguez-Aparicio, L., Rúa, J., Ferrero, M., and García-Armesto, M. (2011). Characterization of certain bacterial strains for potential use as starter or probiotic cultures in dairy products. J. Food Prot. 74, 1379–1386. doi: 10.4315/0362-028X.JFP-10-392
Nori, J., Urbina-Cardona, J. N., Loyola, R. D., Lescano, J. N., and Leynaud, G. C. (2011). Climate change and American bullfrog invasion: what could we expect in South America? PLoS One 6:e25718. doi: 10.1371/journal.pone.0025718
Nossa, C. W., Oberdorf, W. E., Yang, L., Aas, J. A., Paster, B. J., DeSantis, T. Z., et al. (2010). Design of 16S rRNA gene primers for 454 pyrosequencing of the human foregut microbiome. World J. Gastroenterol. 16, 4135–4144. doi: 10.3748/wjg.v16.i33.4135
Qi, H., Liu, Y., Qi, X., Liang, H., Chen, H., Jiang, P., et al. (2019). Dietary recombinant phycoerythrin modulates the gut microbiota of H22 tumor-bearing mice. Mar. Drugs 17:665. doi: 10.3390/md17120665
Quail, M. A., Kozarewa, I., Smith, F., Scally, A., Stephens, P. J., Durbin, R., et al. (2008). A large genome center's improvements to the Illumina sequencing system. Nat. Methods 5, 1005–1010. doi: 10.1038/nmeth.1270
Rodríguez-Ramilo, S. T., Toro, M. A., Bouza, C., Hermida, M., and Fernández, J. (2011). QTL detection for Aeromonas salmonicida resistance related traits in turbot (Scophthalmus maximus). BMC Genom. 12:541. doi: 10.1186/1471-2164-12-541
Schloss, P. D., Westcott, S. L., Ryabin, T., Hall, J. R., Hartmann, M., Hollister, E. B., et al. (2009). Introducing mothur: open-source, platform-independent, community-supported software for describing and comparing microbial communities. Appl. Environ. Microbiol. 75, –7537, 7541. doi: 10.1128/AEM.01541-09
Schmidt, T. S., Hayward, M. R., Coelho, L. P., Li, S. S., Costea, P. I., Voigt, A. Y., et al. (2019). Extensive transmission of microbes along the gastrointestinal tract. elife 8:e42693. doi: 10.7554/eLife.42693
Shreiner, A. B., Kao, J. Y., and Young, V. B. (2015). The gut microbiome in health and in disease. Curr. Opin. Gastroenterol. 31, 69–75. doi: 10.1097/MOG.0000000000000139
Silva, E., Reis, E., and Feio, R. N. (2009). Diet of the invasive frog Lithobates catesbeianus (Shaw, 1802) (Anura: Ranidae) in Viçosa, Minas Gerais state, Brazil. S. Am. J. Herpetol. 4, 286–294. doi: 10.2994/057.004.0312
Tong, Q., Liu, X.-N., Hu, Z.-F., Ding, J.-F., Bie, J., Wang, H.-B., et al. (2019). Effects of captivity and season on the gut microbiota of the brown frog (Rana dybowskii). Front. Microbiol. 10:1912. doi: 10.3389/fmicb.2019.01912
Topping, D. L., and Clifton, P. M. (2001). Short-chain fatty acids and human colonic function: roles of resistant starch and nonstarch polysaccharides. Physiol. Rev. 81, 1031–1064. doi: 10.1152/physrev.2001.81.3.1031
Trimpert, J., Eichhorn, I., Vladimirova, D., Haake, A., Schink, A. K., Klopfleisch, R., et al. (2021). Elizabethkingia miricola infection in multiple anuran species. Transbound. Emerg. Dis. 68, 931–940. doi: 10.1111/tbed.13761
Xie, Z.-Y., Zhou, Y.-C., Wang, S.-F., Mei, B., Xu, X.-D., Wen, W.-Y., et al. (2009). First isolation and identification of Elizabethkingia meningoseptica from cultured tiger frog, Rana tigerina rugulosa. Vet. Microbiol. 138, 140–144. doi: 10.1016/j.vetmic.2009.02.011
Yada, T., and Nakanishi, T. (2002). Interaction between endocrine and immune systems in fish. Int. Rev. Cytol. 220, 35–92. doi: 10.1016/S0074-7696(02)20003-0
Keywords: bullfrogs, changed, meningitis-like infectious disease, microbial community, Elizabethkingia
Citation: Li W, Fan G, Sun K, Liu J, Liu J, Wang Y, Li E, Wu X, Shen L and Pan T (2023) Microbial community structure dynamics of invasive bullfrog with meningitis-like infectious disease. Front. Microbiol. 14:1126195. doi: 10.3389/fmicb.2023.1126195
Edited by:
Jian Yang, China University of Geosciences Wuhan, ChinaReviewed by:
Fei Liu, Institute of Microbiology (CAS), ChinaAnyi Hu, Institute of Urban Environment (CAS), China
Huan Li, Lanzhou University, China
Copyright © 2023 Li, Fan, Sun, Liu, Liu, Wang, Li, Wu, Shen and Pan. This is an open-access article distributed under the terms of the Creative Commons Attribution License (CC BY). The use, distribution or reproduction in other forums is permitted, provided the original author(s) and the copyright owner(s) are credited and that the original publication in this journal is cited, in accordance with accepted academic practice. No use, distribution or reproduction is permitted which does not comply with these terms.
*Correspondence: Liang Shen, c2hlbmxpYW5nQGFobnUuZWR1LmNu; Tao Pan, cGFudGFvQGFobnUuZWR1LmNu
†These authors have contributed equally to this work
 Wengang Li
 Guangwei Fan1,2†
 Xiaobing Wu
 Liang Shen
 Tao Pan