 Yuan Hao
 Xin Wang1
 Yuhui Ma
 Wen Su
95% of researchers rate our articles as excellent or good
Learn more about the work of our research integrity team to safeguard the quality of each article we publish.
Find out more
ORIGINAL RESEARCH article
Front. Med. , 07 March 2025
Sec. Pulmonary Medicine
Volume 12 - 2025 | https://doi.org/10.3389/fmed.2025.1480169
This article is part of the Research Topic Advancing Precision Medicine in Lung Cancer: Integrating Genomics, Liquid Biopsy and Novel Diagnostic Tools View all 3 articles
Lung cancer remains a major global health issue, with non-small cell lung cancer (NSCLC) constituting approximately 85% of cases. Ferritinophagy, a pivotal autophagic process in ferroptosis, plays an essential role in tumor initiation and progression. However, the specific contributions of ferritinophagy-related genes (FRGs) to NSCLC pathogenesis remain incompletely understood. In this study, weighted gene co-expression network analysis (WGCNA) was employed to identify key modular genes associated with FRG scores. Genes overlapping between these modules and differentially expressed genes (DEGs) were selected for further investigation. Prognostic genes were identified through univariate Cox regression and least absolute shrinkage and selection operator (LASSO) analysis, with subsequent validation using quantitative reverse transcriptase polymerase chain reaction (qRT-PCR) on both clinical samples and the TCGA-NSCLC dataset. A nomogram incorporating clinicopathological features and risk scores was developed to predict patient outcomes. Further analyses focused on functional enrichment, drug sensitivity, and the immune microenvironment. Cross-referencing 2,142 key modular genes with 2,764 DEGs revealed 600 candidate genes. Univariate Cox regression and LASSO analysis of these candidates identified eight prognostic genes: KLK8, MFI2, B3GNT3, MYRF, CREG2, GLB1L3, AHNAK2, and NLRP10. Two distinct risk groups exhibited significant survival differences. Both the risk score and pathological N stage were found to be independent prognostic factors, forming the basis for the nomogram. Notable correlations were observed between certain immune cells, prognostic genes, and immune responses, affecting the efficacy of immunotherapy and drug sensitivity. qRT-PCR confirmed that, except for NLRP10, all prognostic genes exhibited expression patterns consistent with TCGA-NSCLC data. This study highlights the significant role of FRGs in NSCLC prognosis and regulation, offering novel insights for personalized treatment strategies.
Lung cancer remains a significant global health threat, with non-small cell lung cancer (NSCLC) accounting for roughly 85% of all cases (1). Recent advancements in molecular targeted therapies have brought new hope for NSCLC treatment. Drugs such as osimertinib, which targets EGFR mutations, lorlatinib for ALK rearrangements, dabrafenib for BRAF V600E mutations, and adagrasib for KRAS G12C mutations, have demonstrated clinical efficacy. Despite these developments, the 5 years survival rate for NSCLC remains below 18% (2). Concurrently, PD-1/PD-L1 inhibitors have been approved for the first-line treatment of advanced NSCLC; however, their response rate is only around 20% in unselected patients with advanced disease (3–5). These challenges underscore the ongoing need to identify novel mechanisms and therapeutic targets to improve prognosis and treatment outcomes for NSCLC.
In recent years, ferroptosis has garnered significant attention for its pivotal role in the progression of malignant tumors (6). First described by Stockwell, ferroptosis is a regulated form of cell death that diverges from apoptosis, necrosis, and autophagy in terms of its morphological, biochemical, and genetic characteristics (7). This process is primarily characterized by disruptions in iron homeostasis, alongside the accumulation of reactive oxygen species (ROS) and lipid peroxides, which ultimately lead to cell death (8, 9) Central to the regulation of ferroptosis is ferritinophagy, a selective autophagy process that controls intracellular iron homeostasis. This process is particularly significant in cancer cells, as it directly influences the availability of free iron, a key driver of ferroptosis (10–13). In the context of NSCLC, understanding ferritinophagy is crucial as it may provide new insights into tumor progression and resistance mechanisms, while also offering potential targets for therapeutic intervention.
Recent studies have highlighted the significant impact of ferritinophagy on the development and progression of various cancers. For instance, Zhao et al. (14) demonstrated that NCOA4-mediated ferritinophagy activates the JNK pathway, inducing ferroptosis in colorectal cancer cells. Similarly, Santana-Codina et al. (15) revealed that ferritinophagy, which is upregulated in pancreatic cancer, supports tumor growth by maintaining iron levels and enhancing mitochondrial function. Elevated ferritinophagy activity correlates with accelerated tumor growth and poorer outcomes. In liver cancer, Xiu et al. (16) showed that inducing NCOA4-mediated ferritinophagy significantly inhibits tumor progression in both in vivo and in vitro models. Emerging evidence also suggests that ferritnophagy plays a pivotal role in NSCLC progression and drug resistance. For instance, NCOA4, a key mediator of ferritinophagy, is upregulated in osimertinib-resistant NSCLC cells, promoting ferritinophagy and contributing to adaptive resistance (17). Similarly, DTX2, a ubiquitin ligase, negatively regulates NCOA4-mediated ferritinophagy, and its knockdown enhances cisplatin-induced ferroptosis and overcomes drug resistance in NSCLC (18). COPZ1 silencing has also been shown to promote NCOA4-mediated ferritinophagy, triggering ferroptosis in lung adenocarcinoma cells (19). Additionally, interferon (IFN)-γ-induced TFR1 upregulation promotes ferritinophagy and ferroptosis in NSCLC, suggesting a potential synergy between immune signaling and iron metabolism therapies (20). Furthermore, the compound ShtIX induces ferroptosis in NSCLC cells through NCOA4-mediated ferritinophagy, highlighting the therapeutic potential of targeting this pathway (21).
These findings collectively emphasize the significance of ferritinophagy in regulating ferroptosis and its potential as a therapeutic target in NSCLC. This study aims to further explore the prognostic and regulatory roles of ferritinophagy-related genes in NSCLC, providing new insights into the molecular mechanisms underlying ferroptosis and its therapeutic implications.
The datasets for TCGA-Lung Adenocarcinoma (LUAD) and Lung Squamous Carcinoma (LUSC) were initially sourced from the UCSC Xena website1 and subsequently merged into The Cancer Genome Atlas Non-Small Cell Lung Cancer (TCGA-NSCLC) dataset. This dataset included 1,025 primary tumor samples (NSCLC) and 108 paraneoplastic normal tissue samples (Normal), comprising gene expression data for 1,004 individuals with available overall survival (OS) data (Dead: 396, Alive: 608), as well as associated clinical data. Additionally, the GSE37745 dataset (GPL570), containing 196 NSCLC tissue samples, was retrieved from the Gene Expression Omnibus (GEO) database2. Furthermore, 20 ferritinophagy-related genes (FRGs) were identified using the GeneCards database3 (22).
In order to explore the relationship between FRGs and the prognosis of NSCLC patients, based on 20 FRGs, the ssGSEA method of GSVA (v 1.42.0) was used to generate FRGs-related ssGSEA enrichment scores for 1004 NSCLC samples with survival data in the TCGA-NSCLC dataset (23). The samples were categorized into high and low scoring groups based on optimal cut-off values for the scores using the survminer::surv_cutpoint function with minprop = 0.1. Kaplan-Meier (KM) survival analysis was conducted between these groups using the R package survminer (v 0.4.9) (p < 0.05) (24).
Subsequently, to explore the relationship between co-expressed gene modules and FRGs, the WGCNA (v 1.71) (25) was applied to the TCGA-NSCLC dataset to identify genes associated with FRG scores in NSCLC. Hierarchical clustering, based on the Euclidean distance of expression, was first performed to identify and exclude outliers. A scale-free network was constructed with a minimum of 500 genes per module, applying a soft threshold where R2 exceeded 0.85 and mean connectivity approached zero. Then, the ssGSEA scores related to FRGs were used as the phenotype to construct a phenotype-module correlation heatmap, and todules exhibiting the highest positive and negative correlations with the scores were selected as key modules, and genes within these modules were identified for further analysis.
Differentially expressed genes (DEGs) between tumor and normal tissue groups were identified using DESeq2 (v 1.34.0) (26) with the following criteria: p.adj < 0.05 and | log2Fold Change (FC)| > 2.0. In order to understand the distribution of differentially expressed genes as a whole, the DEGs were visualized using the R packages ggplot2 (v 3.4.1) (27) and ComplexHeatmap (v 2.15.1) (28).
Overlapping genes between the differentially expressed genes (DEGs) and key module genes were identified as candidate genes, and Venn diagrams were generated using the VennDiagram package (v 1.7.1) (29). Gene Ontology (GO) and Kyoto Encyclopedia of Genes and Genomes (KEGG) enrichment analyses were performed on these candidate genes with the clusterProfiler R package (v 4.2.2) (30) to identify functional pathways (p.adj < 0.05). Additionally, a medium confidence score of 0.4 was applied in the STRING database4 to explore potential protein-protein interactions (PPIs) among the proteins encoded by the candidate genes and construct a PPI network.
To evaluate whether prognostic genes were associated with patient survival, the expression levels of candidate genes were used as continuous variables to correlate with survival information for each sample, with survival outcomes and survival time as the dependent variables. Univariate Cox analysis (hazard ratios (HR) ≠ 1 and p < 0.05) was performed on the candidate genes using the survival (v 3.3-1) and survminer R packages. A proportional hazards (PH) hypothesis test was subsequently applied (p > 0.05). Genes passing the PH hypothesis test were designated as candidate prognostic genes. LASSO (Least Absolute Shrinkage and Selection Operator) analysis was then applied to these candidate genes using the glmnet R package (v 4.1-2) (31) to identify the genes that best fit the model with the smallest error. During the model training process, 10-fold cross-validation (CV) was used to obtain the optimal Lambda (lambda.min), corresponding to the value that produced the smallest cross-validation error. Genes with regression coefficients that were not penalized to zero were selected as prognostic genes and risk scores were computed using the corresponding formula:
The coefficients (Coef) and gene expression values (X) representing the model parameters.
Risk scores for NSCLC samples from both the TCGA-NSCLC and GSE37745 datasets were calculated, and the samples were divided into high- and low-risk groups based on optimal cutoff values. KM survival analysis was performed to compare survival differences between these groups using the survminer package. In parallel, risk score distributions and risk curves were visualized. To assess the prognostic performance, survival ROC analysis (v 1.0 3.1) (32) was performed to generate receiver operating characteristic (ROC) curves, with areas under the curve (AUC) exceeding 0.6 for predicting 1, 3, and 5 years survival outcomes in patients with NSCLC.
To determine independent prognostic factors for NSCLC, univariate Cox regression analysis (p < 0.05) was conducted combining risk scores with clinical features, including age, gender, pathologic T, pathologic N, and pathologic M stages. These variables were tested for the PH hypothesis, and factors passing the test were subjected to multivariate Cox regression analysis to identify independent prognostic factors (p < 0.05). Based on these factors, a nomogram was constructed using the rms package (v 6.2-0) to predict 1, 2, and 3 years survival probabilities in patients with NSCLC. The predictive accuracy of the nomogram was validated using calibration curves and ROC curves.
To explore the functional pathways associated with prognostic genes, GSEA was performed separately for the two risk groups and individual prognostic genes. The log2FC between the two groups were calculated using DESeq2, with differential genes ranked by log2FC from highest to lowest. The cc2.cp.kegg.v7.4.symbols.gmt file from the Molecular Signatures Database (MSigDB5) served as the background gene set, and GSEA was conducted with clusterProfiler (p < 0.05). Additionally, Spearman correlations were calculated between prognostic genes and other genes in TCGA-NSCLC, with correlation coefficients ranked from highest to lowest, followed by GSEA (p < 0.05).
To assess the involvement of immune cells in NSCLC, immune cell infiltration was analyzed using the immunedeconv package (v 2.0.4) (33), excluding samples with p > 0.05. Differences between the two risk groups were compared, and Spearman’s correlation was calculated between prognostic genes and differential immune cells (p < 0.05). Data on tumor-associated major histocompatibility complex molecules, chemokines, immunosuppressive, and immunostimulatory factors were retrieved from the TISIDB database6 and analyzed for correlations with prognostic genes and risk scores using Spearman’s correlation.
The ssGSEA algorithm in the GSVA package (v 1.42.0) (23) was employed to compute immunotherapy pathway scores for NSCLC samples and examine the relationship between risk scores and immune pathways. Differences in immune checkpoint inhibitor (ICI) gene expression between risk groups were assessed using the Wilcoxon test (p < 0.05), with further evaluation of their correlation with risk scores. Immunophenoscores (IPS) from The Cancer Immunome Atlas (TCIA)7 were used to predict responses of the two risk groups to anti-CTLA-4 and anti-PD-1 therapies (p < 0.05).
To evaluate differences in drug sensitivity, the half-maximal inhibitory concentration (IC50) of chemotherapeutic agents was assessed between the two risk groups using the pRRophetic algorithm (v 0.5) (34). Additionally, the expression of prognostic genes was compared between tumor and normal samples from both the TCGA-NSCLC dataset and clinically collected specimens.
The expression of prognostic genes was also analyzed in malignant tissues from five patients with NSCLC and matched normal tissues from five individuals at Shanxi Province Cancer Hospital. For RNA extraction, 50 mg of tissue from each sample was combined with 1 mL of TRIzol reagent (Ambion, United States). RNA concentration was measured, and reverse transcription was performed according to the manufacturer’s instructions. RNA concentration was determined by extracting 1 μL and using a NanoPhotometer N50. cDNA synthesis was performed using the SureScript First-Strand cDNA Synthesis Kit (Servicebio, China), and the resulting cDNA was diluted 5–20 times with ddH2O. qPCR was carried out for 40 cycles (initial denaturation at 95°C for 1 min, denaturation at 95°C for 20 s, annealing at 55°C for 20 s, and extension at 72°C for 30 s). Gene expression was normalized to GAPDH using the 2–ΔΔCT method. Primer information is provided in Table 1.
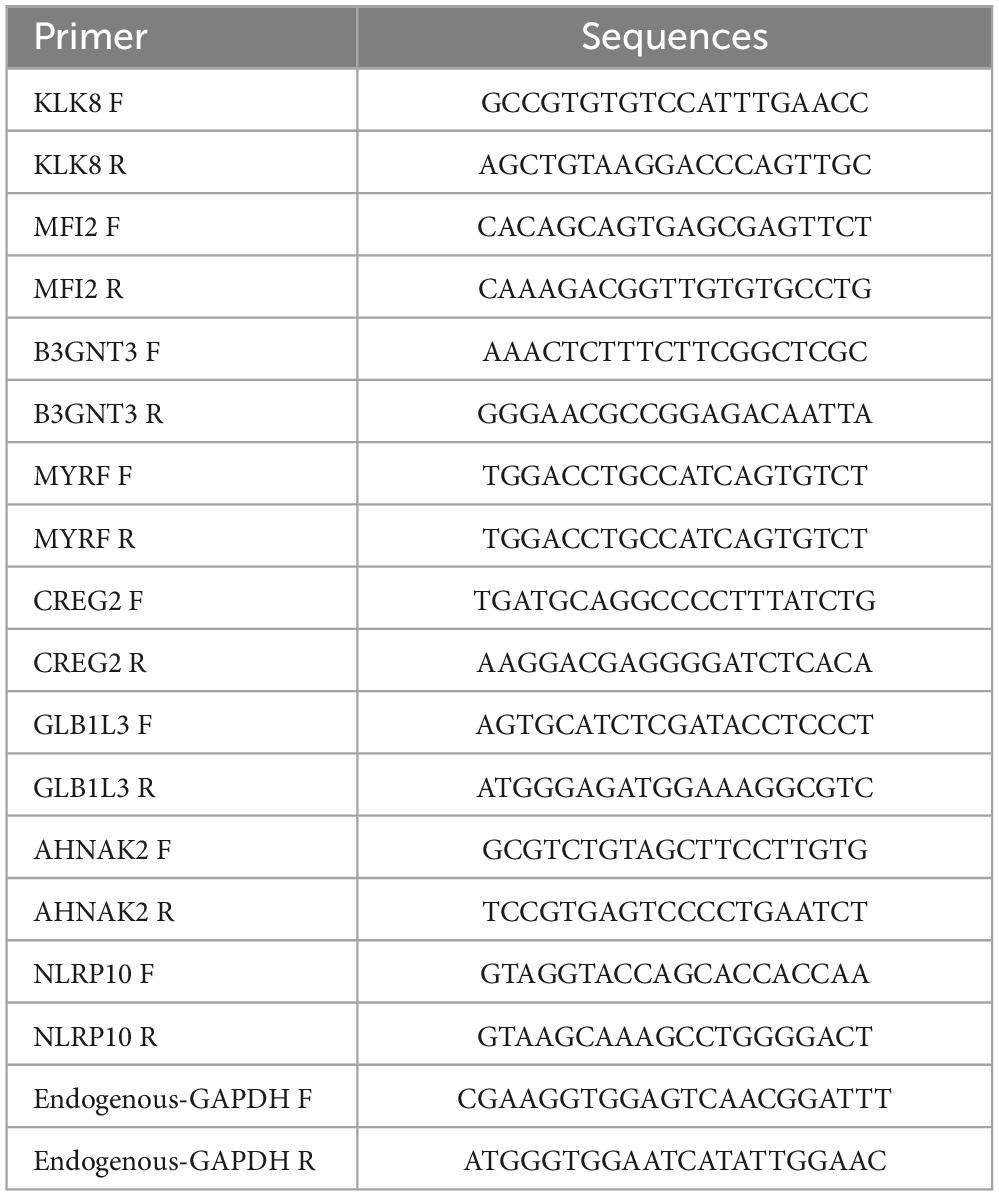
Table 1. Sequence information of polymerase chain reaction (PCR) primers.
Machine learning and bioinformatics analyses were performed using R statistical software (version 4.2.2). The Wilcoxon test (p < 0.05) was applied to compare data between groups.
Scores were calculated using FRGs in the TCGA-NSCLC dataset. Subsequently, NSCLC samples were categorized into high- and low-scoring groups (cutoff value = 2.148193). The analysis revealed a significant survival difference between the two groups, with the high-scoring cohort demonstrating a markedly higher survival rate than the low-scoring group, indicating a potential association between FRGs and NSCLC prognosis (Figure 1A). WGCNA was then employed to identify genes associated with FRG scores. After excluding an outlier sample (Figures 1B, C), soft threshold screening was conducted, as shown in Figures 1A, D threshold value of five was determined as optimal based on R2 and mean connectivity. Hierarchical clustering subsequently uncovered nine gene modules (Figure 1E), among which the pink module (r = -0.375, 900 genes) and brown module (r = 0.464, 1,242 genes) were strongly negatively and positively correlated with scores, respectively (Figure 1F). The genes from these two modules were merged, resulting in a set of 2,142 key module genes for further investigation.
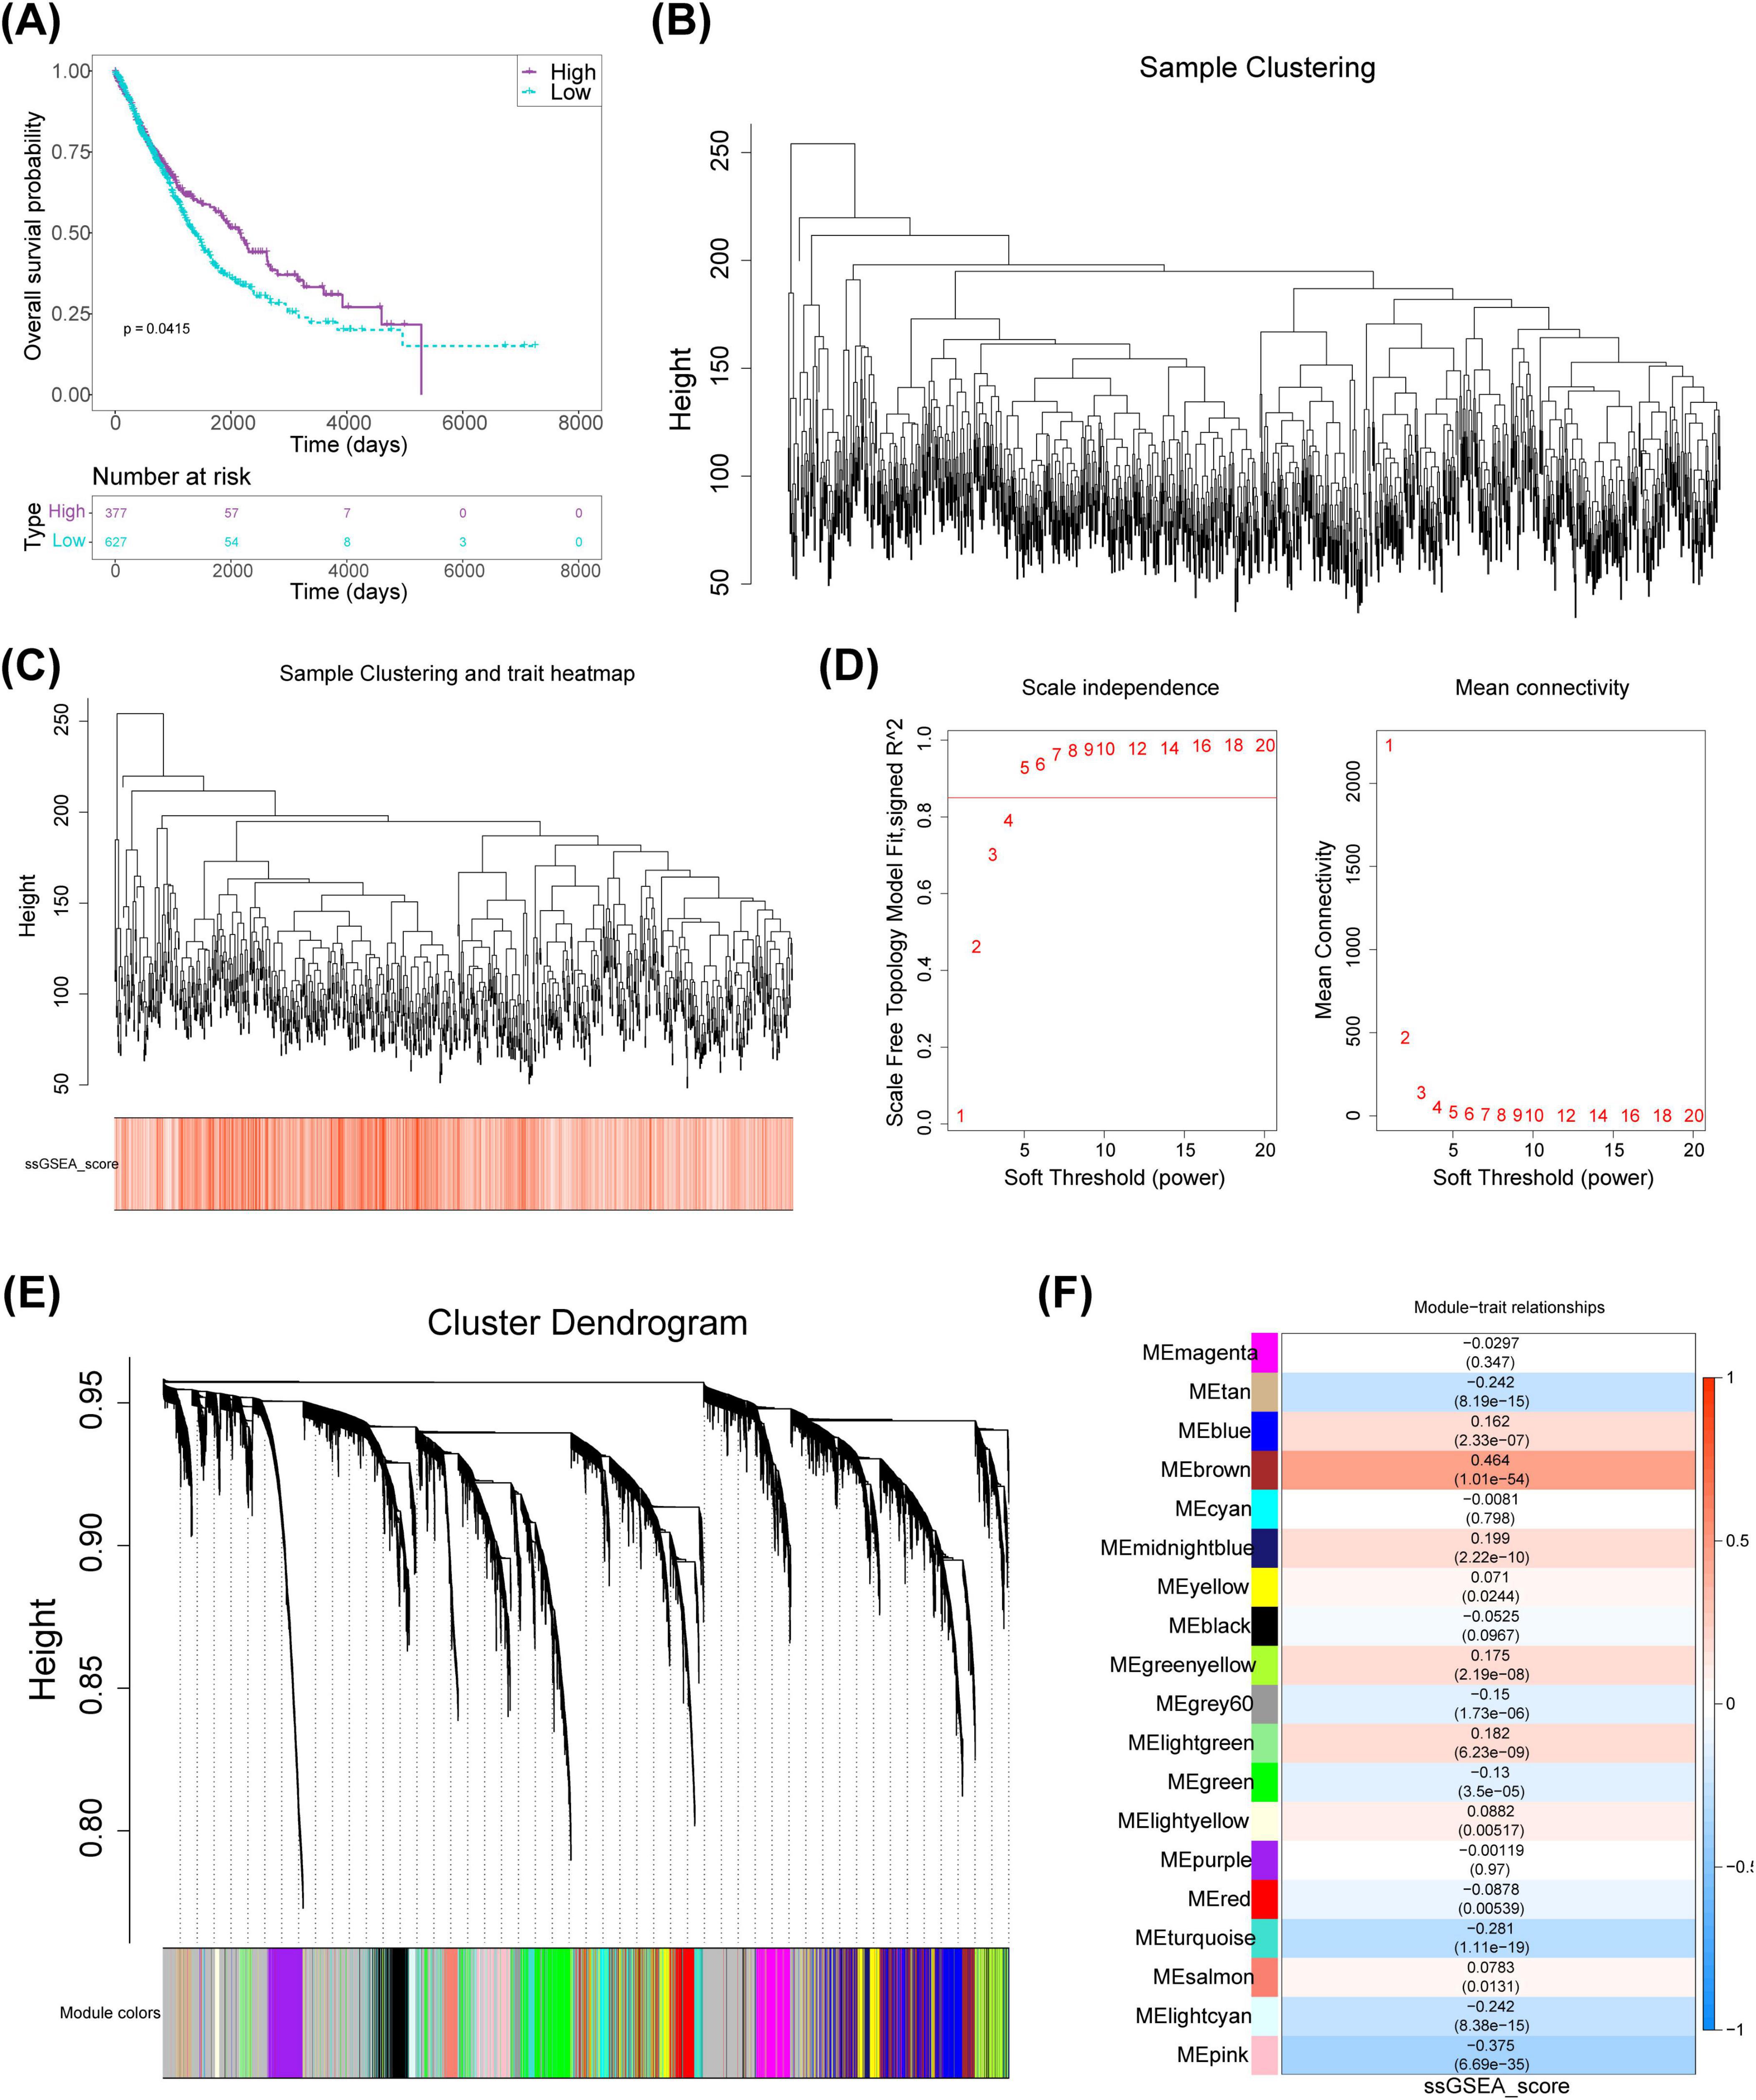
Figure 1. Identification of key modular genes associated with FRGs scores in NSCLC. (A) FRGs-related KM curves. (B) Clustering tree for NSCLC samples. (C) Hierarchical clustering of samples with integrated trait information. (D) Soft threshold selection for network analysis. (E) Co-expressed modular genes identified via WGCNA. (F) Heatmap depicting correlations between phenotype and module genes. KM, Kaplan-Meier; NSCLC, non-small cell lung cancer; WGCNA, weighted gene co-expression network analysis; FRGs, ferritinophagy-related genes.
Differential expression analysis in TCGA-NSCLC identified 2,764 DEGs between NSCLC and normal samples, with 2,044 upregulated and 720 downregulated genes (Figures 2A, B). Upon intersecting the DEGs with the key modular genes, 600 candidate genes were identified (Figure 2C). Functional enrichment analysis revealed these candidate genes to be involved in 143 GO terms, including apical plasma membrane, epidermis development, and channel activity, as well as 217 pathways such as the PI3K-Akt signaling pathway and Neuroactive ligand-receptor interaction (Figures 2D, E). Furthermore, the PPI network indicated complex interactions among the proteins encoded by these candidate genes, including SPRR2E-SPRR2B and CBR3-DSC1, among others (Figure 2F).
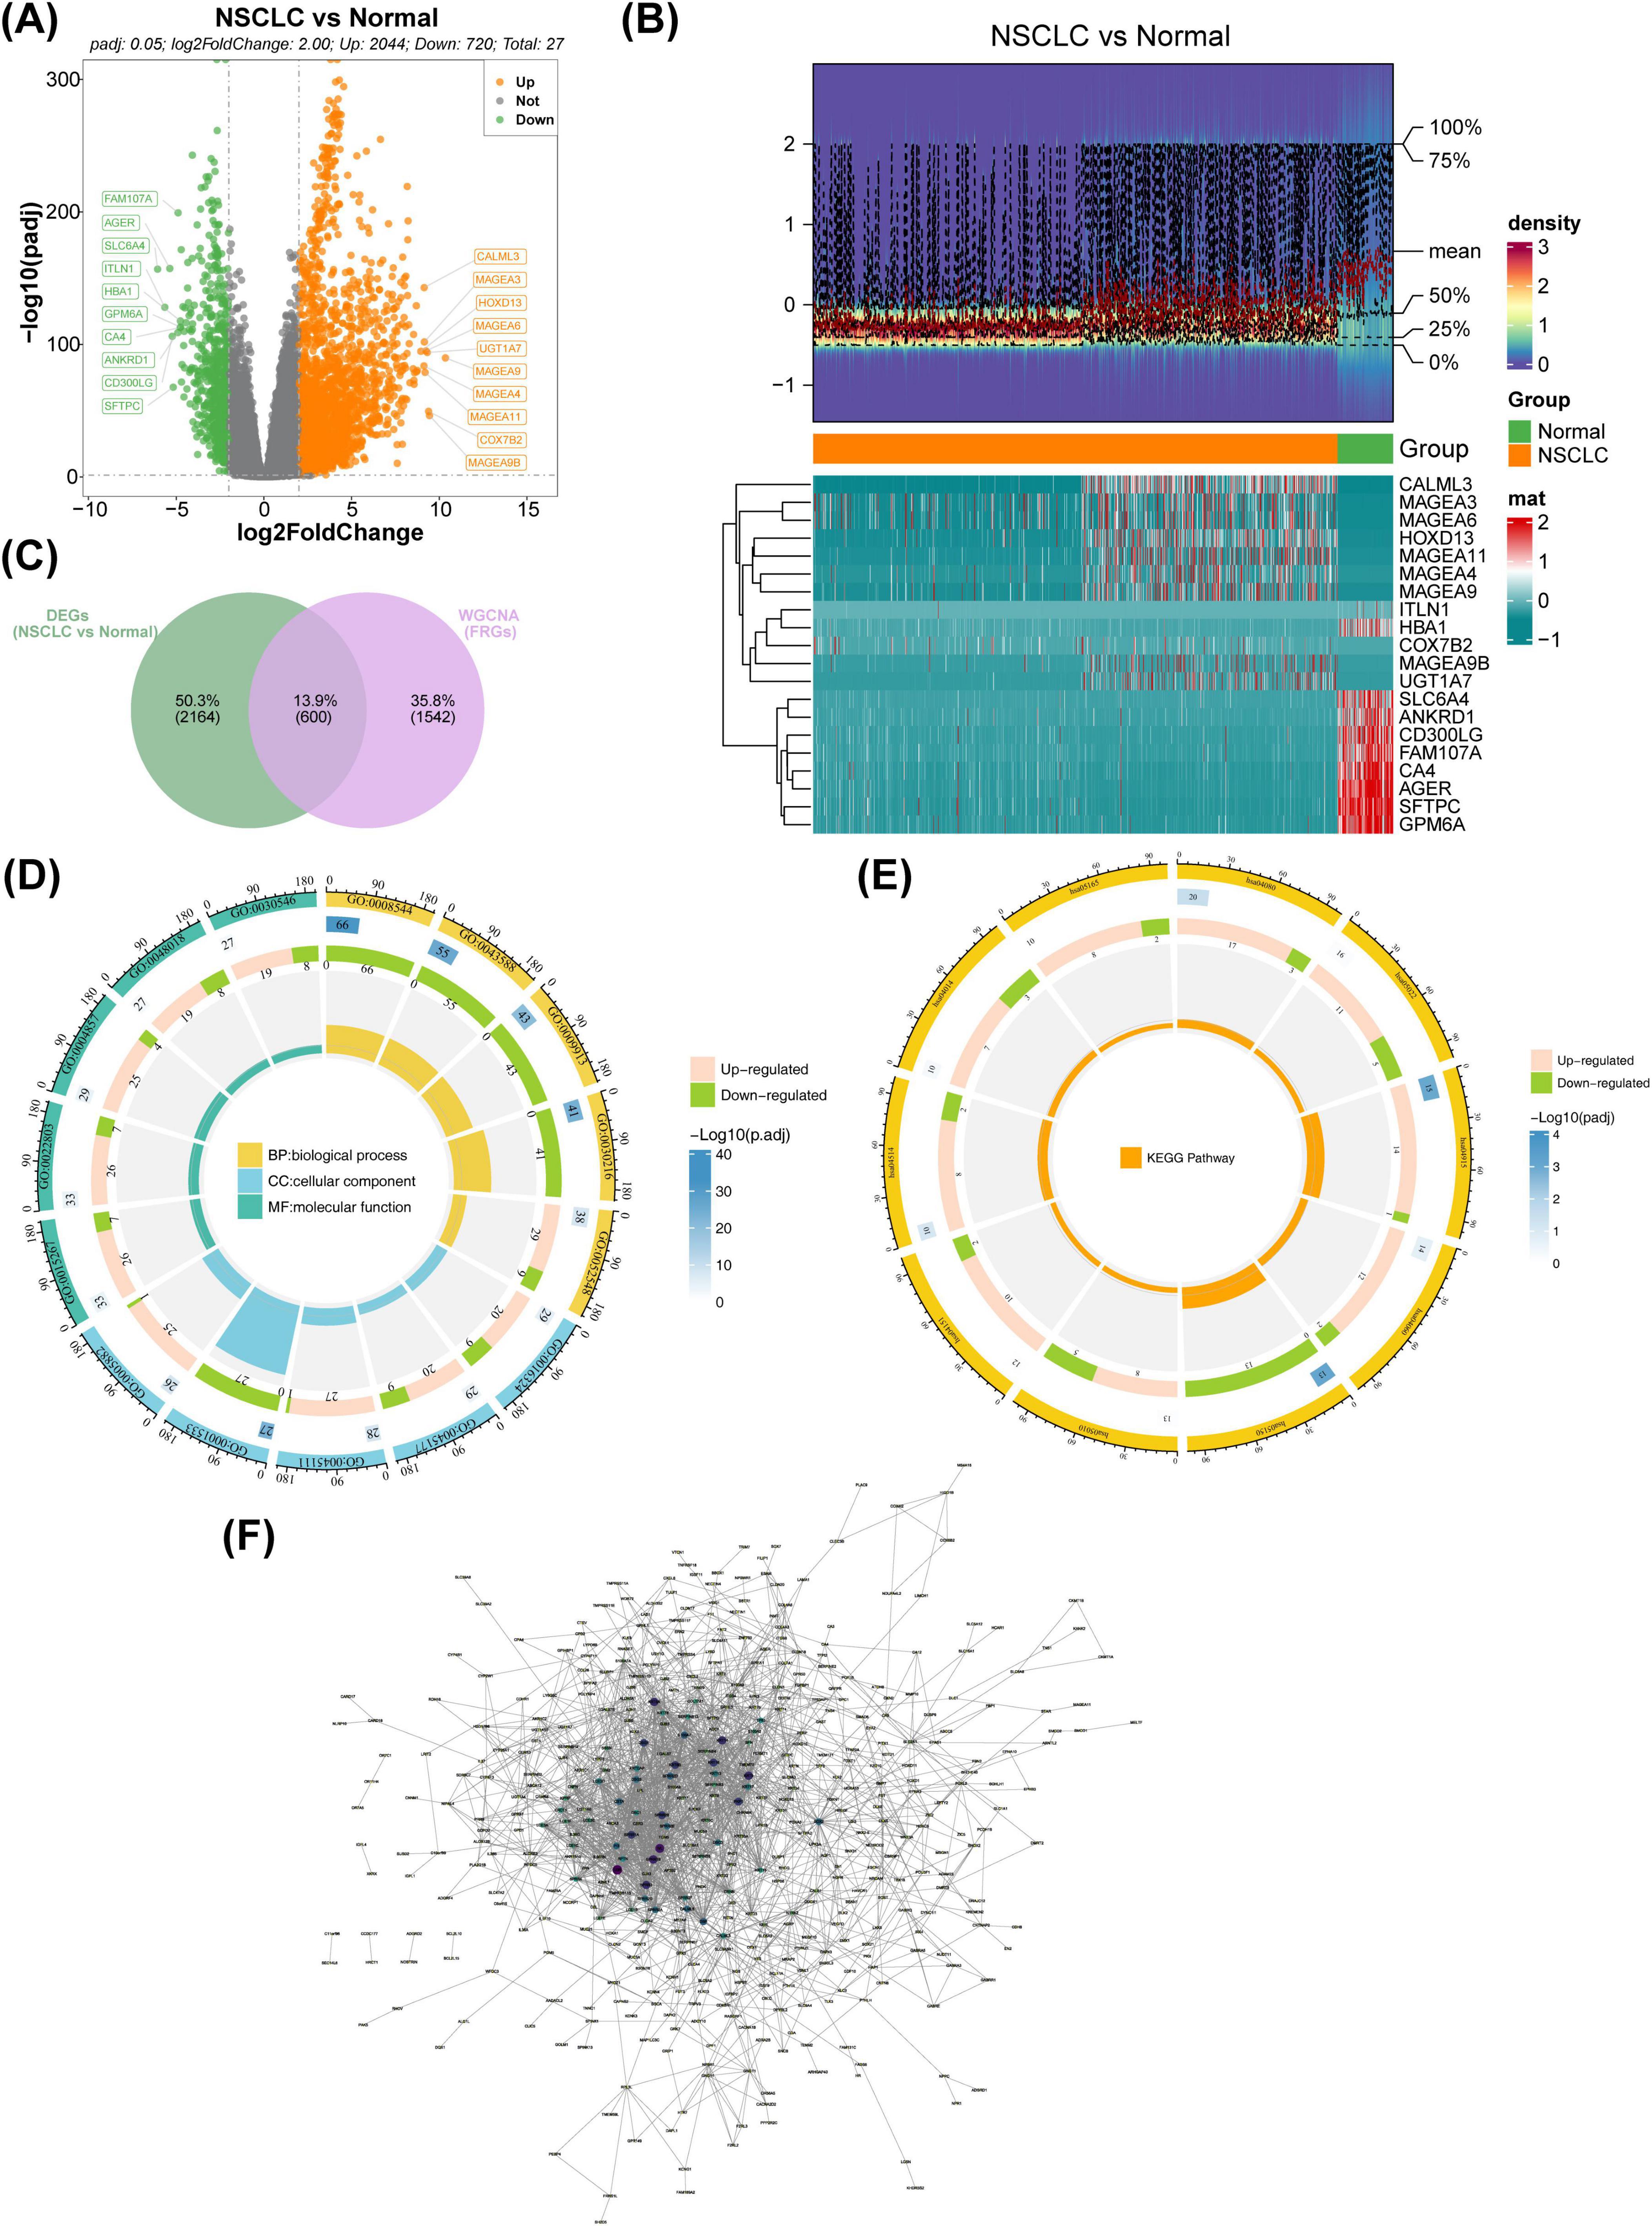
Figure 2. Identification of candidate FRGs. (A) Volcano plot illustrating the distribution of genes between NSCLC and normal samples. Red represents upregulated genes, blue denotes downregulated genes, and gray indicates non-significant genes. (B) Heatmap visualizing differential gene expression between NSCLC and normal groups. Red indicates high expression density, while blue indicates low expression density. (C) Venn diagram showing the overlap between differentially expressed genes (DEGs) and WGCNA-identified genes. (D) GO enrichment analysis of candidate genes depicted in a circular map. (E) KEGG enrichment analysis of candidate genes shown in a circular map. (F) PPI network analysis for candidate genes. FRGs, ferritinophagy-related genes; NSCLC, non-small cell lung cancer; GO, gene ontology; KEGG, Kyoto Encyclopedia of Genes and Genomes; WGCNA, weighted gene co-expression network analysis.
Univariate Cox regression and PH assumption tests of the 600 candidate genes identified eight genes (KLK8, MFI2, B3GNT3, MYRF, CREG2, GLB1L3, AHNAK2, and NLRP10) with P < 0.05 (Figure 3A). All 8 genes passed the PH assumption test (P > 0.05) and were selected as significant prognostic candidates (Figure 3A). LASSO analysis incorporating these genes revealed minimal model error (λmin = 0.00263837), confirming their role as prognostic markers (Figures 3B, C). Risk scores were calculated from the expression levels and coefficients of these genes using the TCGA-NSCLC data: RiskScore=KLK8×(0.0570633314496996)+MFI2×(0.0703586594018025)+B3GNT3×(0.0877327800833761)+MYRF×(0.119365343024516)+CREG2(0.164451250257509)+GLB1L3(−0.116152759959115)+AHNAK2(0.0144952367245304)+NLRP10(0.649738673795027). Optimal cutoff values for risk scores stratified samples into high- and low-risk groups in both the TCGA-NSCLC (Risk score = 0.284514) and GSE37745 datasets (Risk score = 4.83772). Higher risk scores were associated with increased NSCLC mortality, and survival curves corroborated poorer outcomes for the high-risk group (Figures 3D–F). The survival AUC values at 1, 3, and 5 years surpassed 0.6, indicating reasonable accuracy of the risk model in predicting patient survival (Figure 3G). Similar trends were observed in the GSE37745 dataset (Figures 4A–D).
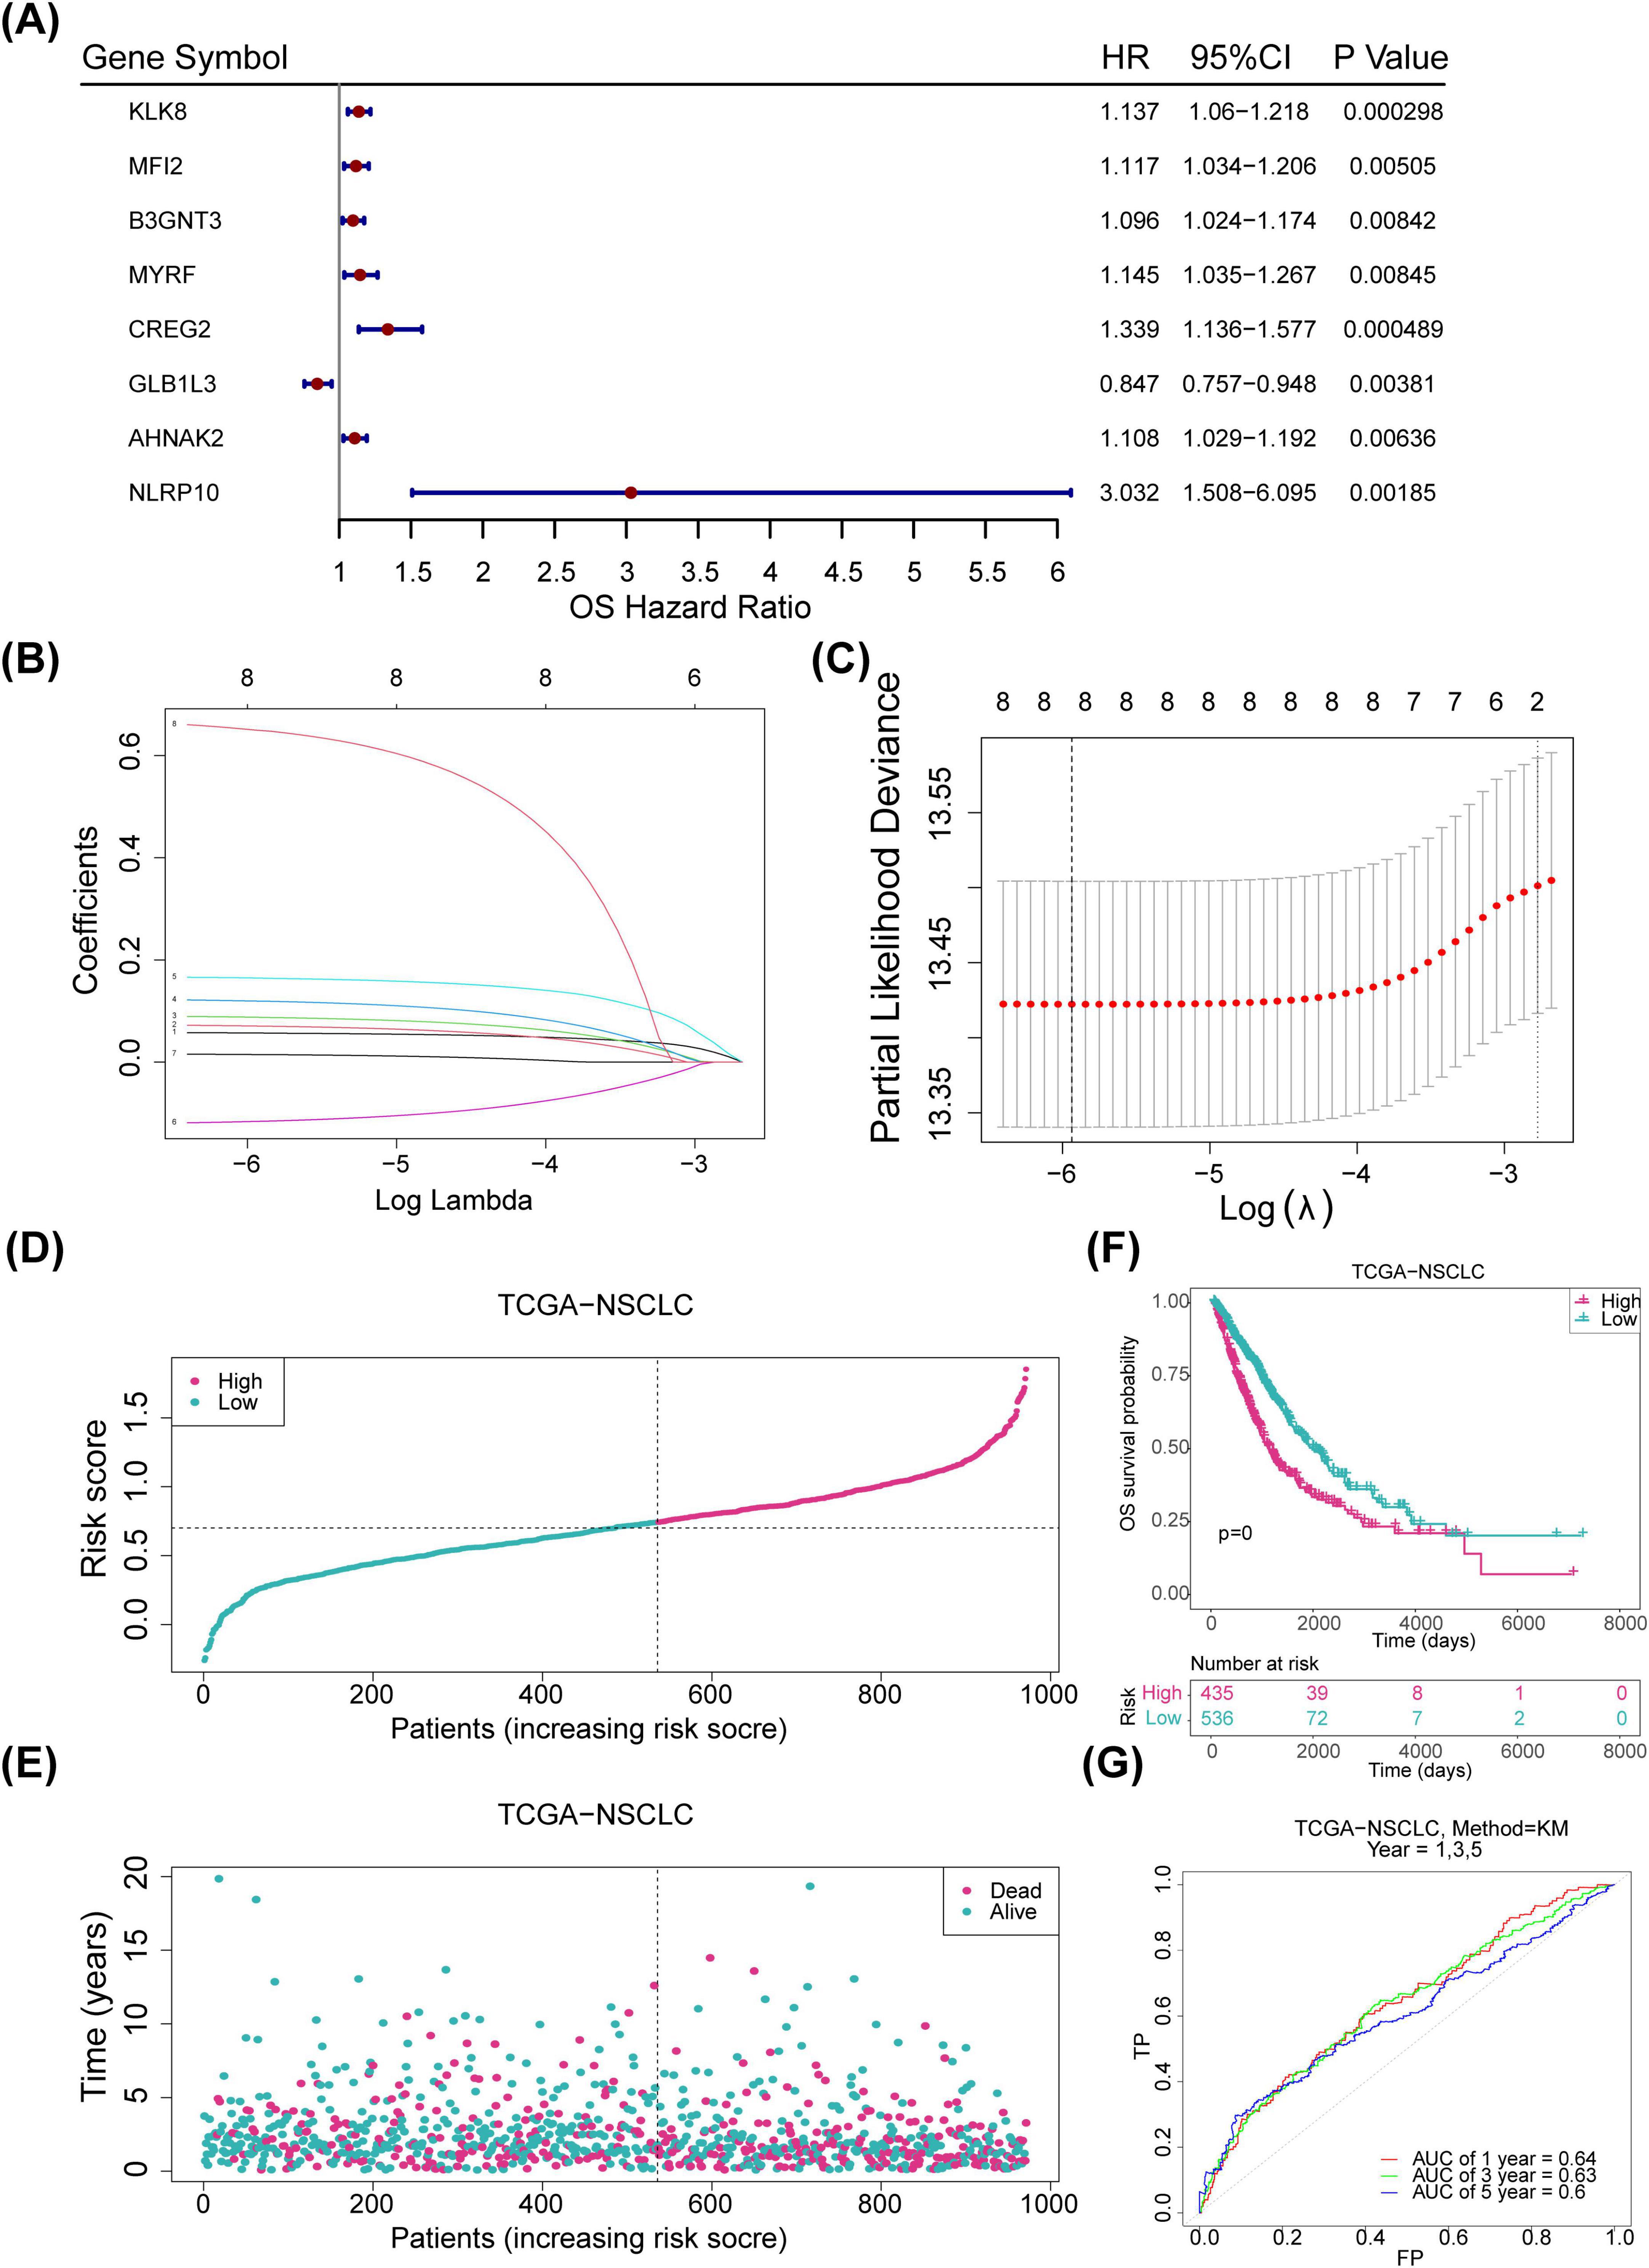
Figure 3. Construction of risk models. (A) Forest plot displaying one-factor Cox regression results for the internal training set (p < 0.05). (B) LASSO regression coefficients for eight genes. (C) LASSO model residual sum of squares for the eight genes. (D) Risk profiles for the training set, with red indicating high-risk samples and blue indicating low-risk samples. (E) Survival status plot for the training set, with red representing deceased samples and blue representing survivors. (F) Kaplan-Meier (KM) survival curves for the training set. (G) ROC curve for the training set. LASSO, least absolute shrinkage and selection operator; ROC, receiver operating characteristic.
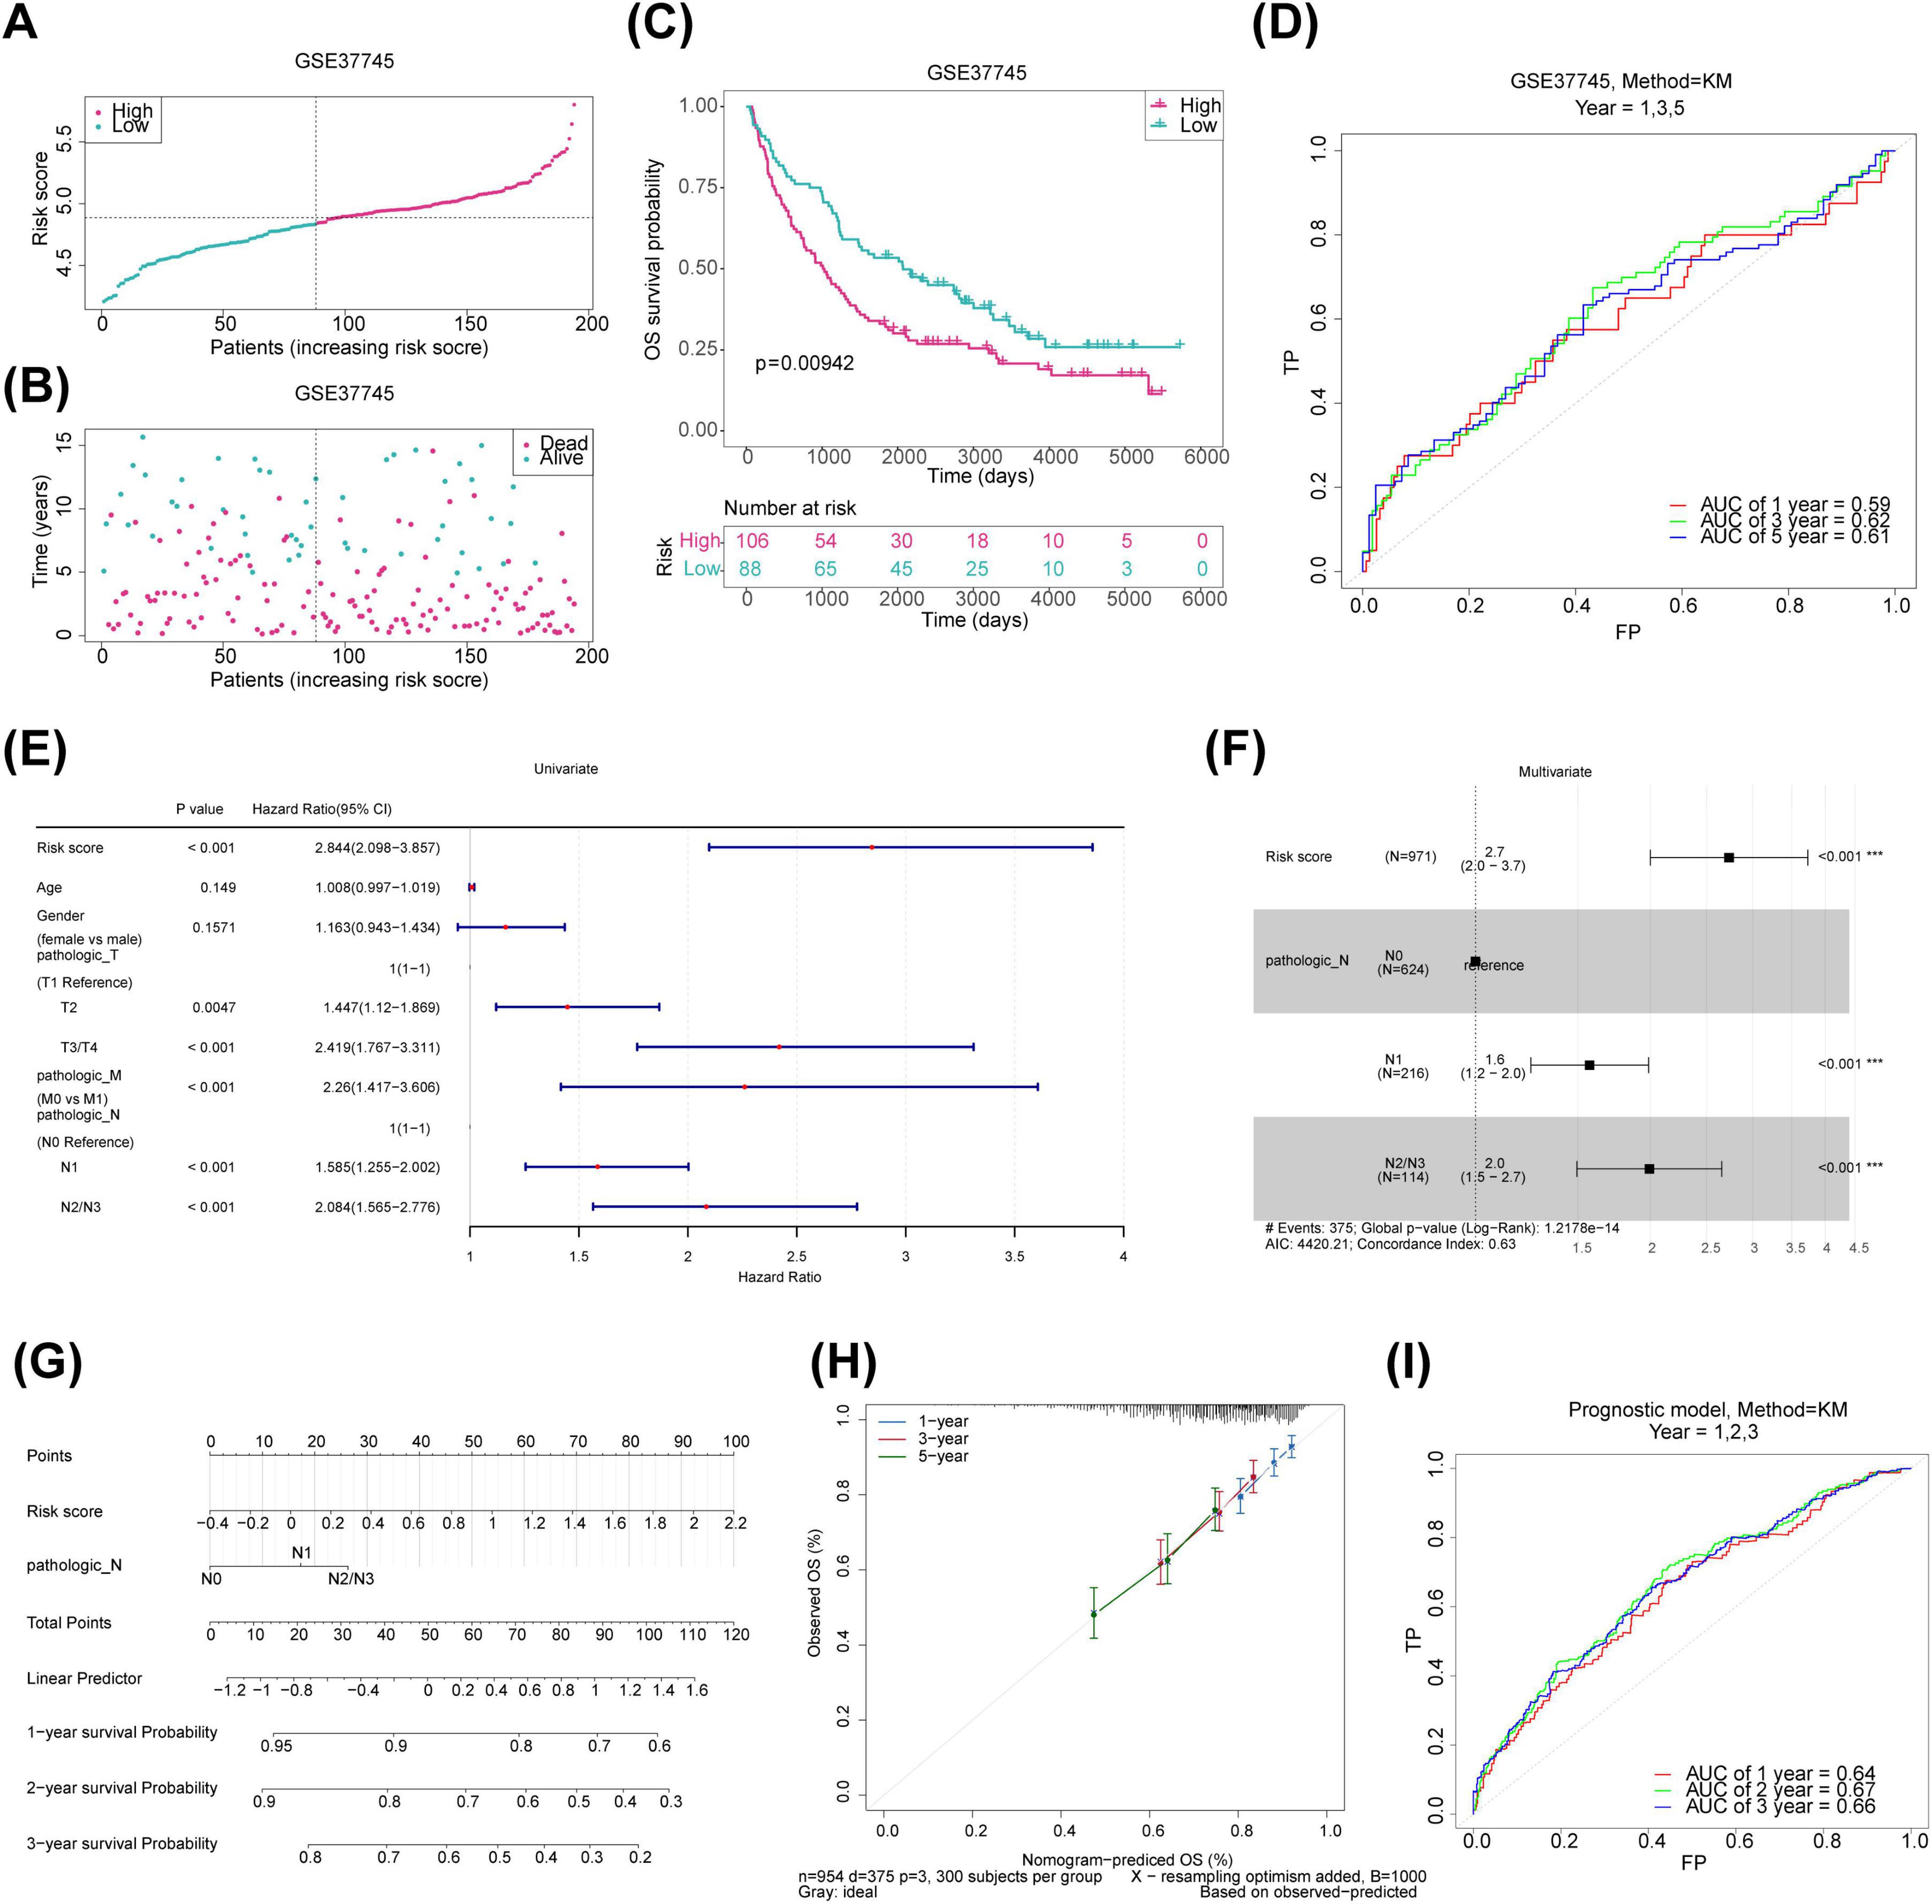
Figure 4. Validation of risk model and construction of prognostic prediction models for the training set. (A) Risk profile plot for the validation set, with red dots indicating high-risk samples and blue dots representing low-risk samples. (B) Survival status plot for the validation set, with red representing deceased samples and blue indicating survivors. (C) KM survival curves for the validation set. (D) ROC curve for the validation set. (E) Forest plot of univariate Cox regression for clinical indicators in the training set. (F) Forest plot of multivariate Cox regression for clinical indicators in the training set. (G) Nomogram column plot for prognostic prediction. (H) Calibration curves for evaluating prognostic models. (I) ROC curves for the prognostic prediction models. KM, Kaplan-Meier; ROC, receiver operating characteristic.
To identify independent prognostic factors for NSCLC, a univariate Cox regression analysis was performed on six variables: gender, age, pathologic T, pathologic N, pathologic M, and risk score. Pathologic T, pathologic N, pathologic M, and risk score showed significant associations with prognosis (pathologic T and pathologic M were excluded after failing the PH assumption test) (Figure 4E). Pathologic N and risk score were then integrated into a multivariate Cox analysis, resulting in a prognosis model where pathologic N1, pathologic N2/N3, and risk score emerged as independent prognostic factors for NSCLC (Figure 4F). Calibration and ROC curves affirmed the nomogram’s accuracy in predicting survival based on these independent factors (Figures 4G–I).
To explore the functional pathways associated with the prognostic genes and risk groups, GSEA was performed. The analysis revealed significant associations between the risk groups and the METABOLISM_OF_XENOBIOTICS_BY_CYTOCHROME_P450 pathway, among others (Figure 5A). For the prognostic genes, GLB1L3 and NLRP10 were enriched in the KRAS signaling pathway; MFI2, B3GNT3, and CREG2 in the Interferon Gamma Response; and KLK8, GLB1L3, and B3GNT3 in Bile Acid Metabolism (Figures 5B–I).
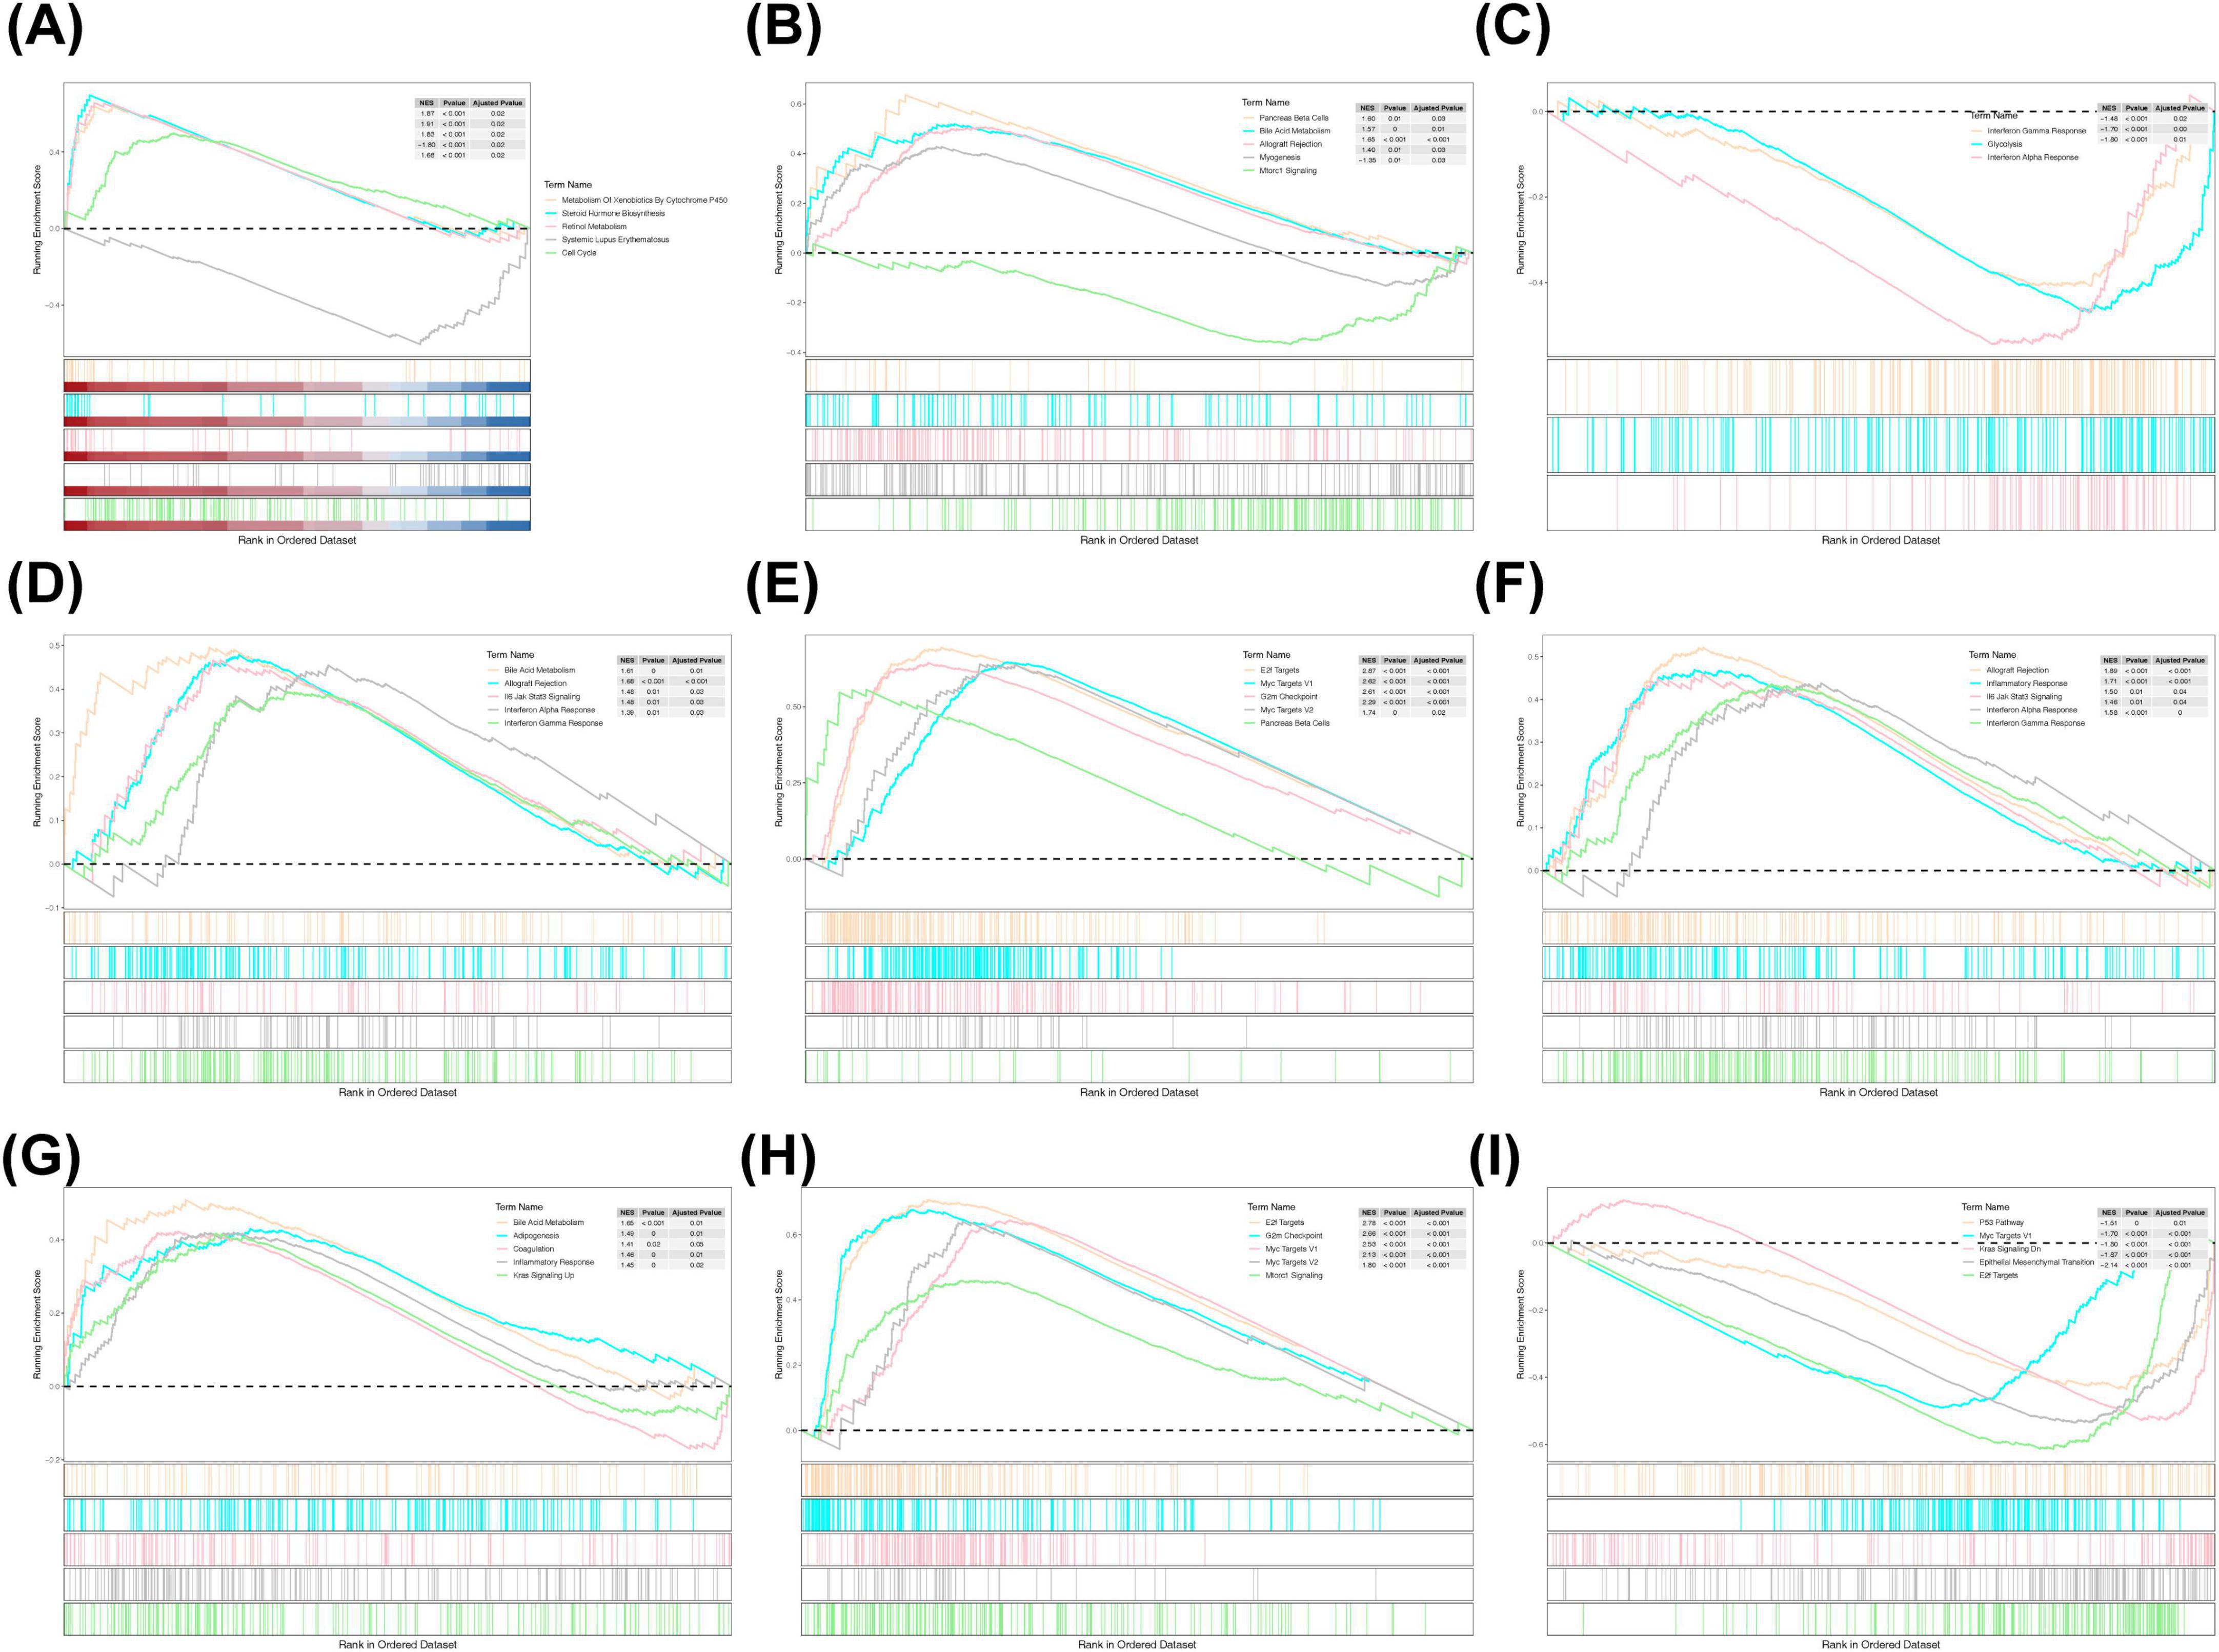
Figure 5. GSEA enrichment analysis. (A) KEGG enrichment analysis in high- and low-risk groups. (B) KEGG enrichment analysis of KLK8. (C) KEGG enrichment analysis of MFI2. (D) KEGG enrichment analysis of B3TNG3. (E) KEGG enrichment analysis of MYRF. (F) KEGG enrichment analysis of CREG2. (G) KEGG enrichment analysis of GLB1L3. (H) KEGG enrichment analysis of AHNAK2. (I) KEGG enrichment analysis of NLRP10. GSEA, Gene Set Enrichment Analysis; KEGG, Kyoto Encyclopedia of Genes and Genomes.
To investigate the role of immune cells and immunotherapy in relation to prognostic genes, an immune microenvironment analysis was conducted. Immune infiltration data revealed significant disparities in the distribution of 10 immune cell types between the high- and low-risk groups (Figures 6A, B). Resting dendritic cells showed the strongest positive correlation with GLB1L3 (r = 0.259), while regulatory T cells exhibited the most negative association with CREG2 (r = -0.177) (Figure 6C). Additionally, correlations between prognostic genes and immunomolecules revealed notable relationships: CREG2 was strongly positively correlated with chemokine CCL26 (r = 0.540), PVRL2 was linked with B3GNT3 (r = 0.510), NT5E with B3GNT3 (r = 0.440), and HLA-DMA with GLB1L3 (r = 0.460) (Figures 6D–G).

Figure 6. Immune infiltration analysis and response to immunotherapy. (A) Heatmap showing immune cell distribution in the training set. (B) Box plot comparing immune cell distribution between high- and low-risk groups. (C) Heatmap illustrating correlations between immune cell subtypes and prognostic genes. (D) Heatmap of correlations between chemokines and prognostic genes. (E) Heatmap of genetic correlations between immunostimulatory factors and prognosis. (F) Heatmap of histocompatibility complex and prognostic gene correlations. (G) Heatmap of correlations between immunosuppressants and prognostic genes.
Further analysis identified the most prominent correlation between the risk score and immune cycle Step 4: Treg cells (r = 0.051) as well as the immunotherapy pathway Base_excision_repair (r = 0.130) (Figures 7A, B). Immune checkpoint analysis revealed significant differences in expression levels of ASXL1, BCL2, CD274, CD33, CD47, CHEK1, CTLA4, DOT1L, FLT3, MCL1, MDM2, MLH1, PDCD1, and PLK1 between the two risk groups (Figure 7C). Notably, CD274, CHEK1, DOT1L, IDH1, PDCD1, and PLK1 positively correlated with risk scores, while ASXL1, BCL2, CD33, CD47, CTLA4, FLT3, IDH2, MCL1, MDM2, and MLH1 exhibited negative correlations (Figure 7D). Moreover, IPS analysis revealed significant differences in the levels of PD1/PDL1/PDL2 blockers between the high- and low-risk groups (Figure 7E).

Figure 7. Immunotherapeutic response analysis and qRT-PCR validation. (A) Heatmap showing the correlation between risk scores and immune pathways in the training set. (B) Heatmap illustrating the correlation between risk scores and immune cycles in the training set. (C) Box plots of ICI-related gene expression in high- and low-risk groups. (D) Correlation analysis of ICI expression differential genes between high- and low-risk groups. (E) Comparison of IPS scores between groups. (F) Differential analysis of drug IC50 values between high- and low-risk groups. (G) Expression analysis of prognostic genes in high- and low-risk groups. (H) qRT-PCR validation of prognostic gene expression. ICI, immune checkpoint inhibitors. *p < 0.05; **p < 0.01; ***p < 0.001; ****p < 0.0001.
Chemotherapy sensitivity analysis identified 119 compounds with significantly distinct IC50 values between the two risk groups, including A.443654 and A.770041 (Figure 7F). In the TCGA-NSCLC dataset, eight prognostic genes were significantly differentially expressed between tumor and normal tissues, with MYRF showing reduced expression and the remaining genes upregulated in tumors (Figure 7G). qRT-PCR analysis confirmed the consistent expression patterns of most prognostic genes in the TCGA-NSCLC dataset, except for NLRP10. Notably, the expression levels of B3GNT3, GLB1L3, and AHNAK2 did not show significant differences, possibly due to the limited sample size (Figure 7H).
In the era of precision medicine, the management of NSCLC has been revolutionized by targeted therapies and immunotherapies, particularly immune checkpoint inhibitors, which have significantly improved survival outcomes for certain patient subsets (35, 36). However, a substantial proportion of patients remain unresponsive to these treatments, highlighting the urgent need to identify novel therapeutic targets (3–5). Ferritinophagy, a selective autophagic process responsible for the degradation of intracellular ferritin, plays a pivotal role in ferroptosis (11, 37, 38). Targeting pathways that promote ferroptosis thus represents a promising avenue for developing innovative anticancer therapies (39, 40). In this study, we identified and validated ferritinophagy-related prognostic genes in NSCLC, constructed a robust prognostic model, and explored their functional roles and potential as predictive biomarkers for immunotherapy response. Our findings provide new insights into the interplay between ferritinophagy, ferroptosis, and the tumor immune microenvironment, offering potential strategies to enhance therapeutic efficacy in NSCLC.
Initially, NSCLC samples were scored based on FRGs from the TCGA-NSCLC dataset, revealing significant survival differences between the high- and low-scoring groups, underscoring the prognostic value of FRGs in NSCLC. While previous studies have investigated FRGs in glioma and head and neck cancers, similar research in NSCLC has been limited (41, 42). The overlapping genes from DEGs and key module genes were selected as candidate genes for further investigation. GO and KEGG enrichment analyses of these genes indicated their involvement in several key functions and pathways, including the PI3K-AKT signaling pathway, Ras signaling pathway, and cytokine-cytokine receptor interaction. The PI3K-AKT pathway, a key driver of NSCLC, not only promotes tumor growth but also suppresses ferroptosis by enhancing lipid metabolism and antioxidant defense through mechanisms such as SREBP1/SCD1-mediated lipogenesis (43). Inhibition of this pathway, as demonstrated by compounds like auriculasin, sensitizes NSCLC cells to ferroptosis, highlighting its therapeutic potential (44). Additionally, Ras signaling pathway increases reactive oxygen species (ROS) and alter lipid metabolism, promoting both cancer progression and sensitivity to ferroptosis. The enrichment of Ras signaling pathway suggests a potential crosstalk between Ras signaling and ferritinophagy, further expanding the mechanistic understanding of FRGs in NSCLC (45).
Eight prognostic genes—KLK8, MFI2, B3GNT3, MYRF, CREG2, GLB1L3, AHNAK2, and NLRP10—were identified, and a risk model based on these genes effectively predicts the survival of patients with NSCLC. Several of these genes have been shown to be significantly associated with NSCLC initiation and progression. KLK8 (human kallikrein 8) impedes lung cancer cell invasiveness by degrading fibronectin, reducing integrin signaling, and inhibiting actin polymerization, thus slowing cancer cell motility (46). Both in vivo studies and clinical data from patients with NSCLC reveal that elevated KLK8 levels correlate with slower tumor growth, reduced invasion, and extended time to postoperative recurrence, particularly in early-stage cases (47). KLK8’s potential role in ferritinophagy remains unexplored, but its involvement in extracellular matrix remodeling suggests it may influence iron homeostasis and tumor microenvironment dynamics (48, 49). MFI2 (melanotransferrin) accelerates NSCLC progression by promoting cell proliferation, metastasis, and invasion through miR-107-mediated NFAT5 elevation, PI3K/AKT pathway activation, and facilitating exosome-mediated progression and pre-metastatic niche formation (50). MFI2’s role in iron transport and its potential interaction with ferritinophagy warrant further investigation, as iron dysregulation is a hallmark of cancer progression. Notably, an MFI2-targeting antibody-drug conjugate is currently in phase I trials, highlighting its therapeutic potential (51). B3GNT3 is associated with poor prognosis in NSCLC, particularly in lung adenocarcinoma, where it influences cell apoptosis and holds promise as an early cancer screening marker (52, 53). Its role in cancer stem cell self-renewal and carbohydrate metabolism suggests it may intersect with ferritinophagy pathways, particularly in regulating iron-dependent cell death, which is critical for tumor suppression (54). Additionally, mutations in AHNAK2, particularly deleterious ones, are linked to improved responses to ICIs in NSCLC, opening new avenues for predictive biomarker development. Patients with NSCLC harboring AHNAK2 mutations exhibit higher tumor mutation burden (TMB), indicating enhanced tumor immunogenicity, and these mutations are associated with an activated immune microenvironment, marked by increased immune cell infiltration and activation (55). Although the roles of MYRF, CREG2, and NLRP10 in NSCLC have not been extensively studied, their involvement in other cancers has been documented. MYRF has been identified as a target of miR-199b-5p, promoting pancreatic cancer progression (56). Higher expression of CREG2 correlates with shorter survival times in esophageal squamous cell carcinoma (57). Moreover, NLRP10 is associated with a poor prognosis in endometrial cancer by inhibiting NF-κB activation and apoptosis, along with caspase-1-mediated IL-1β maturation (58). GLB1L3, expressed predominantly in the central nervous system, is involved in carbohydrate metabolism and beta-galactosidase activity, and has been implicated in schizophrenia (59, 60). No reports have yet linked GLB1L3 to malignancies. To the best of our knowledge, this study is the first to explore ferritinophagy-related genes in NSCLC. Further investigation is required to clarify the specific role of these genes in ferritinophagy within NSCLC and to assess their potential impact on iron metabolism and tumor progression.
Additionally, significant correlations between specific immune cells and prognostic genes were identified. Tumor microenvironment (TME) analysis using CIBERSORT revealed that the high-risk scoring group had lower proportions of regulatory T cells (Tregs), monocytes, resting mast cells, memory B cells, resting dendritic cells, activated mast cells, and resting memory CD4+ T cells. In contrast, this group exhibited higher proportions of M0 macrophages, M1 macrophages, and resting NK cells. These findings suggest that ferritinophagy-related genes may modulate immune cell infiltration, influencing NSCLC progression and patient outcomes. M0 macrophages, often associated with poor prognosis in cancers such as pancreatic cancer and hepatocellular carcinoma (61, 62), were enriched in the high-risk group, consistent with their pro-tumorigenic role. In contrast, M1 macrophages, which exhibit anti-tumor activity, were also elevated, suggesting a complex balance between pro- and anti-tumor immune responses. Ferritinophagy may influence macrophage polarization by regulating iron homeostasis, as iron accumulation is known to drive M2-like polarization and immunosuppression (63, 64). Targeting ferritinophagy could thus reprogram macrophages toward an anti-tumor phenotype, enhancing immunotherapy efficacy. Tregs, linked to poor prognosis in various cancers (65–67), were reduced in the high-risk group. While Tregs typically suppress anti-tumor immunity, their reduction in this context may reflect a dysregulated immune microenvironment. Ferritinophagy could modulate Treg activity by altering iron availability, which is critical for T cell function (68, 69). Further research is needed to explore whether ferritinophagy inhibition can selectively target Tregs while preserving effector T cell responses. Monocytes, associated with poor prognosis in early-stage lung squamous cell carcinoma (70), were decreased in the high-risk group, while resting dendritic cells, linked to better prognosis in lung cancer (71, 72), were also reduced. Dendritic cells play a crucial role in antigen presentation and T cell activation, and their suppression may contribute to immune evasion (73). Ferritinophagy may influence dendritic cell function by regulating iron-dependent processes such as antigen processing and cytokine production (68, 74). Resting mast cells, which regulate the TME and are associated with better prognosis in lung adenocarcinoma (75), were decreased in the high-risk group. Conversely, resting memory CD4+ T cells, linked to improved outcomes in lung adenocarcinoma (76), were also reduced. These findings suggest that ferritinophagy-related genes like GLB1L3 and AHNAK2 may modulate immune-inflammatory mechanisms in NSCLC. Elevated GLB1L3 expression was associated with increased resting dendritic cells, while high AHNAK2 expression correlated with decreased resting mast cells, highlighting their potential roles in shaping the immune landscape.
Finally, based on the GDSC database alongside established prognostic models, potential therapeutic targets and associated compounds for NSCLC were identified. These include inhibitors targeting the cell cycle (ABT.263 and AUY922), the PI3K/Akt pathway (A-443654), and the MAPK pathway (AICAR). ABT.263, a Bcl-xL/Bcl-2 inhibitor, not only induces apoptosis but may also enhance ferroptosis, by disrupting mitochondrial membrane potential and increasing lipid peroxidation (77, 78). This dual mechanism could explain its strong synergistic effect with TRAIL-inducing compounds like ONC201/TIC10, which has shown efficacy across multiple cancer types, including NSCLC (79). AUY922, an HSP90 inhibitor, demonstrates synergistic anti-cancer activity with lapatinib in HER2-positive cancers by destabilizing oncogenic client proteins and modulating stress responses, potentially including ferroptosis-related pathways (80). A-443654, an AKT pathway inhibitor, suppresses tumor growth by inducing apoptosis and may further sensitize NSCLC cells to ferroptosis through metabolic reprogramming and inhibition of survival signaling (81–83). AICAR, a purine biosynthesis intermediate, inhibits EGFR-mutant NSCLC by inducing DNA damage and apoptosis, with potential crosstalk with ferroptosis through AMPK activation and subsequent modulation of lipid metabolism (84). This approach highlights the potential of AICAR as a therapeutic agent in targeting resistant cancer cells by exploiting the interconnected pathways of apoptosis and ferroptosis (85). These findings highlight the therapeutic potential of targeting ferritinophagy-related mechanisms in NSCLC. Future research could explore combination strategies, such as pairing ferroptosis inducers with immune checkpoint inhibitors, to overcome resistance and improve outcomes in NSCLC treatment.
A key contribution of this study is the development of a novel prognostic model that effectively distinguishes survival outcomes and immunotherapeutic responses in NSCLC, integrating clinical characteristics, immune infiltration, and drug sensitivity. However, there are some limitations to this study. First, the clinical sample size was relatively small, which may affect the broad applicability of the results. Second, the molecular mechanisms regarding the FRGs involved in NSCLC are still incompletely understood, and thus further in-depth studies on the significance of these genes in diagnosis and treatment are needed. In the future, we plan to collect more clinical samples and conduct large-scale, prospective randomized controlled trials to further validate the results of this study and optimize treatment strategies.
In this study, we developed a novel prognostic model using machine-learning techniques and TCGA data to predict overall survival in NSCLC patients. This model not only accurately estimates survival probabilities but also identifies a risk score strongly associated with the immune microenvironment and clinicopathological features. Importantly, our findings highlight the critical role of ferritinophagy-related genes in NSCLC prognosis and their potential influence on ferroptosis and immune regulation. Based on these findings, prognostic genes may serve as potential therapeutic targets to drive the development of novel therapeutic agents. In addition, the application of this model not only provides new ideas for the early diagnosis of NSCLC, but also provides an important basis for the development of personalized therapeutic regimens, which is of great clinical significance.
The datasets analyzed for this study can be found in the UCSC Xena website, TCGA-NSCLC (https://xena.ucsc.edu/), Gene Expression Omnibus (GEO) (https://www.ncbi.nlm.nih.gov/geo/), GeneCards database (https://www.genecards.org/).
The studies involving humans were approved by Ethics Committee of Shanxi Province Cancer Hospital. The studies were conducted in accordance with the local legislation and institutional requirements. The ethics committee/institutional review board waived the requirement of written informed consent for participation from the participants or the participants’ legal guardians/next of kin because in this study, tissue samples from six non-small cell lung cancer patients were utilized for PCR validation. The study was conducted without any intervention, ensuring it did not interfere with routine diagnosis or treatment, affect any medical rights of the patients, or increase their risk. The tissue samples were obtained from our hospital’s biological sample bank, and all patients had previously signed informed consent for the retention of these samples. Therefore, written informed consent was waived for this study.
YH: Conceptualization, Methodology, Visualization, Writing – original draft, Writing – review and editing. XW: Data curation, Software, Writing – review and editing. ZN: Investigation, Resources, Writing – review and editing. YM: Formal Analysis, Writing – review and editing. JW: Validation, Writing – review and editing. WS: Project administration, Supervision, Writing – review and editing.
The author(s) declare that no financial support was received for the research, authorship, and/or publication of this article.
We thank all participants and the TCGA and GEO for sharing data.
The authors declare that the research was conducted in the absence of any commercial or financial relationships that could be construed as a potential conflict of interest.
All claims expressed in this article are solely those of the authors and do not necessarily represent those of their affiliated organizations, or those of the publisher, the editors and the reviewers. Any product that may be evaluated in this article, or claim that may be made by its manufacturer, is not guaranteed or endorsed by the publisher.
FRGs, ferritinophagy-related genes; qRT-PCR, quantitative reverse transcriptase polymerase chain reaction; AUC, area under the curve; ICI, immune checkpoints; IPS, immunophenoscores; ROC, receiver operating characteristic; KM, Kaplan-Meier; PH, proportional hazards; WGCNA, weighted gene co-expression network analysis; LASSO, least absolute shrinkage and selection operator; KEGG, Kyoto Encyclopedia of Genes and Genomes; GO, Gene Ontology; PPI, protein-protein interaction; NSCLC, non-small cell lung cancer; LUAD, lung adenocarcinoma; LUSC, Lung Squamous Carcinoma; TCGA, The Cancer Genome Atlas; GEO, Gene Expression Omnibus; ssGSEA, single sample gene set enrichment analysis; DEGs, differentially expressed genes.
1. Duma N, Santana-Davila R, Molina J. Non-small cell lung cancer: Epidemiology, screening, diagnosis, and treatment. Mayo Clin Proc. (2019) 94:1623–40. doi: 10.1016/j.mayocp.2019.01.013
2. Miller K, Siegel R, Lin C, Mariotto A, Kramer J, Rowland J, et al. Cancer treatment and survivorship statistics, 2016. CA Cancer J Clin. (2016) 66:271–89. doi: 10.3322/caac.21349
3. Gibney G, Weiner L, Atkins M. Predictive biomarkers for checkpoint inhibitor-based immunotherapy. Lancet Oncol. (2016) 17:e542–51. doi: 10.1016/S1470-2045(16)30406-5
4. Topalian S, Taube J, Anders R, Pardoll D. Mechanism-driven biomarkers to guide immune checkpoint blockade in cancer therapy. Nat Rev Cancer. (2016) 16:275–87. doi: 10.1038/nrc.2016.36
5. Chen D, Mellman I. Elements of cancer immunity and the cancer-immune set point. Nature. (2017) 541:321–30. doi: 10.1038/nature21349
6. Friedmann Angeli J, Krysko D, Conrad M. Ferroptosis at the crossroads of cancer-acquired drug resistance and immune evasion. Nat Rev Cancer. (2019) 19:405–14. doi: 10.1038/s41568-019-0149-1
7. Dixon S, Lemberg K, Lamprecht M, Skouta R, Zaitsev E, Gleason C, et al. Ferroptosis: An iron-dependent form of nonapoptotic cell death. Cell. (2012) 149:1060–72. doi: 10.1016/j.cell.2012.03.042
8. Park E, Chung SW. ROS-mediated autophagy increases intracellular iron levels and ferroptosis by ferritin and transferrin receptor regulation. Cell Death Dis. (2019) 10:822. doi: 10.1038/s41419-019-2064-5
9. Zhou B, Liu J, Kang R, Klionsky D, Kroemer G, Tang D. Ferroptosis is a type of autophagy-dependent cell death. Semin Cancer Biol. (2020) 66:89–100. doi: 10.1016/j.semcancer.2019.03.002
10. Hou W, Xie Y, Song X, Sun X, Lotze M, Zeh H III, et al. Autophagy promotes ferroptosis by degradation of ferritin. Autophagy. (2016) 12:1425–8. doi: 10.1080/15548627.2016.1187366
11. Li J, Feng Y, Li Y, He P, Zhou Q, Tian Y, et al. Ferritinophagy: A novel insight into the double-edged sword in ferriti nophagy-ferroptosis axis and human diseases. Cell Prolif. (2024) 57:e13621. doi: 10.1111/cpr.13621
12. Rochette L, Dogon G, Rigal E, Zeller M, Cottin Y, Vergely C. Lipid peroxidation and iron metabolism: Two corner stones in the homeostasis control of ferroptosis. Int J Mol Sci. (2022) 24:449. doi: 10.3390/ijms24010449
13. Wang J, Wu N, Peng M, Oyang L, Jiang X, Peng Q, et al. Ferritinophagy: Research advance and clinical significance in cancers. Cell Death Discov. (2023) 9:463. doi: 10.1038/s41420-023-01753-y
14. Zhao L, Miao H, Quan M, Wang S, Zhang Y, Zhou H, et al. β-Lapachone induces ferroptosis of colorectal cancer cells via NCOA4-mediated ferritinophagy by activating JNK pathway. Chem Biol Interact. (2024) 389:110866. doi: 10.1016/j.cbi.2024.110866
15. Santana-Codina N, Del Rey M, Kapner K, Zhang H, Gikandi A, Malcolm C, et al. NCOA4-mediated ferritinophagy is a pancreatic cancer dependency via maintenance of iron bioavailability for iron-sulfur cluster proteins. Cancer Discov. (2022) 12:2180–97. doi: 10.1158/2159-8290.CD-22-0043
16. Xiu Z, Li Y, Fang J, Han J, Li S, Li Y, et al. Inhibitory effects of esculetin on liver cancer through triggering NCOA4 pathway-Mediation ferritinophagy in vivo and in vitro. J Hepatocell Carcinoma. (2023) 10:611–29. doi: 10.2147/JHC.S395617
17. Wang H, Hu Q, Chen Y, Huang X, Feng Y, Shi Y, et al. Ferritinophagy mediates adaptive resistance to EGFR tyrosine kinase inhibitors in non-small cell lung cancer. Nat Commun. (2024) 15:4195. doi: 10.1038/s41467-024-48433-8
18. Liu Z, Liu C, Fan C, Li R, Zhang S, Liu J, et al. E3 ubiquitin ligase DTX2 fosters ferroptosis resistance via suppressing NCOA4-mediated ferritinophagy in non-small cell lung cancer. Drug Resist Updat. (2024) 77:101154. doi: 10.1016/j.drup.2024.101154
19. Wu A, Yang H, Xiao T, Gu W, Li H, Chen P. COPZ1 regulates ferroptosis through NCOA4-mediated ferritinophagy in lung adenocarcinoma. Biochim Biophys Acta Gen Subj. (2024) 1868:130706. doi: 10.1016/j.bbagen.2024.130706
20. Wang Z, Yao X, Wang K, Wang B. TFR1-mediated iron metabolism orchestrates tumor ferroptosis and immunity in non-small cell lung cancer. J Environ Pathol Toxicol Oncol. (2024) 43:1–12. doi: 10.1615/JEnvironPatholToxicolOncol.2023049084
21. Liu J, Zhou S, Chen J, Lin H, Li Y, Zhang X, et al. Nrf2 inhibition and NCOA4-mediated ferritinophagy activation synergistically exacerbated S-3’-hydroxy-7’, 2’, 4’-trimethoxyisoxane induced ferroptosis in lung cancer cells. Chem Biol Interact. (2025) 406:111353. doi: 10.1016/j.cbi.2024.111353
22. Wang G, Li J, Zhu L, Zhou Z, Ma Z, Zhang H, et al. Identification of hepatocellular carcinoma-related subtypes and development of a prognostic model: A study based on ferritinophagy-related genes. Discov Oncol. (2023) 14:147. doi: 10.1007/s12672-023-00756-6
23. Wang B, Feng Y, Li Z, Zhou F, Luo J, Yang B, et al. Identification and validation of chromatin regulator-related signatures as a novel prognostic model for low-grade gliomas using translational bioinformatics. Life Sci. (2024) 336:122312. doi: 10.1016/j.lfs.2023.122312
24. Liu J, Lichtenberg T, Hoadley K, Poisson L, Lazar A, Cherniack A, et al. An integrated TCGA pan-cancer clinical data resource to drive high-quality survival outcome analytics. Cell. (2018) 173:400–16.e11.
25. Langfelder P, Horvath S. WGCNA: An R package for weighted correlation network analysis. BMC Bioinformatics. (2008) 9:559. doi: 10.1186/1471-2105-9-559
26. Love M, Huber W, Anders S. Moderated estimation of fold change and dispersion for RNA-seq data with DESeq2. Genome Biol. (2014) 15:550. doi: 10.1186/s13059-014-0550-8
27. Gustavsson E, Zhang D, Reynolds R, Garcia-Ruiz S, Ryten M. ggtranscript: An R package for the visualization and interpretation of transcript isoforms using ggplot2. Bioinformatics. (2022) 38:3844–6. doi: 10.1093/bioinformatics/btac409
28. Gu Z, Eils R, Schlesner M. Complex heatmaps reveal patterns and correlations in multidimensional genomic data. Bioinformatics. (2016) 32:2847–9. doi: 10.1093/bioinformatics/btw313
29. Gao C, Yu G, Cai P. ggVennDiagram: An intuitive, easy-to-use, and highly customizable R package to generate venn diagram. Front Genet. (2021) 12:706907. doi: 10.3389/fgene.2021.706907
30. Yu G, Wang L, Han Y, He Q. clusterProfiler: An R package for comparing biological themes among gene clusters. Omics. (2012) 16:284–7. doi: 10.1089/omi.2011.0118
31. Friedman J, Hastie T, Tibshirani R. Regularization paths for generalized linear models via coordinate descent. J Stat Softw. (2010) 33:1–22. doi: 10.18637/jss.v033.i01
32. Heagerty P, Lumley T, Pepe M. Time-dependent ROC curves for censored survival data and a diagnostic marker. Biometrics. (2000) 56:337–44. doi: 10.1111/j.0006-341X.2000.00337.x
33. Sturm G, Finotello F, List M. Immunedeconv: An R package for unified access to computational methods for estimating immune cell fractions from bulk RNA-sequencing data. Methods Mol Biol. (2020) 2120:223–32. doi: 10.1007/978-1-0716-0327-7_16
34. Geeleher P, Cox N, Huang R. pRRophetic: An R package for prediction of clinical chemotherapeutic response from tumor gene expression levels. PLoS One. (2014) 9:e107468. doi: 10.1371/journal.pone.0107468
35. Galluzzi L, Humeau J, Buqué A, Zitvogel L, Kroemer G. Immunostimulation with chemotherapy in the era of immune checkpoint inhibitors. Nat Rev Clin Oncol. (2020) 17:725–41. doi: 10.1038/s41571-020-0413-z
36. Vokes N, Pan K, Le X. Efficacy of immunotherapy in oncogene-driven non-small-cell lung cancer. Ther Adv Med Oncol. (2023) 15:1–20. doi: 10.1177/17588359231161409
37. Shesh B, Connor JR. A novel view of ferritin in cancer. Biochim Biophys Acta Rev Cancer. (2023) 1878:188917. doi: 10.1016/j.bbcan.2023.188917
38. Liu Y, Gong Y, Sun Q, Wang B, Yan Y, Chen Y, et al. Ferritinophagy induced ferroptosis in the management of cancer. Cell Oncol (Dordr). (2024) 47:19–35. doi: 10.1007/s13402-023-00858-x
39. Chen X, Kang R, Kroemer G, Tang D. Broadening horizons: The role of ferroptosis in cancer. Nat Rev Clin Oncol. (2021) 18:280–96. doi: 10.1038/s41571-020-00462-0
40. Wang W, Green M, Choi J, Gijón M, Kennedy P, Johnson J, et al. CD8(+) T cells regulate tumour ferroptosis during cancer immunotherapy. Nature. (2019) 569:270–4. doi: 10.1038/s41586-019-1170-y
41. Sun W, Yan J, Ma H, Wu J, Zhang Y. Autophagy-dependent ferroptosis-related signature is closely associated with the prognosis and tumor immune escape of patients with glioma. Int J Gen Med. (2022) 15:253–70. doi: 10.2147/IJGM.S343046
42. Lee J, You J, Roh J. Poly(rC)-binding protein 1 represses ferritinophagy-mediated ferroptosis in head and neck cancer. Redox Biol. (2022) 51:102276. doi: 10.1016/j.redox.2022.102276
43. Yi J, Zhu J, Wu J, Thompson C, Jiang X. Oncogenic activation of PI3K-AKT-mTOR signaling suppresses ferroptosis via SREBP-mediated lipogenesis. Proc Natl Acad Sci U S A. (2020) 117:31189–97. doi: 10.1073/pnas.2017152117
44. Wang X, Zhang T, Qu L, Zhang Y, Gao G. Auriculasin induces mitochondrial oxidative stress and drives ferroptosis by inhibiting PI3K/Akt pathway in non-small cell lung cancer. Naunyn Schmiedebergs Arch Pharmacol. (2025) 398:967–77. doi: 10.1007/s00210-024-03328-9
45. Bartolacci C, Andreani C, El-Gammal Y, Scaglioni P. Lipid metabolism regulates oxidative stress and ferroptosis in RAS-driven cancers: A perspective on cancer progression and therapy. Front Mol Biosci. (2021) 8:706650. doi: 10.3389/fmolb.2021.706650
46. Planque C, Choi Y, Guyetant S, Heuzé-Vourc’h N, Briollais L, Courty Y. Alternative splicing variant of kallikrein-related peptidase 8 as an i ndependent predictor of unfavorable prognosis in lung cancer. Clin Chem. (2010) 56:987–97. doi: 10.1373/clinchem.2009.138917
47. Sher Y, Chou C, Chou R, Wu H, Wayne Chang W, Chen C, et al. Human kallikrein 8 protease confers a favorable clinical outcome in non-small cell lung cancer by suppressing tumor cell invasiveness. Cancer Res. (2006) 66:11763–70. doi: 10.1158/0008-5472.CAN-06-3165
48. Jung M, Weigert A, Mertens C, Rehwald C, Brüne B. Iron handling in tumor-associated macrophages-is there a new role for Lipocalin-2? Front Immunol. (2017) 8:1171. doi: 10.3389/fimmu.2017.01171
49. DeRosa A, Leftin A. The iron curtain: Macrophages at the interface of systemic and microenvironmental iron metabolism and immune response in cancer. Front Immunol. (2021) 12:614294. doi: 10.3389/fimmu.2021.614294
50. Xu J, Wang H, Shi B, Li N, Xu G, Yan X, et al. Exosomal MFI2-AS1 sponge miR-107 promotes non-small cell lung cancer progression through NFAT5. Cancer Cell Int. (2023) 23:51. doi: 10.1186/s12935-023-02886-x
51. Mazahreh R, Mason M, Gosink J, Olson D, Thurman R, Hale C, et al. SGN-CD228A is an investigational CD228-directed antibody-drug conjugate with potent antitumor activity across a wide spectrum of preclinical solid tumor models. Mol Cancer Ther. (2023) 22:421–34. doi: 10.1158/1535-7163.MCT-22-0401
52. Gao L, Zhang H, Zhang B, Zhu J, Chen C, Liu W. B3GNT3 overexpression is associated with unfavourable survival in non-small cell lung cancer. J Clin Pathol. (2018) 71:642–7. doi: 10.1136/jclinpath-2017-204860
53. Hu J, Yu H, Sun L, Yan Y, Zhang L, Jiang G, et al. Identification of an individualized metabolism prognostic signature and related therapy regimens in early stage lung adenocarcinoma. Front Oncol. (2021) 11:650853. doi: 10.3389/fonc.2021.650853
54. Ma H, Chen X, Mo S, Zhang Y, Mao X, Chen J, et al. Targeting N-glycosylation of 4F2hc mediated by glycosyltransferase B3GNT3 sensitizes ferroptosis of pancreatic ductal adenocarcinoma. Cell Death Differ. (2023) 30:1988–2004. doi: 10.1038/s41418-023-01188-z
55. Cui Y, Liu X, Wu Y, Liang X, Dai J, Zhang Z, et al. Deleterious AHNAK2 mutation as a novel biomarker for immune checkpoint inhibitors in non-small cell lung cancer. Front Oncol. (2022) 12:798401. doi: 10.3389/fonc.2022.798401
56. Yang X, Wang L, Zhou F, Ye S, Sun Q. Yin Yang 1-induced activation of LINC01133 facilitates the progression of pancreatic cancer by sponging miR-199b-5p to upregulate myelin regulatory factor expression. Bioengineered. (2022) 13:13352–65. doi: 10.1080/21655979.2022.2038900
57. Alotaibi A, Gadekar V, Gundla P, Mandarthi S, Jayendra N, Tungekar A, et al. Global comparative transcriptomes uncover novel and population-specifi c gene expression in esophageal squamous cell carcinoma. Infect Agent Cancer. (2023) 18:47. doi: 10.1186/s13027-023-00525-8
58. Kaur D, Arora C, Raghava G. Prognostic biomarker-based identification of drugs for managing the treatment of endometrial cancer. Mol Diagn Ther. (2021) 25:629–46. doi: 10.1007/s40291-021-00539-1
59. Li C, Yang T, Ou R, Shang H. Overlapping genetic architecture between schizophrenia and neurodegene rative disorders. Front Cell Dev Biol. (2021) 9:797072. doi: 10.3389/fcell.2021.797072
60. Levinson D, Duan J, Oh S, Wang K, Sanders A, Shi J, et al. Copy number variants in schizophrenia: Confirmation of five previous f indings and new evidence for 3q29 microdeletions and VIPR2 duplications. Am J Psychiatry. (2011) 168:302–16. doi: 10.1176/appi.ajp.2010.10060876
61. Farha M, Jairath N, Lawrence T, El Naqa I. Characterization of the tumor immune microenvironment identifies M0 macrophage-enriched cluster as a poor prognostic factor in hepatocellular carcinoma. Clin Cancer Inform. (2020) 4:1002–13. doi: 10.1200/CCI.20.00077
62. Zhao J, Li Y, Wu Y, Zhang K, Peng L, Chen H. Revealing platelet-related subtypes and prognostic signature in pancreatic adenocarcinoma. BMC Med Genomics. (2023) 16:106. doi: 10.1186/s12920-023-01530-x
63. Recalcati S, Locati M, Gammella E, Invernizzi P, Cairo G. Iron levels in polarized macrophages: Regulation of immunity and autoimmunity. Autoimmun Rev. (2012) 11:883–9. doi: 10.1016/j.autrev.2012.03.003
64. Kao J, Wang S, Ho L, Huang S, Lee C, Lee M, et al. M2-like polarization of THP-1 monocyte-derived macrophages under chronic iron overload. Ann Hematol. (2020) 99:431–41. doi: 10.1007/s00277-020-03916-8
65. Kos K, Salvagno C, Wellenstein M, Aslam M, Meijer D, Hau C, et al. Tumor-associated macrophages promote intratumoral conversion of conventional CD4+T cells into regulatory T cells via PD-1 signalling. Oncoimmunology. (2022) 11:2063225. doi: 10.1080/2162402X.2022.2063225
66. Xu S, Chen W, Wang Y, Zhang Y, Xia R, Shen J, et al. N6-methyladenosine-related lncRNAs identified as potential biomarkers for predicting the overall survival of Asian gastric cancer patients. BMC Cancer. (2022) 22:721. doi: 10.1186/s12885-022-09801-z
67. Qu X, Zhao X, Lin K, Wang N, Li X, Li S, et al. M2-like tumor-associated macrophage-related biomarkers to construct a novel prognostic signature, reveal the immune landscape, and screen drugs in hepatocellular carcinoma. Front Immunol. (2022) 13:994019. doi: 10.3389/fimmu.2022.994019
68. Zhang T, Liu Q, Chen Q, Wu H. Iron regulatory protein two facilitates ferritinophagy and DNA damage/repair through guiding ATG9A trafficking. J Biol Chem. (2024) 300:107767. doi: 10.1016/j.jbc.2024.107767
69. Mancias J, Pontano Vaites L, Nissim S, Biancur D, Kim A, Wang X, et al. Ferritinophagy via NCOA4 is required for erythropoiesis and is regulated by iron dependent HERC2-mediated proteolysis. Elife. (2015) 4:e10308. doi: 10.7554/eLife.10308
70. Fan T, Lu Z, Liu Y, Wang L, Tian H, Zheng Y, et al. A novel immune-related seventeen-Gene signature for predicting early stage lung squamous cell carcinoma prognosis. Front Immunol. (2021) 12:665407. doi: 10.3389/fimmu.2021.665407
71. Baleeiro R, Anselmo L, Soares F, Pinto C, Ramos O, Gross J, et al. High frequency of immature dendritic cells and altered in situ production of interleukin-4 and tumor necrosis factor-alpha in lung cancer. Cancer Immunol Immunother. (2008) 57:1335–45. doi: 10.1007/s00262-008-0468-7
72. Zeid N, Muller H. S100 positive dendritic cells in human lung tumors associated with cell differentiation and enhanced survival. Pathology. (1993) 25:338–43. doi: 10.3109/00313029309090853
73. Sharma P, Zhang X, Ly K, Kim J, Wan Q, Kim J, et al. Hyperglycosylation of prosaposin in tumor dendritic cells drives immune escape. Science. (2024) 383:190–200. doi: 10.1126/science.adg1955
74. Verna G, Liso M, De Santis S, Dicarlo M, Cavalcanti E, Crovace A, et al. Iron overload mimicking conditions skews bone marrow dendritic cells differentiation into MHCII(low)CD11c+CD11b+F4/80+ cells. Int J Mol Sci. (2020) 21:1353. doi: 10.3390/ijms21041353
75. Bie F, Tian H, Sun N, Zang R, Zhang M, Song P, et al. Comprehensive analysis of PD-L1 expression, tumor-infiltrating lymphocytes, and tumor microenvironment in LUAD: Differences between Asians and Caucasians. Clin Epigenetics. (2021) 13:229. doi: 10.1186/s13148-021-01221-3
76. Wang Y, Xie C, Su Y. A novel anoikis-related gene signature to predict the prognosis, immune infiltration, and therapeutic outcome of lung adenocarcinoma. J Thorac Dis. (2023) 15:1335–52. doi: 10.21037/jtd-23-149
77. Neitemeier S, Jelinek A, Laino V, Hoffmann L, Eisenbach I, Eying R, et al. BID links ferroptosis to mitochondrial cell death pathways. Redox Biol. (2017) 12:558–70. doi: 10.1016/j.redox.2017.03.007
78. Lee Y, Kalimuthu K, Park Y, Luo X, Choudry M, Bartlett D, et al. BAX-dependent mitochondrial pathway mediates the crosstalk between ferroptosis and apoptosis. Apoptosis. (2020) 25:625–31. doi: 10.1007/s10495-020-01627-z
79. Di Cristofano F, Fong M, Huntington K, Carneiro B, Zhou L, El-Deiry W. Synergistic activity of ABT-263 and ONC201/TIC10 against solid tumor cell lines is associated with suppression of anti-apoptotic Mcl-1, BAG3, pAkt, and upregulation of pro-apoptotic Noxa and Bax cleavage during apoptosis. Am J Cancer Res. (2023) 13:307–25. doi: 10.1158/1538-7445.AM2022-3709
80. Park K, Hong Y, Choi J, Yoon S, Kang J, Kim D, et al. HSP90 inhibitor, AUY922, debilitates intrinsic and acquired lapatinib-resistant HER2-positive gastric cancer cells. BMB Rep. (2018) 51:660–5. doi: 10.5483/BMBRep.2018.51.12.259
81. Tang X, Teng J, Lu K. Phillyrin sensitizes lung cancer cells to ferroptosis through inhibiting FTH1/SLC7A11 axis. Int J Clin Pharmacol Ther. (2024) 62:8–19. doi: 10.5414/CP204475
82. Wu Y, Wang D, Lou Y, Liu X, Huang P, Jin M, et al. Regulatory mechanism of α-hederin upon cisplatin sensibility in NSCLC at safe dose by destroying GSS/GSH/GPX2 axis-mediated glutathione oxidation-reduction system. Biomed Pharmacother. (2022) 150:112927. doi: 10.1016/j.biopha.2022.112927
83. Chen Z, Yang J, Li Y, Zeng W, Bai Y, Ding C, et al. Integration of single-cell and bulk RNA-seq to establish a predictive signature based on the differentiation trajectory of M2 macrophages in lung adenocarcinoma. Front Genet. (2022) 13:1010440. doi: 10.3389/fgene.2022.1010440
84. Xie W, Wang L, Dai Q, Yu H, He X, Xiong J, et al. Activation of AMPK restricts coxsackievirus B3 replication by inhibiting lipid accumulation. J Mol Cell Cardiol. (2015) 85:155–67. doi: 10.1016/j.yjmcc.2015.05.021
Keywords: non-small cell lung cancer, ferritinophagy, TCGA, machine learning, prognosis
Citation: Hao Y, Wang X, Ni Z, Ma Y, Wang J and Su W (2025) Analysis of ferritinophagy-related genes associated with the prognosis and regulatory mechanisms in non-small cell lung cancer. Front. Med. 12:1480169. doi: 10.3389/fmed.2025.1480169
Received: 13 August 2024; Accepted: 26 February 2025;
Published: 07 March 2025.
Edited by:
Beatrice Aramini, University of Bologna, ItalyReviewed by:
Bing Feng, Pennington Biomedical Research Center, United StatesCopyright © 2025 Hao, Wang, Ni, Ma, Wang and Su. This is an open-access article distributed under the terms of the Creative Commons Attribution License (CC BY). The use, distribution or reproduction in other forums is permitted, provided the original author(s) and the copyright owner(s) are credited and that the original publication in this journal is cited, in accordance with accepted academic practice. No use, distribution or reproduction is permitted which does not comply with these terms.
*Correspondence: Wen Su, MTM1MDk3MzE2NjNAMTYzLmNvbQ==
Disclaimer: All claims expressed in this article are solely those of the authors and do not necessarily represent those of their affiliated organizations, or those of the publisher, the editors and the reviewers. Any product that may be evaluated in this article or claim that may be made by its manufacturer is not guaranteed or endorsed by the publisher.
Research integrity at Frontiers
Learn more about the work of our research integrity team to safeguard the quality of each article we publish.