 Yinglian Li1
†
Yuan Fang1
†
DongLi Li2
†
Jiangtao Wu1
Zichong Huang1
Xueyin Liao1
Xuemei Liu1
Chunxiao Wei1
*
Yinglian Li1
†
Yuan Fang1
†
DongLi Li2
†
Jiangtao Wu1
Zichong Huang1
Xueyin Liao1
Xuemei Liu1
Chunxiao Wei1
*
 Zhong Huang1
*
Zhong Huang1
*
- 1Department of Oncology, Kaiyuan Langdong Hospital of Guangxi Medical University, Nanning, China
- 2Radiology Department, Guangxi Zhuang Autonomous Region People's Hospital, Nanning, China
Background: This study aims to screen inflammation-related genes closely associated with the prognosis of hepatocellular carcinoma (HCC) to accurately forecast the prognosis of HCC patients.
Methods: Gene expression matrices and clinical information for liver cancer samples were obtained from the Cancer Genome Atlas (TCGA) and the International Cancer Genome Consortium (ICGC). An intersection of differentially expressed genes of HCC and normal and GeneCards yielded inflammation-related genes associated with HCC. Cox regression and the minor absolute shrinkage and selection operator (LASSO) regression analysis to filter genes associated with HCC prognosis. The prognostic value of the model was confirmed by drawing Kaplan–Meier and ROC curves. Select differentially expressed genes between the high-risk and low-risk groups and perform GO and KEGG pathways analyses. CIBERSORT analysis was conducted to assess associations of risk models with immune cells and verified using real-time qPCR.
Results: A total of six hub genes (C3, CTNNB1, CYBC1, DNASE1L3, IRAK1, and SERPINE1) were selected using multivariate Cox regression to construct a prognostic model. The validation evaluation of the prognostic model showed that it has an excellent ability to predict prognosis. A line plot was drawn to indicate the HCC patients’ survival, and the calibration curve revealed satisfactory predictability. Among the six hub genes, C3 and DNASE1L3 are relatively low expressed in HCCLM3 and 97H liver cancer cell lines, while CTNNB1, CYBC1, IRAK1, and SERPINE1 are relatively overexpressed in liver cancer cell lines.
Conclusion: One new inflammatory factor-associated prognostic model was constructed in this study. The risk score can be an independent predictor for judging the prognosis of HCC patients’ survival.
1 Introduction
Worldwide, hepatocellular carcinoma (HCC) is the most common malignant tumor. HCC patients are mostly at an advanced stage when diagnosed and have a poor prognosis (1). The most severe result of uncontrolled hepatocyte growth is the occurrence of HCC, whose progression and metastasis are inseparable from the deterioration of the liver regeneration microenvironment (2). The drug therapy for HCC encompasses a variety of treatment modalities. As the first FDA-approved systemic therapy for advanced HCC, Sorafenib remains a cornerstone treatment, primarily due to its ability to extend survival (3, 4). Following Sorafenib, other drugs such as Regorafenib, Cabozantinib, and Lenvatinib have been approved for use (5). These drugs target various tumor growth pathways and angiogenesis pathways (3, 5). Drugs like Nivolumab and Pembrolizumab have shown promise in treating HCC by enhancing the body’s immune response against tumor cells (6). Combining Sorafenib with immune checkpoint inhibitors may improve treatment efficacy (7, 8). However, due to the insidious nature of HCC development, high recurrence rate after surgical resection, and high transplantation failure rate, improving the prognosis of HCC patients and identifying new molecular targets for drug development still faces multiple challenges, including those involved in cancer metabolism, immune evasion, and cell survival (9).
Chronic inflammation caused by viral infection significantly increases the possibility of HCC development by activating inflammatory signaling pathways and cytokines (10). The inflammatory pathways are complex and highly interconnected with multiple feedback loops and interactions. This complexity makes it difficult to predict how modulating one pathway might affect others, potentially leading to unintended consequences (11, 12). Thus, inflammation is a significant driver of cancer progression. The expression and role of inflammation-related genes can differ significantly among tumors, complicating the development of universally effective treatments (13, 14). Tumor cells can develop resistance to therapies that target inflammation-related pathways, often through genetic mutations or by activating alternative pathways (15). This adaptation can reduce the long-term efficacy of these treatments (16). Developing computational models that simulate individual responses to therapies targeting inflammation-related genes may help optimize treatment strategies (17, 18). Integrating inflammation-related genes into tumor therapy for conditions like HCC presents significant opportunities. Exploring the correlation between inflammation-related genes and tumor immune status may help further integrate targeted therapy and immunotherapy (19, 20).
Immune inflammation involves the immune system’s response to cancer cells, which can either suppress tumor growth or contribute to tumor development and progression (21). Inflammation-related genes are crucial in this context as they can influence the tumor microenvironment, affecting the behavior of HCC. HCC is a highly heterogeneous disease, and the genetic profile can vary significantly among patients, complicating creating a universally applicable model (22). Some studies have identified and evaluated the potential prognostic value of immune-autophagy-related genes in HCC patients (23). The study’s assessment was based on the complex interplay between the immune system, autophagy processes, and the tumor microenvironment in liver cancer (24). However, further research is still needed to explore the complex interactions between inflammation-related genes and other pathways in HCC. We identify inflammation-related genes that are significantly altered in HCC. Integrate data from different sources and use statistical and machine learning models to analyze the relationship between the expression of inflammation-related genes and patient survival. Techniques such as the proportional hazards model (25) can be used to estimate risk based on gene expression levels. Due to a more aggressive tumor microenvironment, certain patients with high expression of pro-inflammatory genes may have a poorer prognosis. We also used models to classify patients into risk groups and examine their immune microenvironment. Our model can predict patient survival while helping clinicians plan treatment more efficiently.
2 Materials and methods
2.1 Data acquisition and preparation
This study downloaded the normalized RNA-Seq data set of 371 HCC samples and 50 adjacent normal samples and the corresponding clinical information from the UCSC Xena browser.1 The clinical information includes follow-up time, survival status, age, gender, TNM stage, and overall stage of HCC patients. Download the LIRI-JP HCC data set of the ICGC database from the Sangerbox platform2 as an independent validation set for the prognostic model containing RNA-Seq data of 240 HCC tumor samples and corresponding clinical information. The sample data uses standardized count values. Inclusion and exclusion processing criteria: (1) exclude samples without clinical follow-up data; (2) exclude those without TTL data; (3) exclude those without information related to patient survival status; (4) convert ENSEMBL ID to gene symbols, and (5) If multiple gene symbolic expressions exist, the median value is recorded. The clinical data of these samples are shown in Supplementary Table S1. Inflammation-related genes were searched in the GeneCard database using the keyword “inflammation.”
2.2 Screening of differentially expressed inflammation-related genes related to HCC
RStudio version 4.1.0 and the “Limma” software package (26) were used to screen differentially expressed genes (DEGs) between HCC and adjacent normal samples. First, genes with an average count of less than one were excluded, and genes were screened based on the criteria that the absolute value of the Log2-transformed fold change (FC) was more significant than or equal to 4, and the significance p value was less than 0.01. The genes that met the conditions were selected as DEGs, among which log2FC greater than 4 is an up-regulated gene, and less than −4 is a down-regulated gene. Use the “ggplot2” R software package (27, 28) to draw a volcano plot to visualize the results. Next, a correlation coefficient greater than six was used as the screening criterion to obtain inflammation-related genes from the GeneCards database (29). Finally, the intersection of DEGs and inflammation-related genes was used to obtain differentially expressed inflammation-related genes in HCC, and Venny online software3 (30) was used to draw a Venn diagram for visualization. The “survival” R software package (31) performed Univariate Cox regression analysis (25) on differentially expressed inflammation-related genes in HCC. Genes with p less than 0.05 were differentially expressed inflammation-related genes related to prognosis. This gene is a risk factor for the prognosis of HCC (The hazard Ratio (HR) > 1). This gene is a protective factor for the prognosis of HCC(HR < 1).
2.3 Least absolute shrinkage and selection operator regression and construction of the prognostic model
The 50 paracancerous and HCC samples with missing survival information downloaded from the TCGA database were eliminated, and 365 hepatocellular carcinoma samples were retained as a training set for constructing the prognostic model. To further screen variables, the “glmnet” R software package (32) was used to perform Lasso (Least absolute shrinkage and selection operator is a type of linear regression that includes a penalty equal to the absolute value of the magnitude of coefficients.) regression analysis on the differentially expressed inflammation-related genes related to HCC prognosis screened out in the above Univariate Cox regression analysis to reduce the purpose of the fitting degree of the constructed prognostic model. During the Lasso regression analysis process, 10-fold cross-validation was used to determine the λ value, and the λ with the minor partial likelihood deviation was selected as the optimal λ. Cross-validation in Lasso regression ensures the model is tuned for optimal performance by finding the best regularization parameter (alpha). K-Fold Cross-Validation: Choose the number of folds (typically 5 or 10). Split the dataset into 𝑘 folds. Each fold will be used once as a validation set, while the remaining 𝑘−1 folds form the training set. The genes screened by Lasso regression analysis in the previous step were further used to perform Multivariate Cox regression analysis using the “survival” R software package. In the Multivariate Cox regression analysis results, genes with p less than 0.05 were considered independent factors affecting the prognosis of HCC patients. The coefficients for Multivariate Curve Resolution (MCR) analysis (33) were adopted for calculating the RS.
In the TCGA-LIHC cohort, the samples were assigned to a high-risk or low-risk group (cut-off: 50%). The risk score of each HCC patient was calculated according to the prognostic model, and the patients were divided according to the median risk score. Patients whose risk score was higher than the median risk score were divided into high-risk groups. Next, the “survival” software package is used to draw the Kaplan–Meier curve(a statistical tool used in survival analysis to estimate the survival function from lifetime data); the “survival,” “survminer,” and “timeROC” software packages (22) are used to evaluate the prognosis. The ability of the model to predict the 1-year, 2-year, and 3-year survival rates of HCC patients. Finally, the ROC curves of the 1-year, 2-year, and 3-year survival rates of HCC patients in the prediction training set of age, gender, TNM stage, total stage, and risk score prediction training set were plotted to compare the corresponding AUC values further to illustrate the predictive ability of the prognostic model. Clinicopathological characteristics, including age, gender, TNM stage, total stage, and risk score, were integrated, and the nomogram was constructed using “rms” packages in R.
Akaike information criterion (AIC) (34) is a standard for evaluating the complexity of a statistical model and measuring the goodness of fit of a statistical model to the data. AIC can be expressed as AIC = 2 k − 2ln(L). Where k is the number of parameters and L is the likelihood function. When the complexity of the model increases (k increases), the likelihood function L will also increase, thereby making the AIC smaller. However, when k is too large, the growth rate of the likelihood function slows down, causing the AIC to increase. If the model is too complex, it is easy to cause an Overfitting phenomenon.
2.4 Gene enrichment analysis
To better understand the biological functions of DEGs between high-risk groups and low-risk groups in the training set, four R software packages: “clusterProfiler” (35), “org.Hs.eg.db” (36), “enrich plot,” and “GOplot” (37) were used. For GO and KEGG functional enrichment analysis, p < 0.05 after correction was set as the screening condition.
2.5 Tumor-infiltrating immune cells
To evaluate the difference in immune infiltration of tumor tissue between high-risk and low-risk groups in the training set and the association between risk score and immune infiltration of tumor tissue. This study used a gene expression matrix to perform ESTIMATE (38) analysis to calculate each sample’s stromal score, immune score, ESTIMATE score, and tumor purity. The TIMER algorithm calculated each sample’s infiltration of six tumor-infiltrating immune cell subsets (B cells, CD4+ T cells, CD8+ T cells, macrophages, neutrophils, and dendritic cells). Finally, the correlation between the risk score calculated based on the prognostic model and tumor immune infiltration was analyzed.
2.6 Cell line
The normal human liver cell line LO2 and two human hepatocellular carcinoma cell lines (97H and HCCLM3) were purchased from Saiku Biotech Co. The complete medium for culturing cells was prepared using Dulbecco’s modified medium (DMEM) with 10% fetal calf serum and 1% double antibody (penicillin/streptomycin).
2.7 Real-time fluorescence quantitative PCR experimental materials
The human regular liver cell line is LO2, and there are two human liver cancer cell lines (97H and HCCLM3). The complete medium for culturing cells was prepared using Dulbecco’s modified medium (DMEM) with 10% fetal calf serum and 1% double antibody (penicillin/streptomycin). Total cellular RNA was extracted using the TRIZOL method. The concentration of extracted RNA was measured by NanoDrop2000 (UV spectroscopy) and was not less than 50ug. Intact total RNA produces clear 28S and 18S rRNA bands when subjected to denaturing gel electrophoresis (2:1). Carry out the entire reverse transcription reaction according to the instructions of TaKaRa Reverse Transcription Kit PrimeScrip™ RT reagent Kit with gDNA Eraser (Perfect Real Time), shown in Supplementary Table S2. Dissolve the FastStart Universal SYBR Green Master (ROX), the upstream primer (Forward primer), and the downstream primer (Reverse primer) on ice for later use. Follow the instructions to prepare the components and configure a 10 μL reaction system. Configure a main tube according to the above features, mix gently with a pipette and centrifuge, and add samples sequentially. Set 4 duplicate wells for each sample. The real-time fluorescence quantitative PCR (qTOWER3 Series, Analytik Jena, Germany) reaction procedure, shown in Supplementary Table S3, is described in the instructions. The DNA solubilization curve verifies the specificity of the amplification product. From 60 to 98 degrees, the horizontal coordinates of the curve are each temperature point. The vertical coordinate is the change in fluorescence intensity. When the amplification rate of the target genes (C3, CTNNB1, CYBC1, DNASE1L3, IRAK1, SERPINE1) reaches 100%, the cycle threshold is obtained [Linear dynamic range (12–30)] and the relative expression of the target gene mRNA is calculated using the 2−△△Ct method. Experimental results were visualized using GraphPad Prism 8 software. The specific primer sequences are shown in Table 1. The suppression test detects the extraction situation. 3 samples using the same method of repeatability (Intra-Assay Variation) to assess the intra-assay variation.
Table 1. Specific primer sequence.
2.8 Statistical method
All statistical analyses were performed using R software (v4.1.0). The stepwise regression method was used to screen Hub genes to construct a prognostic model. The Kaplan–Meier curve compared the prognostic differences between HCC patients in the high-risk and low-risk groups. The t-test was used to compare the differences in risk scores between different clinicopathological characteristic groups. p < 0.05 (two-sided) was considered statistically significant.
3 Results
3.1 Screening of differentially expressed inflammation-related genes in HCC
Through differential expression analysis, 3,274 DEGs between HCC samples and normal liver samples were obtained, including 2,789 up-regulated genes and 485 down-regulated genes, as shown in the volcano plot in Figure 1A. 303 inflammation-related genes were retrieved from the GeneCards database. Then, we take the intersection between the database and differential genes and call these 49 intersection genes inflammation-related genes (Figure 1B). Then, we used the STRING database (39) to construct a Protein–Protein Interaction (PPI) network of HCC inflammation-related genes. The interaction score was set to 0.7 during PPI analysis, and Cystoscope software visualized the results (Figure 1C).

Figure 1. Screening of inflammation-related genes in HCC. (A) Volcano plot of DEGs in liver cancer; (B) Venn diagram of DEGs and inflammation-related genes; (C) PPI network of inflammation-related genes in liver cancer. (D) KEGG analysis of inflammation-related genes. (E) The risk ratio forest plot showed the prognostic value of the genes based on univariate Cox regression analysis. (F) Lasso regression analysis and Cross-validation. (G) The risk ratio forest plot showed the prognostic value of the genes based on multivariate Cox regression analysis.
3.2 GO and KEGG enrichment analysis
We performed GO and KEGG functional enrichment analysis on 49 inflammation-related genes. GO analysis results show that cell functions are significantly enriched in positive regulation of cytokine production, secretory granule lumen, cytokine receptor binding, etc. (Supplementary Figure S1); KEGG pathway analysis shows that it is mainly enriched in NF-κB signaling pathway, cytokine-cytokine receptor interaction, Th17 cell differentiation, etc. (Figure 1D).
3.3 Screening of prognostic model hub genes and construction of a prognostic model
Based on the prognostic information of tumor samples in the training set, univariate Cox regression analysis (p < 0.05) was performed on 49 differentially expressed inflammation-related genes in HCC, and 16 genes significantly related to the prognosis of HCC were screened out (C3, CASP3, CTNNB1, CYBC1, and DNASE1L3), (IRAK1, RELA, SERPINE1, SPP1, TGFB1, TNIP1, TTR, UBA1, UBAC2, UBE2L3, and VEGFA), as shown in Figure 1E. Then, Lasso regression analysis was further performed on 16 inflammation-related genes related to the prognosis of HCC patients to obtain 11 genes (C3, CTNNB1, CYBC1, DNASE1L3, IRAK1, SERPINE1, SPP1, UBA1, UBAC2, UBE2L3, and VEGFA), as shown in Figure 1F. Finally, the above 11 genes were screened using the Step calculation function in multifactor Cox regression analysis based on the AIC information statistic. When AIC was equal to 1316.19, the results were obtained based on 6 Hub genes (C3, CTNNB1, CYBC1, DNASE1L3, the optimal prognostic model constructed by IRAK1, SERPINE1). As shown in Figure 1G, multivariate Cox regression risk showed that CYBC1 (HR = 1.04, 95%CI = 1.01–1.09, p = 0.02) among the six Hub genes was an independent prognostic risk factor for HCC patients. A prognostic model is constructed through regression coefficients. In the prognostic model, the risk score calculation formula for each HCC sample is Risk score = (−0.000337128 × C3) + (0.009464722 × CTNNB1) + (0.045920338 × CYBC1) + (−0.035384453 × DNASE1L3) + (0.007516301 × IRAK1) + (0.001958146 × SERPINE1). The risk scores of all HCC patients in the training set were calculated according to the prognostic model formula. Patients with risk scores higher than the median were classified into the high-risk group and others as the low-risk group. Figure 2A shows that the risk scores of HCC patients gradually increase from left to right. It can be seen from Figure 2A that as the risk score increases, the survival time of patients in the high-risk group is shorter (the trend of concentration of scattered points is downward), and the mortality rate is higher (red dots increase). Figure 2A shows the differential expression of six Hub genes between the high-risk and low-risk groups in the form of a heat map. The expression of four genes, SERPINE1, IRAK1, CTNNB1, and CYBC1, was relatively up-regulated in the high-risk group. The expression of C3 and DNASE1L3 Expression was moderately upregulated in the low-risk group.
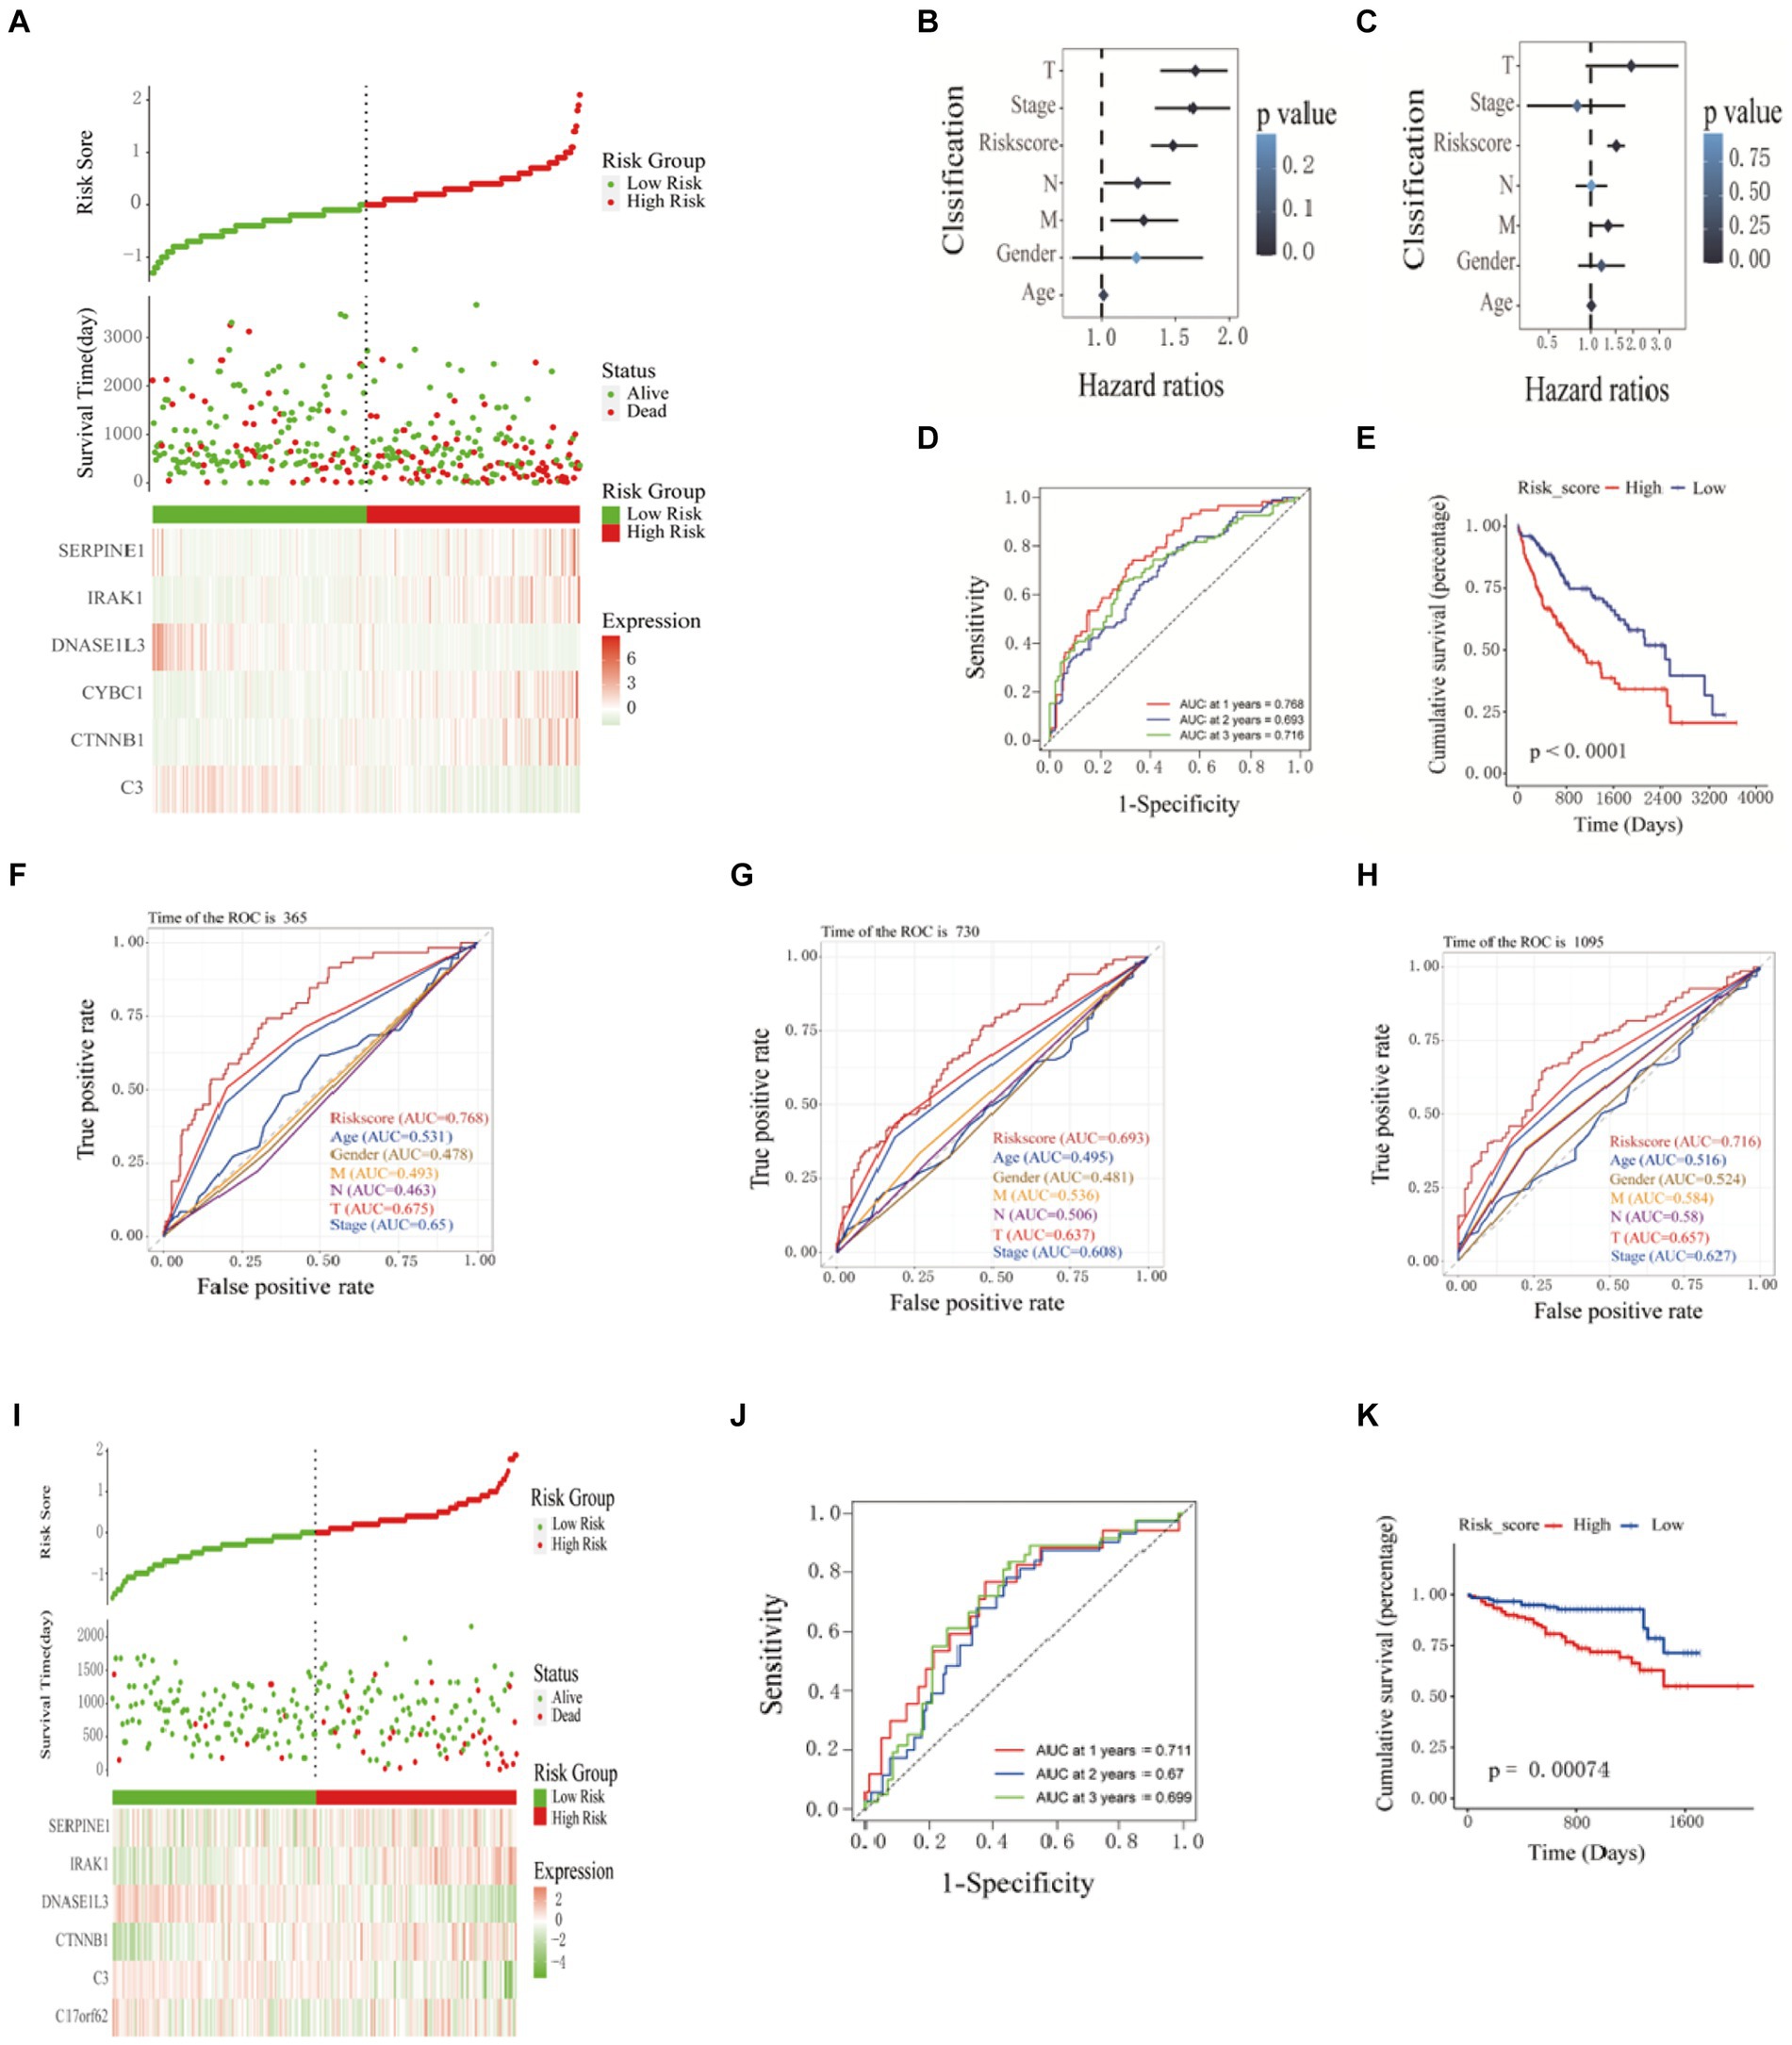
Figure 2. Construction and validation of prognostic models. (A) Prognostic distribution of HCC, differences in survival status between high-risk and low-risk groups, and heat maps of the expression profiles of the six hub genes. The risk score and clinicopathological features are subjected to univariate (B) and multivariate (C) Cox regression analysis, as illustrated in the forest plot. (D) Kaplan–Meier survival curves and (E) time-dependent ROC curves. ROC curve verified the significance of the prognostic model (F) 365 days, (G) 730 days, and (H) 1,065 days. (I) Distribution of prognostic index. Survival status of patients in different groups. Heat map of the expression profile of the included inflammation-related genes. (J-K) Kaplan-Meier survival curves and time-dependent ROC curves.
3.4 Verification of pivot genes
The patients’ risk scores in the training set were comprehensively analyzed with the corresponding clinicopathological characteristics (age, gender, TNM stage, and total stage). Single-factor Cox regression analysis showed that the risk score (p < 0.001), M stage (p = 0.01), N Stage (p = 0.04), T stage (p < 0.001), and total stage (p < 0.001) are significantly related to the prognosis of HCC (Figure 2B). Multivariate Cox regression analysis showed that risk score (HR = 1.52, 95%CI = 1.31–1.75, p < 0.001) and M stage (HR = 1.33, 95%CI = 1.02–1.72, p = 0.03) are essential factors affecting the prognosis of HCC patients. Independent risk factors (Figure 2C). The ROC curve was used to evaluate the accuracy of the prognostic model, and the AUC values for predicting the 1-, 2-, and 3-year survival rates of HCC patients in the training set were 0.768, 0.693 and 0.716, respectively (Figure 2D). The Kaplan–Meier curve showed that the prognosis of the high-risk group was worse than that of the lower-risk group, and the difference was statistically significant (p < 0.0001) (Figure 2E). The ROC curve(is a graphical plot used to evaluate the performance of a binary classifier system. It plots the true positive rate (TPR) against the false positive rate (FPR) at various threshold settings) and was used to verify the predictive performance of the prognostic model. In the ROC curve predicting the 1-year (Figure 2F), 2-year (Figure 2G), and 3-year (Figure 2H) survival rates of HCC patients in the training set, the AUC value of the risk score was always high. Compared with clinicopathological characteristics such as age, gender, TNM stage, and total stage, it indicates that the risk score may be a reliable predictor of the prognosis of HCC patients. 240 HCC samples from the ICGC database were used as a validation set further to verify the reliability and accuracy of the model. The same formula was used to calculate the risk scores of the 240 HCC samples, and patients higher than the median risk score were divided into high-risk groups; otherwise, they were split into low-risk groups. The risk score distribution, survival time, and mRNA expression level distribution of the six Hub genes of the patients in the validation set are shown in Figure 2I. The AUC values for predicting 1-year, 2-year, and 3-year survival rates were 0.711, 0.67, and 0.699, respectively, (Figure 2J). The Kaplan–Meier curve showed that the prognosis of patients in the high-risk group was worse than that of the lower-risk group, and the difference was statistically significant (p = 7.4e-4) (Figure 2K). The research results of the validation and training sets are consistent, indicating that this prognostic model can effectively predict the prognosis of HCC patients.
3.5 Immune infiltration analysis of high and low-risk groups
ESTIMATE analysis found that the stromal cell score difference between the high and low-risk groups in the training set was statistically significant, and the low-risk group had a higher stromal cell score (p < 0.001). There was no statistically significant difference in immune cell score, ESTIMATE score, and tumor purity between the high-risk and low-risk groups (Figure 3A). By studying the correlation between the risk score model and the four scores, it was found that the stromal cell score was negatively correlated with the risk score (R = −0.24, p = 3.9e-06); the ESTIMATE score was negatively correlated with the risk score (R = −0.13, p = 0.013); tumor purity was positively correlated with risk score (R = 0.13, p = 0.013) (Figure 3B). Through TIMER analysis, the infiltration abundance of B cells, macrophages, neutrophils, dendritic cells, CD4+ T cells, and CD8+ T cells in HCC was higher in the high-risk group than in the lower-risk group (p < 0.05) (Figure 3C). By analyzing the correlation between risk score and immune cell infiltration abundance, it was found that B lymphocytes were positively correlated with risk score (R = 0.22, p = 3.2e-05); dendritic cells were positively correlated with risk score (R = 0.26, p = 4.4e-07); macrophages were positively correlated with risk score (R = 0.26, p = 6.7e-07); neutrophils were positively correlated with risk score (R = 0.3, p = 6e-09) (Figure 3D).
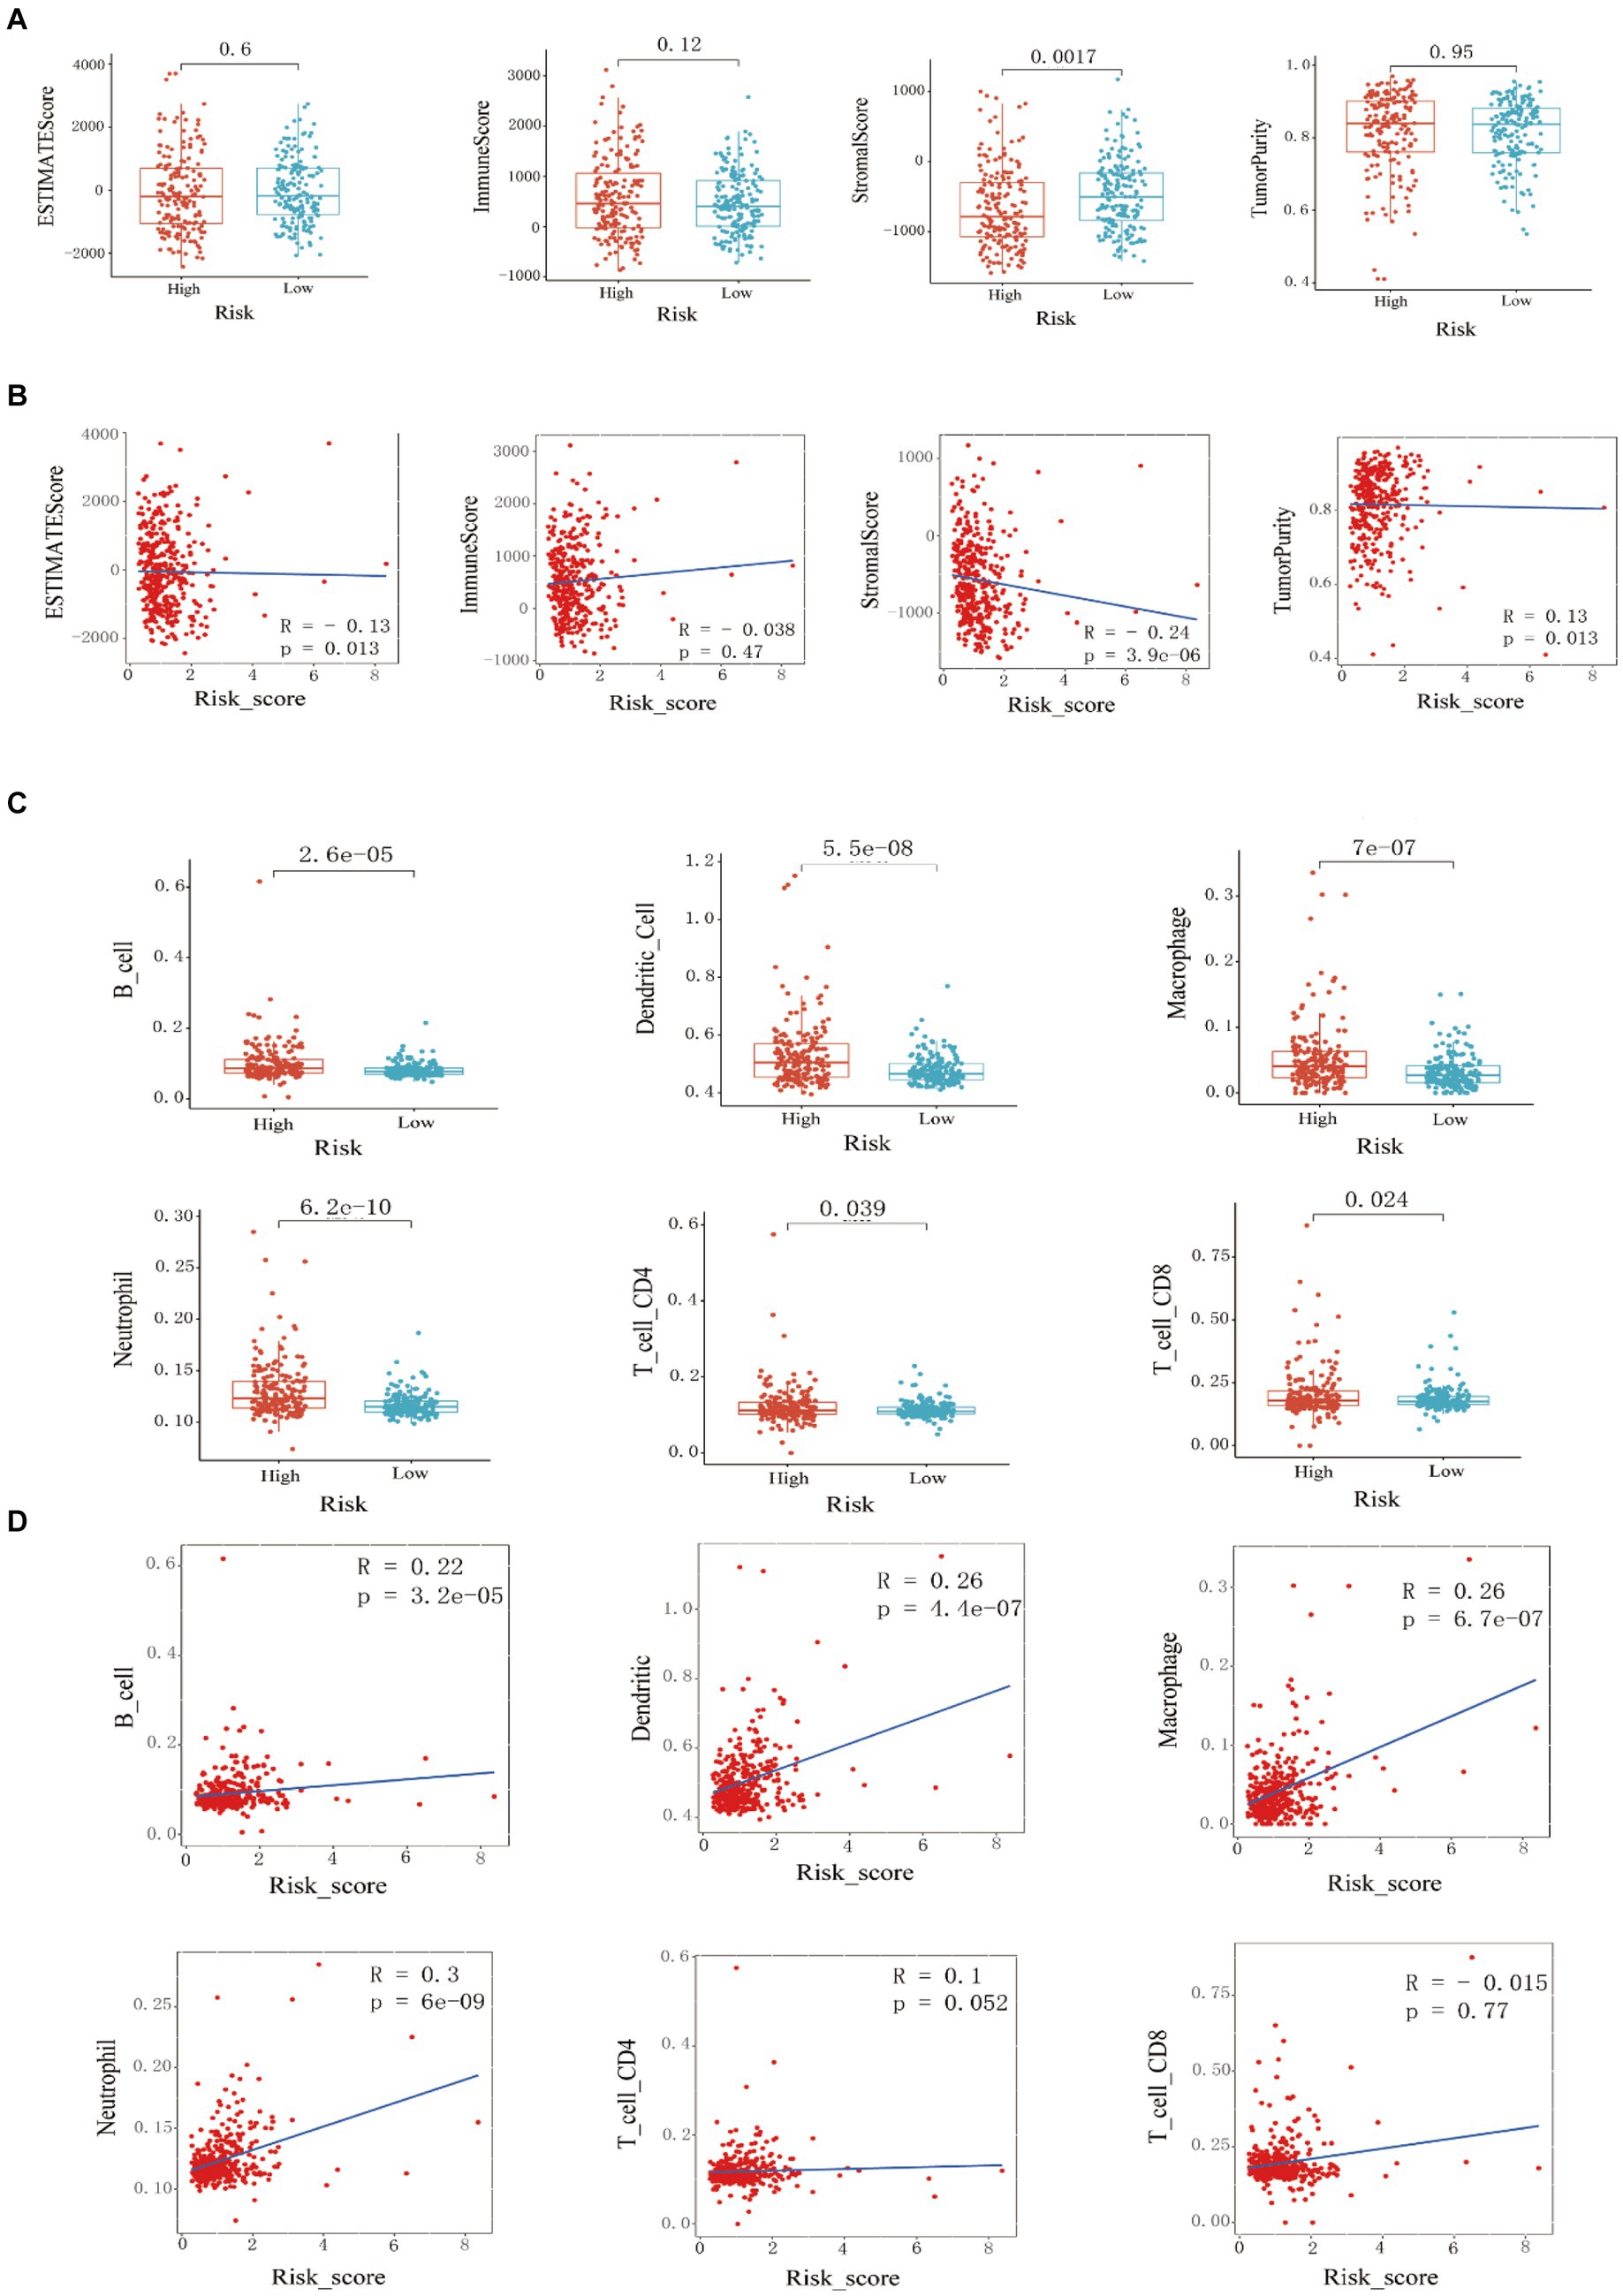
Figure 3. Training set immune infiltration analysis. (A) Analysis of differences in ESTIMATE scores, immune cell scores, stromal cell scores, and (B) tumor purity between high-risk and low-risk groups, and correlation analysis with risk scores. (C) Analysis of differences in the infiltration abundance of B cells, macrophages, neutrophils, dendritic cells, CD4+ T cells, and CD8+ T cells between high-risk and low-risk groups, and (D) correlation analysis with their respective risk scores.
3.6 Combining clinical data to construct an HCC prognostic nomogram
In this study, the nomogram constructed by combining the clinicopathological characteristics and risk scores of HCC patients in the training set was used to predict the 1-year, 3-year, and 5-year survival probabilities of HCC patients (Figure 4A). C-index equals 0.697 (greater than 0.5). The 3-year actual survival rate was highly consistent with the predicted value, indicating that the constructed nomogram had good accuracy (Figure 4B). In this study, the risk score was closely related to the TNM stage and total Stage, indicating that the prognostic model helps predict the proliferation and metastasis of HCC (Figure 4C). The correlation between the expression of six Hub genes (C3, CYBC1, CTNNB1, DNASE1L3, IRAK1, and SERPINE1) constructed for prognostic modeling and the level of immune cell infiltration was analyzed using the TIMER database. The results showed that the expression of C3 in HCC was closely correlated with the infiltration of B cells, CD4+ T cells, macrophages, neutrophils, and dendritic cells (p < 0.05). The expression of CTNNB1 in HCC was closely correlated with the infiltration of B cells, CD4+ T cells, CD8+ T cells, and macrophages (p < 0.05). The expression of CYBC1 in HCC was closely correlated with the infiltration of B cells, CD4+ T cells, macrophages, neutrophils, and dendritic cells (p < 0.05). DNASE1L3 expression in HCC was closely associated with infiltration of B cells, CD4+ T cells, CD8+ T cells, neutrophils, and dendritic cells (p < 0.05). IRAK1 expression in HCC was closely associated with infiltration of B cells, CD8+ T cells, macrophages, and dendritic cells (p < 0.05). The expression of SERPINE1 in HCC was closely associated with the infiltration of CD8+ T cells, macrophages, neutrophils, and dendritic cells (p < 0.05). These results suggest that the prognostic model Hub genes are closely associated with immune infiltration, and the results are shown in Supplementary Figure S2, with p < 0.05 indicated by red boxes. The GEPIA database was further analyzed for six Hub genes, mRNA expression of CYBC1 (HR = 1.7, Logrank p = 0.0036), DNASE1L3 (HR = 0.43, Logrank p = 2e-06), IRAK1 (HR = 1.7, Logrank p = 0.0042), SERPINE1 (HR =1.5, Logrank p = 0.027) mRNA expression correlated with overall survival of hepatocellular carcinoma patients as shown in Supplementary Figure S3. The mRNA expression of C3 (F = 6.02, p = 0.000524), CYBC1 (F = 2.66, p = 0.0478), DNASE1L3 (F = 6.63, p = 0.000229), IRAK1 (F = 4.67, p = 0.00327), SERPINE1 (F = 3.73, p = 3.73) and SERPINE1 (F = 3.73, p = 0.0116) was statistically significant among the groups with different hepatocellular carcinoma clinical staging as shown in Figure 4D.
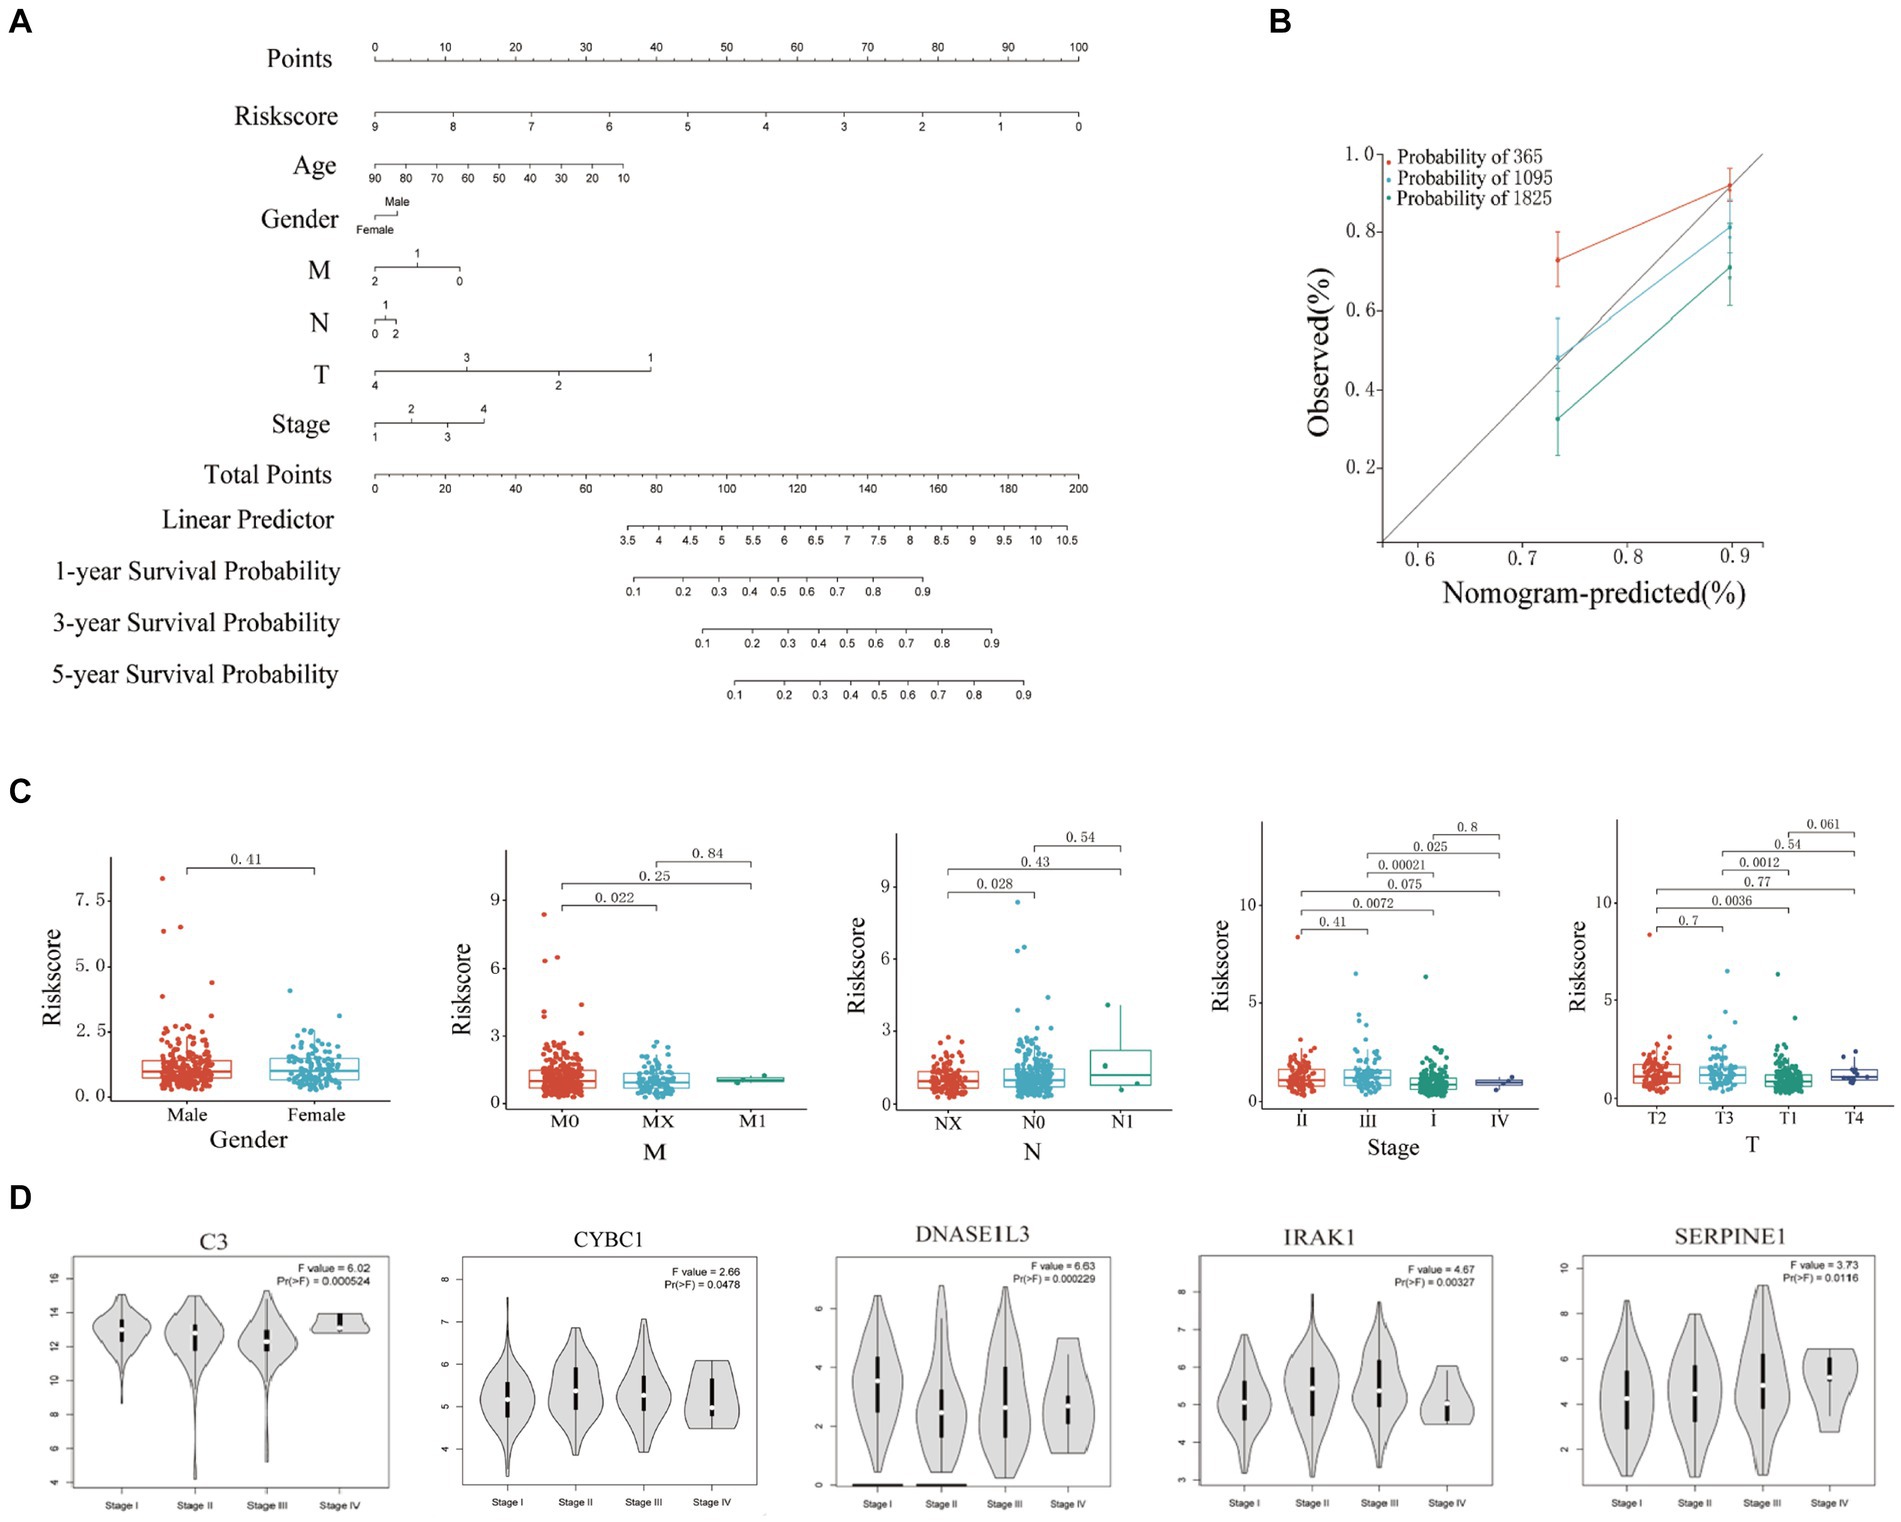
Figure 4. Clinical correlation analysis based on training set risk score. (A) Nomogram model to predict 1-, 3-, and 5-year survival rates of HCC cases. (B) Calibration graphs indicated that predicted 1-, 3-, and 5-year survival rates were close to the actual survival rates. (C) Results of correlation analysis between risk score and gender, TNM, and stage. (D) Analyze the correlation between the mRNA expression of 6 hub genes based on the GEPIA.
3.7 Expression in human hepatocellular carcinoma cells and normal cells of the liver
As shown in Figure 5, the expression differences of the six Hub genes C3, CTNNB1, CYBC1, DNASE1L3, IRAK1, and SERPINE1 between human liver cancer cell lines and normal liver cell lines are statistically significant. C3 and DNASE1L3 are significantly different in HCCLM3 and 97H liver cancer cells. The cell lines showed relatively low expression compared with normal liver cells, while CTNNB1, CYBC1, IRAK1, and SERPINE1 showed relatively high expression in HCCLM3 and 97H liver cancer cell lines compared with normal liver cells.

Figure 5. Comparison of the mRNA expression levels of six modeled genes in hepatocellular carcinoma and normal liver cells.
4 Discussion
Studies are developing and validating a systemic immune-inflammatory index based on lymphocyte, neutrophil, and platelet counts and exploring its prognostic value in HCC (40). Other studies have found the prognostic value of prognostic nutritional index (PNI) and systemic immune-inflammatory index in hepatocellular carcinoma (41). Studies have reviewed the utility of inflammatory markers as prognostic tools in patients with resectable HCC (42). It is believed that there is currently a lack of reliable prognostic biomarkers to predict postoperative recurrence of HCC. However, we showed a prognostic model based on six inflammation-related genes, including C3, CTNNB1, CYBC1, DNASE1L3, IRAK1, and SERPINE1, which was established through multi-factor Cox regression analysis. According to the formula, the risk score of each patient is calculated and used as a standard to predict the outcome of HCC patients. The study found that High-risk scores among HCC patients have a worse prognosis than those in the low-risk group. ROC curve analysis of the survival rate of HCC patients found that the risk score has good sensitivity and specificity. The AUC values for predicting 1-year, 2-year, and 3-year survival rates are 0.768, 0.693, and 0.716, respectively, which can be used to predict prognosis for HCC patients. In addition, the predictive ability of the constructed prognostic model was successfully verified using the HCC data set of the ICGC database.
Current studies suggest that changes in the C3 gene and its expression can affect tumor immune response. Excessive activation or inhibition of complement components may lead to tumor progression or immune escape. At the same time, chronic inflammation caused by chronic hepatitis B is usually mediated by complement activation and is a known risk factor for liver cancer. Elevated levels of C3 and other complement components have been observed in HCC patients. Changes in the levels of complement proteins (including C3) in the blood of HCC patients may serve as biomarkers for the diagnosis or prognosis of HCC (43–46). The CTNNB1 gene encodes β-catenin and is involved in the regulation and coordination of cell–cell adhesion and gene transcription. Mutations in the CTNNB1 gene in HCC often lead to the stabilization and accumulation of β-catenin in the nucleus and abnormal activation of the Wnt/β-catenin signaling pathway is associated with the pathogenesis of HCC. HCC tumors with CTNNB1 mutations often show unique histological features and may have a better prognosis than HCC without these mutations. The level and activity of β-catenin represented by CTNNB1 can serve as a biomarker for diagnosing and classifying HCC. The presence of CTNNB1 mutations can also affect the prognosis of HCC patients. Studies have shown that patients with CTNNB1 mutant HCC may respond better to certain treatments, and the role of CTNNB1 in HCC helps develop targeted therapies aimed at inhibiting the Wnt/β-catenin signaling pathway. At the same time, targeting β-catenin signaling with other treatments (such as immune checkpoint inhibitors or traditional chemotherapy) can provide a more effective treatment strategy for HCC patients (47–53). The CYBC1 gene encodes a protein that acts as a chaperone for cytochrome b-245, which is a component of the NADPH oxidase complex. The CYBC1-cytochrome b-245 complex is essential for producing ROS, and NADPH oxidase and its ROS can affect cancer’s development and progression. In chronic inflammation caused by HCC, dysregulated ROS production, which CYBC1 may affect, may lead to a pro-inflammatory environment and promote the development of liver cancer. Alterations in CYBC1 expression or function may affect the immune system’s ability to respond to tumor cells (54, 55). The DNASE1L3 gene encodes an enzyme that digests extracellular DNA released during cell death processes such as apoptosis and necrosis. Clearing these DNA fragments maintains homeostasis and prevents excessive inflammation. Chronic inflammation is an important risk factor for liver cancer. The normal function of DNASE1L3 may help maintain genomic stability by preventing the accumulation of DNA fragments, which may otherwise lead to mutations and cancer. Changes in DNASE1L3 expression or activity may serve as a biomarker for HCC (56–62). IRAK1 is a serine/threonine protein kinase that participates in downstream signaling of the IL-1 and TLR pathways. It is essential for activating nuclear factor kappa B (NF-κB) and mitogen-activated protein kinase (MAPK) signaling. Through its role in IL-1 and TLR signaling, IRAK1 can promote the inflammatory microenvironment that promotes the development of liver cancer. Abnormal activation of IRAK1 can lead to sustained activation of the NF-κB and MAPK pathways, promoting cell proliferation, survival, and anti-apoptosis. Elevated IRAK1 expression or activity levels may serve as a biomarker for HCC. At the same time, studies have shown that high IRAK1 expression is associated with poor prognosis in HCC patients (63–66). SERPINE1 (serine protease inhibitor family E member 1) is a gene that encodes a protein that regulates fibrinolysis and plays a role in cell migration, invasion, and angiogenesis. Elevated levels of SERPINE1 are associated with increased tumor growth, invasion, and metastasis in multiple cancers, including HCC. It also plays a role in angiogenesis (forming new blood vessels), essential for tumor growth and metastasis. It interacts with vitronectin and integrins, influencing endothelial cell migration and blood vessel formation. High expression of SERPINE1 is often associated with poor prognosis in HCC patients (67–72). In summary, the six Hub genes in the prognostic model have been confirmed in multiple studies to be involved in the occurrence and development of HCC.
This study also showed a close correlation between HCC and stromal cells (73, 74). ESTIMATE (75) analysis showed that the stromal score in the low-risk group was significantly higher than in the high-risk group, and the difference was statistically significant. Correlation analysis showed that stromal cell and ESTIMATE scores negatively correlated with risk scores. Dense immune cell infiltration is generally associated with a better prognosis because it indicates that the immune system is actively responding to the presence of the tumor. Lower immune cell infiltration or an immune desert state (few immune cells in the tumor microenvironment) is often associated with a poorer prognosis because it indicates that the tumor may have evaded surveillance by the immune system (76). TIMER’s (77) algorithm analysis found that the infiltration of B lymphocytes, macrophages, dendritic cells, and neutrophils in HCC tumor cells was positively correlated with the risk score. Immune cell infiltration plays an important prognostic role in hepatocellular carcinoma (HCC). Studies have shown that immune cells’ composition and infiltration level in the tumor microenvironment are closely related to the patient’s prognosis (78). Researchers have developed prognostic models based on immune cell infiltration by integrating large-scale and single-cell RNA sequencing data. These models can predict the survival rate and immune checkpoint blockade response of HCC patients (79). The distribution and activity status of different types of immune cells, such as T cells, B cells, and macrophages in the tumor microenvironment, are key prognostic indicators. High levels of anti-tumor immune cells (such as cytotoxic T cells) are generally associated with a better prognosis. In contrast, immunosuppressive cells (such as regulatory T cells) may indicate a poor prognosis (80). Multiple studies have evaluated the effect of immune cell infiltration on HCC prognosis through survival analysis and found that patients with higher immune scores generally have longer survival (52, 78, 81, 82). These patients tend to have higher anti-tumor immune cell infiltration and lower immunosuppressive cell infiltration (83). Studies have shown that combining ICIs with other treatments, such as chemotherapy, radiotherapy, or targeted therapy, can enhance the therapeutic effect. For example, the effect of immunotherapy can be enhanced by inhibiting immunosuppressive cells or promoting the infiltration of anti-tumor immune cells. Suppose there are more regulatory T cells (Tregs) and M2 macrophages in the tumor microenvironment (84, 85). In that case, this may promote tumors to escape immune surveillance, thereby increasing the risk of tumor survival and growth. The high density of cytotoxic T cells (such as CD8+ T cells) and M1 macrophages may enhance the ability to attack tumors and promote the clearance of tumor cells, thereby potentially reducing tumor invasiveness and patient risk (86). Immunotherapy, such as immune checkpoint inhibitors, may be more effective for tumors with high immune cell infiltration (87). Other strategies, such as immune modulators or cell therapies, may be needed for tumors in immune deserts to attract more immune cells to the tumor microenvironment (88, 89).
However, this study also has limitations. First, this study’s analysis data come from public data resources such as TCGA, ICGC, and GEPIA (90). They lack their sequencing data. Specific clinical cases need to be collected for experiments to verify the credibility of the constructed prognostic model in predicting the prognosis of HCC patients. In addition, the data sources in public databases also have limitations. The experimental techniques used in different studies, such as different sequencing platforms or chip technologies, may be different. These technical differences will lead to incomparability between data. The data processing and standardization methods may vary, affecting the consistency of the data. Differences in the geographical origin, collection time, and sample processing methods will also introduce variability. Some gene expression data may have missing values, resulting in incomplete data. At the same time, biological differences between different samples in sequencing data, such as individual differences, mixed cell types, etc., may lead to variability in gene expression. Different conditions for sample collection and processing (such as temperature, culture medium, etc.) will affect gene expression. We use different databases and statistical schemes to verify each other to minimize the differences caused by different databases and sequencing batches. Secondly, this study lacks sufficient in vitro or in vivo experiments to explore the molecular mechanisms by which differentially expressed inflammation-related genes in liver cancer affect the prognosis of HCC patients to confirm the reliability of the GO and KEGG enrichment analysis results of differentially expressed inflammation-related genes in this study. Therefore, Many experiments are needed to prove the mechanical connection between the differential expression of inflammation-related genes and HCC proliferation and metastasis. Finally, the underlying specific mechanisms between differentially expressed inflammation-related genes in HCC and tumor immunity are poorly understood and require further experimental and clinical studies to verify.
5 Conclusion
The mRNA expression of six inflammation-related genes (C3, CTNNB1, CYBC1, DNASE1L3, IRAK1, and SERPINE1) is closely related to the overall survival rate, tumor immune infiltration, and clinical stage of HCC patients. Among them, CYBC1 is an independent risk factor affecting the prognosis of HCC patients. These findings provide a basis for the pathogenesis and clinical treatment of HCC and improve treatment strategies and early screening for HCC patients.
Data availability statement
The original contributions presented in the study are included in the article/Supplementary material, further inquiries can be directed to the corresponding authors.
Ethics statement
Ethical approval was not required for the studies on humans in accordance with the local legislation and institutional requirements because only commercially available established cell lines were used.
Author contributions
YL: Writing – original draft. YF: Writing – original draft. DL: Writing – original draft. JW: Writing – review & editing. ZiH: Writing – review & editing. XueyL: Writing – review & editing. XuemL: Writing – review & editing. CW: Writing – original draft, Writing – review & editing. ZhH: Writing – original draft, Writing – review & editing.
Funding
The author(s) declare financial support was received for the research, authorship, and/or publication of this article. This work was supported by grants from the Guangxi Zhuang Autonomous Region Health Commission Self-funded Research Project (Z20190918 and Z-A20231118).
Conflict of interest
The authors declare that the research was conducted in the absence of any commercial or financial relationships that could be construed as a potential conflict of interest.
Publisher’s note
All claims expressed in this article are solely those of the authors and do not necessarily represent those of their affiliated organizations, or those of the publisher, the editors and the reviewers. Any product that may be evaluated in this article, or claim that may be made by its manufacturer, is not guaranteed or endorsed by the publisher.
Supplementary material
The Supplementary material for this article can be found online at: https://www.frontiersin.org/articles/10.3389/fmed.2024.1420353/full#supplementary-material
Footnotes
References
1. Anwanwan, D, Singh, SK, Singh, S, Saikam, V, and Singh, R. Challenges in liver cancer and possible treatment approaches. Biochim Biophys Acta Rev Cancer. (1873) 1873:188314. doi: 10.1016/j.bbcan.2019.188314
2. Min, LH, and Hua, YZ. Microenvironment of liver regeneration in liver cancer. Chin J Integr Med. (2017) 23:555–60. doi: 10.1007/s11655-017-2806-0
3. Peng, SW, Ngo, MHT, Kuo, YC, Teng, MH, Guo, CL, Lai, HC, et al. Niclosamide revitalizes Sorafenib through insulin-like growth factor 1 receptor (IGF-1R)/Stemness and metabolic changes in hepatocellular carcinoma. Cancers (Basel). (2023) 15:931. doi: 10.3390/cancers15030931
4. Kim, DW, Talati, C, and Kim, R. Hepatocellular carcinoma (HCC): beyond sorafenib-chemotherapy. J Gastrointest Oncol. (2017) 8:256–65. doi: 10.21037/jgo.2016.09.07
5. Kelley, RK, Mollon, P, Blanc, JF, Daniele, B, Yau, T, Cheng, AL, et al. Comparative efficacy of Cabozantinib and Regorafenib for advanced hepatocellular carcinoma. Adv Ther. (2020) 37:2678–95. doi: 10.1007/s12325-020-01378-y
6. Qin, S, Chen, Z, Fang, W, Ren, Z, Xu, R, Ryoo, BY, et al. Pembrolizumab versus placebo as second-line therapy in patients from Asia with advanced hepatocellular carcinoma: a randomized, double-blind, phase III trial. J Clin Oncol. (2023) 41:1434–43. doi: 10.1200/JCO.22.00620
7. Schlachterman, A, Craft, WW, Hilgenfeldt, E, Mitra, A, and Cabrera, R. Current and future treatments for hepatocellular carcinoma. World J Gastroenterol. (2015) 21:8478–91. doi: 10.3748/wjg.v21.i28.8478
8. Daher, S, Massarwa, M, Benson, AA, and Khoury, T. Current and future treatment of hepatocellular carcinoma: an updated comprehensive review. J Clin Transl Hepatol. (2018) 6:1–10. doi: 10.14218/JCTH.2017.00031
9. Li, Y, Zhang, R, Xu, Z, and Wang, Z. Advances in Nanoliposomes for the diagnosis and treatment of liver Cancer. Int J Nanomedicine. (2022) 17:909–25. doi: 10.2147/IJN.S349426
10. Huang, Y, Ge, W, Zhou, J, Gao, B, Qian, X, and Wang, W. The role of tumor associated macrophages in hepatocellular carcinoma. J Cancer. (2021) 12:1284–94. doi: 10.7150/JCA.51346
11. Lim, CJ, and Chew, V. Impact of viral etiologies on the development of novel immunotherapy for hepatocellular carcinoma. Semin Liver Dis. (2020) 40:131–42. doi: 10.1055/s-0039-3399534
12. Yang, YM, Kim, SY, and Seki, E. Inflammation and liver Cancer: molecular mechanisms and therapeutic targets. Semin Liver Dis. (2019) 39:026–42. doi: 10.1055/s-0038-1676806
13. Lawal, G, Xiao, Y, Rahnemai-Azar, AA, Tsilimigras, DI, Kuang, M, Bakopoulos, A, et al. The immunology of hepatocellular carcinoma. Vaccines (Basel). (2021) 9:1184. doi: 10.3390/vaccines9101184
14. O’Farrell, M, Duke, G, Crowley, R, Buckley, D, Martins, EB, Bhattacharya, D, et al. FASN inhibition targets multiple drivers of NASH by reducing steatosis, inflammation and fibrosis in preclinical models. Sci Rep. (2022) 12:15661. doi: 10.1038/s41598-022-19459-z
15. Desterke, C, and Chiappini, F. Lipid related genes altered in NASH connect inflammation in liver pathogenesis progression to HCC: a canonical pathway. Int J Mol Sci. (2019) 20:5594. doi: 10.3390/ijms20225594
16. Ram, AK, Pottakat, B, and Vairappan, B. Increased systemic zonula occludens 1 associated with inflammation and independent biomarker in patients with hepatocellular carcinoma. BMC Cancer. (2018) 18:572. doi: 10.1186/s12885-018-4484-5
17. Sangro, B, Melero, I, Wadhawan, S, Finn, RS, Abou-Alfa, GK, Cheng, AL, et al. Association of inflammatory biomarkers with clinical outcomes in nivolumab-treated patients with advanced hepatocellular carcinoma. J Hepatol. (2020) 73:1460–9. doi: 10.1016/j.jhep.2020.07.026
18. Ruf, B, Heinrich, B, and Greten, TF. Immunobiology and immunotherapy of HCC: spotlight on innate and innate-like immune cells. Cell Mol Immunol. (2021) 18:112–27. doi: 10.1038/s41423-020-00572-w
19. Liu, Z, Lin, Y, Zhang, J, Zhang, Y, Li, Y, Liu, Z, et al. Molecular targeted and immune checkpoint therapy for advanced hepatocellular carcinoma. J Exp Clin Cancer Res. (2019) 38:447. doi: 10.1186/s13046-019-1412-8
20. Miao, L, Zhang, Z, Ren, Z, and Li, Y. Application of immunotherapy in hepatocellular carcinoma. Front Oncol. (2021) 11:699060. doi: 10.3389/fonc.2021.699060
21. Cadinu, P, Sivanathan, KN, Misra, A, Xu, RJ, Mangani, D, Yang, E, et al. Charting the cellular biogeography in colitis reveals fibroblast trajectories and coordinated spatial remodeling. Cell. (2024). 187:2010–2028.e30. doi: 10.1016/j.cell.2024.03.013
22. Schulze, K, Nault, JC, and Villanueva, A. Genetic profiling of hepatocellular carcinoma using next-generation sequencing. J Hepatol. (2016) 65:1031–42. doi: 10.1016/j.jhep.2016.05.035
23. Ma, Z, Chen, M, Liu, XL, and Cui, H. Identification and verification of a prognostic autophagy-related gene signature in hepatocellular carcinoma. Sci Rep. (2024) 14:3032. doi: 10.1038/s41598-024-53565-4
24. Sun, Z, Lu, Z, Li, R, Shao, W, Zheng, Y, Shi, X, et al. Construction of a prognostic model for hepatocellular carcinoma based on immunoautophagy-related genes and tumor microenvironment. Int J Gen Med. (2021) 14:5461–73. doi: 10.2147/IJGM.S325884
25. Stel, VS, Dekker, FW, Tripepi, G, Zoccali, C, and Jager, KJ. Survival analysis ii: cox regression. Nephron Clin Pract. (2011) 119:c255–60. doi: 10.1159/000328916
26. Ritchie, ME, Phipson, B, Wu, D, Hu, Y, Law, CW, Shi, W, et al. Limma. Nucleic Acids Res. (2015) 43:e47. doi: 10.1093/nar/gkv007
28. Tyner, S, Briatte, F, and Hofmann, H. Network visualization with ggplot2. R J. (2017) 9:27–59. doi: 10.32614/rj-2017-023
29. Stelzer, G, Rosen, N, Plaschkes, I, Zimmerman, S, Twik, M, Fishilevich, S, et al. The GeneCards suite: From gene data mining to disease genome sequence analyses. Curr Protoc Bioinformatics (2016). doi: 10.1002/cpbi.5
30. Oliveros, JC. VENNY. An interactive tool for comparing lists with Venn diagrams. Available at: http://bioinfogp.cnb.csic.es/tools/venny/index.html. BioinfogpCnbCsicEs/Tools/Venny/IndexHtml (2007).
31. Therneau, TM . Survival analysis [R package survival version 3.5–5]. Comprehensive R archive network (CRAN) (2021). Available at: https://cran.r-project.org/web/packages/survival/index.html
32. Yang, L, Qu, Q, Hao, Z, Sha, K, Li, Z, and Li, S. Powerful identification of large quantitative trait loci using genome-wide R/glmnet-based regression. J Hered. (2022) 113:472–8. doi: 10.1093/jhered/esac006
33. Jones, HDT, Haaland, DM, Sinclair, MB, Melgaard, DK, Collins, AM, and Timlin, JA. Preprocessing strategies to improve MCR analyses of hyperspectral images. Chemom Intell Lab Syst. (2012) 117:149–58. doi: 10.1016/j.chemolab.2012.01.011
34. Burnham, KP, and Anderson, DR. Multimodel inference: understanding AIC and BIC in model selection. Sociol Methods Res. (2004) 33:261–304. doi: 10.1177/0049124104268644
35. Wu, T, Hu, E, Xu, S, Chen, M, Guo, P, Dai, Z, et al. clusterProfiler 4.0: a universal enrichment tool for interpreting omics data. Innovations. (2021) 2:100141. doi: 10.1016/j.xinn.2021.100141
36. Carlson, M, Falcon, S, Pages, H, and Li, N. org. Hs. eg. db: Genome wide annotation for Human. R package version (2019) 3:3.
37. Walter, W, Sánchez-Cabo, F, and Ricote, M. GOplot: an R package for visually combining expression data with functional analysis. Bioinformatics. (2015) 31:2912–4. doi: 10.1093/bioinformatics/btv300
38. Hu, D, Zhang, Z, Zhang, Y, Huang, K, and Li, X. Identification of immune related molecular subtypes and prognosis model for predicting prognosis, drug resistance in cervical squamous cell carcinoma. Front Genet. (2023) 14:1137995. doi: 10.3389/fgene.2023.1137995
39. Szklarczyk, D, Gable, AL, Nastou, KC, Lyon, D, Kirsch, R, Pyysalo, S, et al. The STRING database in 2021: customizable protein-protein networks, and functional characterization of user-uploaded gene/measurement sets. Nucleic Acids Res. (2021) 49:10800. doi: 10.1093/nar/gkab835
40. Chan, SL, Wong, LL, Chan, KCA, Chow, C, Tong, JHM, Yip, TCF, et al. Development of a novel inflammation-based index for hepatocellular carcinoma. Liver Cancer. (2020) 9:167–81. doi: 10.1159/000504252
41. Wang, D, Hu, X, Xiao, L, Long, G, Yao, L, Wang, ZM, et al. Prognostic nutritional index and systemic immune-inflammation index predict the prognosis of patients with HCC. J Gastrointest Surg. (2021) 25:421–7. doi: 10.1007/s11605-019-04492-7
42. Giannone, F, Slovic, N, Pessaux, P, Schuster, C, Baumert, TF, and Lupberger, J. Inflammation-related prognostic markers in resected hepatocellular carcinoma. Front Oncol. (2023) 13:1267870. doi: 10.3389/fonc.2023.1267870
43. Suzuki, R, Takagi, T, Sugimoto, M, Sato, Y, Irie, H, Yomogida, Y, et al. Intracellular C3 modulates EMT via the Akt/Smad pathway in pancreatic Cancer cells. Anticancer Res. (2022) 42:5743–50. doi: 10.21873/anticanres.16081
44. Yang, C, Huang, X, Liu, Z, Qin, W, and Wang, C. Metabolism-associated molecular classification of hepatocellular carcinoma. Mol Oncol. (2020) 14:896–913. doi: 10.1002/1878-0261.12639
45. Li, J, Li, Y, Li, F, and Xu, L. NK cell marker gene-based model shows good predictive ability in prognosis and response to immunotherapies in hepatocellular carcinoma. Sci Rep. (2023) 13:7294. doi: 10.1038/s41598-023-34602-0
46. Liu, L, Liu, Z, Gao, J, Liu, X, Weng, S, Guo, C, et al. CD8+ T cell trajectory subtypes decode tumor heterogeneity and provide treatment recommendations for hepatocellular carcinoma. Front Immunol. (2022) 13:964190. doi: 10.3389/fimmu.2022.964190
47. Ogawa, K, Kanzaki, H, Chiba, T, Ao, J, Qiang, N, Ma, Y, et al. Effect of Atezolizumab plus bevacizumab in patients with hepatocellular carcinoma harboring CTNNB1 mutation in early clinical experience. J Cancer. (2022) 13:2656–61. doi: 10.7150/jca.71494
48. Murai, H, Kodama, T, Maesaka, K, Tange, S, Motooka, D, Suzuki, Y, et al. Multiomics identifies the link between intratumor steatosis and the exhausted tumor immune microenvironment in hepatocellular carcinoma. Hepatology. (2023) 77:77–91. doi: 10.1002/hep.32573
49. Xiao, X, Mo, H, and Tu, K. CTNNB1 mutation suppresses infiltration of immune cells in hepatocellular carcinoma through miRNA-mediated regulation of chemokine expression. Int Immunopharmacol. (2020) 89:107043. doi: 10.1016/j.intimp.2020.107043
50. Rialdi, A, Duffy, M, Scopton, AP, Fonseca, F, Zhao, JN, Schwarz, M, et al. WNTinib is a multi-kinase inhibitor with specificity against β-catenin mutant hepatocellular carcinoma. Nat Cancer. (2023) 4:1157–75. doi: 10.1038/s43018-023-00609-9
51. Senni, N, Savall, M, Cabrerizo Granados, D, Alves-Guerra, MC, Sartor, C, Lagoutte, I, et al. β-Catenin-activated hepatocellular carcinomas are addicted to fatty acids. Gut. (2019) 68:322–34. doi: 10.1136/gutjnl-2017-315448
52. Pinyol, R, Sia, D, and Llovet, JM. Immune exclusion-WNT/CTNNB1 class predicts resistance to immunotherapies in HCC. Clin Cancer Res. (2019) 25:2021–3. doi: 10.1158/1078-0432.CCR-18-3778
53. Charawi, S, Just, PA, Savall, M, Abitbol, S, Traore, M, Metzger, N, et al. LKB1 signaling is activated in CTNNB1-mutated HCC and positively regulates β-catenin-dependent CTNNB1-mutated HCC. J Pathol. (2019) 247:435–43. doi: 10.1002/path.5202
54. Mortimer, PM, Nichols, E, Thomas, J, Shanbhag, R, Singh, N, Coomber, EL, et al. A novel mutation in EROS (CYBC1) causes chronic granulomatous disease. Clin Immunol. (2023) 255:109761. doi: 10.1016/j.clim.2023.109761
55. Thomas, DC, Charbonnier, LM, Schejtman, A, Aldhekri, H, Coomber, EL, Dufficy, ER, et al. EROS/CYBC1 mutations: decreased NADPH oxidase function and chronic granulomatous disease. J Allergy Clin Immunol. (2019) 143:782–785.e1. doi: 10.1016/j.jaci.2018.09.019
56. Chen, QY, Li, L, and Suo, DQ. DNase1L3 suppresses hepatocellular carcinoma growth via inhibiting complement autocrine effect. Neoplasma. (2021) 68:683–91. doi: 10.4149/neo_2021_201010N1069
57. Sun, J, Wang, X, Shen, Q, Wang, M, Chen, S, Zhang, X, et al. DNASE1L3 inhibits hepatocellular carcinoma by delaying cell cycle progression through CDK2. Cell Oncol. (2022) 45:1187–202. doi: 10.1007/s13402-022-00709-1
58. Deng, Z, Xiao, M, Du, D, Luo, N, Liu, D, Liu, T, et al. Dnase1l3 as a prognostic biomarker associated with immune cell infiltration in cancer. Onco Targets Ther. (2021) 14:2003–17. doi: 10.2147/OTT.S294332
59. Ouyang, B, Xie, QQ, Huang, W, Wang, L, Tang, S, and Fu, J. Diagnostic value of serum DNASE1L3 in hepatitis B virus-related hepatocellular carcinoma. Clin Lab. (2021) 67. doi: 10.7754/Clin.Lab.2020.200627
60. Wang, S, Ma, H, Li, X, Mo, X, Zhang, H, Yang, L, et al. DNASE1L3 as an indicator of favorable survival in hepatocellular carcinoma patients following resection. Aging. (2020) 12:1171–85. doi: 10.18632/aging.102675
61. Li, B, Ge, YZ, Yan, WW, Gong, B, Cao, K, Zhao, R, et al. DNASE1L3 inhibits proliferation, invasion and metastasis of hepatocellular carcinoma by interacting with β-catenin to promote its ubiquitin degradation pathway. Cell Prolif. (2022) 55:e13273. doi: 10.1111/cpr.13273
62. Li, N, Zheng, X, Chen, M, Huang, L, Chen, L, Huo, R, et al. Deficient DNASE1L3 facilitates neutrophil extracellular traps-induced invasion via cyclic GMP-AMP synthase and the non-canonical NF-κB pathway in diabetic hepatocellular carcinoma. Clin Transl Immunol. (2022) 11:e1386. doi: 10.1002/cti2.1386
63. Kim, SY, Shen, Q, Son, K, Kim, HS, Yang, HD, Na, MJ, et al. SMARCA4 oncogenic potential via IRAK1 enhancer to activate Gankyrin and AKR1B10 in liver cancer. Oncogene. (2021) 40:4652–62. doi: 10.1038/s41388-021-01875-6
64. Cheng, BY, Lau, EY, Leung, HW, Leung, CON, Ho, NP, Gurung, S, et al. Irak1 augments cancer stemness and drug resistance via the ap-1/akr1b10 signaling cascade in hepatocellular carcinoma. Cancer Res. (2018) 78:1986. doi: 10.1158/1538-7445.AM2018-1986
65. Chen, W, Wei, T, Chen, Y, Yang, L, and Wu, X. Downregulation of irak1 prevents the malignant behavior of hepatocellular carcinoma cells by blocking activation of the mapks/nlrp3/il-1β pathway. Onco Targets Ther. (2020) 13:12787–96. doi: 10.2147/OTT.S260793
66. Ye, ZH, Gao, L, Wen, DY, He, Y, Pang, YY, and Chen, G. Diagnostic and prognostic roles of IRAK1 in hepatocellular carcinoma tissues: an analysis of immunohistochemistry and RNA-sequencing data from the cancer genome atlas. Onco Targets Ther. (2017) 10:1711–23. doi: 10.2147/OTT.S132120
67. Li, LM, Chen, C, Ran, RX, Huang, JT, Sun, HL, Zeng, C, et al. Loss of TARBP2 drives the progression of hepatocellular carcinoma via miR-145-SERPINE1 Axis. Front Oncol. (2021) 11:620912. doi: 10.3389/fonc.2021.620912
68. Divella, R, Daniele, A, Abbate, I, Savino, E, Casamassima, P, Sciortino, G, et al. Circulating levels of PAI-1 and SERPINE1 4G/4G polymorphism are predictive of poor prognosis in HCC patients undergoing TACE. Transl Oncol. (2015) 8:273–8. doi: 10.1016/j.tranon.2015.05.002
69. Xiaochun, H, Feixiong, P, Shengsong, O, Xiaojiao, W, Yuju, X, and Yanhua, L. Identification and validation of an inflammatory response-related polygenic risk score as a prognostic marker in hepatocellular carcinoma. Dis Markers. (2022) 2022:1–14. doi: 10.1155/2022/1739995
70. Zhang, Q, Feng, Z, Gao, M, and Guo, L. Determining novel candidate anti-hepatocellular carcinoma drugs using interaction networks and molecular docking between drug targets and natural compounds of SiNiSan. PeerJ. (2021) 9:e10745. doi: 10.7717/peerj.10745
71. Song, L, Su, X, Lu, Y, Hua, D, and Gao, Z. An inflammation-associated prognosis model for hepatocellular carcinoma based on adenylate Uridylate- (AU-) rich element genes. Mediat Inflamm. (2023) 2023:1–17. doi: 10.1155/2023/2613492
72. Divella, R, Mazzocca, A, Gadaleta, C, Simone, G, Paradiso, A, Quaranta, M, et al. Influence of plasminogen activator inhibitor-1 (SERPINE1) 4G/5G polymorphism on circulating SERPINE-1 antigen expression in HCC associated with viral infection. Cancer Genomics Proteomics. (2012) 9:193–8. doi: 10.1016/j.jep.2006.05.032
73. Papadakos, SP, Machairas, N, Stergiou, IE, Arvanitakis, K, Germanidis, G, Frampton, AE, et al. Unveiling the yin-Yang balance of M1 and M2 macrophages in hepatocellular carcinoma: role of exosomes in tumor microenvironment and immune modulation. Cells. (2023) 12:2036. doi: 10.3390/cells12162036
74. Xu, R, Wu, Q, Gong, Y, Wu, Y, Chi, Q, and Sun, D. A novel prognostic target-gene signature and nomogram based on an integrated bioinformatics analysis in hepatocellular carcinoma. Biocell. (2022) 46:1261–88. doi: 10.32604/biocell.2022.018427
75. Chiarotti, F, and Venerosi, A. Epidemiology of autism spectrum disorders: a review of worldwide prevalence estimates since 2014. Brain Sci. (2020) 10:274. doi: 10.3390/brainsci10050274
76. Hickey, JW, Haist, M, Horowitz, N, Caraccio, C, Tan, Y, Rech, AJ, et al. T cell-mediated curation and restructuring of tumor tissue coordinates an effective immune response. Cell Rep. (2023) 42:113494. doi: 10.1016/j.celrep.2023.113494
77. Mulyadi, AM, Sihombing, AVR, Hendrawan, H, Marpaung, E, Malisan, J, Arianto, D, et al. Subaryata, Siregar NAM, et al. effect of traffic lights countdown Timer and motorcycle lanes as an approach to the red box for motorcycles in Bali Island. Infrastructures (Basel). (2022) 7:127. doi: 10.3390/infrastructures7100127
78. Dai, K, Liu, C, Guan, G, Cai, J, and Wu, L. Identification of immune infiltration-related genes as prognostic indicators for hepatocellular carcinoma. BMC Cancer. (2022) 22:496. doi: 10.1186/s12885-022-09587-0
79. Wei, Y, Lan, C, Yang, C, Liao, X, Zhou, X, Huang, X, et al. Robust analysis of a novel PANoptosis-related prognostic gene signature model for hepatocellular carcinoma immune infiltration and therapeutic response. Sci Rep. (2023) 13:14519. doi: 10.1038/s41598-023-41670-9
80. Wu, D, and Li, Y. Application of adoptive cell therapy in hepatocellular carcinoma. Immunology. (2023) 170:453–69. doi: 10.1111/imm.13677
81. He, Z, Zhang, J, and Huang, W. Diagnostic role and immune correlates of programmed cell death-related genes in hepatocellular carcinoma. Sci Rep. (2023) 13:20509. doi: 10.1038/s41598-023-47560-4
82. Hartwell, HJ, Petrosky, KY, Fox, JG, Horseman, ND, and Rogers, AB. Prolactin prevents hepatocellular carcinoma by restricting innate immune activation of c-Myc in mice. Proc Natl Acad Sci USA. (2014) 111:11455–60. doi: 10.1073/pnas.1404267111
83. Zhao, M, Xu, P, Shi, W, Wang, J, Wang, T, and Li, P. Icariin exerts anti-tumor activity by inducing autophagy via AMPK/mTOR/ULK1 pathway in triple-negative breast cancer. Cancer Cell Int. (2024) 24:74. doi: 10.1186/s12935-024-03266-9
84. Davidsson, S, Fiorentino, M, Giunchi, F, Eriksson, M, Erlandsson, A, Sundqvist, P, et al. Infiltration of M2 macrophages and regulatory T cells plays a role in recurrence of renal cell carcinoma. Eur Urol Open Sci. (2020) 20:62–71. doi: 10.1016/j.euros.2020.06.003
85. You, JA, Gong, Y, Wu, Y, Jin, L, Chi, Q, and Sun, D. WGCNA, LASSO and SVM algorithm revealed RAC1 correlated M0 macrophage and the risk score to predict the survival of hepatocellular carcinoma patients. Front Genet. (2022) 12:730920. doi: 10.3389/fgene.2021.730920
86. Witonsky, S, Buechner-Maxwell, V, Santonastasto, A, Pleasant, R, Werre, S, Wagner, B, et al. Can levamisole upregulate the equine cell-mediated macrophage (M1) dendritic cell (DC1) T-helper 1 (CD4 Th1) T-cytotoxic (CD8) immune response in vitro? J Vet Intern Med. (2019) 33:889–96. doi: 10.1111/jvim.15404
87. Hu, X, Zhu, H, Chen, B, He, X, Shen, Y, Zhang, X, et al. Tubulin alpha 1b is associated with the immune cell infiltration and the response of HCC patients to immunotherapy. Diagnostics. (2022) 12:858. doi: 10.3390/diagnostics12040858
88. Wang, K, Wu, J, Yang, Z, Zheng, B, Shen, S, Ru, WR, et al. Hyperactivation of β-catenin signal in hepatocellular carcinoma recruits myeloid-derived suppressor cells through PF4-CXCR3 axis. Cancer Lett. (2024) 586:216690. doi: 10.1016/j.canlet.2024.216690
89. Li, J, Wang, W, Zhou, Y, Liu, L, Zhang, G, Guan, K, et al. m6A regulator-associated modification patterns and immune infiltration of the tumor microenvironment in Hepatocarcinoma. Front Cell Dev Biol. (2021) 9:687756. doi: 10.3389/fcell.2021.687756
Keywords: hepatocellular carcinoma, inflammation-related genes, prognostic model, risk score, tumor immune infiltration
Citation: Li Y, Fang Y, Li D, Wu J, Huang Z, Liao X, Liu X, Wei C and Huang Z (2024) Constructing a prognostic model for hepatocellular carcinoma based on bioinformatics analysis of inflammation-related genes. Front. Med. 11:1420353. doi: 10.3389/fmed.2024.1420353
Edited by:
Pradeep Kumar Shukla, University of Tennessee Health Science Center (UTHSC), United StatesReviewed by:
Komal Ramani, Cedars Sinai Medical Center, United StatesDa Sun, Wenzhou University, China
Copyright © 2024 Li, Fang, Li, Wu, Huang, Liao, Liu, Wei and Huang. This is an open-access article distributed under the terms of the Creative Commons Attribution License (CC BY). The use, distribution or reproduction in other forums is permitted, provided the original author(s) and the copyright owner(s) are credited and that the original publication in this journal is cited, in accordance with accepted academic practice. No use, distribution or reproduction is permitted which does not comply with these terms.
*Correspondence: Chunxiao Wei, NDY5MDc3MjA4QHFxLmNvbQ==; Zhong Huang, MjY5NDgxMDE1QHFxLmNvbQ==
†These authors have contributed equally to this work and share first authorship