
94% of researchers rate our articles as excellent or good
Learn more about the work of our research integrity team to safeguard the quality of each article we publish.
Find out more
ORIGINAL RESEARCH article
Front. Med., 04 June 2024
Sec. Hepatobiliary Diseases
Volume 11 - 2024 | https://doi.org/10.3389/fmed.2024.1334865
 Tanja Fererberger1
 Christa Buechler1Arne Kandulski1Tanja Elger1
 Johanna Loibl1
 Stephan Schmid1Stefanie Sommersberger1
 Stefan Gunawan1
 Sebastian Zundler2,3Muriel Huss1Dominik Bettenworth4,5
 Sally Kempa6Simon Weidlich7Bandik Föh8,9Xinyu Huang10Marcin Grzegorzek10
 Stefanie Derer-Petersen8
 Ulrich L. Günther11
 Jens U. Marquardt9
 Claudia Kunst1Karsten Gülow1
 Martina Müller1
 Christian Sina8,9,12
 Franziska Schmelter8†
 Hauke C. Tews1†
Intoduction: Identification of specific metabolome and lipidome profile of patients with primary sclerosing cholangitis (PSC) is crucial for diagnosis, targeted personalized therapy, and more accurate risk stratification.
Methods: Nuclear magnetic resonance (NMR) spectroscopy revealed an altered metabolome and lipidome of 33 patients with PSC [24 patients with inflammatory bowel disease (IBD) and 9 patients without IBD] compared with 40 age-, sex-, and body mass index (BMI)-matched healthy controls (HC) as well as 64 patients with IBD and other extraintestinal manifestations (EIM) but without PSC.
Results: In particular, higher concentrations of pyruvic acid and several lipoprotein subfractions were measured in PSC in comparison to HC. Of clinical relevance, a specific amino acid and lipid profile was determined in PSC compared with IBD and other EIM.
Discussion: These results have the potential to improve diagnosis by differentiating PSC patients from HC and those with IBD and EIM.
Primary sclerosing cholangitis (PSC) is a disease that typically affects intra- and/or extrahepatic bile ducts (1, 2), and can progress to end-stage liver disease with hepatic dysfunction (3). Moreover, PSC is often associated with inflammatory bowel disease (IBD) (4). An important consequence of PSC is the increased risk of malignant progression to cholangiocarcinoma (CCA), but it is also associated with higher risk for gallbladder cancer, and colorectal carcinoma (CRC) in patients with concomitant ulcerative colitis (UC) (5–7). Of note, coincidence of PSC in a patient with UC is a marked risk factor for developing colitis-associated cancer (8).
The prevalence of PSC determined by studies in Europe, North America, and Asia varies due to regional and temporal differences up to 31.7 cases per 100,000 people (Finland, 1990−2015). The latest study conducted on the prevalence detected a point prevalence of 11.0 per 1,00,000 people in December 2021 in the Faroe Islands (9).
PSC diagnosis relies on clinical symptoms, laboratory tests, imaging, and histology (10). Magnetic resonance cholangiopancreatography (MRCP) or endoscopic retrograde cholangiopancreatography (ERCP) widely confirm the diagnosis of PSC (11). MRCP is the favored procedure because it is non-invasive and can show bile ducts with high resolution (12). However, the identification of early disease stages by MRCP may exhibit lower sensitivity than performing ERCP (13). In addition to its high sensitivity, ERCP offers the advantage of therapeutic intervention, but it is more invasive than MRCP (12). Liver biopsy should only be performed in cases of unclear diagnosis, suspected small duct PSC or overlapping syndromes (12). PSC prognosis indicators encompass alkaline phosphatase (AP), perinuclear antineutrophil cytoplasmic antibodies (p-ANCA), immunoglobulin G4 (IgG4), and antiglycoprotein 2 (GP2) immunoglobulin A (IgA) (14, 15).
Environmental and genetic factors are involved in the pathogenesis of PSC (16). A marked association between PSC and the human leukocyte antigen (HLA) system as well various disease risk loci are described (17–20). Studies by Zecher et al. (21) recently discovered the new risk haplotype HLA-DP A1*02:01∼DPB1*01:01. Takeda G protein-coupled receptor (TGR)-5, which has a protective function against the toxicity of bile acid, is reduced in biliary epithelial cells in patients with PSC. Thus, the downregulation of TGR-5 may play a role in PSC pathogenesis (22).
PSC is associated with immunological alterations in concentrations of serum cytokines. High levels of interferon (IFN) gamma, interleukin (IL)-6, IL-8, IL-10 and IL-17A are described (23, 24). In addition, induction of proinflammatory T helper (TH) 17 cells toward pathogen stimulation was determined in PSC (25). Furthermore, released transforming growth factor (TGF) beta from perisinusoidal macrophages may contribute to inflammation and fibrotic process in patients with PSC (26, 27).
In summary, some data on prognosis, genetic alterations, and pathogenesis of PSC patients have been obtained in recent years (14–27). However, studies on the metabolome and lipidome of PSC patients are still a rarity (11, 28–30). We hope that our work will enable us to develop metabolomic profiles for PSC, which will increase the diagnostic accuracy of the diagnosis.
In addition, NMR spectroscopy should be used in the future to evaluate whether there are indications of which subgroups or PSC phenotypes benefit from certain therapeutic treatments. These would be steps toward a personalized treatment of PSC patients.
Metabolomics is defined as the comprehensive measurement of metabolites within a biological sample such as blood, urine, cells, or tissues. It is a common method to identify diagnostic and prognostic disease-specific biomarkers (31). In recent years, the techniques of “omics” in combination with bioinformatic methods to identify these biomarkers have been developed rapidly.
Identifying specific biomarkers can enhance the understanding of the pathogenesis and progression of the disease, guide personalized therapy, and aid in precise risk stratification (14, 32). Despite recent progress (32), the identification of PSC-specific biomarkers for diagnosis remains challenging (14, 33).
Our study aimed to analyze the metabolomic and lipidomic serum profiles of patients with PSC using nuclear magnetic resonance (NMR) spectroscopy, to identify variations in metabolite profiles. Establishing NMR spectroscopy alongside image morphology techniques in the diagnosis of PSC may sharpen the reliability of the diagnosis or even identify specific subgroups with defined risk for neoplastic progression.
The Ethics Committee of the University of Regensburg and the University of Lübeck approved the study on 19.05.2021 (No. 21-2390-101 and No. 22-104). All study participants were informed orally as well as in writing and gave their written consent to the study participation.
Patients with confirmed PSC, PSC and IBD (PSC-IBD), and IBD with other extraintestinal manifestations (EIM) seen between January 2021 and December 2022 for outpatient or inpatient consultations at the Department of Internal Medicine I, University Hospital of Regensburg, were included. Controls included 40 healthy individuals recruited by the University of Lübeck, matched to the patients with PSC in terms of age, sex, and BMI. People under the age of 18, pregnant women, and people unable to give their consent were excluded.
After the collection of serum samples from 33 patients with PSC, 64 patients with EIM, and 40 healthy controls (HC), the samples were left to clot for 30 min at room temperature. Subsequently, centrifugation followed by aliquoting into samples and backup samples was performed. The samples were stored at −80°C until measurement.
Measurements were performed using proton nuclear magnetic resonance (1H-NMR) spectroscopy according to the standardized protocol described by Dona et al. (34). Bruker’s in vitro diagnostic research (IVDr) procedure was applied. For this, serum samples were thawed and mixed with phosphate buffer (75 mM, pH 7.4) before 600 μL were transferred to the appropriate 5 mm NMR tubes. Two different spectra were collected for each sample: One-dimensional (1D) Nuclear Overhauser Enhancement Spectroscopy (NOESY) spectrum (pulse program: noesygppr1d) and a 1D Carr–Purcell–Meiboom–Gill (CPMG) spin-echo spectrum (pulse program: cpmgpr1d). 39 metabolites and 112 lipoprotein parameters were automatically determined by Bruker Quantification in Plasma/Serum (B.I.Quant-PS 2.0.0) and Bruker IVDr Lipoprotein Subclass Analysis (B.I.-LISA). Various very low-density lipoprotein (VLDL), low-density lipoprotein (LDL), intermediate-density lipoprotein (IDL), and high-density lipoprotein (HDL) parameter in cholesterol (Chol), free cholesterol (FC), phospholipids (PL) triglycerides (TG), and apolipoprotein (Apo) were analyzed.
An unpaired, non-parametric Mann-Whitney test was used to determine the comparability of the patients (PSC and EIM) and HC in terms of sex, age, and BMI. In addition, a comparison of sex, age, and BMI between all three groups (PSC, EIM, and HC) was performed using non-parametric Kruskal-Wallis test. Multivariate partial least square discriminant analysis (PLS-DA) with quantified IVDr data was performed in PLS toolbox (Eigenvector Research, Inc. Wenatchee, Washington). Data were variance-scaled, mean-centered, and orthogonal signal corrected. Venetian blinds were used for cross-validation and calculation of the area under the curve (AUC). Furthermore, a random forest analysis with cross-validation was conducted using the program Python with the TensorFlow framework and scikit-learn package. For feature selection, we employed both the Mean Decrease in Impurity (MDI) and Mean Decrease Accuracy methods. The accuracy and standard deviation (SD) were calculated for both models. For univariate comparisons, unpaired multiple Mann-Whitney test (p ≤ 0.05) with a false discovery rate of 1% using the method from Benjamini, Krieger, and Yekutieli were applied. For pyruvic acid the receiver operating characteristic (ROC) curve and the corresponding AUC were calculated.
Demographic data such as sex, age, and body mass index (BMI) from patients with PSC, patients with EIM, and HC are listed in Table 1.
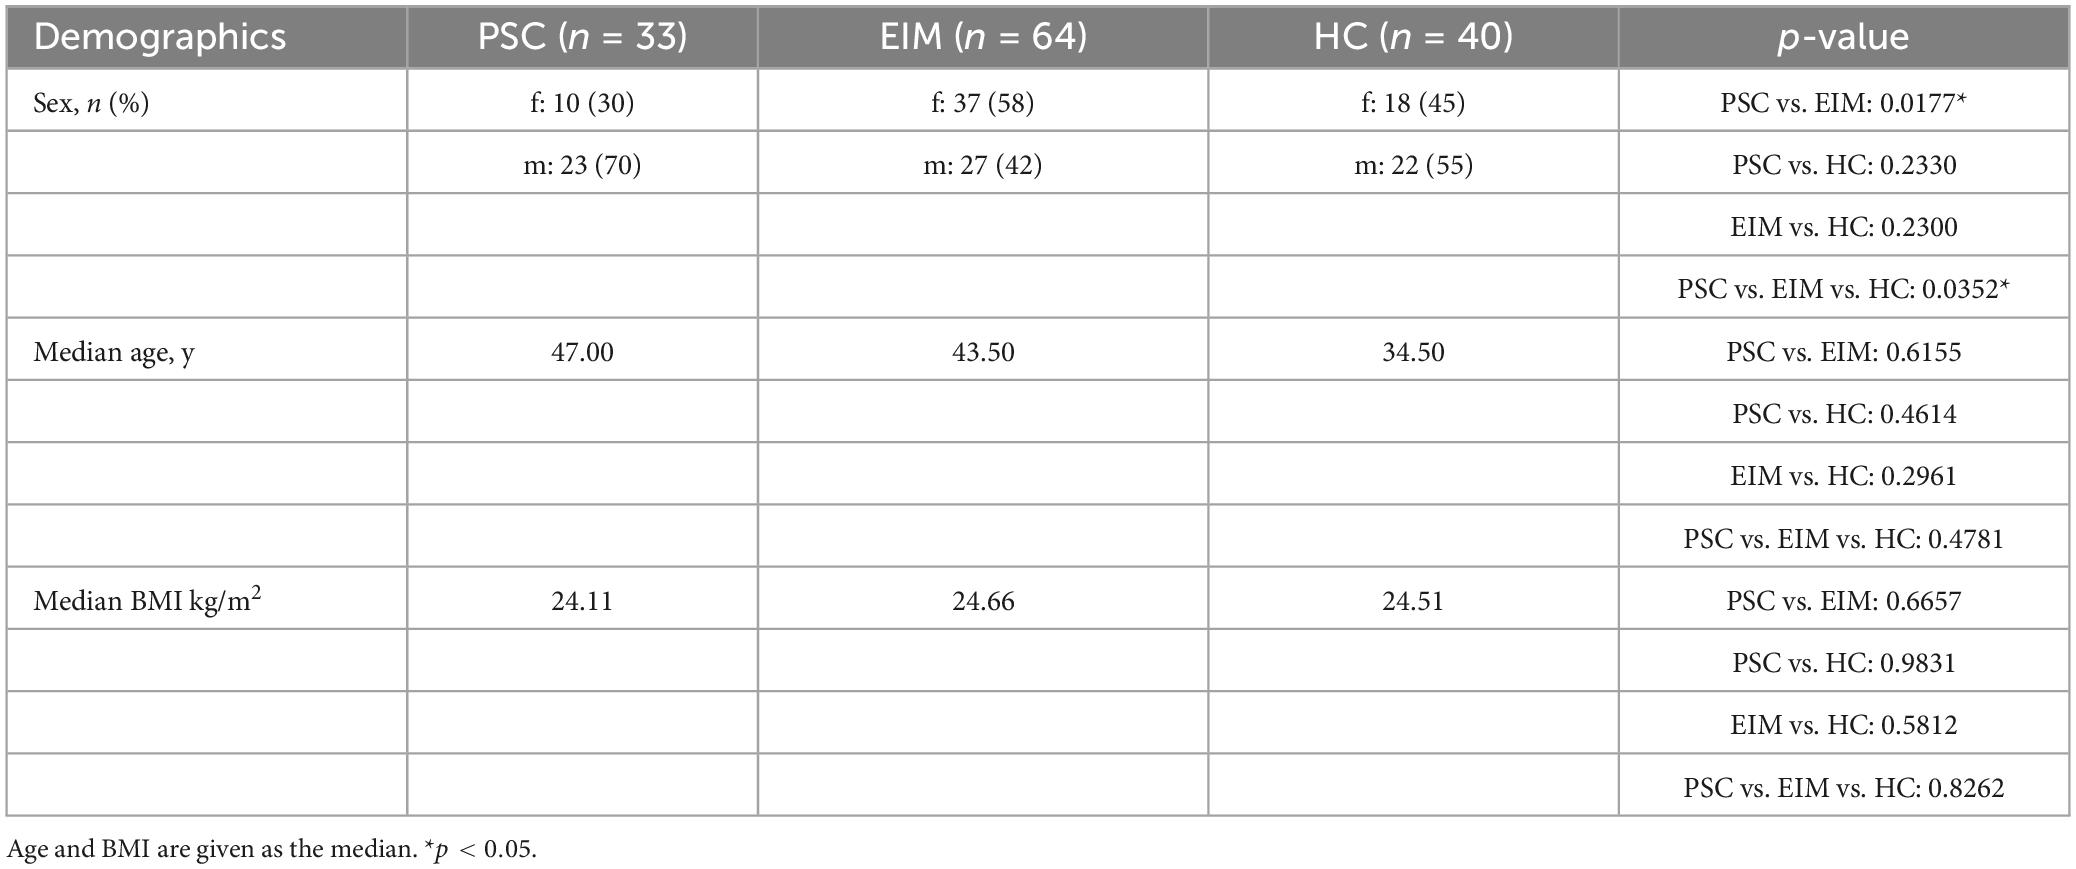
Table 1. Demographics of the study cohort, consisting of patients with PSC, patients with EIM, and HC.
PSC patients were subdivided into patients with and without IBD. Age of initial diagnosis, laboratory parameters gamma-glutamyltransferase (gamma-GT), alanine-transaminase (ALT), AP, bilirubin, model of endstage liver disease (MELD) score (≥5, ≥10, ≥15), Child-Pugh stage of liver cirrhosis (none, CHILD A, CHILD B, CHILD C), histological proof of diagnosis, dominant stenosis, performed liver transplantation, cholestasis, portal hypertension/hepatosplenomegaly, and autoimmune hepatitis (AIH)-PSC overlap syndrome were evaluated to phenotype the PSC patients (Table 2).
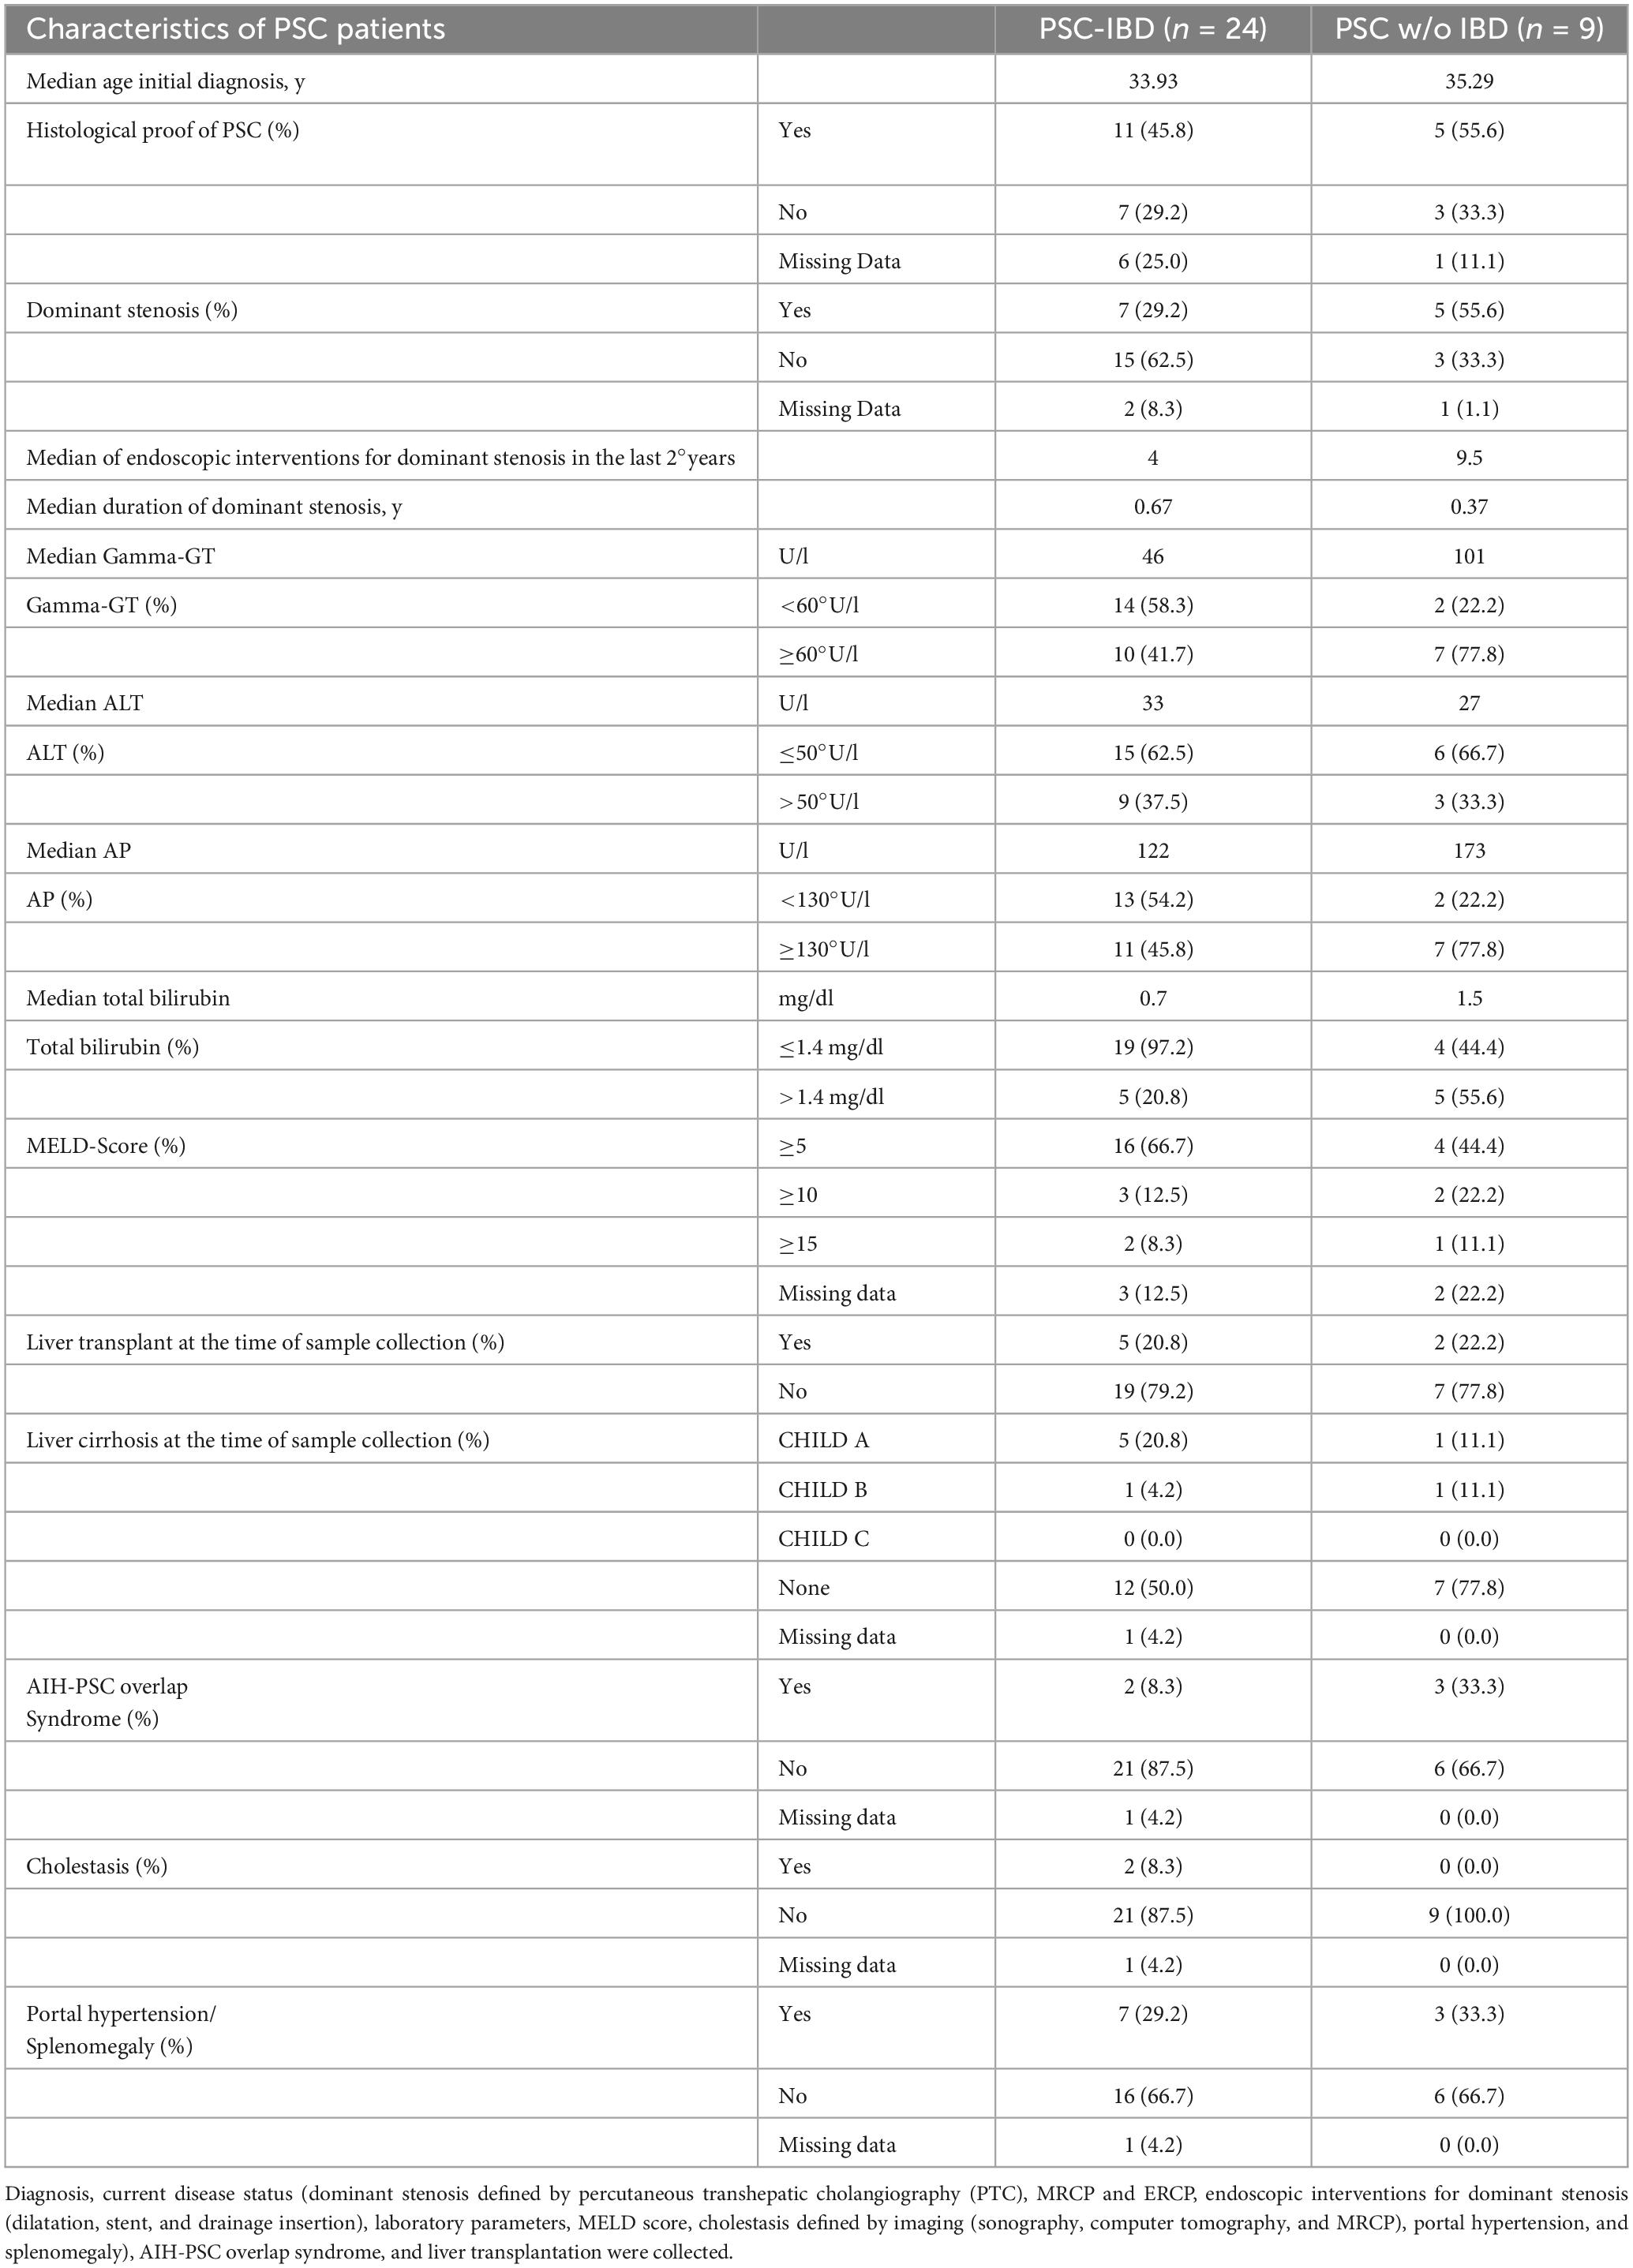
Table 2. Characteristics of PSC-IBD patients and PSC patients without IBD.
Table 3 describes EIM and previous gastrointestinal surgeries for patients with PSC-IBD (patients with PSC-IBD as listed in Table 2) and patients with EIM. To get an impression of the current disease activity of IBD, fecal calprotectin, histological remission, and Gastrointestinal Symptom Rating Scale (GSRS) questionnaires with a maximum of 91 points in total and division into 4 groups (no complaints: 13; minor complaints 14-39; moderate complaints 40-65; strong complaints: 66-91) were used (Table 3).
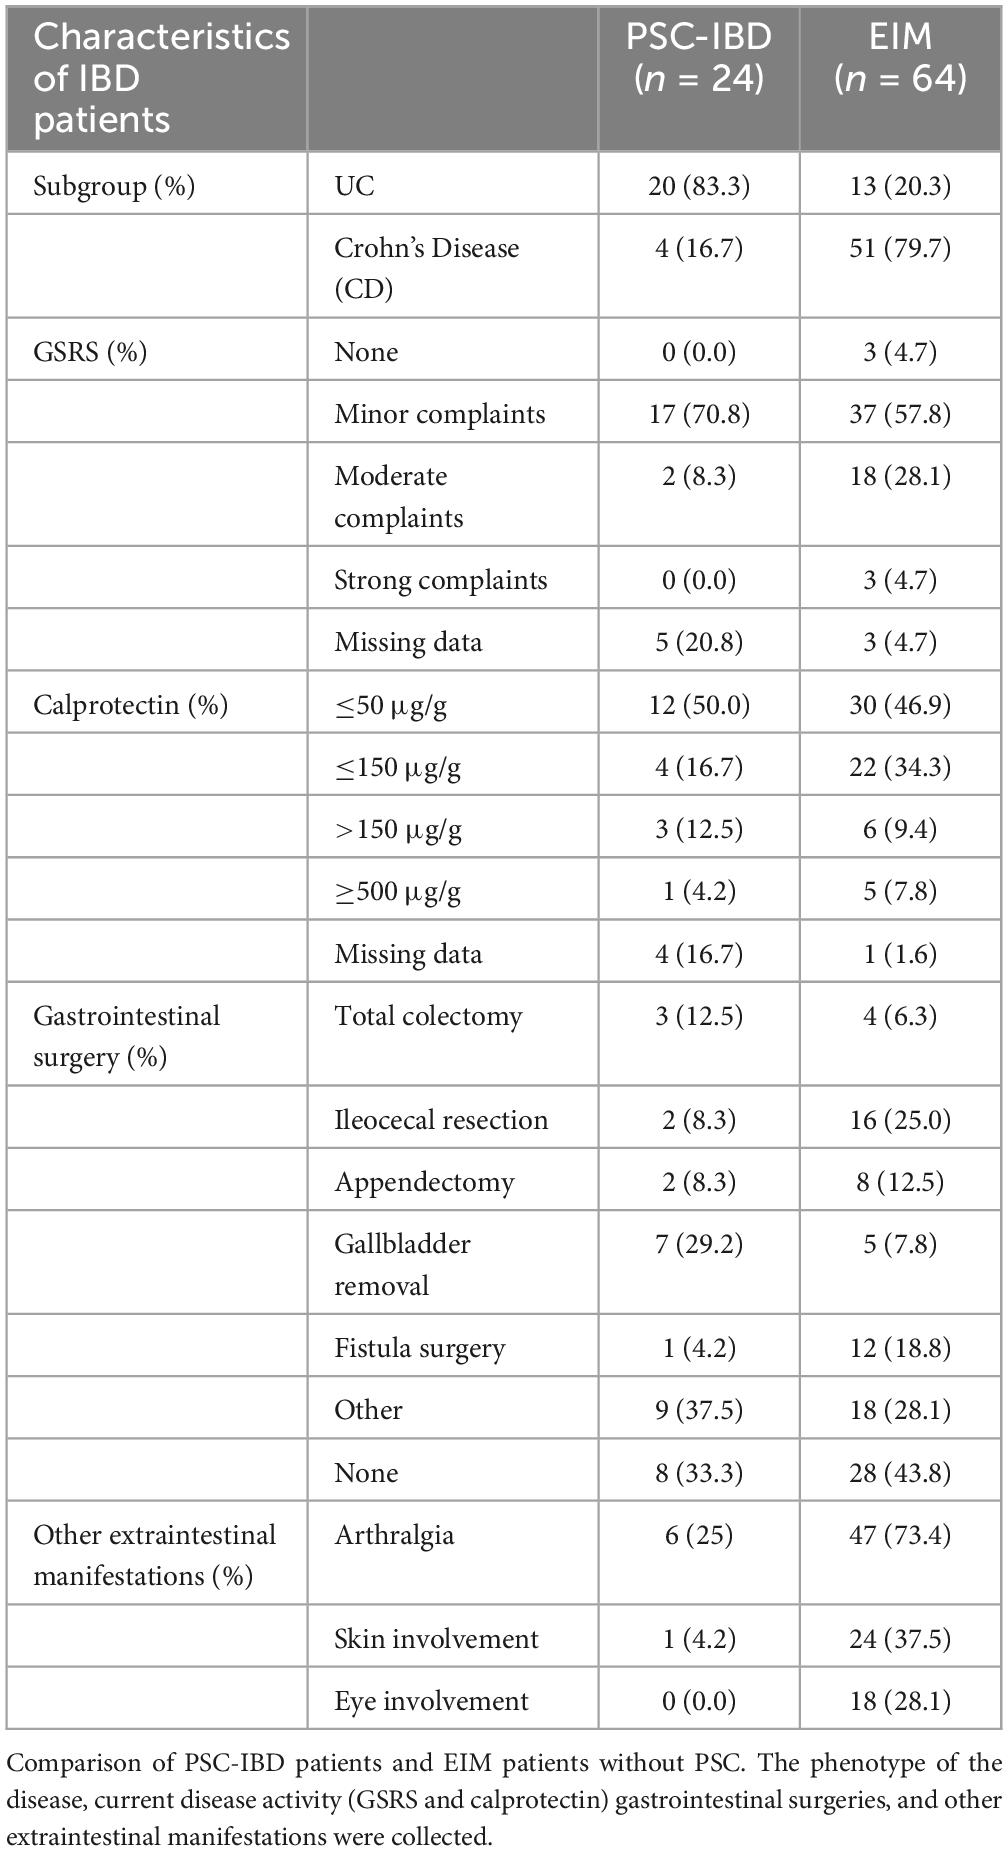
Table 3. Characteristics of patients with IBD.
NMR spectroscopy was used to distinguish metabolome and lipidome profiles in patients with PSC, EIM, as well as HC.
Scores plot of PLS-DA for quantified IVDr data shows a separation of patients with PSC (red), patients with EIM (blue), and HC (green) (Figure 1A). Corresponding metabolites and lipoproteins that are decisive for good discrimination are shown in the loadings plot (Figure 1B). Amino acids and several components of LDL, and HDL subfractions differed between the groups. The AUC values for cross-validation of 0.87 for PSC, 0.84 for HC, and 0.86 for EIM indicate a suitable model for the discrimination of PSC, EIM, and HC (Supplementary Figure 1). Additionally, we conducted a random forest analysis with cross-validation. On one hand, the model using Mean Decrease in Impurity (MDI) yielded an accuracy of 89.6% (SD: 0.054), and on the other hand, Mean Decrease Accuracy resulted in 79.3% (SD: 0.095). The parameters contributing to the discrimination between the three groups in both models, achieving a high score (MDI > 0.01 and Mean Decrease in Accuracy > 0), are presented in Supplementary Figure 2.
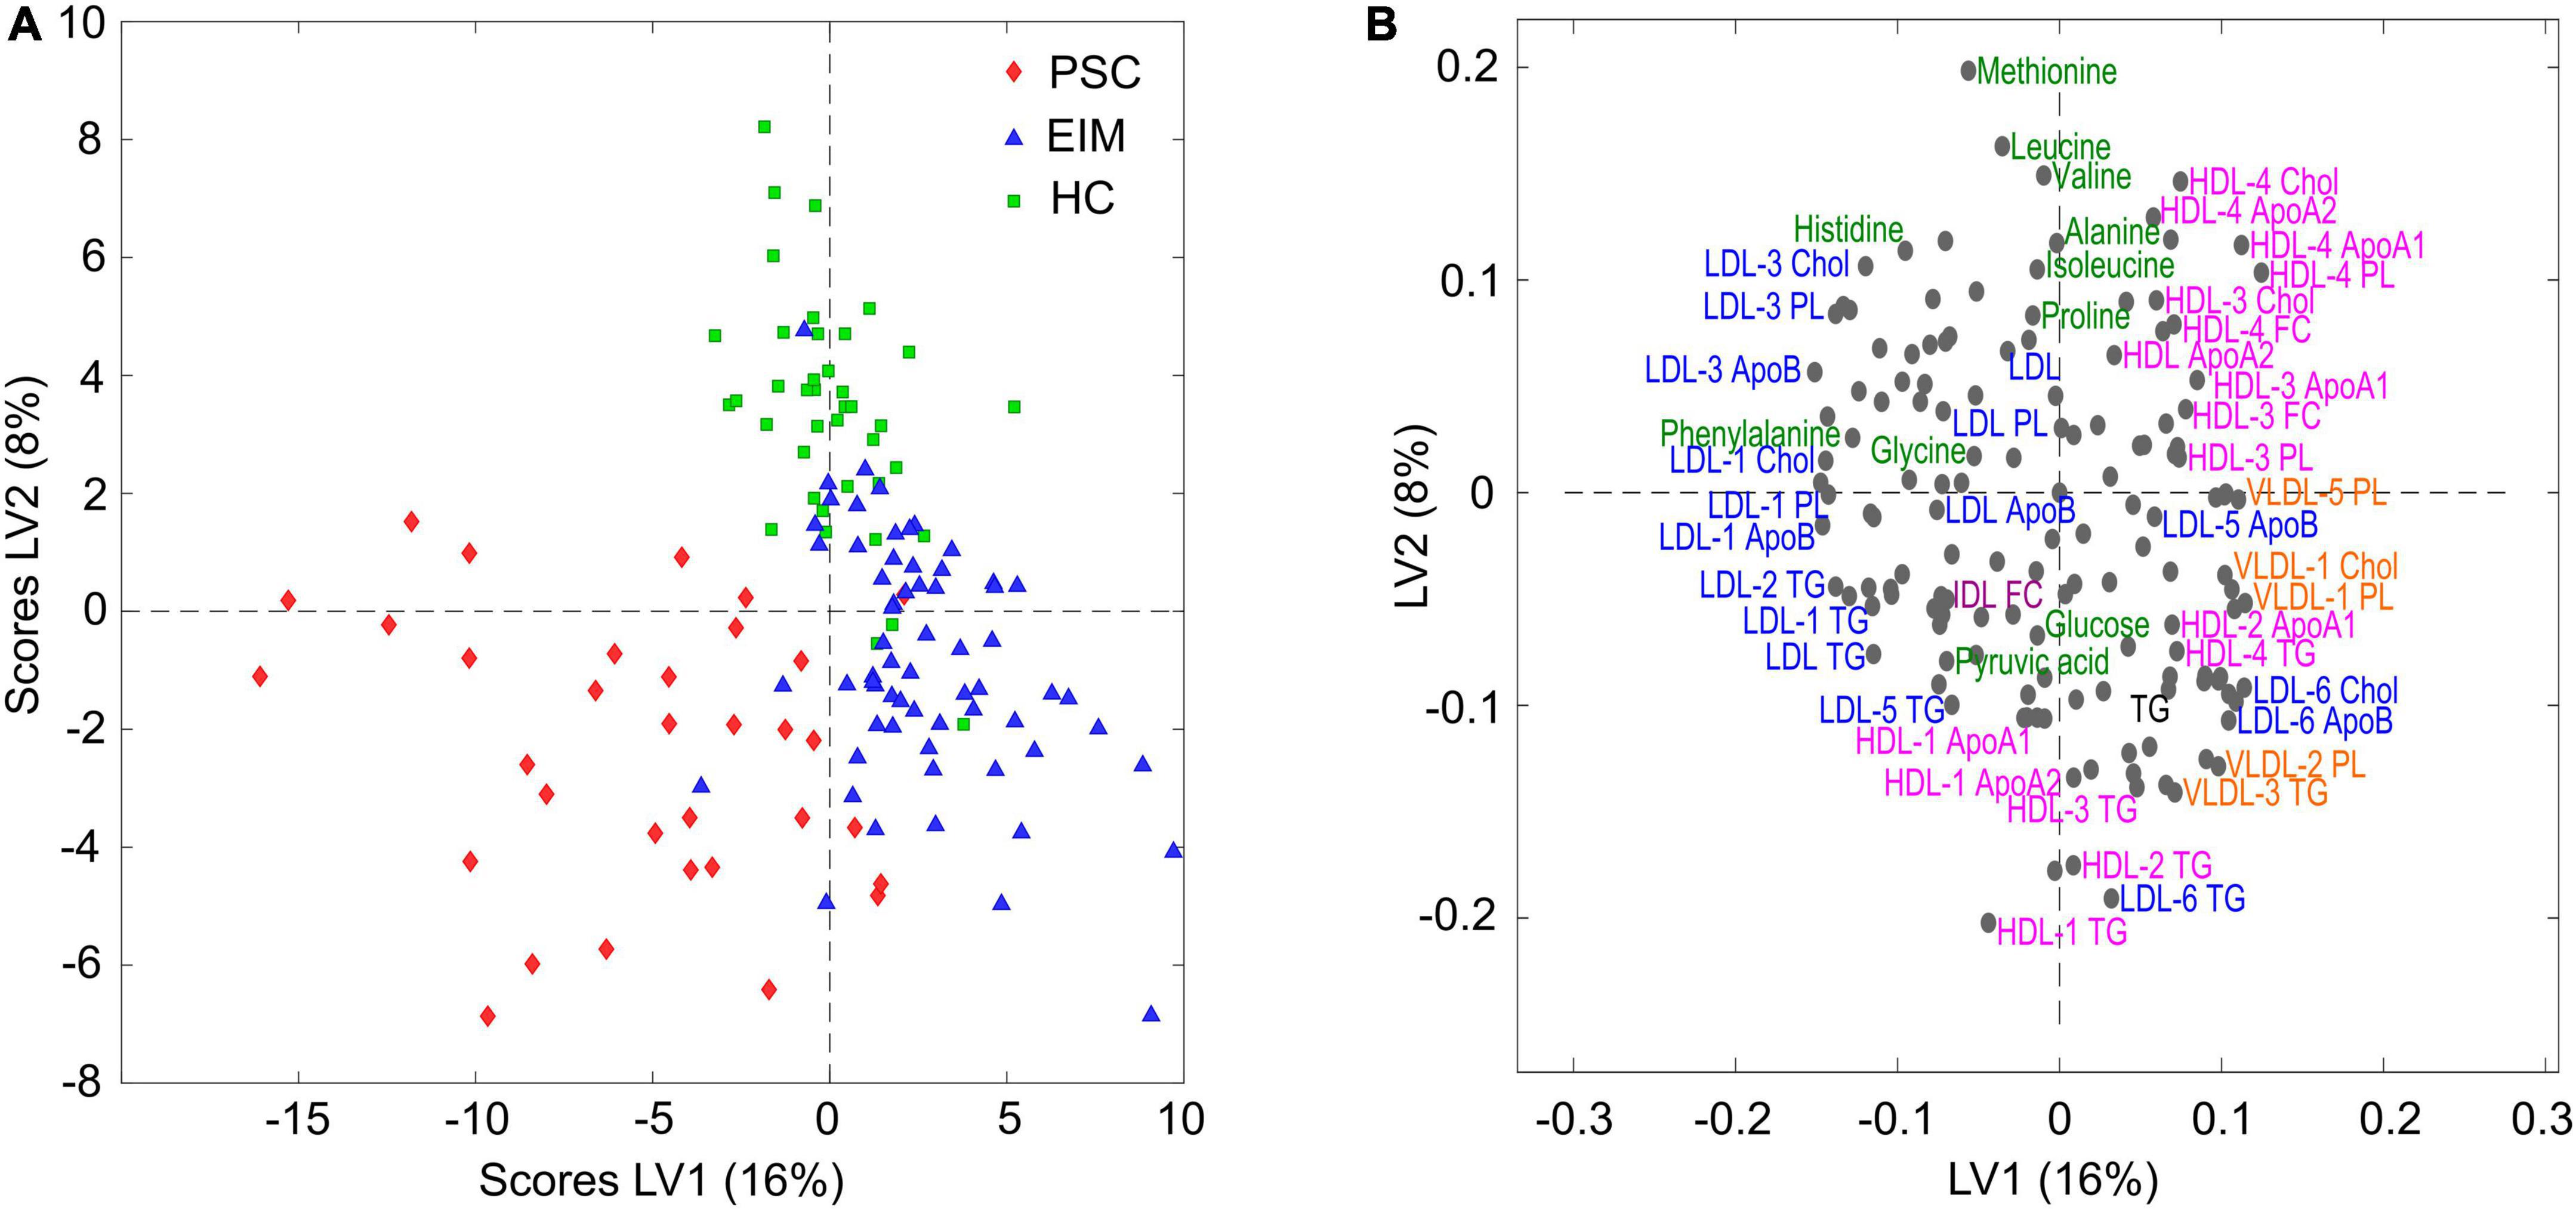
Figure 1. (A) Scores plot of PLS-DA for quantified NMR data in patients with PSC (red, n = 33), EIM (blue, n = 64), and HC (green, n = 40). (B) Corresponding loadings plot of distinct metabolome and lipidome profiles. Axis label: latent variable (LV).
The adjusted forest plots in Figure 2 display the differences between PSC (red) and EIM (blue) compared to the HC, respectively, and normalized to the standard deviation of HC in metabolites and lipoproteins. The dashed vertical line serves as the mean reference range of the HC, while the horizontal dots indicate the deviation from the reference. The color-filled shapes demonstrate statistically significant parameters, while color-filled red circles indicate the significance of PSC to HC, and blue color-filled squares indicate the significance of EIM to HC. Bold printed names of metabolites and lipoproteins indicate statistical significance between PSC and EIM (Supplementary Table 1).
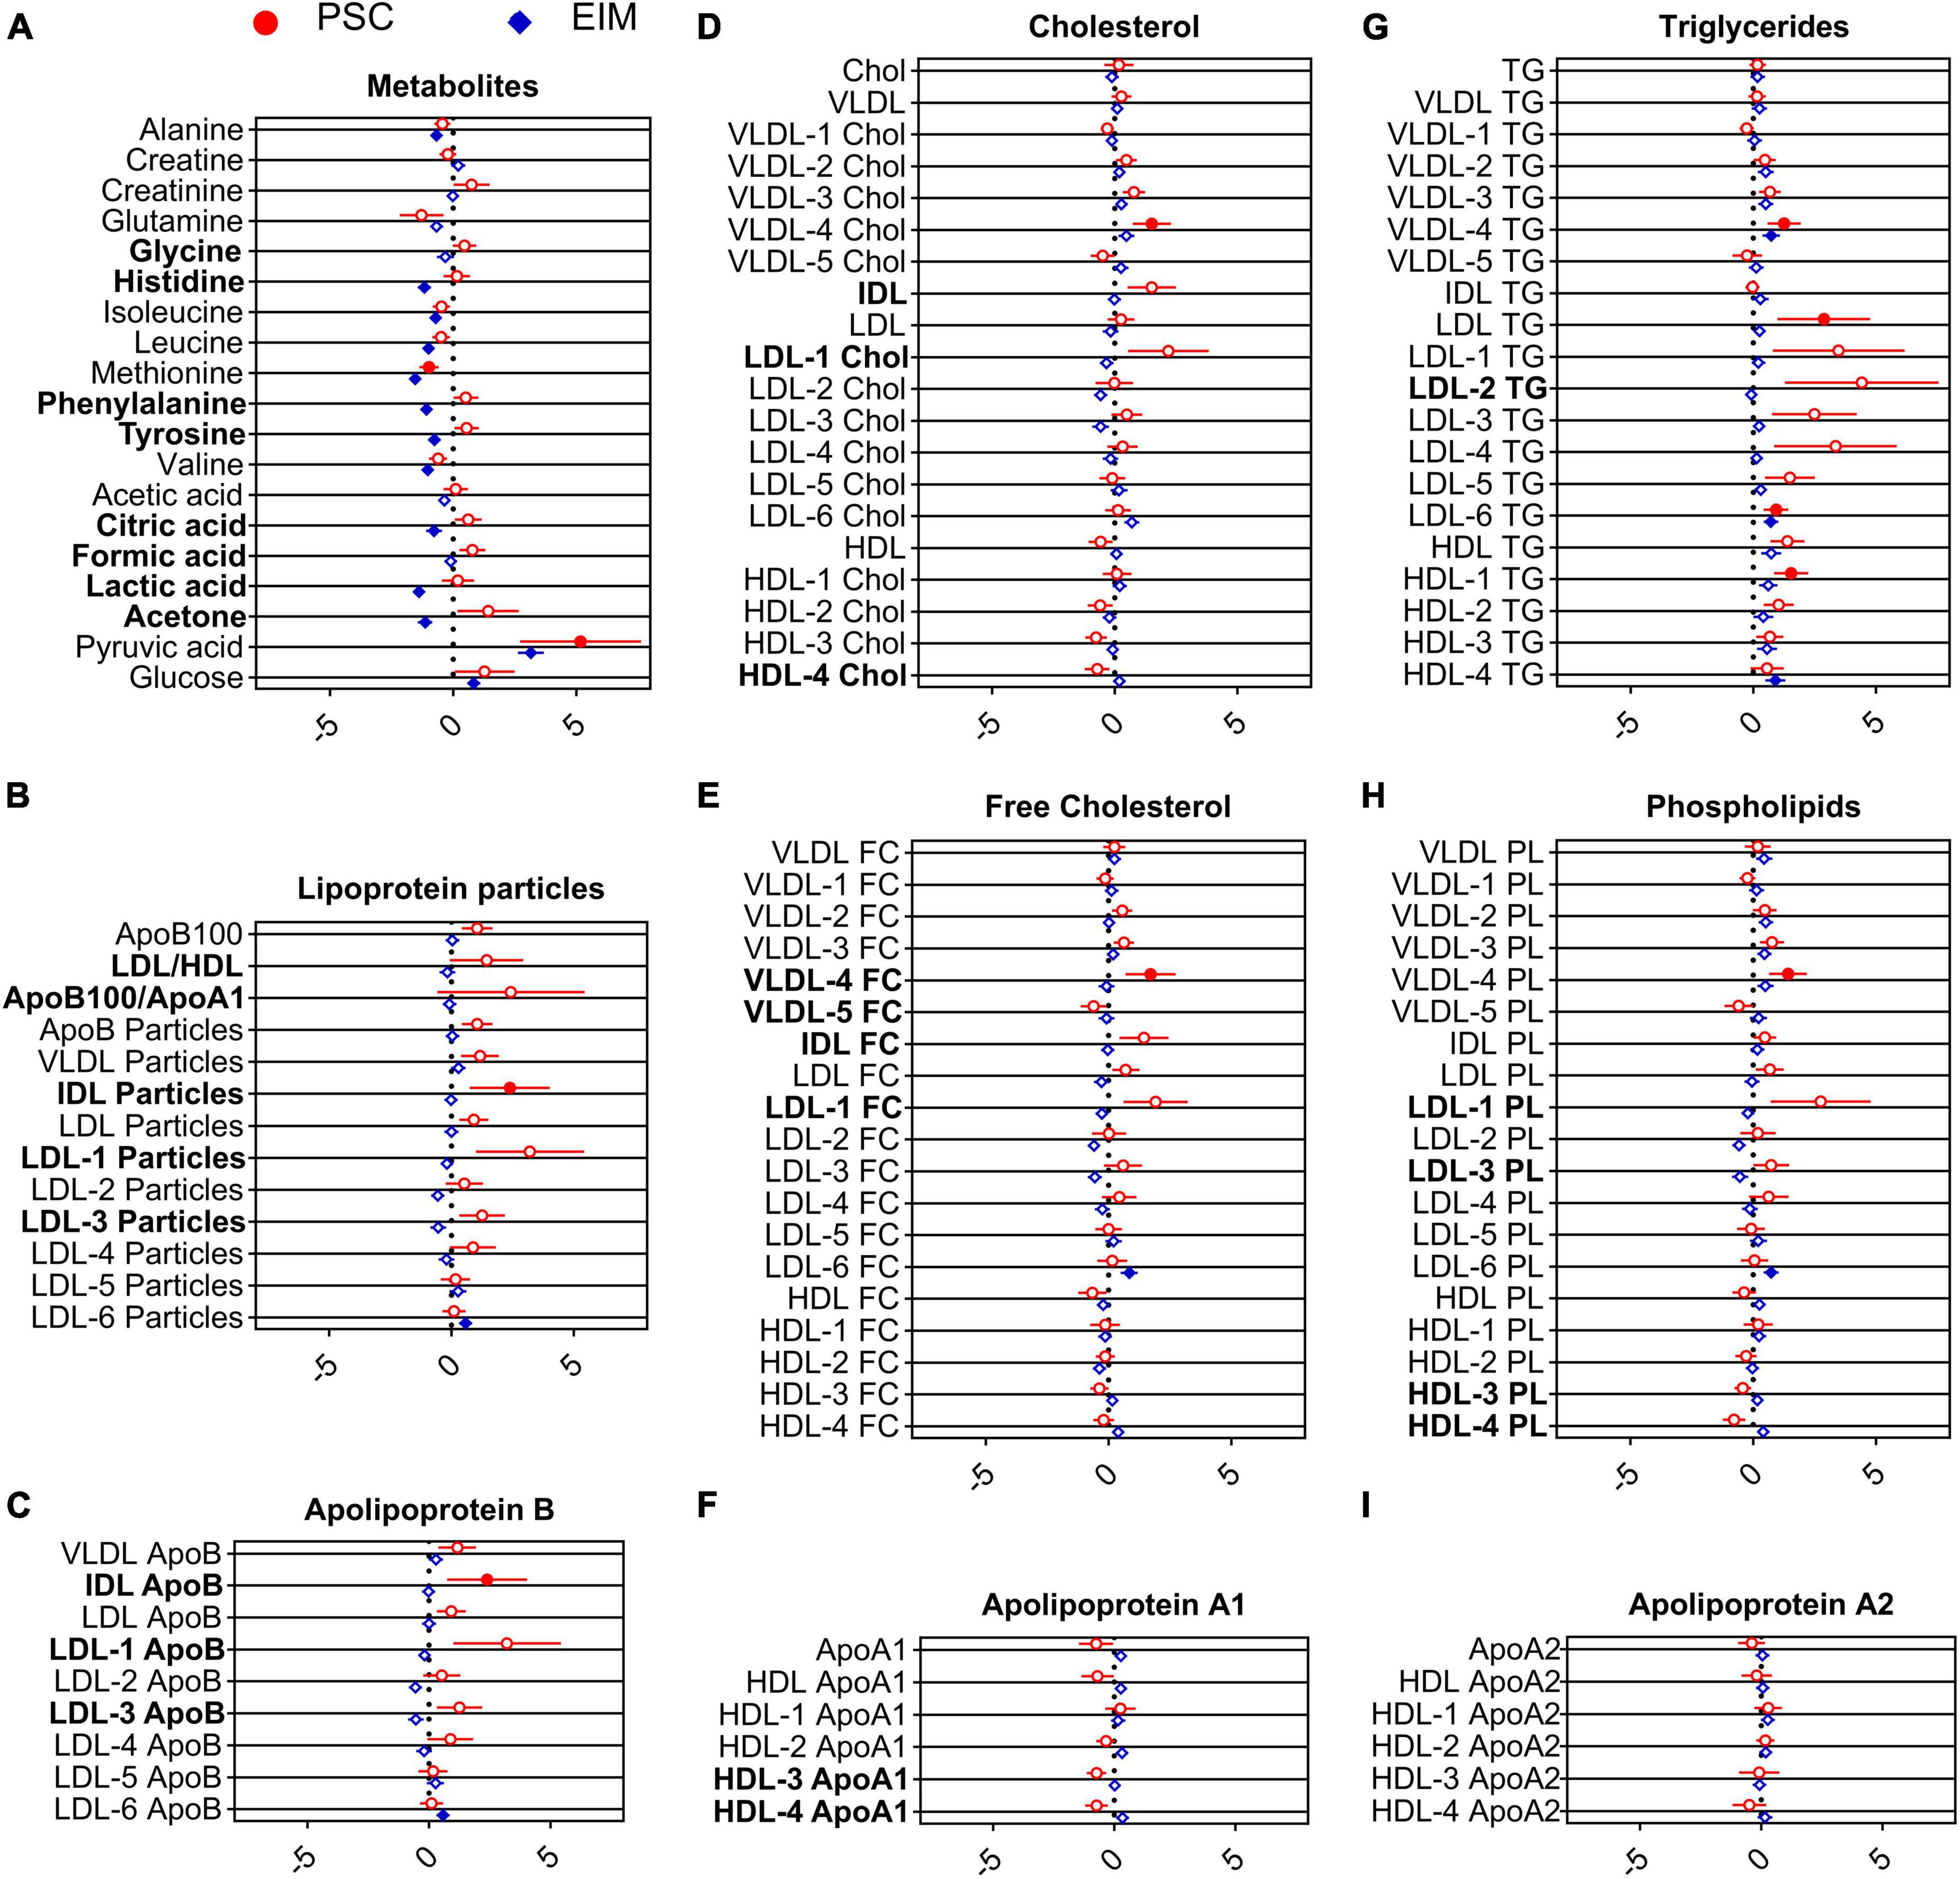
Figure 2. Adjusted forest plot demonstrate the differences of metabolites (A) and lipoproteins (B–I) from PSC (red, n = 33) and EIM (blue, n = 64) compared to HC normalized to the standard deviation of HC. The dashed vertical line indicates the reference values for HC. Statistically significant values of PSC and EIM compared with HC are shown by color-filled circles and squares, and parameters that significantly differed between PSC and EIM are written in bold letters.
Pyruvic acid concentrations were markedly enhanced in PSC compared to HC (Figure 2A), while the level of methionine was diminished in PSC compared to HC (Figure 2A).
Decreased levels of alanine, histidine, isoleucine, leucine, methionine, phenylalanine, tyrosine, valine, lactic acid, citric acid, and acetone in EIM compared with those in HC were observed (Figure 2A). Conversely, pyruvic acid and glucose levels were higher in EIM (Figure 2A) than in HC.
When comparing metabolites from patients with PSC with the EIM group, elevated serum concentrations of glycine, histidine, phenylalanine, tyrosine, citric acid, formic acid, lactic acid, and acetone were detected (Figure 2A).
Taken together, the most notable metabolic alteration in PSC was the significant increase in pyruvic acid concentration compared to HC (Figure 2A).
Figures 2B–I is additionally demonstrate serum concentrations of lipoprotein parameters. In particular, VLDL-4 lipids, including Chol levels, FC concentrations, TG, and PL, were significantly increased in PSC compared with HC. Moreover, elevated concentrations of LDL TG, LDL-6 TG, and HDL-1 TG were noted (Figure 2G). Significantly increased levels of IDL particles (Figure 2B), and accordingly, IDL ApoB (Figure 2C) were observed in PSC.
The lipidomic profile of patients with EIM differed from that of patients with HC by increased levels of LDL-6 particles as well as higher levels of ApoB, FC, TG, and PL (Figures 2B–H). VLDL-4 and HDL-4 showed increased TG levels (Figure 2G).
The ratio of LDL and HDL, the ratio of ApoB100 and ApoA1, and several subfractions of HDL (HDL-3 ApoA1, HDL-4 ApoA1, HDL-3 PL, and HDL-4 PL) were decreased in PSC compared with EIM (Figures 2B–H). Higher concentrations of LDL-1 particles, ApoB, Chol, FC, and PL and LDL-3 particles, ApoB, PL, and LDL-2 TG were detected in PSC compared with those in the EIM group (Figures 2B, E, G, H). In comparison to EIM, increased concentrations of IDL particles, Chol, and FC were observed (Figures 2B, D, E). In PSC, VLDL-4 showed higher FC levels and VLDL-5 showed lower FC levels than in EIM.
Notably, the concentrations of IDL-ApoB, IDL particles, and VLDL-4 were significantly altered in PSC compared with both, EIM and HC. These results contribute to a distinction of the PSC patients based on the lipidome profile.
In Figure 3, these lipoproteins with altered concentrations are depicted. Levels of IDL particles in patients with PSC significantly differed from EIM and HC. A strong increase in the concentration of ApoB in IDL could be observed in PSC in comparison with EIM but also in comparison with HC. Patients with PSC also displayed elevated FC concentrations in VLDL-4 subfraction.
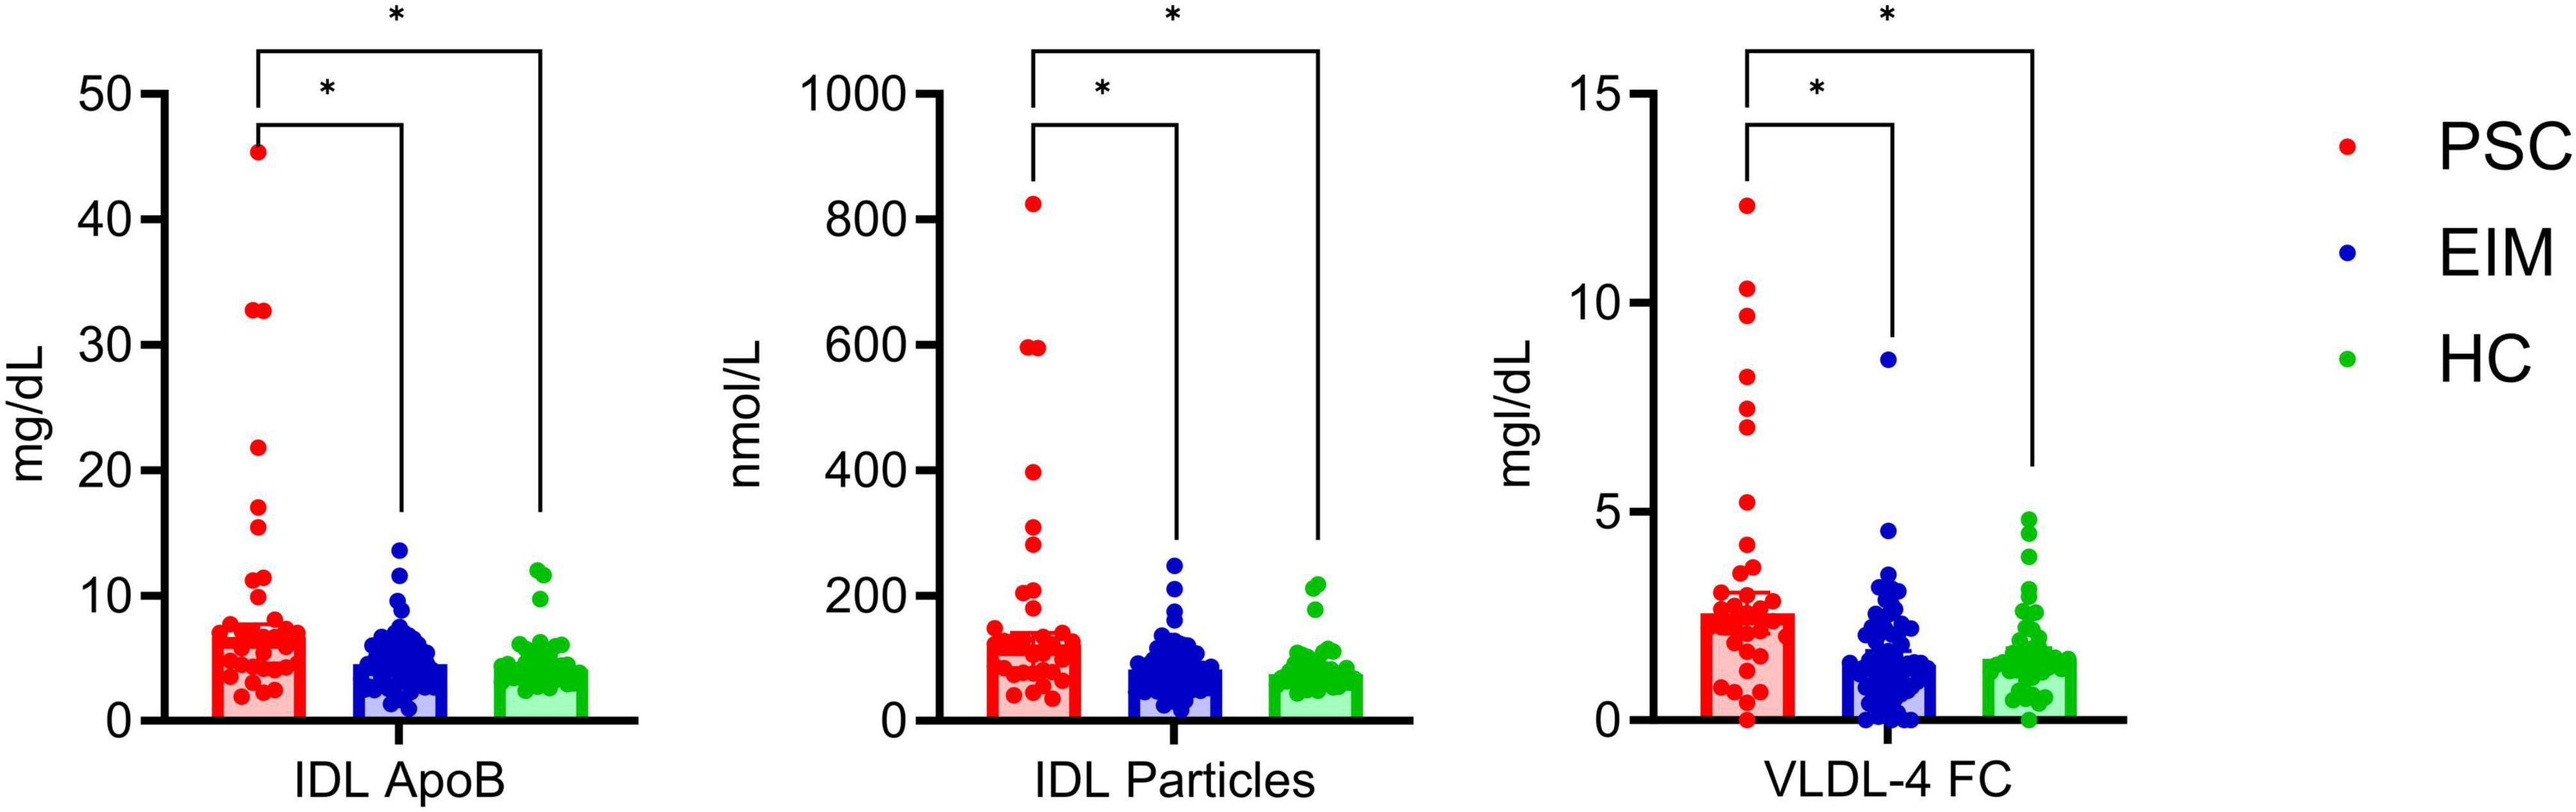
Figure 3. Detailed comparison of altered lipoprotein concentrations in PSC (red, n = 33), EIM (blue, n = 64), and HC (green, n = 40) given as median with 95% confidence interval. The levels of IDL ApoB, IDL particles, and VLDL-4 FC significantly differed between PSC and EIM as well as between PSC and HC. Significant differences determined using the unpaired multiple Mann-Whitney test (p < 0.05) with a false discovery rate of 1% using the method from Benjamini were highlighted (*).
To summarize the significant changes in PSC compared with HC from Figure 2 in detail, except of changes already mentioned in Figure 3, the relevant metabolites and lipoproteins are displayed in Figure 4.
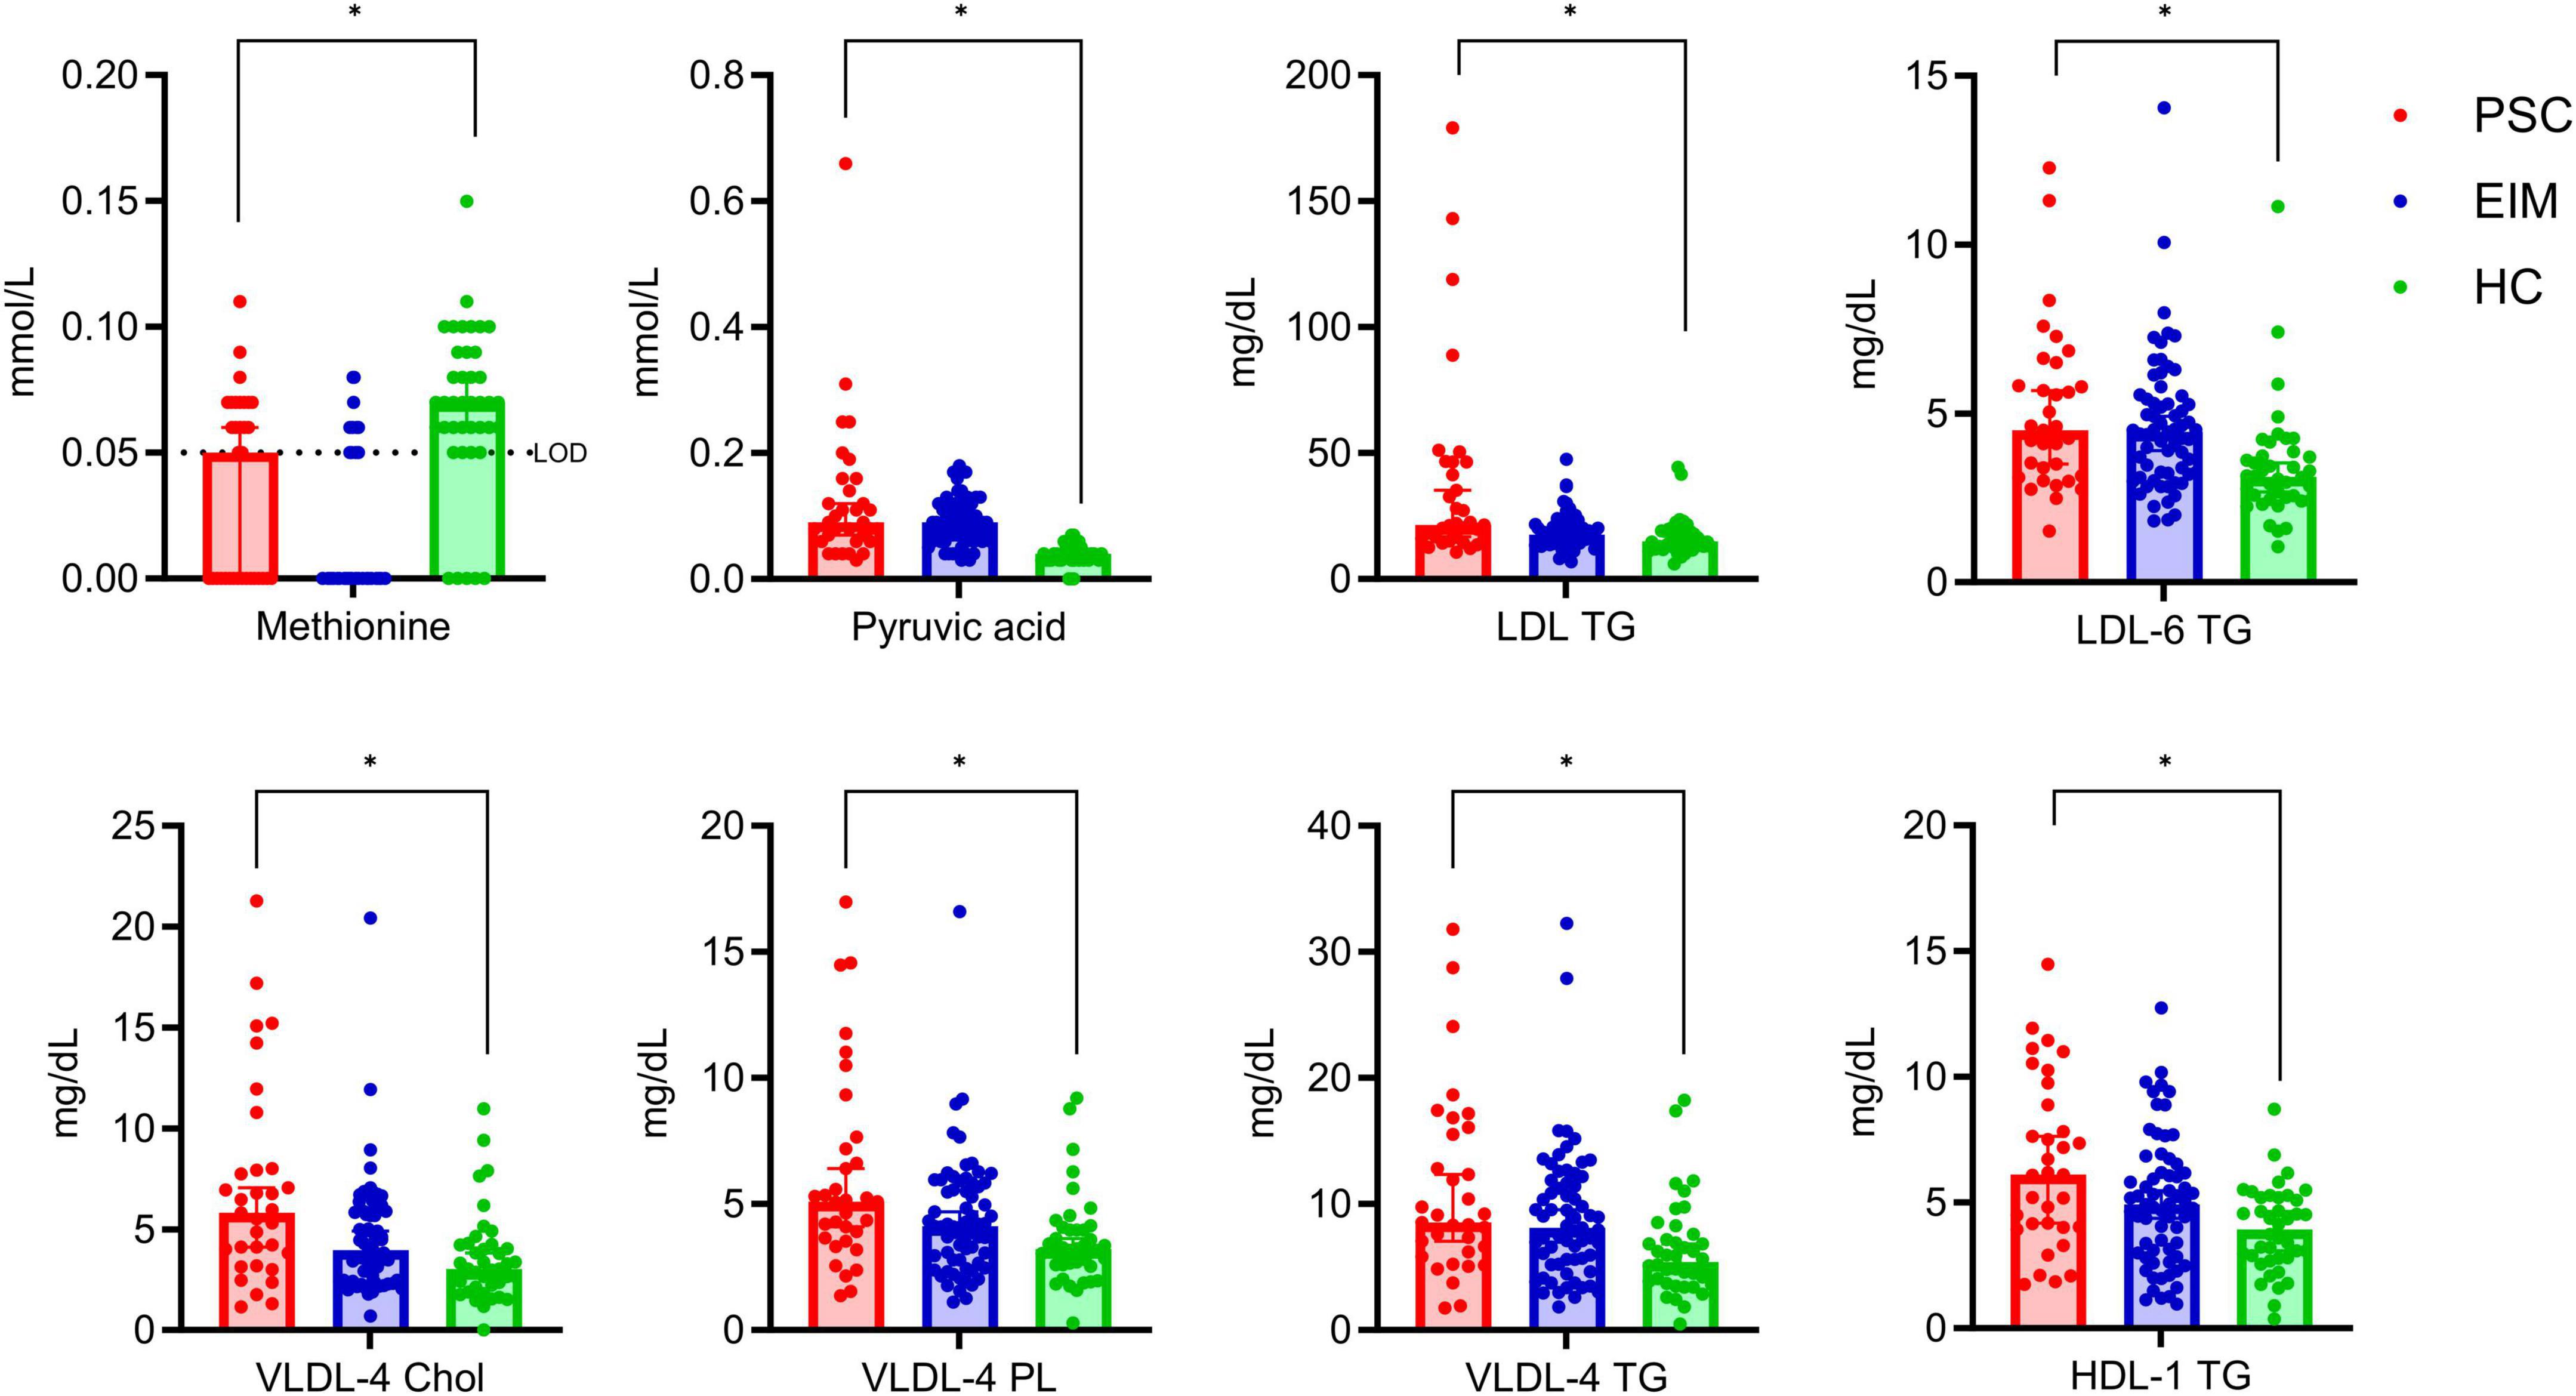
Figure 4. Detailed comparison of significant altered metabolites and lipoprotein subfractions between PSC (red, n = 33) and HC (green, n = 40), but not in comparison with EIM (blue, n = 64). Concentrations are given as median with 95% confidence interval. The lower limit of detection (LOD) for methionine is 0.05 mmol/L. Significant differences determined using the unpaired multiple Mann-Whitney test (p < 0.05) with a false discovery rate of 1% using the method from Benjamini were highlighted (*).
Altered metabolites include lower levels of methionine, and higher levels of pyruvic acid in PSC in comparison to HC (Figure 4). VLDL-4 bound lipids in Chol, PL, and TG are increased in PSC, as well as concentrations of LDL TG, LDL-6 TG, and HDL-1 TG (Figure 4). These results are specific to the alterations in PSC compared with HC in our study since none of the lipoproteins and metabolites in Figure 4 showed a significant change between PSC and EIM.
Pyruvic acid, the metabolite with the strongest differentiation in comparison between PSC and HC, is displayed separately with total concentrations (Figure 5). Figure 5 illustrates the ROC curve with corresponding AUC of 0.9068, which presents a good separation between the groups. The best Youden Index was calculated with 67.73 using a cut-off of 0.065 mmol/L pyruvic acid (Supplementary Table 2).
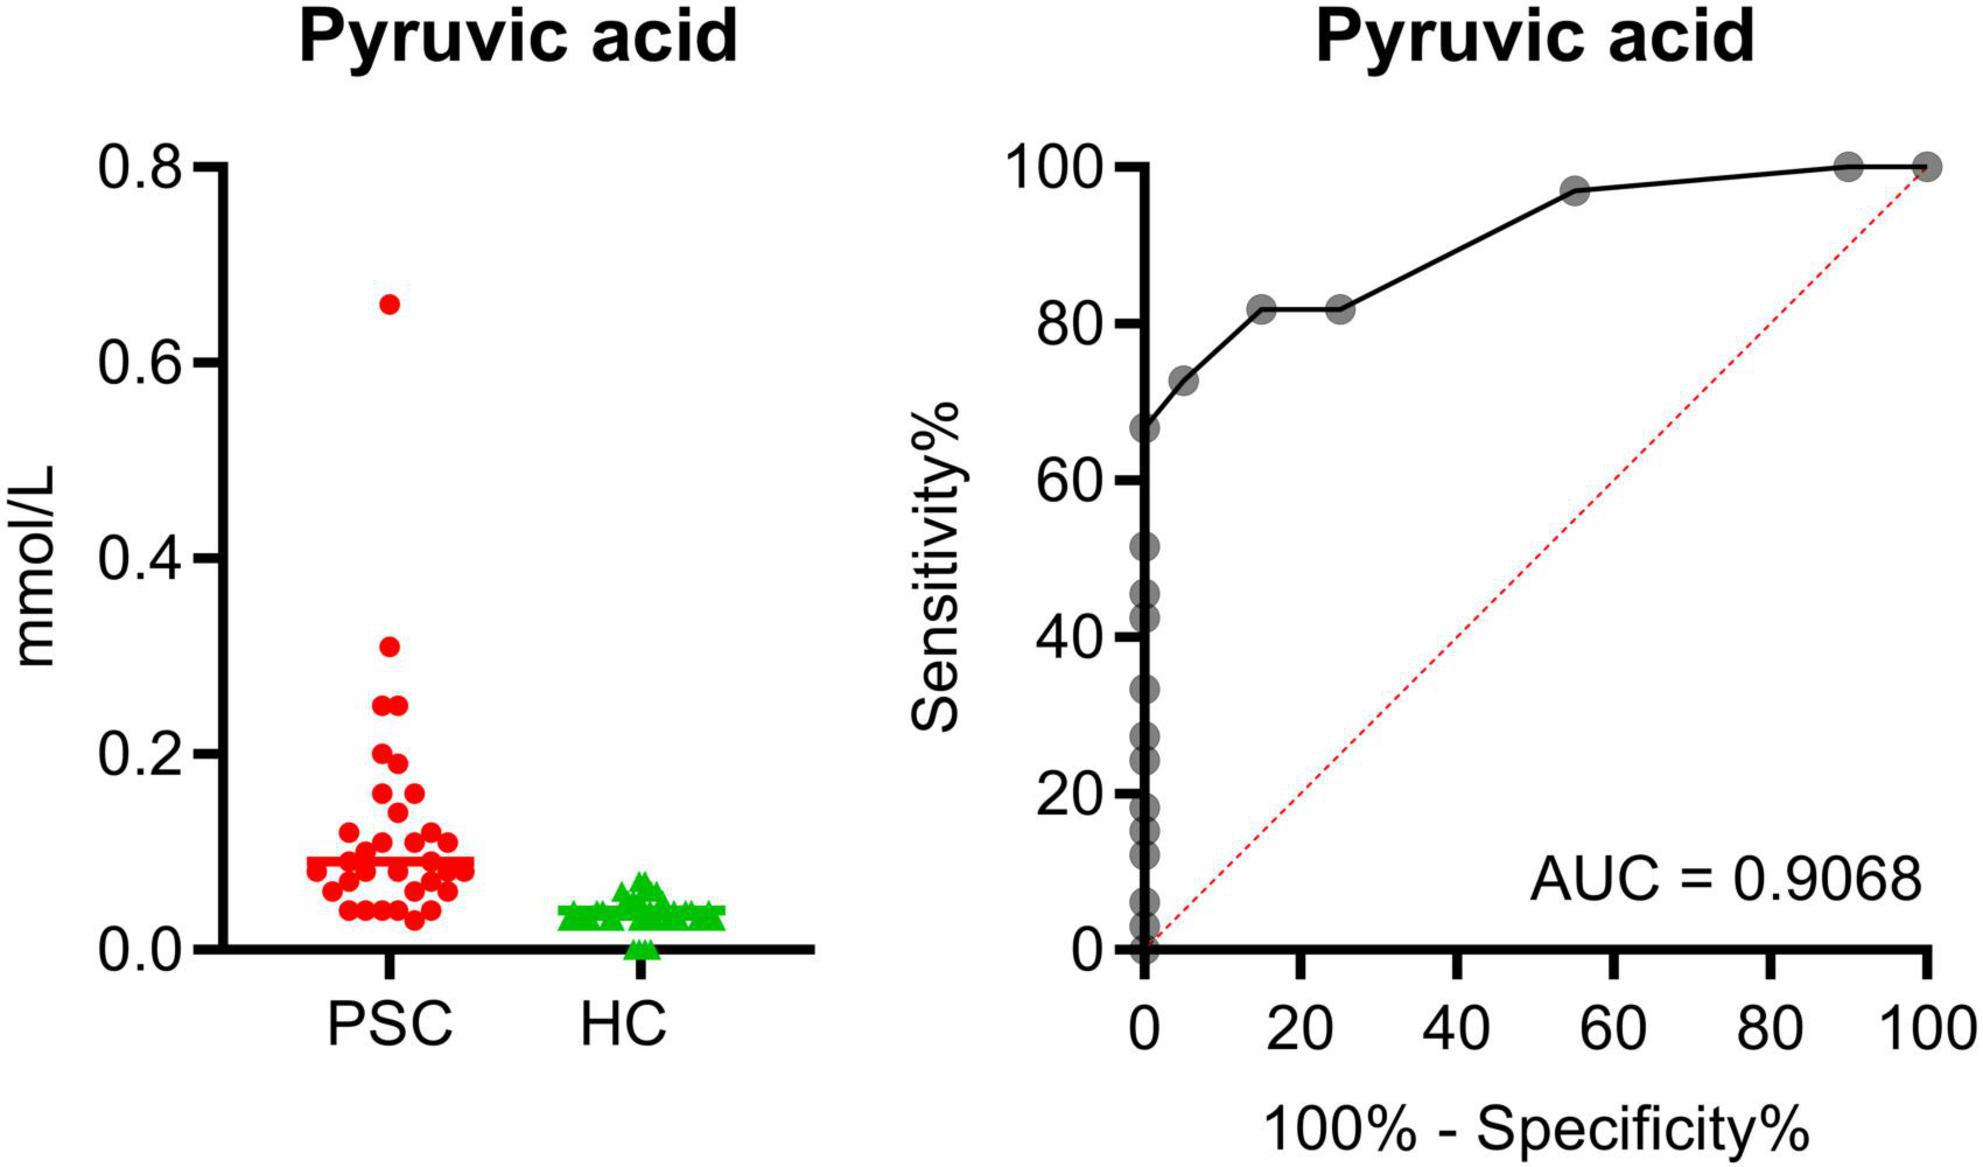
Figure 5. Total concentration of pyruvic acid in comparison of PSC (red, n = 33) and HC (green, n = 40). Display of the ROC with an AUC of 0.9068.
To advance the diagnosis of PSC our study utilizes serum metabolome and lipidome signatures to complement imaging techniques. Currently, the diagnosis of PSC is mainly based on image morphology, either by MRCP or by ERCP. However, due to the lack of PSC-specific biomarkers, highly sensitive diagnosis remains challenging. Our study aims to contribute to the diagnosis of PSC based on changes in the serum metabolome and lipidome to enable early diagnosis by fingerprints alongside the use of imaging techniques.
In about 70% of cases, PSC is associated with IBD (4). However, there is evidence that PSC is constantly associated with inflammation in the colon, which in some patients can only be mapped at the molecular level (35). This leads to the conclusion, that PSC can mostly be considered as a serve EIM of IBD. In addition, several studies have shown that the clinical phenotype of PSC-IBD patients differs from IBD patients without PSC (36, 37). For this reason, all PSC patients (n = 33) were included in one group, even those who did not have clinically confirmed IBD and we compared them with both HC and EIM patients including eye, skin, and joint involvement.
To the best of our knowledge, there is no NMR spectroscopic analysis that specifically addresses the distinction between PSC-IBD and IBD without PSC but other EIM by analyzing the serum metabolome and lipidome.
The main results of our serum metabolome comparisons of PSC and HC reveal a decrease in methionine and an increase in pyruvic acid.
Methionine is involved in various metabolic processes, including fat metabolism, endogenous antioxidation, and protein biosynthesis (38, 39). A decrease in methionine concentration, as observed in our study, may lead to an impairment of these important metabolic processes.
Inflammation increases aerobic glycolysis (40), resulting in higher levels of pyruvate. Increased pyruvic acid concentration was found in both PSC and EIM patients compared to HC, probably related to the higher glycolysis triggered by chronic inflammation.
Contrary to our study, lower levels of branched-chain amino acids (BBAAs) were found in plasma of patients with PSC (29, 41). However, our study could not confirm these results. There are several explanations for this such as dietary bias (see limitations).
Furthermore, we detected changes in serum concentrations of acetone, various amino acids (histidine, phenylalanine, tyrosine, and glycine), and organic acids (citric acid, lactic acid, and formic acid).
Increased concentrations of the ketone bodies 3-hydroxybutyrate and acetoacetate in patients with PSC compared to HC have been described by Bell et al. (11). In contrast, no significant change in the concentration of ketone bodies was found in PSC compared to HC in this study and in the study of Radford-Smith et al. (30). Of relevance, increased acetone levels of patients with PSC compared to EIM were noted.
In addition, we describe higher histidine concentrations in patients with PSC compared to patients with EIM. A low concentration of histidine in the plasma of patients with UC is related to a higher risk of acute relapse (42, 43). These results support the hypothesis that there is no dependence between IBD activity and PSC progression (44).
In patients with advanced liver cirrhosis, progressively elevated levels of aromatic amino acids (AAA) are observed (45, 46). Since six of eight PSC patients with cirrhosis were found to have only a mild form of cirrhosis (Table 2), a significant increase in AAA compared to HC was not expected. The study by ter Borg et al. (41) also noted no significant changes in AAA in PSC compared to HC, but trends toward higher phenylalanine and tyrosine levels, and trends toward reduced tryptophan levels. Considering the comparison of PSC and EIM, increased concentration of tyrosine and phenylalanine in PSC were noted. Lower levels of tyrosine in IBD patients compared to HC are previously described by Schicho et al. (47).
In our study, increased levels of citric acid in PSC patients compared to EIM were detected. We also noted changes between EIM and HC, which are consistent with the lower citrate levels in IBD patients compared to HC determined by Schicho et al. (47).
The concentrations of formic acid, lactic acid, and glycine were higher in PSC patients compared to patients with EIM. However, in previous studies, increased concentrations of these metabolites were noted in IBD patients compared to HC (47, 48).
Considering the lipidome profile of patients with PSC compared to HC as well as EIM, increased concentrations of IDL particles, IDL ApoB, and VLDL-4 FC were demonstrated. In addition, VLDL-4 bound lipids in Chol, TG, and PL were higher in PSC than in HC. Considering the changes in PSC compared to EIM, several LDL subclasses displayed an increase in ApoB, Chol, FC, TG, and PL. Furthermore, PSC patients showed increased LDL to HDL ratios, and accordingly a higher ApoB100 to ApoA1 ratio compared with EIM, which may present an atherogenic lipid profile of PSC patients (49, 50).
High concentrations of free fatty acids induce the formation of VLDL by enhancing hepatic triglyceride synthesis (51, 52), which in turn is metabolized to IDL particles (53). Thus, the results of Bell et al. (11), demonstrating increases in free fatty acids (linoleate, linolenate, palmitoleate, oleate) in the serum, are in agreement with the increased levels of IDL particles. Increased numbers of IDL particles appear to be atherogenic (54). Similarly, plasma samples of patients with non-insulin-dependent diabetes displayed elevated levels of IDL ApoB, which are potentially atherogenic (55). Concentrations of Chol, TG, ApoB, and ApoA1, are associated with coronary heart disease and carotid plaques (56). Large VLDL particles found in insulin-resistant patients with diabetes mellitus type 2 are associated with a higher risk of developing cardiovascular disease (57). In our study, the components of VLDL-4 particles were elevated. Notably, an association between small VLDL and atherosclerotic risk was reported before (58).
To sum up the distinct metabolome and lipidome profiles of PSC patients compared to IBD patients with other EIM detected by our study corroborate the importance of considering IBD with and without PSC as individual entities.
Furthermore, we studied the impact of the different therapies (UDCA, mesalazine, and biologicals) on the metabolome and lipidome of PSC patients. We did not observe significant changes, but trends to higher LDL-1 to LDL-3 TG levels under UDCA therapy compared to therapy with UDCA and biologicals (see Supplementary Figure 3 and Table 3). The attribution of metabolomic and lipidomic changes to a specific drug is generally difficult because of the inclusion of additional medication alongside UDCA, mesalazine, and biologicals. For a clear differentiation of the metabolome and lipidome among the specific therapies, a larger number of subjects will be required in the future.
We hypothesize that the specific metabolomic profile of PSC patients (Figures 1A, 2B) contribute to the promotion of a pro-inflammatory milieu in the intrahepatic cholangiocyte and portal triad (23–25). The proinflammatory milieu is the basis of structural damage to the bile ducts with stenosis and progressive liver parenchymal damage (59, 60). Genetic predisposition, epigenetic changes and also metabolomic changes are prerequisites for disease development and progression in PSC (60, 61).
In addition to the restricted number of patients, a further limitation of our study is that strict adherence to fasting state before blood sample collection in patients and HC could not always be guaranteed. This leads to a potential dietary bias in the data. Of note, we obtained clear results based on detailed clinical phenotyping, comparison with sex-, age-, and BMI-matched HC, and first-time comparison with EIM using NMR spectroscopy. The recruitment of sufficient study participants in a rare cohort as PSC is generally difficult. This is precisely why the significant differences revealed by our study are of particular clinical relevance. For this reason, there should be further research focusing on the distinct metabolome and lipidome of PSC patients.
A specific serum metabolome and lipidome profile was detected in PSC patients and it differs from patients with EIM and HC. So far, the diagnosis of PSC is mainly established based on various imaging techniques (12). Our data suggest that the detection of PSC can be improved by using NMR spectroscopy. In conclusion, our research enhances PSC diagnosis by integrating serum metabolome and lipidome signatures with traditional imaging techniques.
The raw data supporting the conclusions of this article are provided by the authors without undue reservation.
The studies involving humans were approved by the Ethics Committee of the University of Regensburg and the University of Lübeck (No. 21-2390-101 and No. 22-104). The studies were conducted in accordance with the local legislation and institutional requirements. The participants provided their written informed consent to participate in this study.
TF: Conceptualization, Data curation, Investigation, Resources, Validation, Writing – original draft. CB: Conceptualization, Project administration, Resources, Supervision, Writing – review & editing, Visualization. AK: Conceptualization, Resources, Writing – review & editing. TE: Data curation, Project administration, Resources, Writing – review & editing. JL: Data curation, Resources, Writing – review & editing. SSc: Writing – review & editing. SSo: Data curation, Resources, Writing – review & editing. SG: Data curation, Resources, Writing – review & editing. SZ: Writing – review & editing. MH: Data curation, Writing – review & editing. DB: Writing – review & editing. SK: Writing – review & editing. SW: Writing – review & editing. BF: Writing – review & editing. XH: Formal analysis, Writing – review & editing. MG: Formal analysis, Writing – review & editing. S-DP: Writing – review & editing. UG: Software, Validation, Writing – review & editing. JM: Writing – review & editing. CK: Writing – review & editing. KG: Writing – review & editing. MM: Conceptualization, Project administration, Supervision, Writing – review & editing. CS: Conceptualization, Methodology, Project administration, Supervision, Writing – review & editing. FS: Conceptualization, Formal analysis, Investigation, Methodology, Project administration, Software, Supervision, Validation, Visualization, Writing – review & editing. HT: Conceptualization, Investigation, Methodology, Project administration, Resources, Supervision, Validation, Writing – review & editing.
The author(s) declare that no financial support was received for the research, authorship, and/or publication of this article.
We thank directed to Elisabeta Sepsy, Maria Eichinger, and Doris Wohlgemuth for their support.
The authors declare that the research was conducted in the absence of any commercial or financial relationships that could be construed as a potential conflict of interest.
All claims expressed in this article are solely those of the authors and do not necessarily represent those of their affiliated organizations, or those of the publisher, the editors and the reviewers. Any product that may be evaluated in this article, or claim that may be made by its manufacturer, is not guaranteed or endorsed by the publisher.
The Supplementary Material for this article can be found online at: https://www.frontiersin.org/articles/10.3389/fmed.2024.1334865/full#supplementary-material
1. Thorpe ME, Scheuer PJ, Sherlock S. Primary sclerosing cholangitis, the biliary tree, and ulcerative colitis. Gut. (1967) 8:435–48.
2. Chapman RW, Arborgh BA, Rhodes JM, Summerfield JM, Dick R, Scheuer PJ, et al. Primary sclerosing cholangitis: a review of its clinical features, cholangiography, and hepatic histology. Gut. (1980) 21:870–7.
3. Dyson JK, Beuers U, Jones DE, Lohse AW, Hudson M. Primary sclerosing cholangitis. Lancet. (2018) 391:2547–59.
4. Weismüller TJ, Trivedi PJ, Bergquist A, Imam M, Lenzen H, Ponsioen CY, et al. Patient age, sex, and inflammatory bowel disease phenotype associate with course of primary sclerosing cholangitis. Gastroenterology. (2017) 152:1975–84.e8. doi: 10.1053/j.gastro.2017.02.038
5. Fevery J, Henckaerts L, van Oirbeek R, Vermeire S, Rutgeerts P, Nevens F, et al. Malignancies and mortality in 200 patients with primary sclerosering cholangitis: a long-term single-centre study. Liver Int. (2012) 32:214–22. doi: 10.1111/j.1478-3231.2011.02575.x
6. Hirschfield GM, Karlsen TH, Lindor KD, Adams DH. Primary sclerosing cholangitis. Lancet. (2013) 382:1587–99.
7. Burak K, Angulo P, Pasha TM, Egan K, Petz J, Lindor KD. Incidence and risk factors for cholangiocarcinoma in primary sclerosing cholangitis. Am J Gastroenterol. (2004) 99:523–6.
8. Zheng H, Jiang X. Increased risk of colorectal neoplasia in patients with primary sclerosing cholangitis and inflammatory bowel disease: a meta-analysis of 16 observational studies. Eur J Gastroenterol Hepatol. (2016) 28:383–90. doi: 10.1097/MEG.0000000000000576
9. Nielsen KR, Midjord J, Johannesen HL, Grønbæk H. A nationwide study of autoimmune liver diseases in the Faroe Islands: incidence, prevalence, and causes of death 2004 - 2021. Int J Circumpolar Health. (2023) 82:2221368. doi: 10.1080/22423982.2023.2221368
10. Fricker ZP, Lichtenstein D. Primary sclerosing cholangitis: a concise review of diagnosis and management. Dig Dis Sci (2019) 64:632–42.
11. Bell LN, Wulff J, Comerford M, Vuppalanchi R, Chalasani N. Serum metabolic signatures of primary biliary cirrhosis and primary sclerosing cholangitis. Liver Int. (2015) 35:263–74.
12. Chapman MH, Thorburn D, Hirschfield GM, Webster GG, Rushbrook SM, Alexander G, et al. British society of gastroenterology and UK-PSC guidelines for the diagnosis and management of primary sclerosing cholangitis. Gut. (2019) 68:1356–78.
13. Angulo P, Pearce DH, Johnson CD, Henry JJ, LaRusso NF, Petersen BT, et al. Magnetic resonance cholangiography in patients with biliary disease: its role in primary sclerosing cholangitis. J Hepatol. (2000) 33:520–7.
14. Tornai D, Ven PL, Lakatos PL, Papp M. Serological biomarkers for management of primary sclerosing cholangitis. World J Gastroenterol. (2022) 28:2291–301.
15. Jendrek ST, Gotthardt D, Nitzsche T, Widmann L, Korf T, Michaels MA, et al. Anti-GP2 IgA autoantibodies are associated with poor survival and cholangiocarcinoma in primary sclerosing cholangitis. Gut. (2017) 66:137–44.
16. Jiang X, Karlsen TH. Genetics of primary sclerosing cholangitis and pathophysiological implications. Nat Rev Gastroenterol Hepatol. (2017) 14:279–95.
17. Chapman RW, Varghese Z, Gaul R, Patel G, Kokinon N, Sherlock S. Association of primary sclerosing cholangitis with HLA-B8. Gut. (1983) 24:38–41.
18. Henriksen EK, Viken MK, Wittig M, Holm K, Folseraas T, Mucha S, et al. HLA haplotypes in primary sclerosing cholangitis patients of admixed and non-European ancestry. HLA. (2017) 90:228–33. doi: 10.1111/tan.13076
19. Ellinghaus D, Folseraas T, Holm K, Ellinghaus E, Melum E, Balschun T, et al. Genome-wide association analysis in primary sclerosing cholangitis and ulcerative colitis identifies risk loci at GPR35 and TCF4. Hepatology. (2013) 58:1074–83. doi: 10.1002/hep.25977
20. Janse M, Lamberts LE, Franke L, Raychaudhuri S, Ellinghaus E, Muri Boberg K, et al. Three ulcerative colitis susceptibility loci are associated with primary sclerosing cholangitis and indicate a role for IL2, REL, and CARD9. Hepatology. (2011) 53:1977–85. doi: 10.1002/hep.24307
21. Zecher BF, Ellinghaus D, Schloer S, Niehrs A, Padoan B, Baumdick ME, et al. HLA-DPA1*02:01~B1*01:01 is a risk haplotype for primary sclerosing cholangitis mediating activation of NKp44+ NK cells. Gut. (2024) 73:325–37. doi: 10.1136/gutjnl-2023-329524
22. Reich M, Spomer L, Klindt C, Fuchs K, Stindt J, Deutschmann K, et al. Downregulation of TGR5 (GPBAR1) in biliary epithelial cells contributes to the pathogenesis of sclerosing cholangitis. J Hepatol. (2021) 75:634–46.
23. Landi A, Weismuller TJ, Lankisch TO, Santer DM, Tyrrell DL, Manns MP, et al. Differential serum levels of eosinophilic eotaxins in primary sclerosing cholangitis, primary biliary cirrhosis, and autoimmune hepatitis. J Interferon Cytokine Res. (2014) 34:204–14. doi: 10.1089/jir.2013.0075
24. Dold L, Frank L, Lutz P, Kaczmarek DJ, Krämer B, Nattermann J, et al. IL-6-dependent STAT3 activation and induction of proinflammatory cytokines in primary sclerosing cholangitis. Clin Transl Gastroenterol. (2023) 14:e00603. doi: 10.14309/ctg.0000000000000603
25. Katt J, Schwinge D, Schoknecht T, Quaas A, Sobottka I, Burandt E, et al. Increased T helper type 17 response to pathogen stimulation in patients with primary sclerosing cholangitis. Hepatology. (2013) 58:1084–93. doi: 10.1002/hep.26447
26. Park J, Kim J, Kim S, Jung J, Jang M, Park S, et al. Primary biliary cholangitis and primary sclerosing cholangitis: current knowledge of pathogenesis and therapeutics. Biomedicines. (2022) 10:1288.
27. Gameron RG, Blendis LM, Neuman MG. Accumulation of macrophages in primary sclerosing cholangitis. Clin Biochem. (2001) 34:195–201.
28. Tietz-Bogert PS, Kim M, Cheung A, Tabibian JH, Heimbach JK, Rosen CB, et al. Metabolomic profiling of portal blood and bile reveals metabolic signatures of primary sclerosing cholangitis. Int J Mol Sci. (2018) 19:3188. doi: 10.3390/ijms19103188
29. Kummen M, Thingholm LB, Rühlemann MC, Holm K, Hansen SH, Moitinho-Silva L, et al. Altered gut microbial metabolism of essential nutrients in primary sclerosing cholangitis. Gastroenterology (2021) 160:1784–98.e0. doi: 10.1053/j.gastro.2020.12.058
30. Radford-Smith DE, Selvaraj EA, Peters R, Orrell M, Bolon J, Anthony DC, et al. A novel serum metabolomic panel distinguishes IgG4-related sclerosing cholangitis from primary sclerosing cholangitis. Liver Int. (2022) 42:1344–54. doi: 10.1111/liv.15192
31. Le Gouellec A, Plazy C, Toussaint B. What clinical metabolomics will bring to the medicine of tomorrow. Front Anal Sci. (2023) 3:1142606. doi: 10.3389/frans.2023.1142606
32. de Vries E, Beuers U, Ponsioen CY. Biomarkers for disease progression of primary sclerosing cholangitis. Curr Opin Gastroenterol. (2015) 31:239–46.
33. Banales JM, Iñarrairaegui M, Arbelaiz A, Milkiewicz P, Muntané J, Muñoz-Bellvis L, et al. Serum metabolites as diagnostic biomarkers for cholangiocarcinoma, hepatocellular carcinoma, and primary sclerosing cholangitis. Hepatology. (2019) 70:547–62.
34. Dona AC, Jiménez B, Schäfer H, Humpfer E, Spraul M, Lewis MR, et al. Precision high-throughput proton NMR spectroscopy of human urine, serum, and plasma for large-scale metabolic phenotyping. Anal Chem. (2014) 86:9887–94. doi: 10.1021/ac5025039
35. Wittek A, Steglich B, Casar C, Seiz O, Huber P, Ehlken H, et al. A gradient of intestinal inflammation in primary sclerosing cholangitis. Inflamm Bowel Dis. (2023). [Epub ahead of print].
36. Fraga M, Fournier N, Safroneeva E, Pittet V, Godat S, Straumann A, et al. Primary sclerosing cholangitis in the Swiss Inflammatory Bowel Disease Cohort Study: prevalence, risk factors, and long-term follow-up. Eur J Gastroenterol Hepatol. (2017) 29:91–7. doi: 10.1097/MEG.0000000000000747
37. Boonstra K, van Erpecum K, van Nieuwkerk KM, Drenth JP, Poen AC, Witteman BJ, et al. Primary sclerosing cholangitis is associated with a distinct phenotype of inflammatory bowel disease. Inflamm Bowel Dis. (2012) 18:2270–6.
38. Martínez Y, Li X, Liu G, Bin P, Yan W, Más D, et al. The role of methionine on metabolism, oxidative stress, and diseases. Amino Acids. (2017) 49:2091–8.
39. Parkhitko AA, Jouandin P, Mohr SE, Perrimon N. Methionine metabolism and methyltransferases in the regulation of aging and lifespan extension across species. Aging Cell. (2019) 18:e13034. doi: 10.1111/acel.13034
40. Pålsson-McDermott EM, O’Neill LA. Targeting immunometabolism as an anti-inflammatory strategy. Cell Res. (2020) 30:300–14.
41. ter Borg PC, Fekkes D, Vrolijk JM, van Buuren HR. The relation between plasma tyrosine concentration and fatigue in primary biliary cirrhosis and primary sclerosing cholangitis. BMC Gastroenterol. (2005) 5:11. doi: 10.1186/1471-230X-5-11
42. Hisamatsu T, Ono N, Imaizumi A, Mori M, Suzuki H, Uo M, et al. Decreased plasma histidine level predicts risk of relapse in patients with ulcerative colitis in remission. PLoS One. (2015) 10:e0140716. doi: 10.1371/journal.pone.0140716
43. Probert F, Walsh A, Jagielowicz M, Yeo T, Claridge TD, Simmons A, et al. Plasma nuclear magnetic resonance metabolomics discriminates between high and low endoscopic activity and predicts progression in a prospective cohort of patients with ulcerative colitis. J Crohns Colitis. (2018) 12:1326–37. doi: 10.1093/ecco-jcc/jjy101
44. Malik TF, Aurelio DM. Extraintestinal Manifestations of Inflammatory Bowel Disease. Treasure Island, FL: StatPearls Publishing (2023).
45. Holecek M. Ammonia and amino acid profiles in liver cirrhosis: effects of variables leading to hepatic encephalopathy. Nutrition. (2015) 31:14–20. doi: 10.1016/j.nut.2014.03.016
46. Tajiri K, Shimizu Y. Branched-chain amino acids in liver diseases. Transl Gastroenterol Hepatol. (2018) 3:47.
47. Schicho R, Shaykhutdinov R, Ngo J, Nazyrova A, Schneider C, Panaccione R, et al. Quantitative metabolomic profiling of serum, plasma, and urine by (1)H NMR spectroscopy discriminates between patients with inflammatory bowel disease and healthy individuals. J Proteome Res. (2012) 11:3344–57. doi: 10.1021/pr300139q
48. Williams HR, Willsmore JD, Cox IJ, Walker DG, Cobbold JF, Taylor-Robinson SD, et al. Serum metabolic profiling in inflammatory bowel disease. Dig Dis Sci. (2012) 57:2157–65.
49. Kappelle PJ, Gansevoort RT, Hillege JL, Wolffenbuttel BH, Dullaart RP. Apolipoprotein B/A-I and total cholesterol/high-density lipoprotein cholesterol ratios both predict cardiovascular events in the general population independently of nonlipid risk factors, albuminuria and C-reactive protein. J Intern Med. (2011) 269:232–42. doi: 10.1111/j.1365-2796.2010.02323.x
50. Millán J, Pintó X, Muñoz A, Zúñiga M, Rubiés-Prat J, Pallardo L, et al. Lipoprotein ratios: physiological significance and clinical usefulness in cardiovascular prevention. Vasc Health Risk Manag. (2009) 5:757–65.
51. Havel RJ, Kane JP, Balasse EO, Segel N, Basso LV. Splanchnic metabolism of free fatty acids and production of triglycerides of very low density lipoproteins. J Clin Investig. (1970) 49:2017–35.
52. Kissebah AH, Alfarsi S, Adams PW, Wynn V. Role of insulin resistance in adipose tissue and liver in the pathogenesis of endogenous hypertriglyceridaemia in man. Diabetologia. (1976) 12:563–71. doi: 10.1007/BF01220632
54. Liu T, Zhao D, Wang M, Sun J, Liu J, Li J, et al. Association between intermediate-density lipoprotein particles and the progression of carotid atherosclerosis: a Community-Based Cohort Study. J Atheroscler Thromb. (2023) 30:1644–60.
55. Duvillard L, Pont F, Florentin E, Galland-Jos C, Gambert P, Vergès B. Metabolic abnormalities of apolipoprotein B-containing lipoproteins in non-insulin-dependent diabetes: a stable isotope kinetic study. Eur J Clin Investig. (2000) 30:685–94.
56. Schmidt AF, Joshi R, Gordillo-Marañón M, Drenos F, Charoen P, Giambartolomei C, et al. Biomedical consequences of elevated cholesterol-containing lipoproteins and apolipoproteins on cardiovascular and non-cardiovascular outcomes. Commun Med. (2023) 3:9. doi: 10.1038/s43856-022-00234-0
57. Garvey WT, Kwon S, Zheng D, Shaughnessy S, Wallace P, Hutto A, et al. Effects of insulin resistance and type 2 diabetes on lipoprotein subclass particle size and concentration determined by nuclear magnetic resonance. Diabetes. (2003) 52:453–62.
58. Nordestgaard BG, Tybjaerg-Hansen A. IDL, VLDL, chylomicrons and atherosclerosis. Eur J Epidemiol. (1992) 8 Suppl. 1:92–8.
59. Rabiee A, Silveira MG. Primary sclerosing cholangitis. Transl Gastroenterol Hepatol. (2021) 6:29.
60. Karlsen TH, Folseraas T, Thorburn D, Vesterhus M. Primary sclerosing cholangitis - a comprehensive review. J Hepatol. (2017) 67:1298–323.
Keywords: PSC, IBD, NMR, metabolome, lipidome
Citation: Fererberger T, Buechler C, Kandulski A, Elger T, Loibl J, Schmid S, Sommersberger S, Gunawan S, Zundler S, Huss M, Bettenworth D, Kempa S, Weidlich S, Föh B, Huang X, Grzegorzek M, Derer-Petersen S, Günther UL, Marquardt JU, Kunst C, Gülow K, Müller M, Sina C, Schmelter F and Tews HC (2024) Distinct metabolomic and lipidomic profiles in serum samples of patients with primary sclerosing cholangitis. Front. Med. 11:1334865. doi: 10.3389/fmed.2024.1334865
Received: 07 November 2023; Accepted: 22 January 2024;
Published: 04 June 2024.
Edited by:
Ana Sandoval-Rodriguez, University of Guadalajara, MexicoReviewed by:
Phillipp Hartmann, University of California, San Diego, United StatesCopyright © 2024 Fererberger, Buechler, Kandulski, Elger, Loibl, Schmid, Sommersberger, Gunawan, Zundler, Huss, Bettenworth, Kempa, Weidlich, Föh, Huang, Grzegorzek, Derer-Petersen, Günther, Marquardt, Kunst, Gülow, Müller, Sina, Schmelter and Tews. This is an open-access article distributed under the terms of the Creative Commons Attribution License (CC BY). The use, distribution or reproduction in other forums is permitted, provided the original author(s) and the copyright owner(s) are credited and that the original publication in this journal is cited, in accordance with accepted academic practice. No use, distribution or reproduction is permitted which does not comply with these terms.
*Correspondence: Hauke Christian Tews, aGF1a2UudGV3c0B1a3IuZGU=
†These authors share senior authorship
Disclaimer: All claims expressed in this article are solely those of the authors and do not necessarily represent those of their affiliated organizations, or those of the publisher, the editors and the reviewers. Any product that may be evaluated in this article or claim that may be made by its manufacturer is not guaranteed or endorsed by the publisher.
Research integrity at Frontiers
Learn more about the work of our research integrity team to safeguard the quality of each article we publish.