- 1Department of Mechanical Engineering, Pan Atlantic University, Lekki, Nigeria
- 2Department of Computer Engineering, Bells University of Technology, Ota, Nigeria
- 3Department of Mechanical Engineering, Bells University of Technology, Ota, Nigeria
Maintenance is crucial for ensuring equipment reliability and minimizing downtime while managing associated costs. This study investigates a data-driven approach to predicting machine faults using Response Surface Methodology (RSM) and Adaptive Neuro-Fuzzy Inference System (ANFIS). RSM was employed to develop a mathematical model to analyze how operational parameters such as pressure, voltage, current, vibration, and temperature affect fault occurrence. Data were collected at three levels for each parameter using a central composite design. The model identified that faults peaked at a pressure of 28.38 N/m2, an operating voltage of 431.77 V, current consumption of 12.54 A, machine vibration of 47.17 Hz, and temperature of 25°C, with a maximum of 25 faults observed. Conversely, the lowest fault detection occurred at a pressure of 29.42 N/m2, an operating voltage of 441.04 V, current consumption of 12.04 A, machine vibration of 49.46 Hz, and temperature of 46.5°C. A strong correlation was found between these parameters and machine faults, with the model achieving high accuracy (R2 = 98.22%) and statistical significance (p-value <0.05), demonstrating its reliability in predicting faults. The study also compared RSM with ANFIS for fault detection and process optimization in the beverage industry. While RSM effectively optimized parameter relationships, ANFIS, with its adaptive learning capabilities, provided superior fault prediction accuracy. This comparative analysis highlighted the strengths of both methods and suggested that integrating them could enhance predictive maintenance strategies. The findings offer valuable insights for industry practitioners, recommending a combined approach to improve fault detection, optimize production processes, and enhance operational efficiency.
1 Introduction
The manufacturing industry is essential on a global scale for both developing and developed nations. For developing countries, it provides a pathway from subsistence agriculture to higher income and better living conditions. In developed countries, it remains a critical driver of innovation and competitiveness, significantly contributing to R&D, exports, and productivity. Manufacturing production, as measured by gross value added, continues to increase, with advanced nations growing at about 2.7 percent annually and major emerging economies expanding at 7.4 percent (Mckinsey Global Institute).
The relevance of the manufacturing sector cannot be overemphasized; it makes for sustainable growth and development of any economy. The manufacturing sector matters in various ways and the long-term development prospects of Africa might be at risk if more robust growth of these sectors were not being achieved (Okokpujie et al., 2024). The manufacturing sector which forms part of the industrial sector functions to turn raw materials into finished consumer goods; intermediate goods or producer goods. It provides employment opportunities, boosts agriculture, diversifies the economy, and increases foreign exchange in an economy. In the modern economy, it does not only act as a catalyst but also serves many dynamic benefits required for economic transformation (Amassoma, 2011). Sequel to the importance of the manufacturing industry and to overcome its challenges, every nation is striving hard to develop the sector. In this era of technological advancement, manufacturing sector development implies the application of modern technology, machinery, and equipment for the production of goods and services. Modern manufacturing processes are therefore associated with high technological innovations in recent times. Thus, the generic machines and types of equipment used in production require some form of maintenance to function properly for a longer time horizon (Paolanti et al., 2018; Lel, 2020).
Maintenance practices in the manufacturing industry may be classified into Corrective Maintenance, Preventive Maintenance, Condition-based Maintenance (CBM), and Predictive Maintenance (Yoo, et al., 2019; Susto et al., 2015a; Ahmad and Kamaruddin, 2012). Predictive maintenance has lately been employed in a variety of fields of study as one of the most promising tactics among other maintenance strategies that can attain features like a decrease in equipment failure rates, equipment condition enhancement extension in equipment life, enhanced diagnosis of imminent failures, enabler of pre-failure interventions and minimization of maintenance costs (Carvalho, et al., 2019; Kumar, et al., 2019; Yao et al., 2022).
Machine learning-based predictive maintenance uses information about the visible results of its actions to translate them into planning (Jeff and Sandra, 2004). These allow the agent to operate with intention in its environment. It is also one of the key Industry 4.0 breakthroughs that significantly improve machine availability by reducing machine failure and enabling just-in-time maintenance (Zhai et al., 2021). The goal of predictive maintenance is to capture, not only process data and parameters, but also physical health elements of the equipment, machine, or component such as pressure, vibration, temperature, viscosity, acoustics, flow rate data, and others. The data gathered is now frequently used for defect detection, early fault detection, equipment health evaluation, and forecasting future equipment status (Amruthnath and Gupta, 2018). Machine learning is used in predictive maintenance to learn from historical data and assess failure patterns using live data. Predictive Maintenance with Machine Learning aims for best resource use and predicts failures before they happen because conservative practices waste resources. As a result, Predictive Maintenance tries to establish a happy medium between the two extremes (Bousdekis et al., 2021).
Manufacturing equipment is constantly fitted with numerous monitoring sensors, whose data allow a thorough picture of the equipment’s condition to be derived. Predictive maintenance methods employ this information to predict the occurrence of potential faults in advance, thus lowering production and maintenance costs significantly. To detect patterns in the data that are indicative of potential defects, data-driven predictive maintenance requires the use of machine learning to sense data collection. Manufacturing nowadays uses data-driven operations across the business value chains to grow several models in manufacturing, out of which emerged smart manufacturing, failure prediction, and maintenance optimization (Tiago et al., 2022).
Arising from the above contentious, the pertinent question is “What are the available ML-based predictive maintenance models in the manufacturing model of manufacturing industry? To answer the question, the current study seeks to provide the recent advancements of machine learning techniques applied to predictive maintenance models in the manufacturing industry by using an ML-based predictive maintenance model to determine its impact on the production process and maintenance of a selected manufacturing company in Ogun State.
There are two major categories of machine learning: supervised and unsupervised learning. In supervised learning, the inputs and outputs are known and an algorithm is designed to figure out how to get to the desired results. The algorithm examines the data, looks for trends, and learns from its findings. In supervised machine learning, labelled examples are used to train algorithms. The algorithm is guided by the training data set to get the desired result. This process is repeated until the algorithm reaches a high degree of precision (Wakefield, 2018). The supervisor may be a person who checks the output for accuracy. Large data sets are necessary for labelled training data sets for greater accuracy of findings. Regression, classification, and forecasting are three types of supervised machine learning (Nawrocki et al., 2018).
In regression, the machine learning algorithm calculates the link and interdependence between several variables. It is beneficial to predict the remaining real-time life of the equipment in real-time (Zhicai et al., 2014). In classification, the machine learning system organizes input data into two categories: normal system and abnormal system. In forecasting, future forecasts are based on historical and current data and help analyze trends. In Unsupervised learning, the algorithm looks for patterns in the data and analyses it to discover correlations and linkages. It organizes the data in some way so that its structure can be described. This could imply putting the data into clusters or arranging it more logically. As it evaluates additional data, its ability to make decisions based on that data is improved and refined (Wakefield, 2018).
This section discusses the use of the Response Surface Methodology (RSM) and ANFIS model (as a means for comparison of different techniques) to analyze the impact of operating parameters on fault occurrence in manufacturing systems, aiming to mitigate operational disruptions and increase costs (Kumar et al., 2022; Kumar et al., 2024). RSM is a strong statistical and mathematical technique used to model and optimize complex processes. It has been successfully applied in the manufacturing industries to analyze the impact of critical operating parameters on fault occurrence (Meshalkin et al., 2017; Onokwai et al., 2023a; Olusanya et al., 2024). By creating a mathematical model, RSM enables researchers to investigate the relationships between multiple variables and their impact on fault frequency (Olusanya et al., 2024; Okokpujie et al., 2023). The main goal of applying RSM in this context is to identify the best operating conditions that minimize the likelihood of faults occurring (Efetobor et al., 2024). By carefully planning experiments, RSM allows the evaluation of both the individual and interactive effects of various factors, including pressure, voltage, current, vibration, and temperature (Mohammadi et al., 2024). This approach lessens the need for extensive experimental trials and provides valuable insights into the operational dynamics that contribute to system faults Lin et al. (2022). The Adaptive Neuro-Fuzzy Inference System (ANFIS) is a machine learning algorithm that integrates neural networks and fuzzy systems, using Sugeno-type rules and neural network functionalities (Demirok et al., 2023; Kumar et al., 2019).
Researchers have worked on different approaches to carry out machine maintenance (Kumar and Gulati, 2017; Gangwar et al., 2024), Ouda et al. (2021) developed a framework for machine failure prediction using sensor data and optimizing predictive/corrective maintenance schedules. The developed framework focused on two phases: the machine learning phase and mathematical modelling. The machine learning phase includes data selection and reprocessing, selection of model, training of model, and validation. The second phase was the mathematical model which was developed to reduce the maintenance cost of the machine. The machine learning models used to calculate the probability of failure were logistic regression, gradient boosting classifier, and random forest classifier. These ML models were compared and the Gradient Boosting (GB) classifier had the highest predicting efficiency.
Wotawa et al. (2021) made use of three diagnosis methods - modeling, simulation, and machine learning diagnosis - using a developed simplified DC e-motor model with the capability of fault injection to detect unexpected behavior by performing root cause analysis and showed the efficiency of the diagnosis methods to the model’s behavior. Benabbou et al. (2019) proposed a predictive maintenance framework based on ML and optimization approaches for multi-component systems in renewable power plants. Four key steps were highlighted: Data acquisition and processing, remaining useful life (RUL) prediction, failure detection, and maintenance policy optimization. These steps were used to break complex systems into their component levels to understand interactions between them and for fault detection and prediction.
Janssens et al. (2019) suggested a multi-sensor system that employs vibration measures as well as infrared thermal imaging data to automatically condition and identify faults in spinning equipment. Model-driven features are produced from vibration measurements, while data-driven features are derived from infrared thermal imaging data, using feature fusion. The retrieved characteristics are then merged and sent into (meaning of RF?) (RF) classifiers for fault identification. They showed in the study that by combining these two forms of sensor data, they were able to measure a wider range of conditions/faults and combinations than they could with solo sensor streams.
Lacaille and Rabenoro, (2018) designed a learning algorithm that could automatically detect and evaluate multi-dimensional datasets from a turbofan engine. The model performed a large number of pre-treatments and statistical tests on the data to find good combinations of tests with a pre-identification rate of more than 85%.
Huuhtanen and Jung (2018) developed a study on deep learning for predictive maintenance of photovoltaic panels. A convolutional neural network was used to monitor the operation of photovoltaic panels. They calculated the photovoltaic panel’s regular electrical power curve based on the power curves of surrounding panels. A large divergence between the projected and actual power curves can indicate a faulty panel. They demonstrated that the suggested method could properly estimate the power curve of a functional panel through numerical trials, thus outperforming previous methods based on simple interpolation filters.
Quiroz et al. (2018) developed a new technique to fix a broken rotor bar in a line start-permanent magnet synchronous motor (LS-PMSM) using random forest. A healthy motor and a damaged motor with a broken rotor bar fault provided the transient current signal during motor startup. The model was trained with features taken from different statistical time-domain features, and these features were utilized to determine whether the motor was in a malfunctioning or normal state. The relevance of features was taken into account when selecting features from the RF, resulting in a small amount of features. The results demonstrate that RF correctly classifies motor disorders as safe or deficient with an accuracy of 86.7% when all features are used and 85.3% when only the mean index and impulsion features are used. The proposed model outperformed classic machine learning algorithms such as LR, naive Bayes classifier, and decision tree (DT). The RF consistently outperformed these algorithms with higher accuracy than the other algorithms. The proposed methodology can be used in the industry for electronic tracking and fault detection of LS-PMSM motors, and the findings can help factories design proactive maintenance programs.
Yan and Zhou (2017) proposed a predictive model based on Term Frequency-Inverse Document Frequency (TF-IDF) and RF that can predict high-sensitivity faults in advance by analyzing historical data from aircraft maintenance systems, and preventive maintenance can be performed based on the model’s prediction performance. In the previous successive flights, TF-IDF was used to extract features from raw data. The proposed RF model took into account several priorities when identifying the problems. Because the dataset is extremely skewed, the ROC curve was used as a performance metric. In comparison, the proposed methodology achieved the highest true positive rating of 100% and the lowest false positive rate of 0.13 percent. It also had a true positive rate of 66.67 percent and a false positive rate of 0.13 percent on the testing dataset.
Munirathinam and Ramadoss (2014) used machine learning approaches to construct a defect detection model that was accurate. Statistical analysis such as chi-square and Principal Component Analysis (PCA), are used to choose characteristics. Overfitting, more computational power, and worse prediction accuracy have all been addressed using techniques such as subject matter expert knowledge, correlation analysis, and variable component analysis. The main disadvantage is that oversampling (duplicating existing instances) leads to overfitting of the model. Deep learning is required to enhance the chance of predicting unusual classes. Deep belief networks are a sort of deep learning technology that may be used for supervised as well as unsupervised learning. Depending on the dataset used, the number of nodes and layers in a deep belief network varies.
This research applies machine learning-based predictive maintenance (PdM) models to Nigeria, an underexplored region in existing literature. Focusing on this specific context provides valuable insights for similar manufacturing environments in developing economies (Kumar et al., 2020; Sharma, et al., 2024). The innovative integration of Response Surface Methodology (RSM) with the Adaptive Neuro-Fuzzy Inference System (ANFIS) advances the field by enhancing fault detection in machining and optimizing maintenance schedules more effectively than traditional methods (Effiong et al., 2024; Onokwai et al., 2023b). Through a comparative analysis of various machine learning techniques, the study identifies the most effective models for reducing downtime and maintenance costs, offering practical solutions that can be immediately implemented in the industry (Kumar and Gulati, 2018; Izonin et al., 2022). This research contributes to both academia and industry by providing a replicable framework that could inspire further development, particularly in developing economies where manufacturing is vital for growth (Lin et al., 2022; Mohammadi et al., 2024).
2 Methodology
This section discusses maintenance data acquisition, data processing, and presentation of methodology for extracting important machine parameters needed for the study. Machine data were generated from various operating sensors on the equipment. The acquired data was used to develop a mathematical model. Each stage in these developed models is critical and provides significant information about the actual time to start a maintenance operation using machine historical data. The data was used as the input to the model while the output was maintenance decision based on machine fault occurrence.
2.1 Description of the case study
The case study is based on a leading food and beverage manufacturing company in Nigeria, selected due to its continuous production activities and data accessibility. The choice of this company enhances the validity of the data, as it operates with consistent production processes that provide a stable environment for data collection and analysis. The company’s production operations are managed by an engineering department led by the Factory Engineer, who oversees a comprehensive range of maintenance functions including manufacturing, boilers, utility services, ammonia refrigeration, compressed air, electrical services, and building maintenance. This role also involves providing coaching and skill development in loss elimination, risk management, and life cycle asset management, which supports the maintenance system’s effectiveness. The thorough management and oversight by the Factory Engineer ensure that data related to maintenance and operations are accurate and reflective of real-world conditions.
The Factory Engineer’s activities are executed through plant engineers, each responsible for various areas within the factory. These plant engineers conduct systematic reviews of process lines and utilities, which are critical for maintaining personnel and machinery safety, environmental protection, and regulatory compliance. This structured approach to monitoring and reviewing processes reinforces the reliability of the data, as it ensures that all relevant factors affecting equipment performance are consistently evaluated. Maintenance supervisors perform daily monitoring of equipment trends, further validating the data by providing ongoing insights into equipment performance and identifying potential issues before they lead to stoppages. This regular monitoring helps ensure that the data collected is current and accurately represents the operational status of the equipment.
The company’s use of advanced predictive maintenance technologies such as infrared, vibration analysis, thermography, oil analysis, and motor circuit analysis adds to the authenticity of the data. These technologies are employed to monitor equipment conditions and prevent machine failures, providing a robust basis for data collection and analysis. The use of these state-of-the-art methods ensures that the data is precise and reflective of the actual equipment performance. Overall, the combination of continuous production activities, rigorous maintenance management, systematic process reviews, daily equipment monitoring, and advanced predictive maintenance technologies supports the validity and authenticity of the data considered in this study.
2.2 Research design of a mathematical model for predictive maintenance
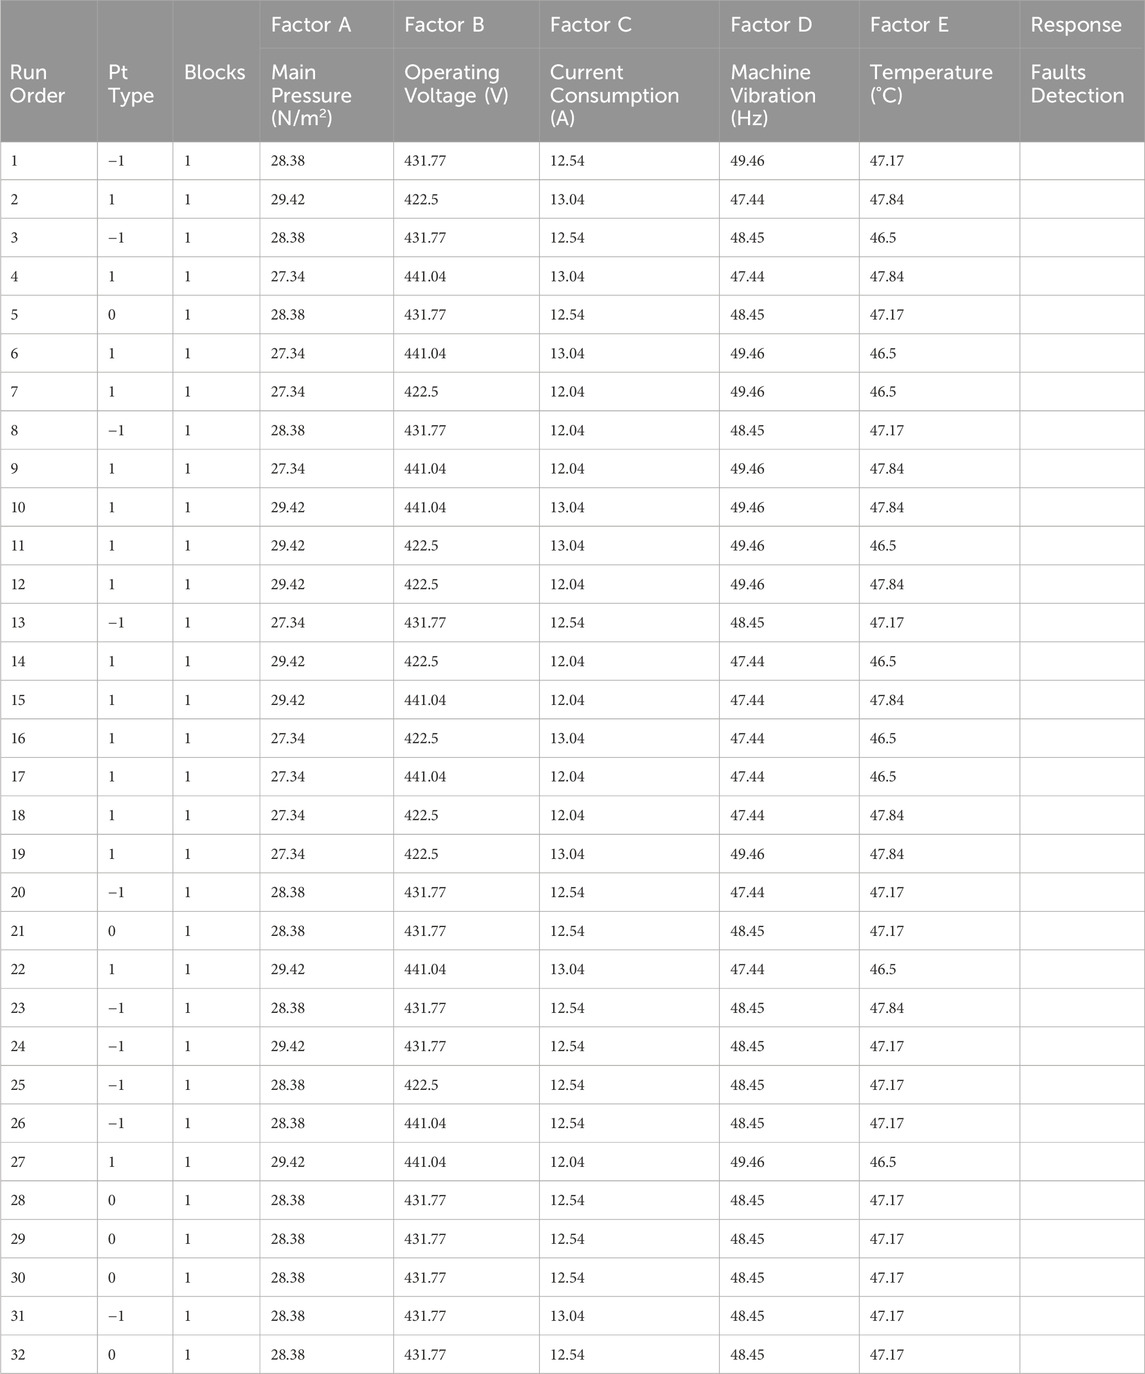
Generation of experimental design using Response Surface Method (RSM) based on the central composite design (CCD) via the aid of Design-Expert version 13.0 statistical software. RSM is an explicit mathematical modelling tool for fitting the operational variables of the independent variable (X) and dependent variables (Y) in the modelling environment. The CDD was used because it reduces the experimental runs when more than three (3) factors are involved in the prediction of response (Onokwai et al., 2022; Onokwai et al., 2023c; Gangwar et al., 2024). Factors such as main pressure (N/m2), operating voltage (V), current consumption (A), machine vibration (Hz), and temperature (°C) at 3 levels of experimental runs were utilized to generate the experimental runs as depicted in Table 1.
The results obtained from the experimental run, i.e., the factors (main pressure (N/m2), operating voltage (V), current consumption (A), machine vibration (Hz), and temperature (°C)) were then inputted into the machine in the field to generate the response (faults). These factors and the response were inputted into the Design-Expert statistical software version 13.0 to generate the mathematical relationship between the factors and the response as depicted in Equation 1. A mathematical expression (Equation 1) was derived to depict the relationship between these operating factors and the response variable, faults. Subsequently, the constant, linear, quadratic, and interactive coefficients were computed.
2.3 Research design of an ANFIS model for predictive maintenance
Developing a model to predict faults using the Adaptive Neuro-Fuzzy Inference System (ANFIS) involves combining the strengths of neural networks and fuzzy logic. ANFIS is particularly effective for problems with complex and nonlinear relationships, such as fault prediction in various systems. The following outlines the systematic approach employed in this research as shown in Figure 1.
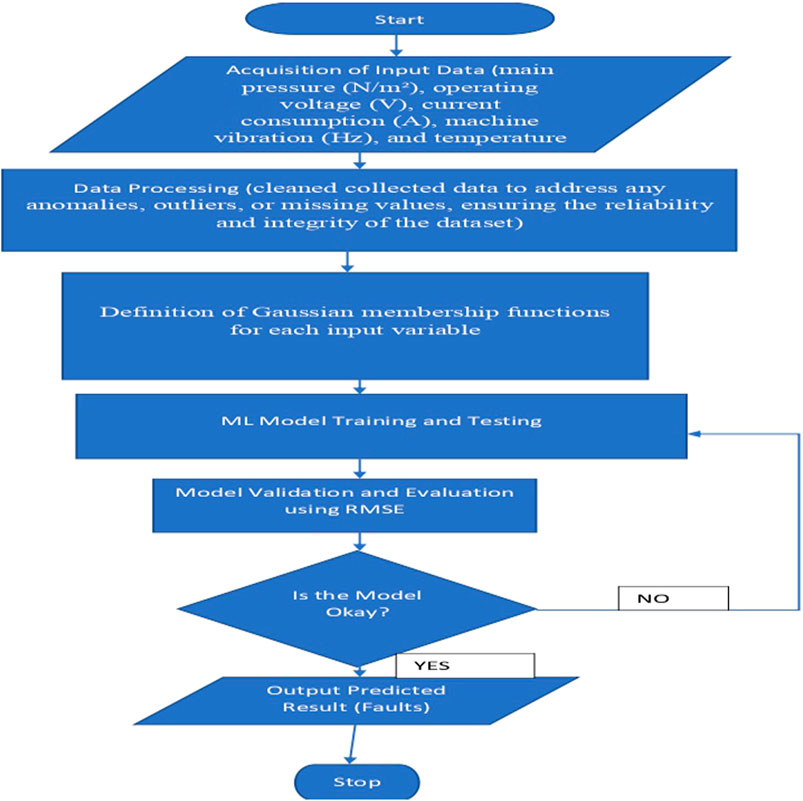
Figure 1. Flowchart depicting the steps involved in developing an ANFIS Model for Machine Faults Prediction.
2.3.1 Data collection and preprocessing
The foundation of the ANFIS model is built on carefully curated data. Historical data was systematically gathered, focusing on critical parameters such as main pressure (N/m2), operating voltage (V), current consumption (A), machine vibration (Hz), and temperature (°C). This data, derived from experimental runs, was processed using Visual Studio Code, running on a system with an Intel® Core™ i7-8650U CPU at 1.90 GHz, 16 GB RAM, and a 64-bit operating system with Windows 11. The model was developed using a suite of Python libraries, including anfis, pandas, numpy, sklearn. model_selection, sklearn. linear_model, sklearn. metrics, and membership (Pedregosa et al., 2011; Kumar et al., 2024). The data was meticulously cleaned to address any anomalies, outliers, or missing values, ensuring the reliability and integrity of the dataset. Additionally, the data was normalized to bring all input variables to a similar scale, which is crucial for enhancing the model’s performance and accuracy (Izonin et al., 2022; Kumar et al., 2020; Kumar and Gulati, 2018).
2.3.2 Defining membership functions
The next step involved defining Gaussian membership functions for each input variable. These functions capture the degree of belonging of specific input values to corresponding fuzzy sets, forming the basis for the fuzzy logic component of the ANFIS model. By accurately representing the input variables, the membership functions facilitate the creation of a robust rule base, which maps the relationships between these variables and the desired output (Sharma et al., 2024).
2.3.3 Model training and testing
To develop and validate the ANFIS model, the dataset was split into training and testing subsets, with 80% of the data allocated for training and 20% for testing. The training process employed optimization algorithms, such as the least-squares method or backpropagation, to adjust the model’s parameters iteratively. This approach minimized the error between predicted outputs and actual observations, thereby enhancing the model’s predictive capability and accuracy (Kumar et al., 2024).
2.3.4 Model evaluation
The performance of the trained ANFIS model was rigorously evaluated using statistical metrics, including Root Mean Squared Error (RMSE) and Mean Absolute Error (MAE). These metrics provided quantitative measures of the model’s prediction accuracy. Additionally, the model’s robustness was validated by testing it on an independent dataset that was not involved in the training process. This evaluation step ensured that the model generalizes well to new data, confirming its effectiveness and reliability in real-world predictive maintenance scenarios (Zhou et al., 2021; Tadesse et al., 2024).
2.4 Evaluation and comparison of the prediction accuracy of the model
The mathematical model was then used in predicting the response to reduce the bottleneck of generating response via experimental run. Evaluation of the prediction accuracy of the mathematical model was assessed through various criteria using analysis of variance (ANOVA), including probability (p-value), lack-of-fit, Fisher (F) value, coefficient of variation (CV), coefficient of determination (R2), and the comparison between the adjusted and predicted R2 values (Okokpujie et al., 2023). This rigorous evaluation ensures the robustness and reliability of the mathematical model.
3 Results and discussion
3.1 Experimental design matrix for fault detection
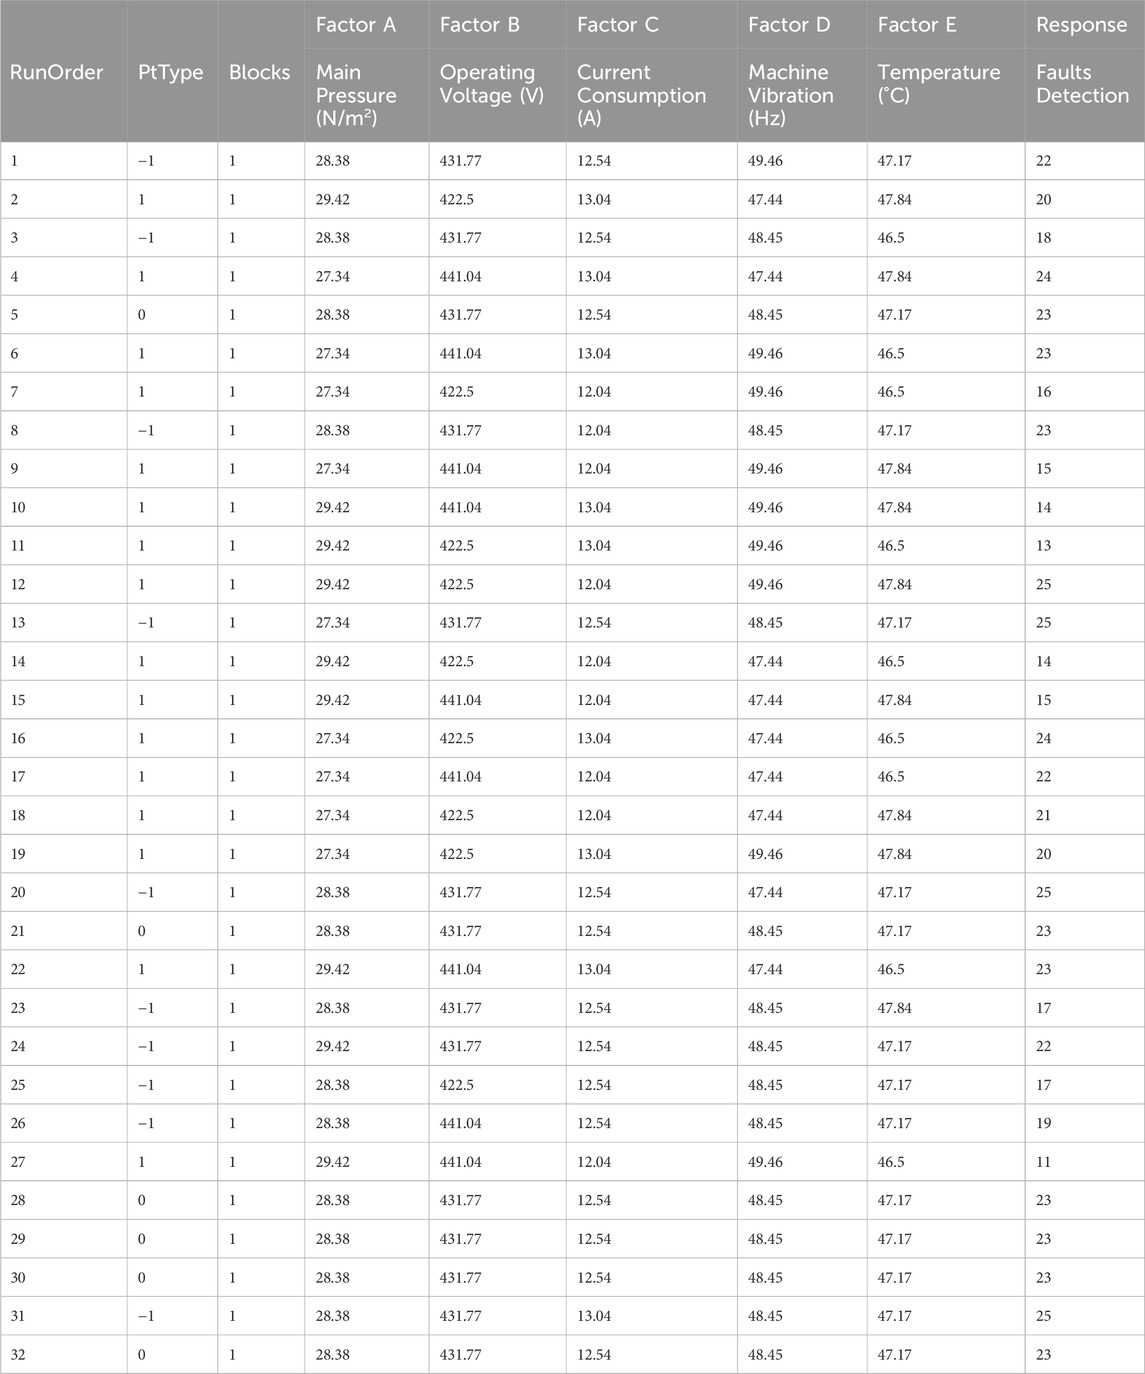
The research uniquely integrates various operational factors at different levels to understand their collective impact on machine faults (Yao et al., 2022). The detailed design matrix and the associated experimental runs (as shown in Table 2) offer a thorough investigation of fault conditions, which is more exhaustive compared to similar studies that may only focus on a few parameters or their individual effects Lin et al. (2022).
Table 2 depicts the experimental design matrix and the corresponding faults generated at different operational factors such as main pressure (N/m2), operating voltage (V), current consumption (A), machine vibration (Hz), and temperature (°C). These factors were utilized at three levels of experimental runs. The maximum faults of 25 were achieved at pressure, operating voltage, current consumption, machine vibration, and temperature of 28.38 N/m2, 431.77 V, 12.54 A, 47.17 Hz, and 25°C, respectively. The lowest fault detection was attained at a pressure of 29.42 N/m2, an operating voltage of 441.04 V, a current consumption of 12.04 A, a machine vibration of 49.46, and a temperature of 46.5°C. High voltage levels can lead to increased current flow, which may stress the electrical components of the machine, leading to overheating, insulation breakdown, and eventual faults (Bindi et al., 2023). Conversely, low voltage levels caused insufficient power supply, resulting in irregular machine operation, reduced efficiency, and potential faults due to inadequate performance (Figures 2A, B).
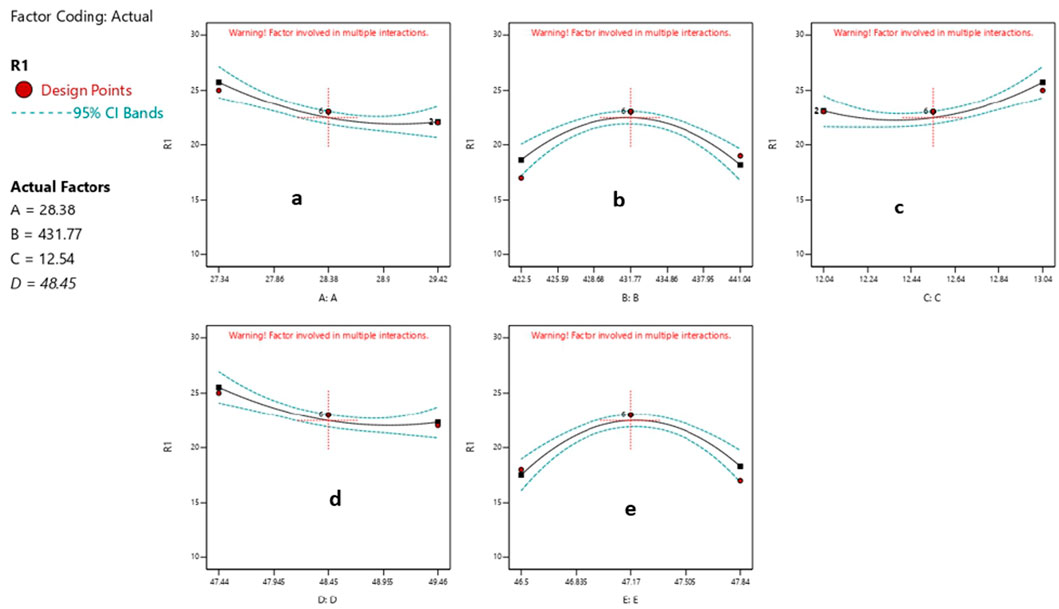
Figure 2. Effect of individual parameters (A) Main pressure (B) Operating voltage (C) Current consumption (D) Machine vibration (E) Temperature on machine faults.
Results showed that excessive vibration led to misalignment, worn-out bearings, or unbalanced components within the machine. These issues could escalate into faults such as mechanical failures, structural damage, and decreased operational lifespan (Girdhar and Scheffer, 2004). The continuous increase in vibration also enhanced wear and tear on moving parts, causing premature failure of critical components and contributing to overall machine unreliability (Figure 2C). High pressure within a machine’s operating environment increased the stress on mechanical components, seals, and connections (Figure 2D). This stress resulted in fatigue, deformation, and ultimately, component failure or leaks, while a low pressure negatively influenced the lubrication systems, cooling mechanisms, and overall system performance, leading to increased friction, overheating, and potential faults (Bloch and Geitner, 1999). Continuous increases in temperatures accelerated the wear and tear on machine parts, reduced lubrication effectiveness, and degraded materials, hence; leading to increased friction, thermal expansion, and potential failures, while very low temperatures caused fluid viscosity issues, reduced system efficiency, and increased risk of condensation or freezing (Figure 2E), which may affect mechanical and electrical components and lead to faults (Ouyang et al., 2022).
3.2 The statistical equation for fault detection
The result of the mathematical model that was used to predict the faults is shown in Equation 2, while Table 3, depicts the summary of the outcome faults obtained for both the mathematical model. The Analysis of Variance (ANOVA) assesses the influence of individual and interactive parameters on fault generation and was conducted to validate both the mathematical model accuracy in predicting faults. The F-value shows the relationship between mean square values in the developed regression model and the error term. Onokwai et al. (2023c) found the p-value from the regression analysis to be acceptable and reliable. A higher F-value indicates a more reliable, responsive, and replicable regression model. Okokpujie et al. et al. (2023) suggest that the p-value should be significantly low for a reliable model. In the study, the regression model had a high F-value (30.40) with a p-value below 0.05 for all investigated faults, indicating significance. All significant model terms (A, C, D, A2, B2, C2, D2, E2, AB, AC, AE, BC, BD, BE, CD, CE, and DE) positively influenced fault generation, as seen in Table 3. The lack of Fit (0.054) demonstrates the model’s ability to reproduce and predict experimental data. The coefficient of variation (CV%) represents overall experimental error as a percentage of the mean, with a low CV% (less than 10%) indicating good model reproducibility. The study shows a CV% for faults yield of 4.48%, indicating good reproducibility and reliability. The R2 value for fault generation was 0.9822, close to 1, indicating a good model fit. The adjusted R2, accounting for model complexity, was 0.8252, with a predicted R2 of 0.9499, showing reasonable agreement. Overall, the study’s findings support the model’s responsiveness, reliability, and ability to replicate experimental data.
Overall, the study’s findings validate the model’s responsiveness, reliability, and ability to replicate experimental data. The statistical robustness of these results is emphasized by the high F-value, low p-value (indicating significance), a close-to-one R2 value of 0.9822, and a low CV% of 4.48%, all of which affirm the model’s reliability and reproducibility (Susto et al., 2015b). This level of statistical validation significantly enhances the credibility and novelty of the research.
Where A, B, C, D, and E represent the coded values of Pressure, Operating Voltage, Current, Machine Vibration, and Temperature. In the mathematical model, a positive (+) sign signifies a synergistic effect, while a negative (−) sign indicates antagonistic effects on generated faults.
3.3 Influence of individual and interactive factors on fault
Figure 3 illustrates the 3D surface plot for fault occurrence with parameters B (operating voltage) and D (machine vibration) plotted against each other, while holding A (main pressure at 28.38 N), C (current consumption at 12.54 A), and E (temperature at 47.17°C) constant. The plot demonstrates how B and D influence fault generation under these fixed conditions. The maximum observed fault value of 23.5 was reached at the given constant settings of A, C, and E. Notably, as D (vibration) slightly increases, B (voltage) also rises from 425 to 430 V, leading to an increase in the fault level. However, an increase in B beyond 430 V causes the fault to decrease. This suggests that machine performance is directly influenced by variations in operating voltage, which may affect motor speed, torque, and power output, subsequently increasing vibration levels up to a certain threshold before the fault level declines. Figure 4 presents the 3D response surface plot for fault occurrence, with B (operating voltage) and E (temperature) as the variables, while A (main pressure at 28.38 N), C (current consumption at 12.54 A), and D (vibration at 48.45 Hz) remain constant. The plot shows that the maximum fault of 20.8 occurs when the operating voltage is at 431 V and the temperature is 47.7°C. Beyond this point, further increases in operating voltage reduce the fault level. This observation implies that while higher operating voltages can occasionally help reduce faults, such scenarios are uncommon and must be carefully considered within the specific context of the machine and its operational conditions. Continuous increases in operating voltage without considering system constraints or design specifications can heighten the risk of malfunctions, compromising the machine’s reliability and safety. Therefore, any modifications to operating voltage should be approached with caution, adhering to established engineering principles and safety regulations. To ensure the health, reliability, and optimal performance of manufacturing machines, it is essential to implement proactive monitoring and maintenance strategies, along with effective voltage level management. Early detection and mitigation of voltage-related risks can help operators minimize downtime, maximize production efficiency, and ensure consistent product quality. Figure 5 depicts the impact of C (current consumption) and D (vibration) on fault occurrence, with A (main pressure at 28.38 N), B (operating voltage at 431.77 V), and E (temperature at 47.17°C) held constant. As current increases from 12A to 12.5 A and vibration reaches 48 Hz, the fault decreases; however, as current exceeds 12.5A, the fault begins to rise. This suggests a relationship between the machine’s current draw and the vibration it generates. Increased current levels may induce greater mechanical stress within the machine, as indicated by the rising vibration levels with increasing current. Factors such as imbalances in rotating components or increased motor load could contribute to this vibration increase. Figure 6 displays the 3D response surface plot, showing the combined effects of C (current consumption) and E (temperature) on fault occurrence, with A (main pressure at 28.38 N/m2), B (operating voltage at 431.77 V), and D (vibration at 48.45 Hz) held constant. As temperature rises from 47°C to 47.5°C, the fault level increases; however, beyond 47.5°C, the fault decreases. Similarly, as current increases from 12 A to 12.4A, the fault increases, but it begins to drop when current exceeds 12.4 A. Figure 7 illustrates the 3D response surface plot showing the effect of D (vibration) against E (temperature) on fault occurrence, with A (main pressure at 28.38 N), B (operating voltage at 431.77 V), and C (current consumption at 12.5 A) held constant. The fault increases as temperature rises from 46.5°C to 47.7°C, but as temperature rises above 47.7°C, the fault level starts to decrease. Overall, Figures 3–7 highlight the complex interactions between various parameters that affect fault occurrence in the manufacturing system.
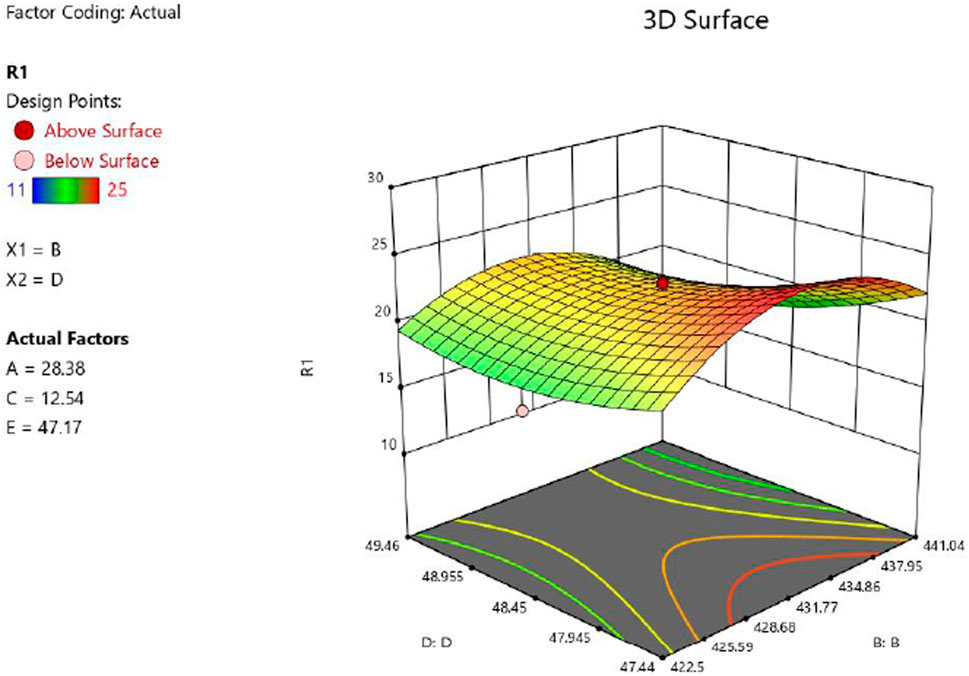
Figure 3. 3D Surface response plots for the combined effects of operating voltage (V) and vibration (Hz) on fault at constant pressure (28.38 N/m2), current consumption (12.54 A), and temperature.
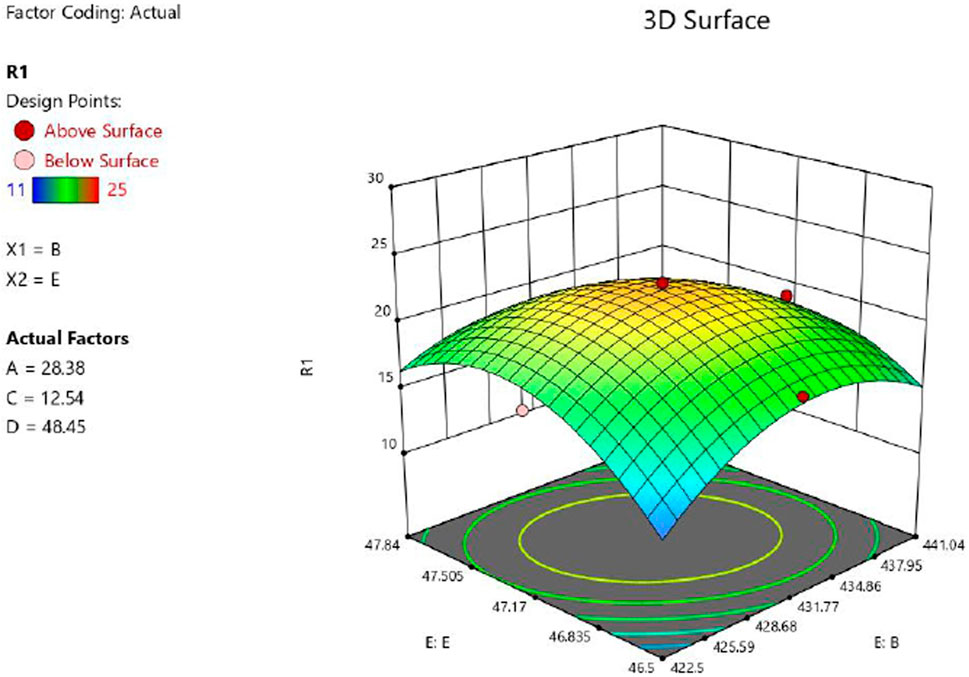
Figure 4. 3D Surface response plots for the combined effects of operating voltage (V) and temperature (
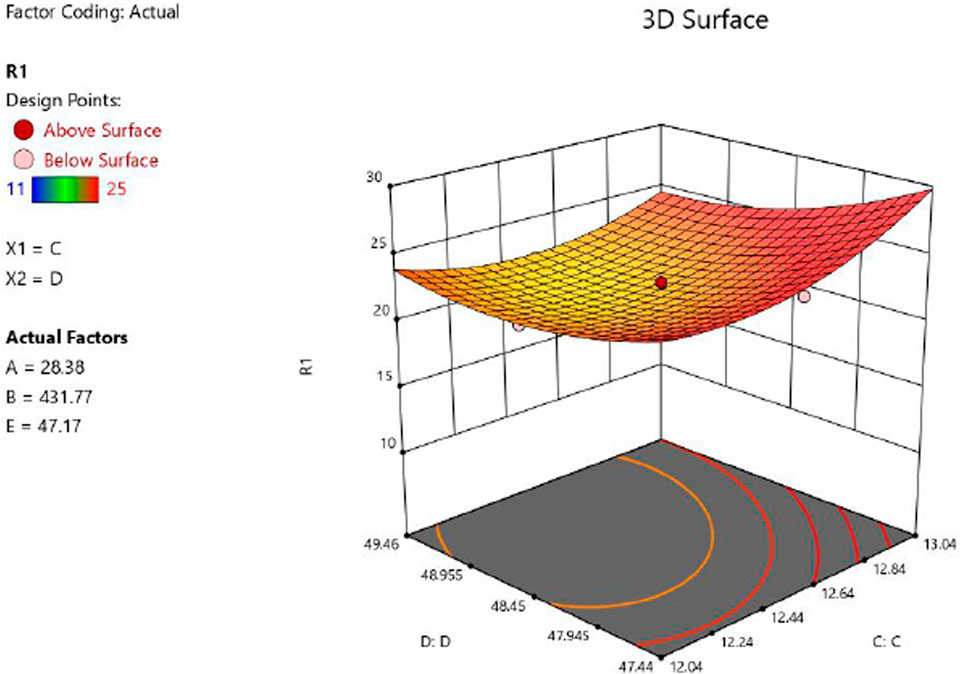
Figure 5. 3D Surface response plots for the combined effects of current consumption (A) and vibration (Hz) on fault at constant pressure (28.38 N/m2), operating voltage (431.77 V), and temperature (47.17°C).
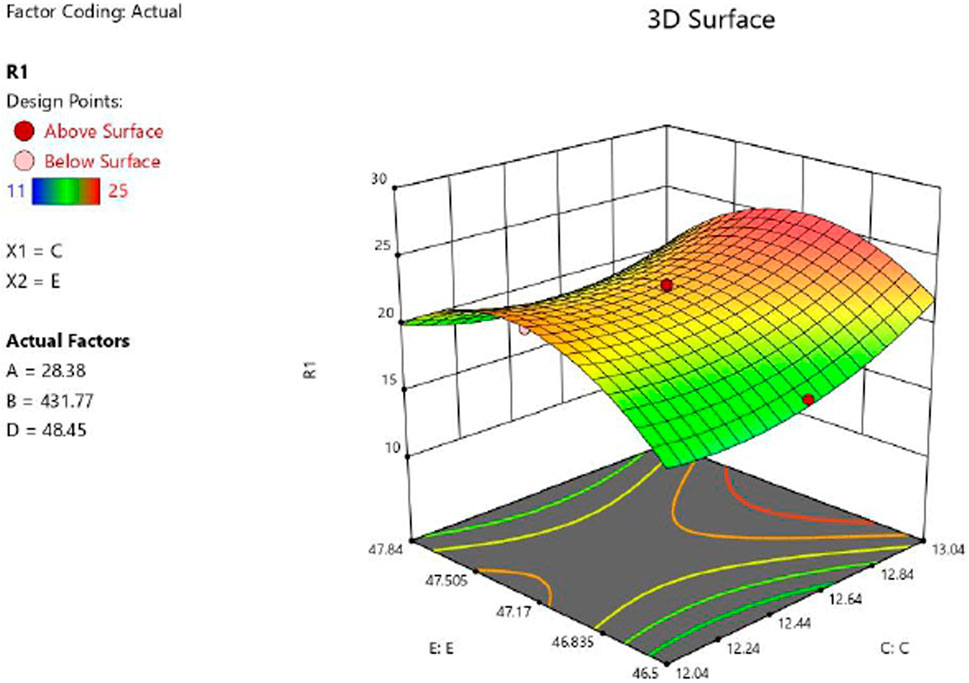
Figure 6. 3D Surface response plots for the combined effects of current consumption (V) and temperature (
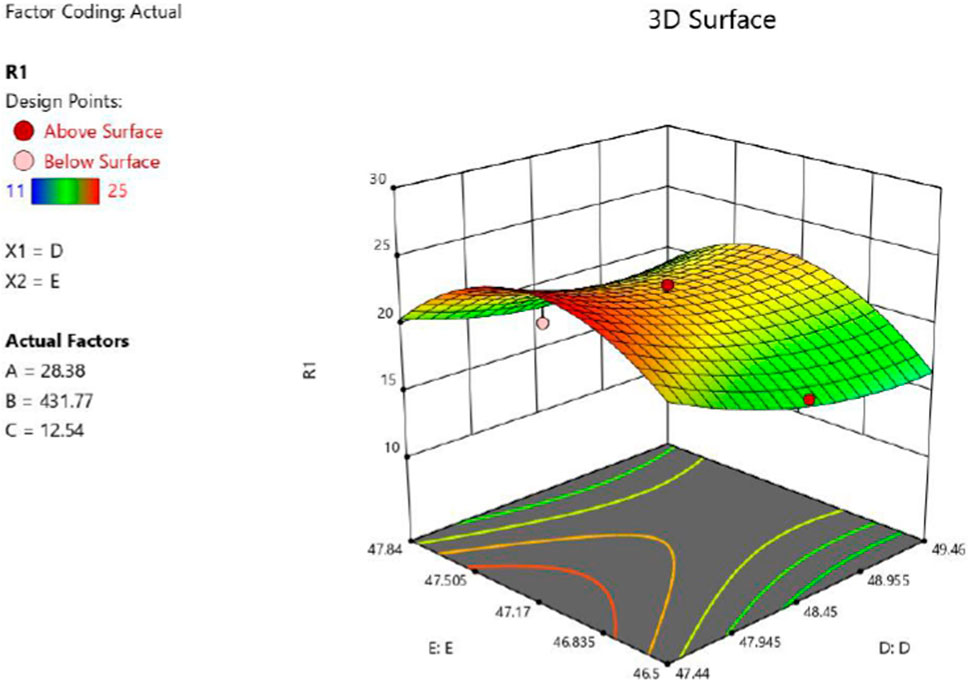
Figure 7. 3D Surface response plots for the combined effects of vibration (Hz) and temperature (
This emphasizes the importance of precisely controlling operational parameters to ensure optimal performance, reliability, and safety of the equipment. Reducing downtime, increasing production efficiency, and maintaining consistent product quality require proactive monitoring, maintenance, and strict adherence to engineering principles (Breznicka et al., 2023). The research offers new insights into the interactive effects of operational parameters on fault generation (Benabbou et al., 2019). For instance, the study reveals how specific combinations of voltage and vibration (Figure 3), or current consumption and temperature (Figure 6), influence fault generation in previously underexplored ways (Yoo et al., 2019). This contributes to a deeper understanding of the dependencies between different factors.
3.4 Experimental and RSM predicted data
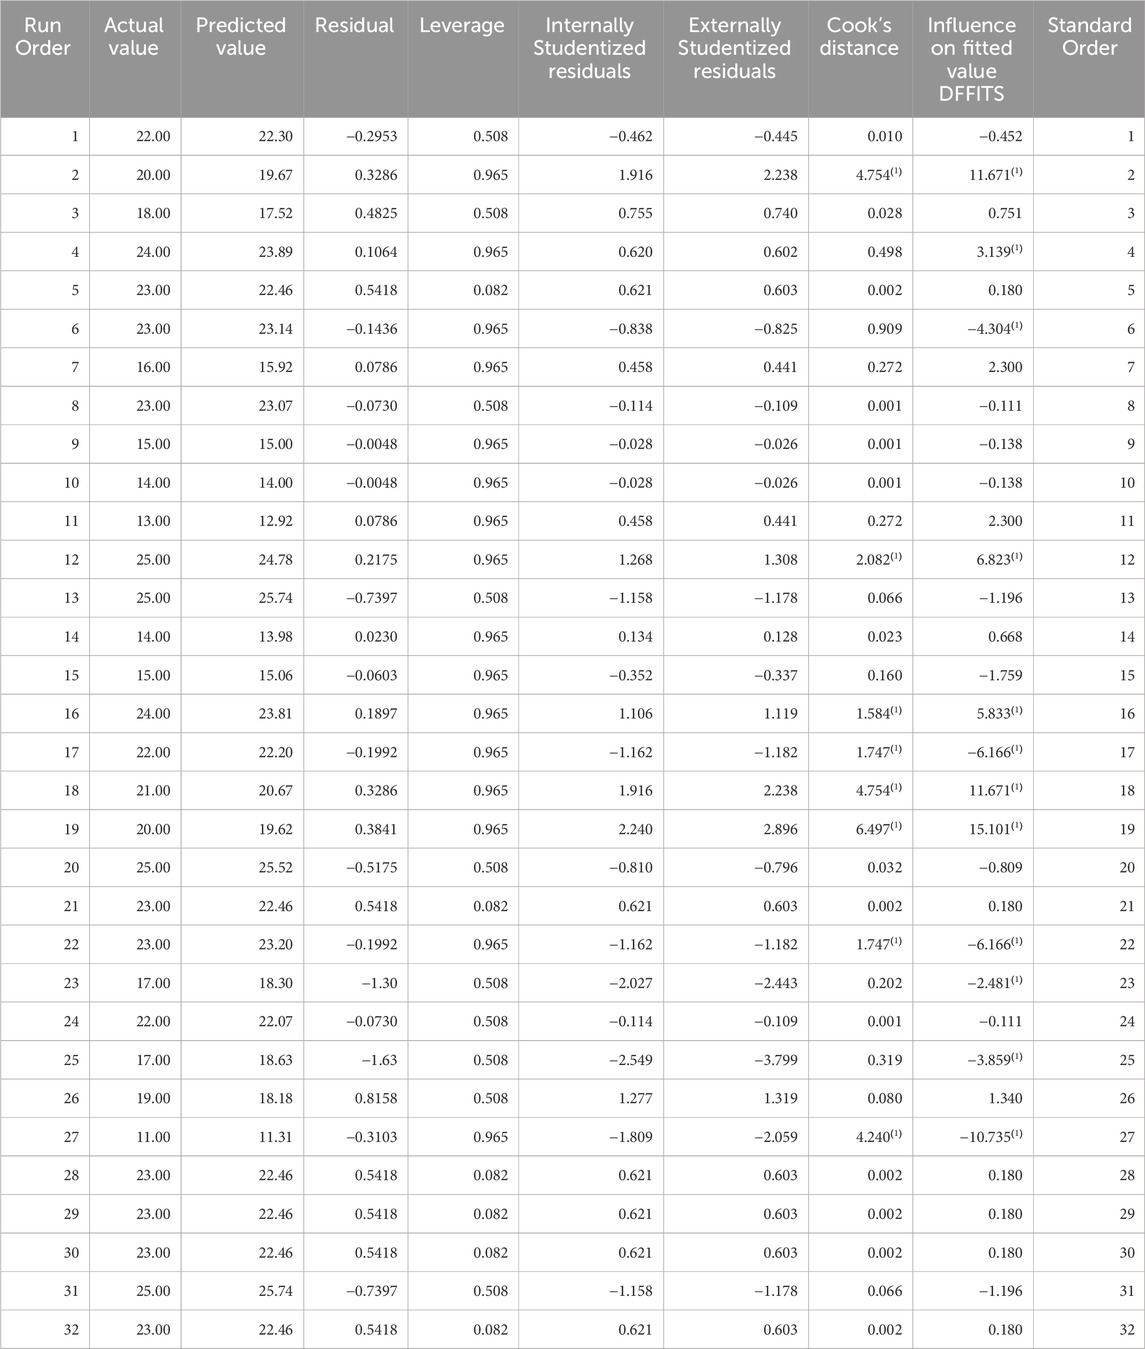
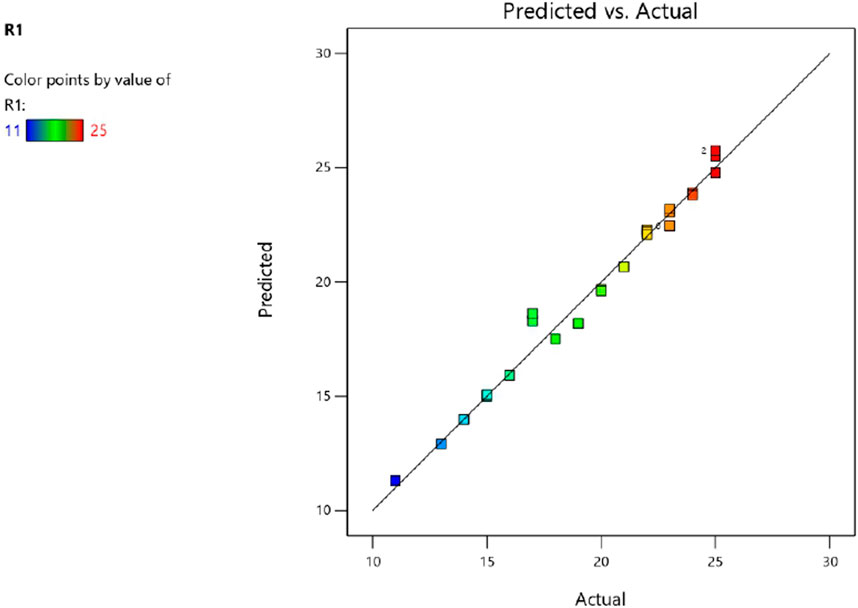
Table 4 presents the relationship between the experimental and predicted faults from RSM. It can be deduced that the predicted values are in tandem with the experimental value. As the predicted value lies closely along the regression line (Figure 8), hence the predicted values from RSM can accurately represent the actual (experimental) value.
3.5 Comparison between experimental, ANFIS and RSM PredictedFaults
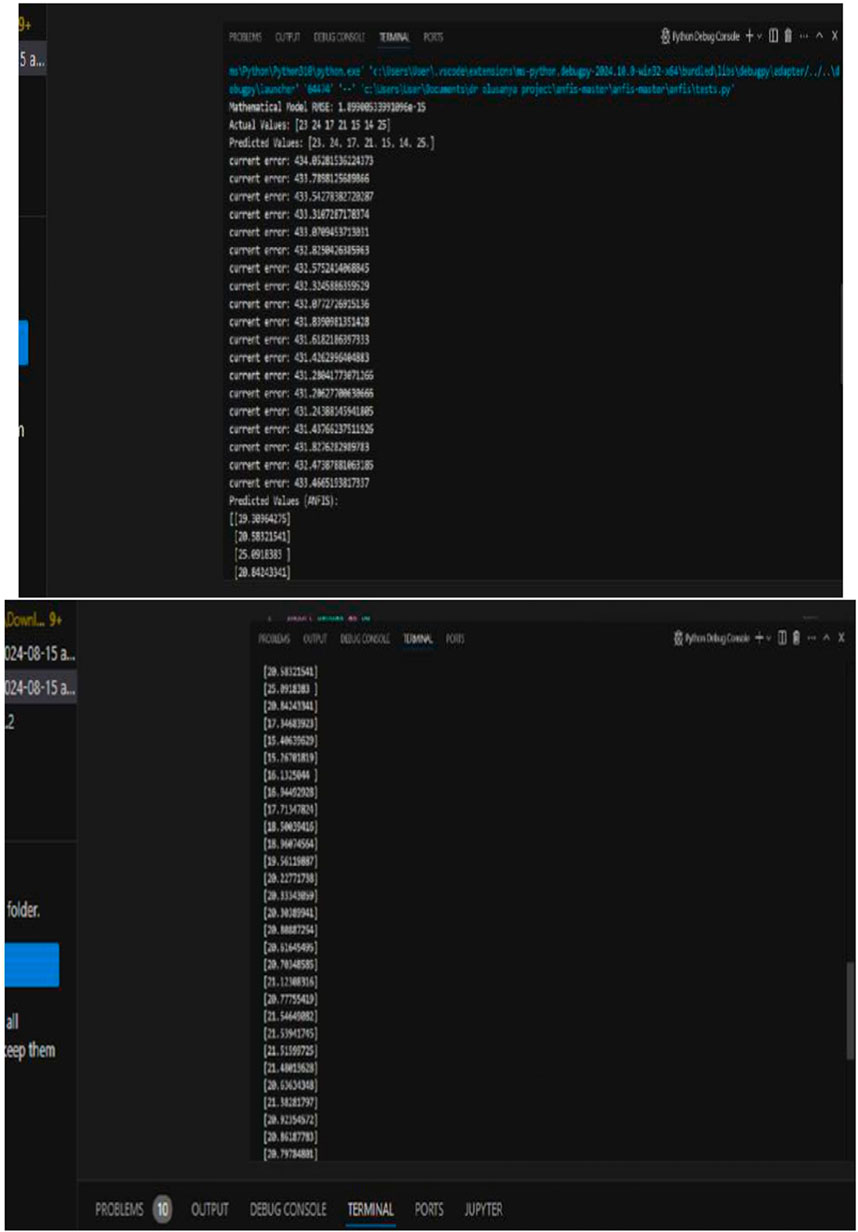
Figure 9 shows a screenshot of the ANFIS-predicted faults, while Table 5 offers a detailed comparison of the actual (experimental) faults with those predicted by the ANFIS and RSM models. According to the data in Table 5, the actual faults range from 11.00 to 25.00. In comparison, the ANFIS model predicts faults within a slightly narrower range of 15.41–25.09, while the RSM model’s predictions span a broader range, from 11.31 to 25.74. When comparing these fault detection methods, several key insights emerge regarding their accuracy and consistency. The mean values indicate that both the experimental and RSM predictions share an identical average of 20.34375, whereas the ANFIS model has a slightly lower mean of 20.23875. This suggests that, on average, RSM predictions align more closely with the experimental results than ANFIS predictions. However, the differences in mean values across all three methods are minimal, indicating a close central tendency overall.
A deeper analysis of variance further distinguishes these methods. The variance in ANFIS predictions (4.1747) is significantly lower than that observed in both the experimental (16.5554) and RSM (16.2643) values. The lower variance in ANFIS predictions points to greater consistency and less fluctuation around the mean, compared to the other two methods. In contrast, the higher variability in both the experimental and RSM values suggests these methods might be more sensitive to specific conditions during fault measurement or prediction. To statistically evaluate the differences between these methods, an ANOVA test was conducted. The results reveal that the between-group variance (SS = 0.2352) is quite low compared to the within-group variance (SS = 1146.82825). The calculated F-value of 0.00954 is significantly lower than the F-critical value of 3.0943, indicating minimal differences between the group means relative to the variability within each group. Furthermore, the high P-value (0.9905) strongly suggests that there is no statistically significant difference between the three methods. This implies that any variations in the mean values could be attributed to random chance rather than any inherent differences in the methods’ effectiveness (Kumar et al., 2020; Kumar and Gulati, 2018). While ANFIS consistently produced more precise predictions due to its lower variance, the statistical analysis revealed no significant difference between the three methods (Experimental, ANFIS, and RSM) in predicting machine faults under the tested conditions. Although ANFIS occasionally deviated from the expected range, most of its predictions were accurate, suggesting potential for improvement with more data (Tadesse et al., 2024). Among the methods, RSM demonstrated the strongest alignment with experimental values, underscoring its effective predictive capability.
This research, by employing a combination of RSM and ANFIS, achieves higher predictive accuracy for machine faults compared to studies that rely solely on traditional statistical methods (Azadeh and Mahdi, 2023). The study’s experimental design encompasses a broader range of operational conditions, providing a more comprehensive understanding of fault dynamics in industrial systems (Yao et al., 2022). The findings have immediate practical implications for industries, particularly in optimizing machine maintenance and reducing downtime, which are critical for improving operational efficiency and product quality (Mohammadi et al., 2024). Using ANFIS for machine fault prediction is a novel application in this context (Mohammadi et al., 2024). ANFIS combines the strengths of fuzzy logic and neural networks, offering a more robust and adaptable model for predicting machine faults under varying operational conditions. This represents a significant improvement over traditional statistical models, providing higher accuracy and better adaptability to complex, nonlinear relationships (Ouda et al., 2021).
3.6 Optimum conditions of operating parameters
The optimal operating conditions for minimizing fault generation are critical to maintaining efficiency and prolonging machine life are shown in Figure 10. Based on the findings, the optimal conditions were identified at specific levels of main pressure, operating voltage, current consumption, machine vibration, and temperature. These factors were precisely determined as follows: 29.420 N, 441.040 V, 12.2723 A, 49.2968 Hz, and 46.50°C, respectively. Incorporating machine-specific factors, such as vibration frequency (Hz), into the optimization process is essential. Vibration, often a sign of mechanical imbalance or misalignment, plays a significant role in machine health. By fine-tuning this parameter, it is possible to prevent excessive wear and tear, thus reducing the likelihood of machine failure. Moreover, maintaining optimal vibration levels can enhance the machine’s operational stability, further contributing to reduced fault occurrences. Additionally, it is imperative to monitor how these optimized parameters interact within the machine’s operational framework. For instance, while optimizing the current consumption, ensuring that the machine’s components are not subjected to undue stress is vital. Excessive current, even at optimal levels, could lead to overheating, affecting both machine performance and safety. Furthermore, achieving the identified optimal conditions is a delicate balance of managing the machine’s operating parameters in tandem with the mechanical and electrical characteristics of the system. Continuous monitoring and adjustment of these factors are recommended to sustain optimal performance and minimize fault generation.
4 Conclusion
This study highlights the crucial role of maintenance in ensuring equipment reliability and optimizing performance through predictive models and advanced optimization techniques. The research utilized Response Surface Methodology (RSM) and Adaptive Neuro-Fuzzy Inference System (ANFIS) to develop a robust mathematical model that assesses how operational parameters—such as pressure, voltage, current, vibration, and temperature—affect fault occurrence and machine fault detection. The study involved collaboration with industry practitioners from the beverage sector, which provided valuable insights and data essential for developing and validating the predictive models. The machines analyzed for fault detection included critical equipment in the production and packaging processes, such as bottling lines and key utilities like compressors and refrigeration units. The findings underscore the importance of precise parameter management for predicting and mitigating equipment faults. By examining how variations in pressure, voltage, current, vibration, and temperature influence fault rates, the study enhances understanding of maintaining optimal equipment performance and improving machine fault detection. The primary challenge addressed was the accurate prediction of equipment faults to minimize downtime and boost operational efficiency. Effective predictive maintenance is vital for preventing unexpected machine failures, which can lead to costly production disruptions. Addressing this issue is crucial for improving equipment reliability, reducing costs, and ensuring safety in manufacturing processes. The research employed RSM and ANFIS to create a model that analyzed the impact of various operational parameters on fault occurrence and detection. Data were collected at three levels for each parameter using a central composite design, and the model’s accuracy was validated with an R2 value of 98.22% and a statistically significant p-value (p < 0.05). The study found that faults were most frequent at specific parameter combinations, such as a pressure of 28.38 N/m2, voltage of 431.77 V, current of 12.54 A, vibration of 47.17 Hz, and temperature of 25°C, while fault detection rates were lowest at other parameter values. Additionally, ANFIS demonstrated superior accuracy in fault prediction due to its adaptive learning capabilities. While machine learning (ML) techniques were considered, the decision was made to focus on RSM and ANFIS due to their specific suitability for the parameters and context of this study. ML techniques were not utilized as they would require extensive data preprocessing and potentially more complex models, which were outside the scope and resources of this research. Integrating RSM and ANFIS significantly enhances predictive maintenance strategies and machine fault detection, leading to better equipment management and reduced operational disruptions. These findings offer valuable methods for improving fault detection and optimizing production processes in the beverage industry. The research advances the field by applying RSM in a novel way within this sector and combining it with ANFIS for a comprehensive predictive maintenance strategy. Future research should involve collaboration with industry partners to validate these models in real-world settings. Conducting case studies and experimental designs will be crucial to confirming RSM’s practical applicability across various stages of beverage production and ensuring its value for process optimization and continuous improvement in machine fault detection and overall industry performance.
Data availability statement
The original contributions presented in the study are included in the article/supplementary material, further inquiries can be directed to the corresponding author.
Author contributions
AO: Data curation, Methodology, Conceptualization, Formal analysis, Validation, Investigation, Funding acquisition, Software, Writing–original draft, Writing–review and editing. OO: Conceptualization, Data curation, Methodology, Investigation, Validation, Funding acquisition, Software, Writing–original draft. MO: Formal Analysis, Validation, Supervision, Methodology, Software, Funding acquisition, Resources, Writing–review and editing. BA: Formal analysis, Data curation, Funding acquisition, Investigation, Resources, Visualization, Writing–review and editing. AO: Data curation, Funding acquisition, Project administration, Resources, Software, Validation, Writing–review and editing. DA: Funding acquisition, Project administration, Resources, Writing–review and editing.
Funding
The author(s) declare that no financial support was received for the research, authorship, and/or publication of this article.
Conflict of interest
The authors declare that the research was conducted in the absence of any commercial or financial relationships that could be construed as a potential conflict of interest.
Publisher’s note
All claims expressed in this article are solely those of the authors and do not necessarily represent those of their affiliated organizations, or those of the publisher, the editors and the reviewers. Any product that may be evaluated in this article, or claim that may be made by its manufacturer, is not guaranteed or endorsed by the publisher.
References
Ahmad, R., and Kamaruddin, S. (2012). An overview of time-based and condition-based maintenance in industrial application. Comput. Industrial Eng. 63 (1), 135–149. doi:10.1016/j.cie.2012.02.002
Amassoma, J. U. (2011). The manufacturing sector and economic growth in Nigeria: empirical investigation. J. Soc. Sci. 8 (2), 1–11.
Amruthnath, N., and Gupta, T. (2018). “A research study on unsupervised machine learning algorithms for early fault detection in predictive maintenance,” in 5th international conference on industrial engineering and applications. Singapore: ICIEA, 355–361.
Benabbou, K., Mailki, Z., Sankaran, K., and Bouzekri, K. (2019). “Machine Learning based predictive maintenance for renewable energy: the case of power plants in Morocco,” in 36th international conference on machine learning. Long Beach, CA, USA.
Bindi, M., Piccirilli, M. C., Luchetta, A., and Grasso, F. (2023). A comprehensive review of fault diagnosis and prognosis techniques in high voltage and medium voltage electrical power lines. Energies 16 (21), 7317. doi:10.3390/en16217317
Bloch, H. P., and Geitner, F. K. (1999). Chapter 3 - machinery component failure analysis. Pract. Mach. Manag. Process Plants 2 (1999), 79–256. doi:10.1016/S1874-6942(99)80005-4
Bousdekis, A., Lepenioti, K., Apostolou, D., and Mentzas, G. (2021). A review of data-driven decision-making methods for industry 4.0 maintenance applications. Electronics 10 (7), 828. doi:10.3390/electronics10070828
Breznicka, A., Kohutiar, M., Krbat’s, M., Eckert, M., and Mikus, P. (2023). Reliability analysis during the life cycle of a technical system and the monitoring of reliability properties. Systems 11 (12), 556. doi:10.3390/systems11120556
Carvalho, T. P., Soares, F. A., Vita, R., Francisco, R. D., Basto, J. P., and Alcalá, S. G. (2019). A systematic literature review of machine learning methods applied to predictive maintenance. Comput. Ind. Eng. 137, 106024. doi:10.1016/j.cie.2019.106024
Demirok, N. T., Yıkmıs¸, S., Duman, A. A., and Apaydın, H. (2023). Optimization of ultrasound-treated horsetail-fortified traditional apple vinegar using RSM and ANFIS modeling: bioactive and sensory properties. J. Food Meas. Charact., 1–16. doi:10.1007/S11694-023-02156-4/METRICS
Efetobor, U. J., Onokwai, A. O., Onokpite, E., and Okonkwo, U. C. (2024). Response surface methodology application for the optimization of biogas yield from an anaerobic Co- digestion process. Port. Electrochimica Acta 42, 205–221. doi:10.4152/pea.2024420304
Effiong, K., Onokwai, A. O., and Onifade, M. K. (2024). “Integrating maintenance practices with industry 4.0 in manufacturing system,” in 2024 International Conference on Science, Engineering and Business for Driving Sustainable Development Goals (SEB4SDG) (Nigeria: Omu-Aran), 1–5. doi:10.1109/SEB4SDG60871.2024.10630010
Gangwar, S., Mondal, S. C., Kumar, A., and Ghadai, R. K. (2024). Performance analysis and optimization of machining parameters using coated tungsten carbide cutting tool developed by novel S3P coating method. Int. J. Interact. Des. Manuf. 2024, 3909–3922. doi:10.1007/s12008-024-01852-9
Girdhar, P., and Scheffer, C. (2004). “Machinery fault diagnosis using vibration analysis,” in Book: practical machinery vibration analysis and predictive maintenance. doi:10.1016/B978-075066275-8/50005-9
Huuhtanen, T., and Jung, A. (2018). Predictive maintenance of photovoltaic panel via deep learning. IEEE Data Sci. Workshop (DSW), 66–70. doi:10.1109/DSW.2018.8439898
Izonin, I., Tkachenko, R., Shakhovska, N., IIchyshyn, B., and Singh, K. K. (2022). A Two-Step Data Normalization Approach for Improving Classification Accuracy in the Medical Diagnosis Domain. Mathematics 10 (11), 1942. doi:10.3390/math10111942
Janssens, O., Loccufier, M., and Van Hoecke, S. (2019). Thermal imaging and vibration-based multi sensor fault detection for rotating machinery. IEEE Trans. Industrial Inf. 15, 434–444. doi:10.1109/tii.2018.2873175
Jeff, H., and Sandra, B. (2004). On Intelligence: how a new understanding of the brain will lead to the creation of truly intelligent machines. USA: Times Books, 272.
Kumar, A., and Gulati, V. (2017). Experimental investigation and optimization of surface roughness in negative incremental forming. Measurement 131 (2019), 419–430. doi:10.1016/j.measurement.2018.08.078
Kumar, A., and Gulati, V. (2018). Experimental investigations and optimization of forming force in incremental sheet forming. Sādhanā 43, 159. doi:10.1007/s12046-018-0926-7
Kumar, A., Kumar, D., Kumar, P., and Dhawan, V. (2020). “Optimization of incremental sheet forming process using artificial intelligence-based techniques,” in Nature-inspired optimization in advanced manufacturing processes and systems. Editors G. M. Kakandikar, and D. G. Thakur ed. (London: CRC Press, Taylor and Francis Group), 113–130.
Kumar, N., and Kumar, H. (2022). A novel hybrid fuzzy time series model for the prediction of COVID-19 infected cases and deaths in India ISA Trans. 124, 69–81. doi:10.1016/j.isatra.2021.07.003
Kumar, A., Shrivastava, V. K., Kumar, P., Kumar, A., and Gulati, V. (2024). “Predictive and experimental analysis of forces in die-less forming using artificial intelligence techniques,” in Proceedings of the institution of mechanical engineer, Part E: journal of process mechanical engineering. doi:10.1177/09544089241235473
Kumar, K., Kumar, A., and Singh, V. (2019). “Optimization of process parameters for erosion wear in slurry pipeline,” in Advances in engineering design. Lecture notes in mechanical engineering. Editors A. Prasad, S. Gupta, and R. Tyagi (Singapore: Springer). doi:10.1007/978-981-13-6469-3_12
Lacaille, J., and Rabenoro, T. A. (2018). “Trend monitoring diagnostic algorithm for automatic pre-identification of turbofan engines anomaly,” in Prognostics and system health management conference (PHM-Chongqing). Chongqing, China, 819–823.
Lel, J. E. (2020). AHP-express: a simplified version of the analytical hierarchy process method. MethodsX 7, 100748. ISSN 2215-0161. doi:10.1016/j.mex.2019.11.021
Lin, Y., Ma, J., Wang, Q., and Sun, D. W. (2022). Applications of machine learning techniques for enhancing nondestructive food quality and safety detection. Crit. Rev. Food Sci. Nutr., 1–21. doi:10.1080/10408398.2022.2131725
Mckinsey Global Institute (MGI). Manufacturing the future: the next era of global growth and innovation.
Meshalkin, V. P., Bobkov, V. I., Maksim, D., and Khodchenko, S. M. (2017). Optimizing the energy efficiency of the chemical and energy engineering process of drying of a moving dense multilayer mass of phosphorite pellets. Dokl. Chem. 477 (2), 286–289. doi:10.1134/s0012500817120059
Mohammadi, M., Jamshidi, S., Rezvanian, A., Gheisari, M., and Kumar, A. (2024). Advanced fusion of MTM-LSTM and MLP models for time series forecasting: an application for forecasting the solar radiation. Meas. Sens. 33, 101179. doi:10.1016/j.measen.2024.101179
Munirathinam, S., and Ramadoss, B. (2014). “Big data predictive analytics for proactive semiconductor equipment maintenance,” in IEEE international conference on big data. Washington, DC, USA, 893–902.
Nawrocki, T., Maldjian, P., Slasky, S., and Contractor, S. (2018). Artificial Intelligence and radiology: have rumors of the radiologist's demise been greatly exaggerated? Acad. Radiol. 25, 967–972. doi:10.1016/j.acra.2017.12.027
Okokpujie, I. P., Kinggs, K. A., Onokwai, A. O., Adetunla, A., and Osueke, C. O. (2024). 2024 international conference on science, engineering and business for driving sustainable development goals (SEB4SDG). Nigeria: Omu-Aran, 1–24. doi:10.1109/SEB4SDG60871.2024.10630352
Okokpujie, I. P., Onokwai, A. O., Onokpite, E., Babaremu, K., Akinlabi, E. T., Osueke, C. O., et al. (2023). Modelling and optimisation of intermediate pyrolysis synthesis of bio-oil production from palm kernel shell. Clean. Eng. Technol. 16 (2023), 100672. doi:10.1016/j.clet.2023.100672
Olusanya, O. O., Onokwai, A. O., Anyaegbuna, B. E., Iweriolor, S., and Omoniyi, E. B. (2024). Modelling and optimization of operating parameters for improved steam energy production in the food and beverage industry in a developing country. Front. Energy Res. 12, 1417031. doi:10.3389/fenrg.2024.1417031
Onokwai, A. O., Ajisegiri, S. A. E., Omoniyi, E. B., Aliyu, J. S., Ibikunle, A. R., Onokpite, E., et al. (2023b). “Optimization of process parameters for intermediate pyrolysis of sugarcane bagasse for biochar production using response surface methodology,” in International conference on science, engineering and business for sustainable development goals. doi:10.1109/SEB-SDG57117.2023.10124642
Onokwai, A. O., Okokpujie, I. P., Ajisegiri, E. S. A., Nnodim, C. T., Kayode, J. F., and Tartibu, L. K. (2023a). Application of response surface methodology for the modelling and optimisation of bio-oil yield via intermediate pyrolysis process of sugarcane bagasse. Adv. Mater. Process. Technol., 1–19. doi:10.1080/2374068X.2023.2193310
Onokwai, A. O., Okokpujie, I. P., Ibiwoye, M., Ayuba, G., Owamah, H. I., and Dirisu, J. O. (2022). Effect of thermal and flow properties on the performance of Jebba-Hydropower Plant, Jebba, Nigeria. Mater. Today Proc. 65 (3), 2245–2253. doi:10.1016/j.matpr.2022.06.342
Onokwai, A. O., Okokpujie, I. P., Onokpite, E., Ajisegiri, E. S. A., Oki, M., Onokpite, E., et al. (2023c). Optimization of pyrolysis operating parameters for biochar production from palm kernel shell using response surface methodology. Math. Model. Eng. Probl. 10 (3), 757–766. doi:10.18280/mmep.100304
Ouda, E., Maalouf, M., and Sleptchenko, A. (2021). “Machine learning and optimization to predictive maintenance based on predicting failure the next ive days,” in 10th international conference on operations research and enterprise (ICORES), 192–199.
Ouyang, J., Li, Y., Zhang, Y., Wang, Y., and Wang, Y. (2022). High-temperature solid lubricants and self-lubricating composites: a critical review. Lubricants 10 (8), 177. doi:10.3390/lubricants10080177
Paolanti, M., Romeo, L., and Loncarski, J. (2018). “Machine learning approach for predictive maintenance in industry 4.0,” in 14th IEEE/ASME international conference on mechatronic and embedded systems and applications (MESA).
Pedregosa, F., Varoquaux, G., Gramfort, A., Michel, V., Thirion, B., Grisel, O., et al. (2011). Scikit-learn: machine learning in Python. J. Mach. Learn. Res. 12, 2825–2830.
Quiroz, J. C., Mariun, N., Mehrjou, M. R., Izadi, M., Misron, N., and Mohd Radzi, M. A. (2018). Fault detection of broken rotor bar in LS-PMSM using random forests. J. Int. Meas. Confed. 116, 273–280. doi:10.1016/j.measurement.2017.11.004
Sharma, P., Ghatorha, K. S., Kang, A. S., Cepova, L., Kumar, A., and Phanden, R. K. (2024). Strategic insights in manufacturing site selection: a multi-method approach using factor rating, analytic hierarchy process, and best worst method. Front. Mech. Eng. Digit. Manuf. 10. doi:10.3389/fmech.2024.1392543
Susto, G. A., Schirru, A., Pampuri, S., McLoone, S., and Beghi, A. (2015a). Machine learning for predictive maintenance: a multiple classifier approach. IEEE Trans. Industrial Inf. 11, 812–820. doi:10.1109/tii.2014.2349359
Susto, G. A., Schirru, A., Pampuri, S., Pagano, D., McLoone, S., and Beghi, A. (2015b). A predictive maintenance system for integral type faults based on support vector machines: an application to ion implantation. Automation Sci. Eng., 195–200.
Tadesse, H., Singh, B., Deresso, H., Lemma, S., Singh, G. K., Srivastav, A. K., et al. (2024). Investigation of production bottlenecks and productivity analysis in soft drink industry: a case study of East Africa Bottling Share Company. Int. J. Interact. Des. Manuf. doi:10.1007/s12008-023-01715-9
Tiago, Z., Cristiano, A., Felipe, A. Z., Gabriel de Oliveira, R., Rafael, K., and Rodrigo da Rosa, R. (2022). A predictive maintenance model for optimizing production schedule using deep neural networks. J. Manuf. Syst. 62, 450–462. doi:10.1016/j.jmsy.2021.12.013
Wakefield, K. (2018). A guide to machine learning algorithms and their applications. Available at: https://www.sas.com/en_gb/insights/articles/analytics/machine-learning-algorithms.
Wotawa, F., Kaufmann, D., and Amukhtar, A. (2021). Real time predictive maintenance model based, simulation based and Machine learning based diagnosis. Artif. Intell. Digitizing Industry, 63–79. doi:10.1201/9781003337232-6
Yan, W., and Zhou, J. H. (2017). “Predictive modeling of aircraft systems failure using term frequency-inverse document frequency and random forest,” in IEEE international conference on industrial engineering and engineering management (IEEM). Singapore, 828–831.
Yao, L., Yihai, H., Jun, A., Chengcheng, W., Xiao, H., Ruoyu, L., et al. (2022). Functional health prognosis approach of multi-station manufacturing system considering coupling operational factors. Reliab. Eng. and Syst. Saf. 219, 108211. doi:10.1016/j.ress.2021.108211
Yoo, Y., Park, S. H., and Baek, J. G. A. (2019). A clustering-based equipment condition model of chemical vapor deposition process. Int. J. Precis. Eng. Manuf. 20, 1677–1689. doi:10.1007/s12541-019-00177-y
Zhai, S., Kandemir, M. G., and Reinhart, G. (2021). Predictive maintenance integrated production scheduling by applying deep generative prognostics models: approach, formulation, and solution. Prod. Eng. Res. Dev. 16, 65–88. doi:10.1007/s11740-021-01064-0
Zhicai, Z., Dongfeng, L., and Xinfa, S. (2014). “Research on a combination of data-driven and probability-based prognostics techniques for pieces of equipment,” in Prognostics and system health management conference. Hunan.
Keywords: modelling and optimization, machine fault detection, maintenance strategies, predictive maintenance, defect detection model
Citation: Onokwai AO, Olusanya OO, Onifade MK, Anyaegbuna BE, Onoriode A and Agholor D (2024) Comparative analysis of response surface methodology and adaptive neuro-fuzzy inference system for predictive fault detection and optimization in beverage industry. Front. Mech. Eng. 10:1428717. doi: 10.3389/fmech.2024.1428717
Received: 14 May 2024; Accepted: 06 September 2024;
Published: 07 October 2024.
Edited by:
Kanak Kalita, Vel Tech Dr. RR and Dr. SR Technical University, IndiaReviewed by:
Ajay Kumar, JECRC University, IndiaInácio Fonseca, Polytechnical Institute of Coimbra, Portugal
Copyright © 2024 Onokwai, Olusanya, Onifade, Anyaegbuna, Onoriode and Agholor. This is an open-access article distributed under the terms of the Creative Commons Attribution License (CC BY). The use, distribution or reproduction in other forums is permitted, provided the original author(s) and the copyright owner(s) are credited and that the original publication in this journal is cited, in accordance with accepted academic practice. No use, distribution or reproduction is permitted which does not comply with these terms.
*Correspondence: Anthony O. Onokwai, b25va3dhaWFudGhvbnlAZ21haWwuY29t; Olamide O. Olusanya, b29vbHVzYW55YUBiZWxsc3VuaXZlcnNpdHkuZWR1Lm5n
 Anthony O. Onokwai
 Olamide O. Olusanya
 Morakinyo K. Onifade
 Benjamin E. Anyaegbuna1