 Asha Viswanath
 Diab W. Abueidda
 Mohamad Modrek3
 Rashid K. Abu Al-Rub
 Kamran A. Khan
- 1Department of Aerospace Engineering, Khalifa University of Science and Technology, Abu Dhabi, United Arab Emirates
- 2National Center for Supercomputing Applications (NCSA), University of Illinois at Urbana-Champaign, Champaign, IL, United States
- 3Department of Mechanical Engineering, Khalifa University of Science and Technology, Abu Dhabi, United Arab Emirates
Data-driven models that act as surrogates for computationally costly 3D topology optimization techniques are very popular because they help alleviate multiple time-consuming 3D finite element analyses during optimization. In this study, one such 3D CNN-based surrogate model for the topology optimization of Schoen’s gyroid triply periodic minimal surface unit cell is investigated. Gyroid-like unit cells are designed using a voxel algorithm and homogenization-based topology optimization codes in MATLAB. A few such optimization data are used as input–output for supervised learning of the topology-optimization process via the 3D CNN model in Python code. These models could then be used to instantaneously predict the optimized unit cell geometry for any topology parameters. The high accuracy of the model was demonstrated by a low mean square error metric and a high Dice coefficient metric. The model has the major disadvantage of running numerous costly topology optimization runs but has the advantages that the trained model can be reused for different cases of TO and that the methodology of the accelerated design of 3D metamaterials can be extended for designing any complex, computationally costly problems of metamaterials with multi-objective properties or multiscale applications. The main purpose of this paper is to provide the complete associated MATLAB and PYTHON codes for optimizing the topology of any cellular structure and predicting new topologies using deep learning for educational purposes.
1 Introduction
Metamaterials have recently emerged as a “holy grail” for material scientists as these possess abundant physical properties and versatility in various fields (mechanical, thermal, acoustic, optical, electromagnetic, and biomedical) (Engheta and Ziolkowski, 2006). The mechanical properties of these materials as studied by engineers show promise because of their unique architectures, which can be tailored to any desired geometry, thus enhancing the properties of the structure beyond the capabilities of the material (Yu et al., 2018). An attractive feature of these materials is that their extreme properties can be topologically controlled.
The microstructure of the base unit of these materials, referred to as the representative unit cell (RUC), determines their mechanical and physical properties (Jacob, 1991). The design of the RUC of metamaterials satisfying some desired properties is called the “inverse design” problem and has been performed through experiments and/or topology optimization (TO) (Osanov and Guest, 2016). TO’s aim is to obtain optimal layouts of the microstructure for a desired objective function of a metamaterial such as maximizing the bulk/shear moduli or minimizing Poisson’s ratio, subject to constraints such as volume constraints (Neves et al., 2000). This area of research has been extensively studied in 2D (Xia and Breitkopf, 2015). Gao et al. studied both 2D (Gao et al., 2019a) and 3D microstructures for which MATLAB codes are also available (Gao et al., 2018). An initial design of the microstructure may or may not be used. Some of the initial designs used in the literature consist of simple designs with a hole at the center or a few distributed voids, which after TO give new topologies that satisfy the desired objective (Gao et al., 2019a).
Triply periodic minimal surface (TPMS), a concept from differential geometry, is one of the topologies adopted for the RUC of micro-structured materials. These surfaces minimize the local surface area for a given boundary and possess the property of the mean curvature being zero at every point on the surface (Torquato and Donev, 2004). They divide the unit cell domain into two or more non-intersecting domains. What makes them attractive is their fascinating topologies when repeated periodically in 3D. TPMS can be mathematically controlled and exhibits several unique properties, such as a large surface-area-to-volume ratio (Al-Ketan and Abu Al-Rub, 2019). Advances in the manufacturing industry, such as the use of additive manufacturing (Gardan, 2016), have also facilitated their fabrication, which was previously a major inhibition of their usage with traditional methods. Many studies have dealt with designs of TPMS structures based on experimental studies of their properties due to their geometry, as reviewed by Al-Ketan and Abu Al-Rub (2019). The current study addresses a specific TPMS of the gyroid structure. Gyroid TPMS structures are used in various applications, including orthopedic implants, due to their efficient load transfer, continuous filling of void space (Yang et al., 2019b), and catalytic converters due to efficient heat transfer through void space (Al-Ketan et al., 2019). Gyroid structures are also found in nature in soap films (Schoen, 1970) and butterfly wings (Michielsen and Stavenga, 2008). The current study proposes a novel method of designing gyroid-like unit cells for desirable mechanical properties subject to boundary conditions and a volume constraint using TO. It starts with the gyroid structure as the initial design and then optimizes it for a specific objective function to yield a gyroid-like structure with optimized properties. The novel approach discussed in this work captures the surface geometry of TPMS in a voxel form; when subjected to TO, the resulting design is similar to a gyroid but may not possess a zero property of mean curvature at all points. Thus, an initial design of a voxelized gyroid isosurface is subjected to TO to obtain a gyroid-like final structure with an improved material distribution that satisfies the desired objective and volume constraints.
The major challenge faced during 3D unit-cell design using the above approach is the computational time taken for TO, which exponentially increases with the number of finite elements or mesh size (number of voxels in this study) of the unit cell. For example, a mesh of 32 elements in all three dimensions takes approximately 67 s on a workstation for a single iteration of the optimization process, which may take approximately 200–800 iterations to converge. To alleviate this computational cost, an alternative model to the optimization process is required that can use information from a few optimization runs and can consequently be used as a computationally cheap alternative for unit cell design. Recently, machine learning models have emerged as surrogate models for simplifying computationally intensive designs and making design possible even on laptops. Among these, deep learning (DL) models were used to predict composite properties beyond elastic limits (Yang et al., 2019a) to predict path-dependent plasticity (Mozaffar et al., 2019), for plasticity and thermo-viscoplasticity (Abueidda et al., 2021a), for constitutive modeling of plastic deformation of open-cell foams (Settgast et al., 2019), for predicting effective thermal conductivity of composites (Rong et al., 2019), computational material design of flexoelectric nanostructures with TO (Hamdia et al., 2019), predicting fatigue behavior (Spear et al., 2018), predicting stress–strain curves of composites’ microstructures (Yang et al., 2020), developing networks for advanced composite manufacturing (Goli et al., 2020), and in meshless physics-informed methods (Abueidda et al., 2021b). These have inspired the researchers to use the DL model in the context of TO for designing TPMS based metamaterials. DL models based on 2D convolutional neural networks (CNNs) have been used in applications such as TO for 2D unit cell generation (Kollmann et al., 2020), for non-linear 2D structure generation (Abueidda et al., 2020), and for mechanical properties of composites (Abueidda et al., 2019a). CNNs are robust in image recognition tasks, and this advantage has been exploited to quantitatively predict the mechanical properties of composite structures over the entire volume fraction space by using checkerboard composites as image inputs to CNNs (Abueidda et al., 2019a). Inspired by such research, this study extends these CNN-based models to predict 3D unit cell TO design. Little of the literature has dealt with DL for 3D TO of 3D TPMS structures: for high resolution TO of lattice structures in Liu and Li (2023); optimization for superior mechanical properties of plate TPMS lattices (Wang et al., 2024); TO for maximizing bulk modulus performed by the authors (Viswanath et al., 2021). This study builds upon our previous findings (Viswanath et al., 2021) in two ways: 1) our previous work dealt only with a single TO parameter of volume fraction and the objective function of bulk modulus, and 2) the optimal densities did not follow a 0–1 configuration and hence were not learned well by the CNN algorithm, resulting in a high mean-square error for the CNN model. This study focuses on this gap in our previous work and proposes the potential applications of using such accelerated 3D TO for the unit cell design of gyroid TPMS. It is known that parallel-based large-scale TO methods are already quite mature as alternatives to data-driven surrogate models, but the purpose of this paper is educational and to provide PYTHON codes for data-driven modeling for computationally costly optimization problems, which can be extended/utilized for other complex time consuming optimization techniques. Hence, the methodology of how 3D DL models successfully model the TO of a gyroid with minimal error and provide the associated codes for researchers to extend and utilize to other challenging problems is discussed.
The structure of the paper is as follows. Section 2 explains the methodology of generating gyroid-like structures for unit cell geometry and design using 3D homogenization-based TO. Section 3 elaborates the surrogate DL model and describes the data generation procedure and the architecture of the 3D CNN network used. Section 4 lists the different errors encountered in various approximations in this study and how they are accounted for. Section 5 discusses the results obtained from the proposed model. The last section summarizes the insights gained from this model and future directions in this research.
2 Methodology
2.1 Voxel-based architecture of gyroid TPMS
A gyroid unit cell, especially in sheet-based form, offers enhanced properties in terms of strength and energy absorption characteristics compared to other TPMS such as Primitive and IWP structures (Abueidda et al., 2019b). A uniaxial modulus of 250 MPa, strength of 10 MPa, and energy absorption of 2,500 kJ/m3 for a gyroid lattice of 4 × 4 × 4 unit cells of 40% relative density compressed to 25% strain at a strain rate of 0.01 s−1 is recorded in Abueidda et al. (2019b). Network and matrix phase gyroid lattice structures develop bandgaps below 15 kHz, whose bandwidth can be tuned by adjusting volume fraction and cell sizes, while other TPMS-like diamond lattices do not (Elmadih et al., 2019). A normalized permeability of 0.0015, a normalized effective diffusivity of 0.4, and a normalized effective thermal conductivity of 0.25 with void phase conductivity of 1 Wm−1K−1 and solid phase conductivity of 100 Wm−1K−1 is exhibited by a gyroid unit cell of 60% porosity (Luo et al., 2020).
The generation of a gyroid microstructure for the current study is discussed here. Figure 1A shows the isosurface of a gyroid structure along with its unit cell and periodic structure (Figure 1B). This surface is generated from the level set approximation equation:
where c denotes the level set value, which can be a constant or a function of x, y, and z. Lx, Ly, and Lz are unit cell lengths in the three directions.
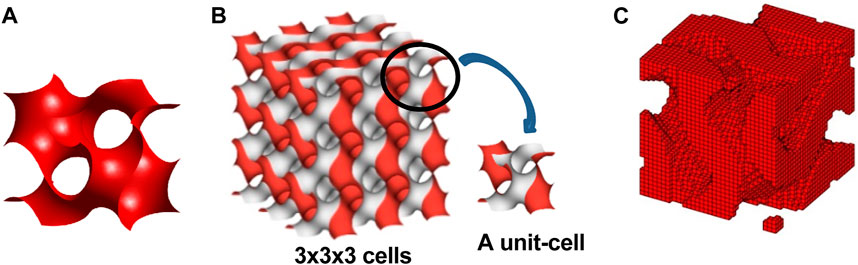
Figure 1. (A) Isosurface of the gyroid with c = 0, (B) RUC of a gyroid along with the periodic structure (Al-Ketan and Abu Al-Rub, 2019), and (C) voxelized gyroid RUC.
For this study, the isosurface is generated from Equation 1 with c = 0 and Lx, Ly, and Lz = 1 passed to a voxel generation algorithm—the MATLAB codes available in the literature for cellular structures (Dong et al., 2018) are modified for this study for generating voxelized forms of TPMS—by passing the vertices’ and edges’ information of the isosurface. For more information about this procedure, see the supplementary material which includes the MATLAB code and an explanation of the procedure. The voxelized RUC (Figure 1C) is generated with a mesh size of 32 voxels in each direction. Each voxel is given a value of 1 (red) if any part of the isosurface edge (obtained from isosurface information) passes through that voxel; otherwise, it is given the value 0 (white) to indicate the void space inside the gyroid. The thin isosurface is thus thickened by the voxel algorithm due to the crisscross connections of the edges–vertices defining the isosurface. Figure 2 shows few cross sections at different levels to inspect the edges of the structure inside. These 2D slices (cross sections) help visualize how the curved interior edges of the gyroid are approximated by the 32 × 32 voxels (squares in each 2D figure). The relative density of 58.7% will be obtained by calculating the number of black voxels divided by the total number of voxels (32 × 32) in each 2D slice. This figure is taken from the 1st, 4th, 8th, 16th, and 32nd slice of a 32 × 32 × 32 cube of whole gyroid structure.
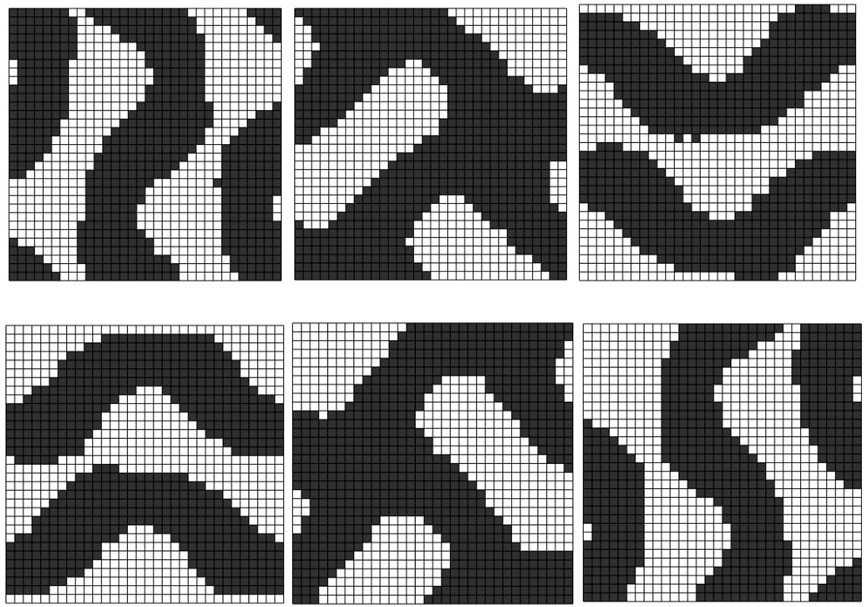
Figure 2. 1st, 4th, 8th, 16th, 24th, and 32nd 2D slices of the voxelized gyroid RUC.
Using this 3D gyroid microstructure as the initial design, the optimal gyroid RUC can be designed using a 3D homogenization-based TO approach to maximize either the bulk or shear modulus (Gao et al., 2018). The broad advantage of using such a voxelized discretization of a smooth surface will eventually be clearer when the concept of a CNN is introduced for learning RUC with such a geometry.
2.2 3D homogenization-based TO
This study employs a homogenization-based TO approach to microstructure design to design TPMS metamaterials optimized for either the maximum bulk or shear modulus (Gao et al., 2018). The homogenization method for periodic cellular materials or composites calculates their effective properties within the linear elastic regime (Guedes and Kikuchi, 1990) using RUC and periodic boundary conditions. As the RUC represents continuously periodic cells in all three dimensions, a periodic boundary condition only can simulate the effect of adjoining cells for the RUC. This effective property of the RUC is subsequently used in the TO algorithm, which maximizes or minimizes a desired objective function. The TO algorithm used for homogenized RUC is the density-based solid isotropic material penalization (SIMP) approach (Bendsøe, 1989; Sigmund, 2007), as the proposed voxelized geometry of the unit cell facilitates the calculation of densities with each voxel acting as a finite element in the SIMP approach. The MATLAB code associated with the 3D TO is available at Gao et al. (2019b) and was modified for this research. The energy-based homogenization method is briefly discussed here.
Given a unit cell volume
The expanded form of the homogenized stiffness tensor in Equation 3 (Gao et al., 2018) is
The SIMP algorithm in TO is then applied to the homogenized RUC. The element density ρe ϵ [0, 1] of each finite element is the design variable, and the element Young’s modulus constituting
where
where
where K is the global stiffness matrix,
The objective function in Equation 7 used in this work is to maximize the bulk modulus (Equation 8) and shear modulus (Equation 9) given by Gao et al. (2018):
The sensitivities are calculated using the adjoint method expressed as
The densities can be adjusted to 0 or 1 solution with the use of a Heaviside filter (Guest et al., 2004). This approach can be particularly useful when dealing with machine learning methods later in the work, as a 0–1 morphology is easier to learn than one with intermediate densities. This filtering introduces a Heaviside step function into the density filter using the following smoothing function such that the physical density ρe = 1 if ρe > 0 and zero if ρe = 0:
Here, the parameter β controls the smoothness of the approximation. When β = 0, Equation 11 is similar to Equation 6 and, as β tends to infinity, the approximation approaches a true Heaviside step function. To avoid local minima and to ensure differentiability in the optimization, a continuation scheme is used to gradually increase β from 1 to 512, doubling it every 50 iterations or when the change between variables in two consecutive designs becomes less than 0.01.
The 2D slices of voxels corresponding to the optimized geometry are shown in Figure 3. The voxelized gyroid RUC are smoothened using the top3d app software (top3d, 2022), and varying relative densities are displayed in Figure 4.
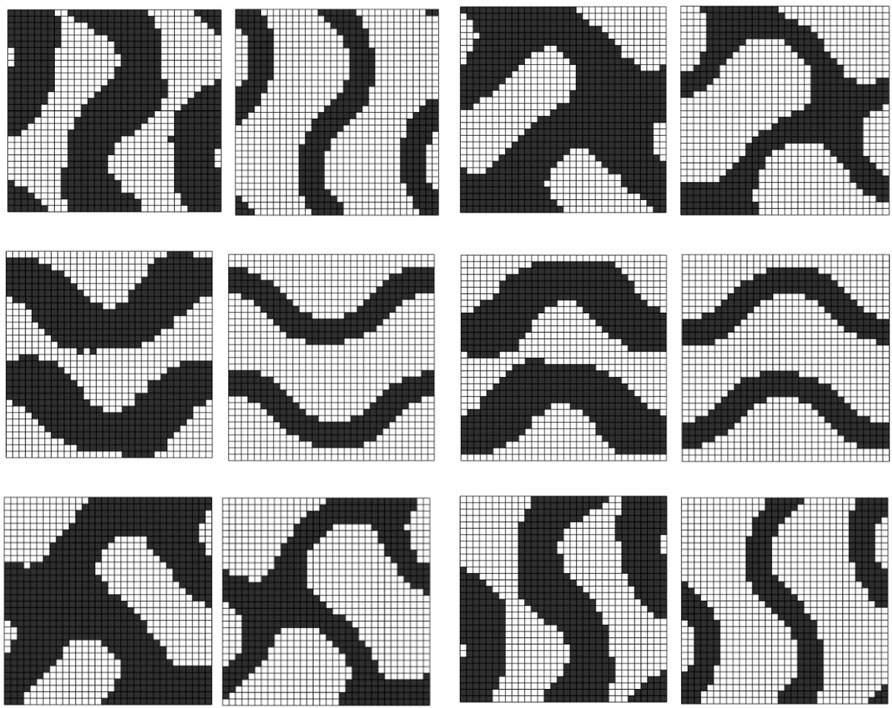
Figure 3. 1st, 4th, 8th, 16th, 24th, and 32nd 2D slices of the initial and optimized (34%) voxelized gyroid RUC.
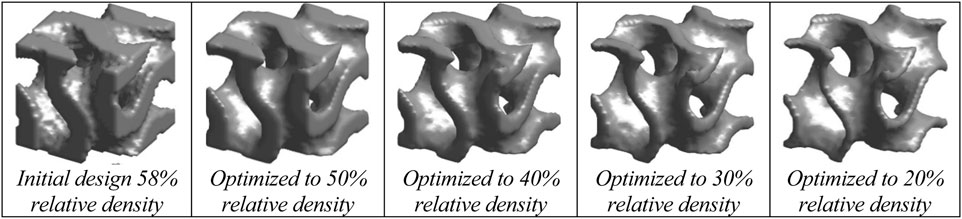
Figure 4. Optimized and smoothened voxelized gyroid RUC for various relative densities.
3 Surrogate DL model
The homogenization-based TO of the voxelized gyroid RUC described in the previous section has one lacuna: its computational time. This is indeed one of the major challenges in any 3D unit-cell design—the computational time exponentially increases with the mesh size (number of voxels in this study) of the unit cell. When the objective becomes time-consuming, the “curse of dimensionality” sets in (Bellman, 1961), and it becomes essential to seek alternative ways of determining the objective functions. The method of surrogate modeling (Myers et al., 2016) appeals in such situations when cheaper alternatives can be employed to perform objective function evaluations. These models can learn from the information provided from a few optimization runs to replicate the process and can consequently be used as computationally cheap alternatives for optimizing unit cell design. Recently, data-driven models have proven to be effective surrogate models for simplifying such computationally intensive designs through the use of training–learning algorithms. Among the vast literature on such data-driven models, in this study the CNN-based model was chosen because this class of deep neural networks has proven very successful in image recognition when images are in the form of pixels in 2D and voxels in 3D. Hence, the broad purpose of generating gyroid RUC through the voxel algorithm has become more meaningful.
This section details the building of a DL-based model as a surrogate for the TO of the gyroid microstructure given any volume fraction or filtering radius. These two TO parameters were chosen from a similar study in 2D TO of metamaterials (Kollmann et al., 2020) which showed that these parameters affect the mechanical properties of the designed microstructure. The DL model predicts the optimal 3D gyroid unit cell which possesses the maximum bulk/shear modulus for the specified volume fraction and filtering radius—without the need for any traditional TO. This is achieved by training the DL CNN model with a few optimized topologies corresponding to different random volume fractions and filtering radii. However, this training requires data to be generated through many TO runs, which is the cost paid for later alleviating TO runs for design.
3.1 Design of experiment (DoE) for data generation
The flowchart of the workflow is shown in Figure 5. The required data is computationally generated from MATLAB runs of the code containing 3D TO of homogenized properties as described in the previous section. As the flowchart indicates, the isosurface of the gyroid is first generated from Equation 1. Here, c = 0, and a unit cell size is used. The isosurface is then voxelized by discretizing the unit cell into 3D finite elements (each element is called a voxel) and assigning a density of 1 to each voxel if the isosurface passes through the voxel and 0 if the voxel does not have any part of the isosurface. These voxel densities are used as an initial design for the TO problem to maximize the bulk or shear modulus. Two optimization parameters are studied here: the volume fraction (Vf) in the range of 25%–45% and the filtering radius (rmin) of the optimization in the range of 1.2–2.5 cm. These parameters are chosen based on previous 2D metamaterial TO studies (Kollmann et al., 2020). To generate the data, these two factors are designed in a factorial design and data points are generated for each pair of values (Table 1). The table shows the number of data points in the center and the corresponding value of the volume fraction on the left side and the filtering radius on top of any selected data point number. For example, data point 1 has a volume fraction of 25% and a filter radius of 1.2 cm. Two such tables are created for both the bulk modulus and shear modulus maximization objective.
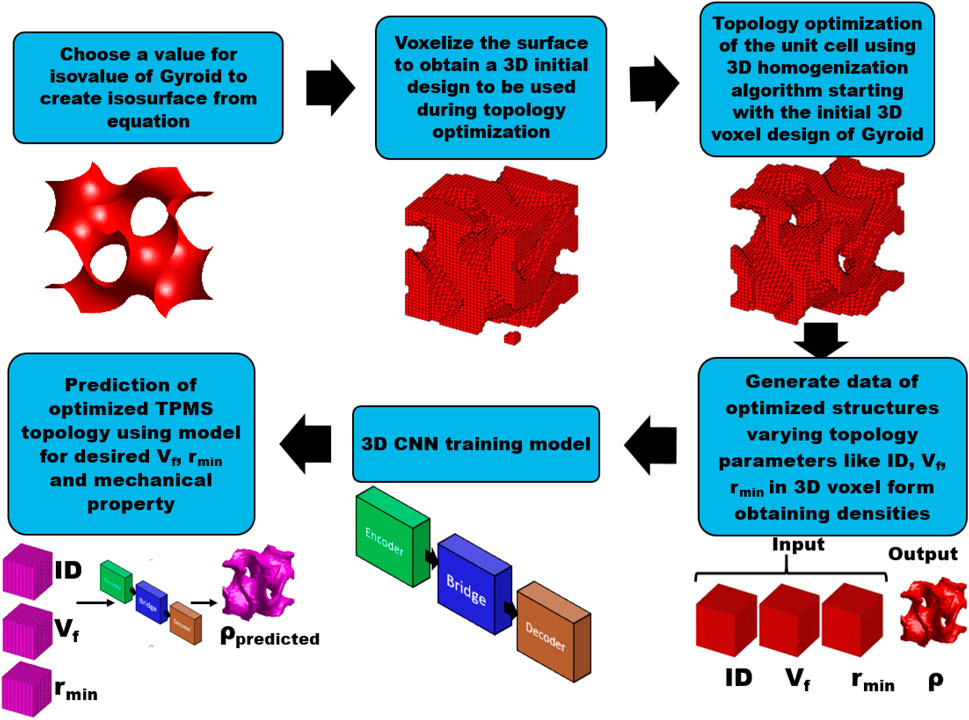
Figure 5. Flowchart of the data generation and prediction process.
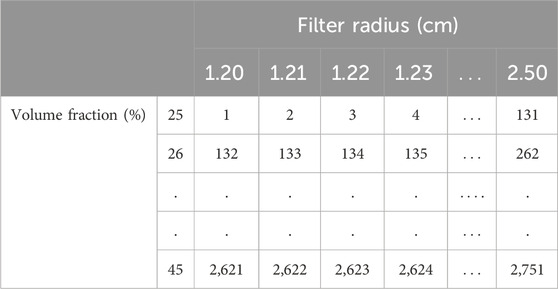
Table 1. Data points table indicates values of the volume fraction, Vf, and filter radius rmin for each data point.
A finite element mesh of 32 × 32 × 32 was chosen for the unit cell dimensions of 1 cm × 1 cm ×1 cm. The FE model is a 3D eight-node brick element with 6 d.o.f per node whose associated element stiffness matrix
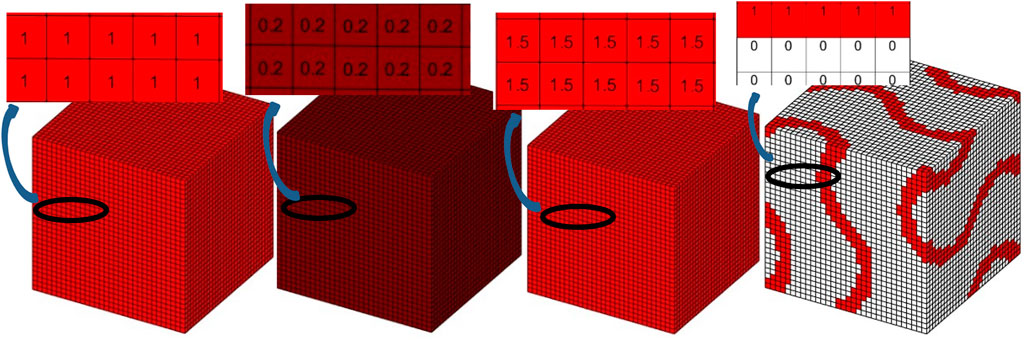
Figure 6. One sample data point: voxels for bulk modulus maximization ID, a volume fraction of 20%, and a filter radius of 1.5 were used as inputs, and the corresponding optimized densities were used as outputs.
The range of optimization parameters was chosen on the basis that the volume fraction of interest in cellular solids ranged from 25% to 45% while the filtering radius was chosen based on studies of different values ranging from 1 to 10. Figure 7 shows the shapes of a TO result for a 40% volume fraction for various values of rmin. It was found that large radius filter values lead to reduced effective properties; hence, the maximum filter radius considered in this study is 2.5 cm. Additionally, the value of rmin = 1 gives a checkerboard pattern (Sigmund and Petersson, 1998); hence, the limits were fixed at 1.2 cm–2.5 cm.
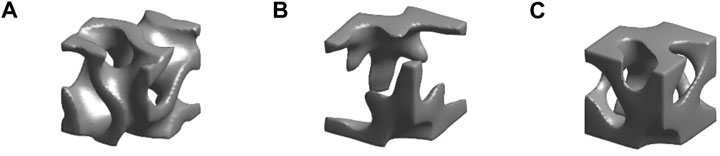
Figure 7. Optimized topologies for a volume fraction of 40% for different filtering radii of (A) 3 cm, (B) 5 cm, and (C) 8 cm.
3.2 Network architecture
This work extends the CNN model employed to predict optimized 2D metamaterials in Kollmann et al. (2020) to 3D metamaterials. An encoder–decoder network proposed by ResUnet (Zhang et al., 2018), which is a semantic segmentation neural network taking advantage of both residual learning and U-net (Ronneberger et al., 2015), is used for the model. This approach allows the network to include both of their strengths. This motivates us to use our pixel-based geometry to learn the property and the related gyroid RUC geometry (densities) such that, for any desired property, the model predicts the geometry. The architecture (Figure 8A) is similar to a U-Net (thus called due to the U-shape of the blocks) with residual blocks instead of neural units as its building block, and hence referred to as “ResUNet”. The architecture can be divided into an encoder part, which encodes the input images into a low-dimensional representation by a series of convolution layers, and a decoder part, which receives the encoded images from the third bridge connecting the encoder to the decoder, constructing the RUC. The concatenation feature, shown by the dotted lines in Figure 8, improves the segmentation accuracy. ResUNet uses batch normalization (BN), rectified linear units (ReLU), and convolutional layers (Conv), whereas U-Net uses only ReLU and Conv in the building block. Four blocks of encoder and decoders are used, with each building block shown in Figure 8B. The advantage of this ResUnet over U-net is the concatenation of links between the encoder and decoder which helps preserve features (Kollmann et al., 2020).
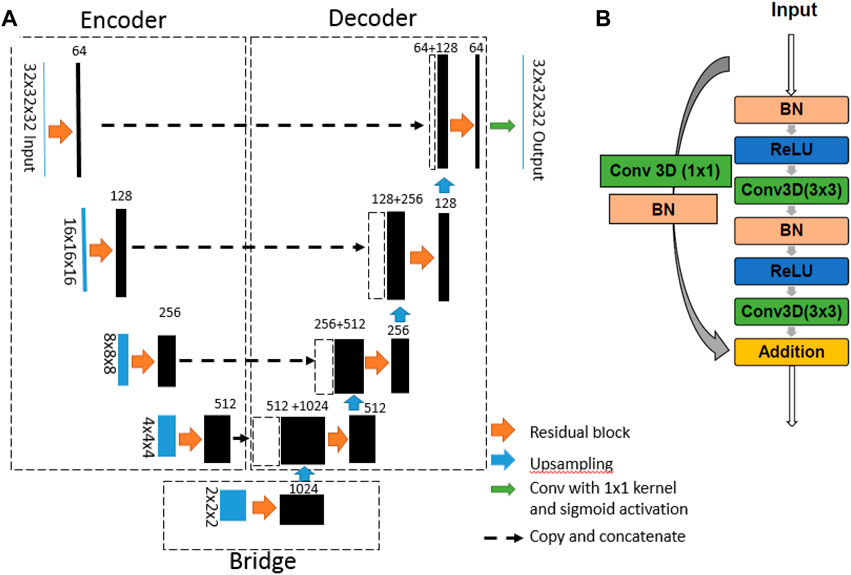
Figure 8. (A) ResUNet architecture. The filter sizes are written over each filter (black) while changes in the 3D input (blue) are written on the sides. (B) Residual block.
The values of the TO parameters Vf and rmin and an identifier (ID) for the desired mechanical property (here, 1 for the maximum bulk modulus and 2 for the maximum shear modulus) are converted into 3D matrices (images) assigning the same value to all voxels illustrated in Figure 6. The CNN model takes these input 3D images of Vf, rmin, and ID, along with the output 3D image of the corresponding topology optimized densities, and uses this information to train its weights. Once the training phase is complete, the CNN model is ready to predict the desired microstructure topology corresponding to any property given to it (Figure 9).
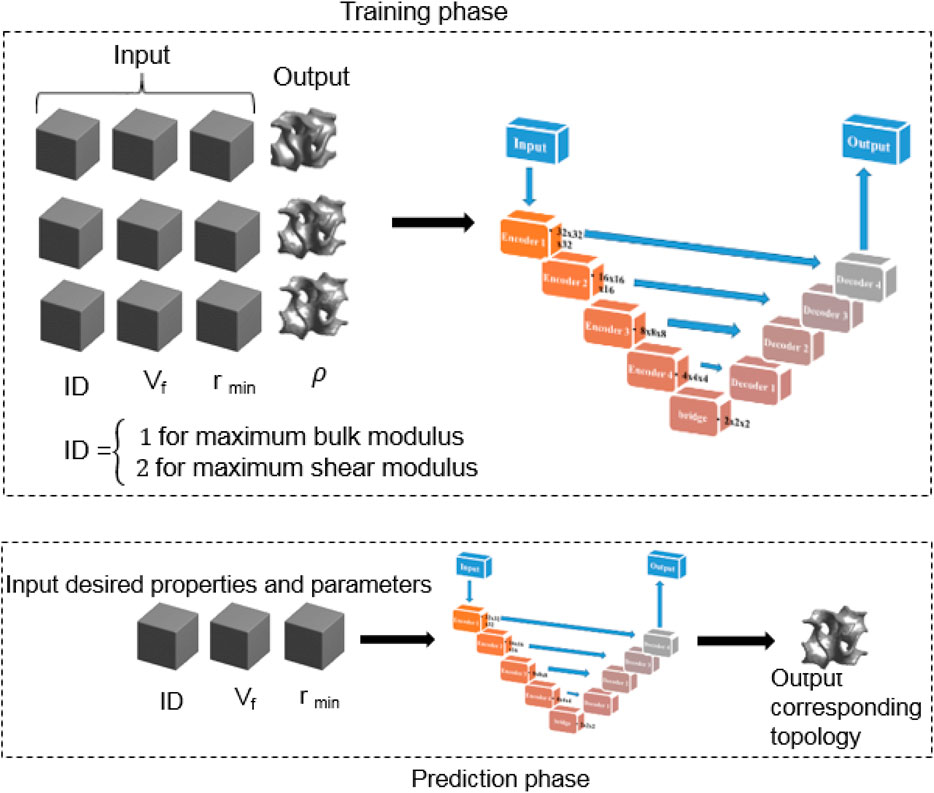
Figure 9. Training and prediction phases of the proposed 3D CNN.
The dataset generated consists of 2,751 data points, each of which contains an identifier for the objective, the volume fraction, the filter radius, and the optimized topology (Figure 5). The computations were time-consuming and were performed on the IBM HPC with hardware specifications: two 12-core Intel Xeon E5-2695 v2 (Ivy Bridge) CPUs, two NVIDIA K20M GPUs, and 264 GB of main memory, and on the iForge HPC cluster hosted at the National Center for Supercomputing Applications (NCSA) which consists of Intel/Skylake nodes, each with 40 cores and 192 GB of RAM, and a couple of nodes equipped with NVIDIA v100 GPU cards. The CNN model was developed using Keras with the Tensorflow backend (Abadi et al., 2016). The hyper parameters used are batch-size: 128, learning rate: 0.001, Adam optimizer, and 150 epochs. Usually, a large dataset is required for fast convergence, but since the computational cost of TO is high, a small dataset size is chosen to analyze the results. The computational times for the entire process are shown in Table 2. For each data point generation on a core on a node of the HPC, 2.4 h are needed, which, multiplied by 2,751 data points, would have been a herculean task. However, by modifying the MATLAB code using job arrays to split and generate all the data points in parallel—as each TO run is independent of each other—the data generation is split into ten data points per MATLAB simulation, requiring only 275 runs for the entire data generation. This is achieved with 200 runs on five nodes of 40 cores on iForge and 75 runs on one node of 26 cores on IBM, taking in total only 24 h for complete data generation. The times required for dataset generation on a personal computer and on an HPC are also compared in Figure 10. As indicated in the table, the DL training to calculate the weights and biases requires only 5.5 GPU hours. Once the DL model is properly trained and validated, the predictions of topologies for new input parameters can be obtained accurately and almost instantly, even on a laptop and without any modeling software. This is the greatest advantage of using surrogate DL models.
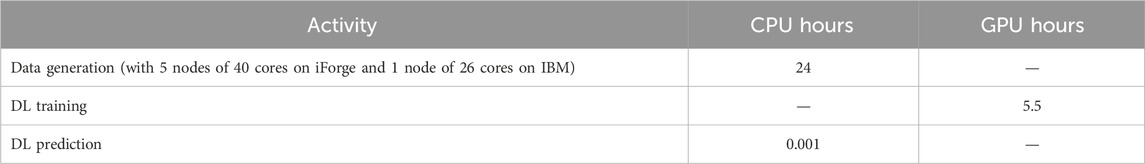
Table 2. Computational time taken for HPC.
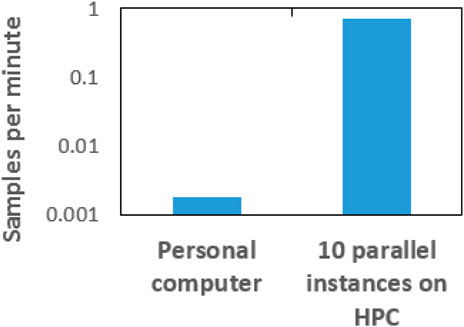
Figure 10. Data generation rates on workstations versus HPCs.
3.3 Model evaluation
The CNN model was evaluated for its ability to predict ground truth data using the mean square error (MSE) metric (Equation 12) as the loss function of the model and the mean dice similarity coefficient (DSC) metric (Equation 13) for flattened 3D voxels (Abueidda et al., 2020). The MSE measures how much the predicted topology deviates from the ground truth, with smaller values of MSE preferred. The DSC compares the predicted topology image with the ground truth topology image and gives the measure of how many voxels match in both. Therefore, a higher DSC is preferred because it would suggest a greater match between the ground truth and prediction.
These metrics are evaluated using the following expressions for M data points, T the ground truth segmentation of input channel I, and O the CNN model segmentation:
4 Error analysis
Various approximations used during the modeling of the unit cell and its simulations introduce various errors into the model developed for the gyroid RUC, and this will also affect the CNN modeling of the unit cell. Hence, a detailed error analysis is carried out to study all these errors and suggest methods to minimize their effect on the surrogate modeling.
4.1 Error in the geometric modeling of isosurfaces
An isosurface is created with different mesh points, and the number of mesh points can introduce the first discretization error. Figure 11 shows an isosurface with various mesh points, for which the surface is visually best captured by a minimum of 15 points. This is not the FE mesh which is used to voxelize the isosurface later but instead is the mesh points used to generate the isosurface from Equation 1. Mesh sizes of 5, 10, 15, 20, and 32 were used to generate surfaces from which voxelized cubes using 32 voxels (selection criteria discussed in the next section) in each of three directions were generated, and the relative densities of each of these 32 × 32 × 32 cubes were compared. The difference in relative densities converges after 15 mesh points, indicating that the actual relative density of the thickened isosurface is captured. Thus, 15 was chosen as the mesh size to generate an isosurface of c = 0, which was voxelized for analysis.
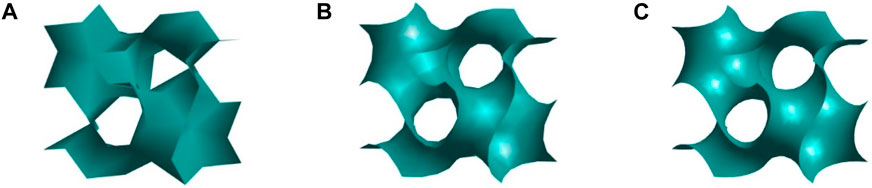
Figure 11. Isosurfaces generated with (A) 5, (B) 10, and (C) 15 mesh points.
4.2 Error in voxelizing surface geometry
The CNN modeling requires 3D input images with voxels chosen as powers of 2–8, 16, 32, 64, and so on. Hence the voxel size of RUC (or finite element size) was chosen by performing homogenization-based TO and choosing a mesh size beyond which there was convergence to the homogenized matrix and compliance of the structure. An element size of 8 was discarded, as it was less than the mesh points of the isosurface (15 chosen in the previous section). Since analysis is used to obtain the best mechanical properties, the value of the bulk modulus and shear modulus can be studied for both 16 and 32 voxel sizes. The 32 finite element models had lower compliance and higher bulk modulus and shear modulus values with 60% relative error than did the 16 finite element models, even though the former were computationally expensive. Further examination with a 64-mesh size showed no improvement in objective functions from 32, which was hence the final choice for the voxel size as it considerably improved the mechanical properties from smaller finite element sizes and was also twice the mesh points (15) used to generate the isosurface.
4.3 Sampling error
A small sample size of 2,751 data points is bound to create modeling errors in the CNN model, which requires a large dataset for training. This problem is foreseen while choosing data-driven modeling; hence, remedial measures of bootstrapping and cross-validation can resolve such issues. The mean square error metric indicates such lacunae, which can be remedied if needed. A full factorial DoE is more suitable than a random set of data for such a case of low sample size, since it ensures all the values of the input parameters are represented in the dataset.
4.4 Errors in fitting the CNN model
To prevent the issue of over- or under-fitting, the loss function (here the mean square error metric) and the dice coefficient metric are studied for both the training and validation sets. The data are thus split into training set, testing set, and a validation set. A low training set error indicates that there is no under-fitting, but a low validation set error is also required to show that overfitting has not occurred. Hence, both these errors are monitored. In addition, a low testing set error indicates a low generalization error.
5 Results and discussion
The gyroid microstructure of 32 × 32 × 32 voxels must be the first topology optimized using the MATLAB code starting from an initial high-density gyroid microstructure design. This initial design not only helps guide the TO toward the required topology but also helps in faster convergence. The resulting topology optimized designs obtained for objective functions of the bulk modulus and shear modulus are shown in Figure 12. The range of optimized topologies preserves the gyroid-like structure, hence resembling the initial design, which is desired, reducing only the volume fraction according to the given volume constraint. As the filtering radius increases, the objective function decreases, and with a very low filtering radius the optimization does not converge for low volume fractions. Few topologies from the data sample corresponding to the maximum bulk objective are shown for different values of the volume fraction and filter radius (2–6 in Figure 12). The topologies corresponding to a very low filter radius show hollow sections in the gyroid (1 in Figure 12). For example, for a 25% volume fraction, the topology corresponding to a filter radius of 1.4 cm for the bulk modulus objective and 1.2 for the shear modulus objective has hollow parts in their topology and, hence, undesirable designs which are discarded from forming the DL dataset.
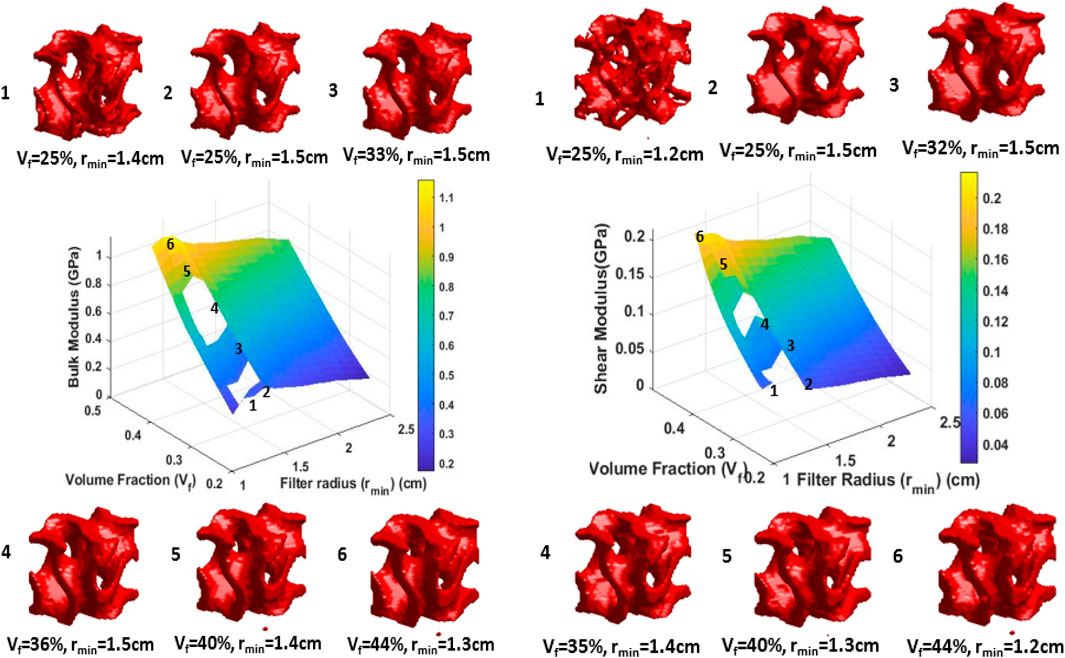
Figure 12. Topology optimized objective function surfaces for different combinations of volume fractions and filter radii and the corresponding gyroid unit cells at few combinations.
To maximize the objective functions, a filtering radius value of approximately 1.5 cm was ideal for low volume fractions, whereas a filtering radius of 1.3 was ideal for higher volume fractions. A higher volume fraction led to higher objective values, as expected. A few combinations of volume fraction and filtering radii did not converge. The gaps in the surface show values for which the TO did not converge after 1,000 iterations and hence were discarded from the dataset. These voids are indicated by gaps in the surface in the figure. Hence, out of 2,751 data points, the final training dataset consisted of 2,597 datapoints whose bulk modulus was maximized and 2,741 data points whose shear modulus was maximized. Each datapoint included the identifier indicating the objective (maximizing shear or bulk), volume fraction, the filtering radius, and 32 × 32 × 32 density. The objective function data points were mixed and shuffled for the training dataset. The data were split into 90% training data, 5% validation data, and 5% testing data.
Next, after choosing the optimized dataset, this dataset was subjected to the DL process as described above. Once the trained model was obtained, it had to be tested for its accuracy by prediction phase. The effectiveness of the DL method used for learning the 3D gyroid topologies optimized for the maximum bulk modulus and maximum shear modulus was tested by measuring loss function of the model-MSE, (Figure 13A). The convergence of the MSE occurs approximately 100 epochs, even with a small dataset. The other metric for measuring effectiveness of how well the learned model could reproduce the gyroid shape was by measuring DSC. The mean DSC history (Figure 13B) also indicates a 95% match between the predicted and ground truth topologies after approximately 100 epochs. This was also possible partly because of the use of the Heaviside filter (Guest et al., 2004) in TO, which pushes the density values to either 0 or 1; this helped the CNN model learn the density image faster as either black or white rather than having intermediate densities. This approach improved the mean DSC of the dataset. Figure 13 also indicates that the difference between the validation and training errors is very small, indicating that there is no over- or under-fitting. A few comparisons of the ground truth and CNN predicted topologies obtained from the testing set, corresponding to filter radii of 1.2, 1.5, 1.8, 2.2, and 2.5 for volume fractions of 25%, 35%, and 45%, respectively, are shown in Figures 14, 15. As is visually noted, the low filter radius for low-volume fractions gave discontinuities in topologies which were not efficiently learned by the CNN model, while it performed exceptionally well for higher filtering radii for all volume fractions. The MSE for the testing set was found to be 0.0079, indicating a low generalization error. The mean deviation of the volumes of the predicted structures from the ground truth was evaluated for this test set and found to be 0.24%. Among these, the highest deviation in volume was shown by a structure with a 29% volume fraction and a 1.35 cm filter radius optimized for the shear modulus, for which the absolute error in volume was 1.73%. The lowest deviation in volume was shown by the 40% structure-to-volume fraction and 1.41 cm filter radius optimized for the bulk modulus, for which the error was 7.6e-4%.
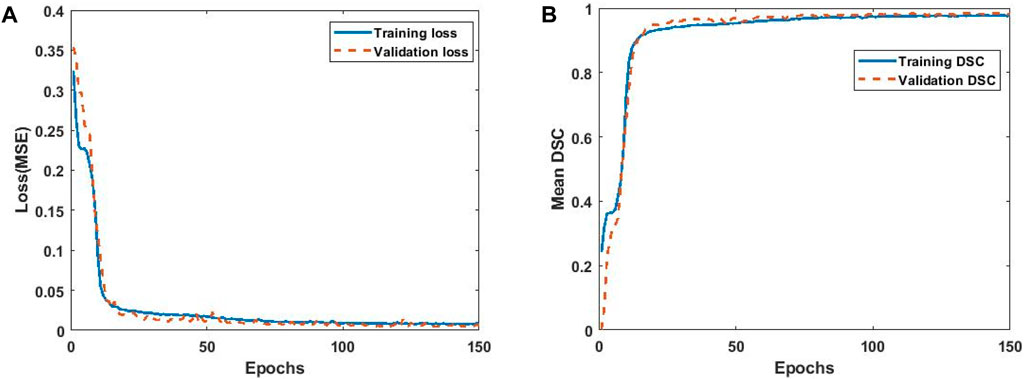
Figure 13. (A) MSE convergence and (B) mean dice similarity coefficient, against the number of epochs.
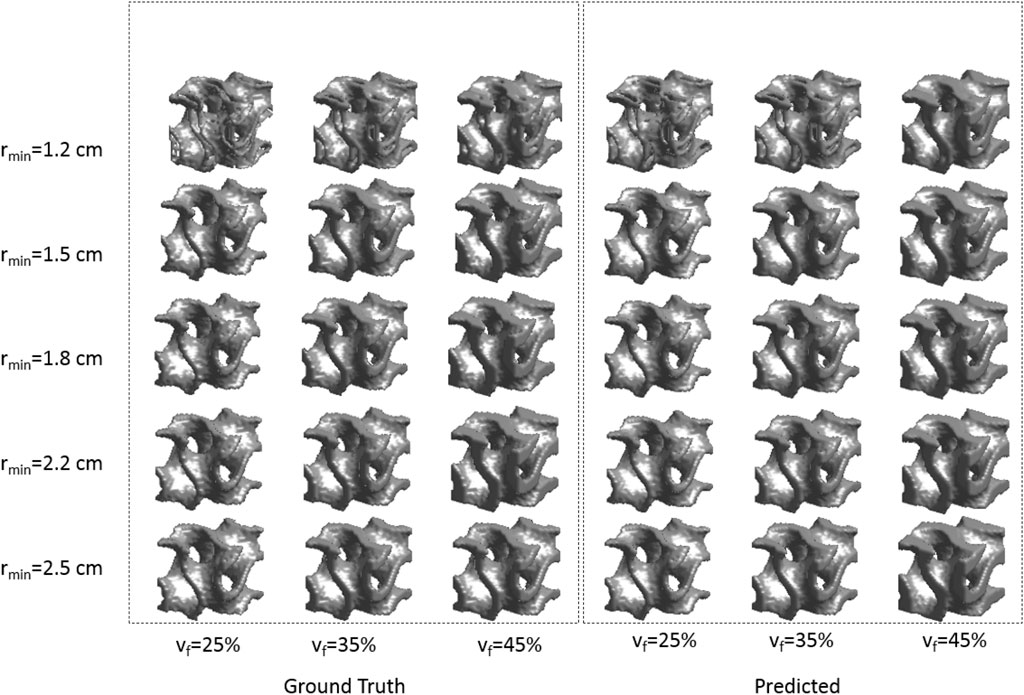
Figure 14. Ground truth (left) and predicted (right) topologies for different combinations of volume fractions and filtering radii with the maximum bulk modulus.
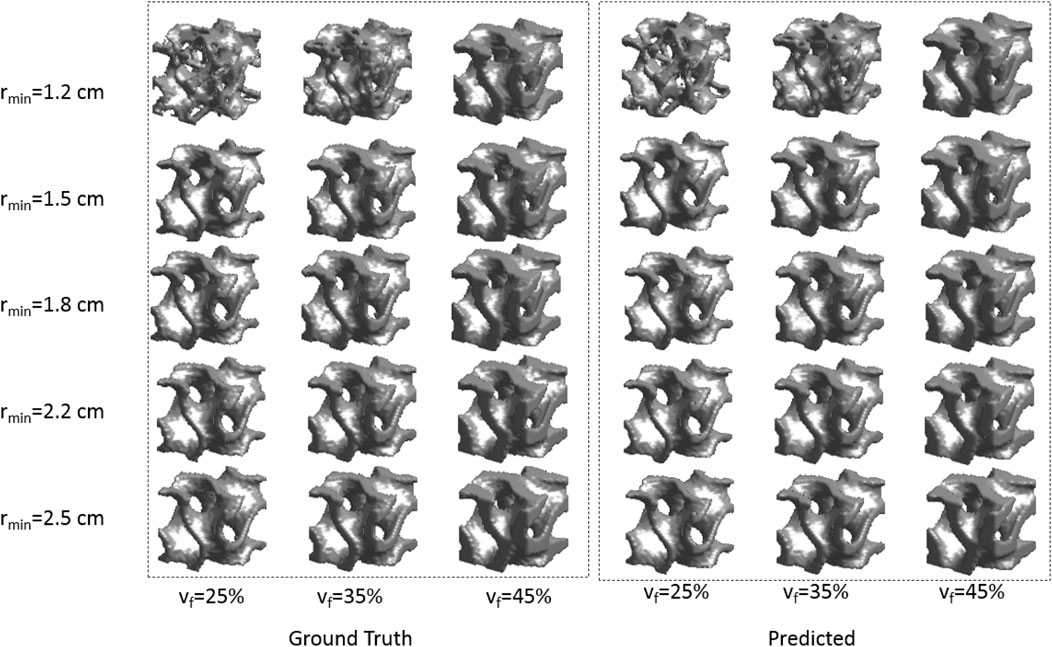
Figure 15. Ground truth (left) and predicted (right) topologies for different combinations of volume fractions and filtering radii with the maximum shear modulus.
For a better understanding of the matching images, the 1st, 8th, 16th, 23rd, and 32nd 2D slices among the 32 slices of the 3D image are separately visualized for both the objectives for a 35% volume fraction and filter radius of 2 cm, which are outside the training data (Figure 16).
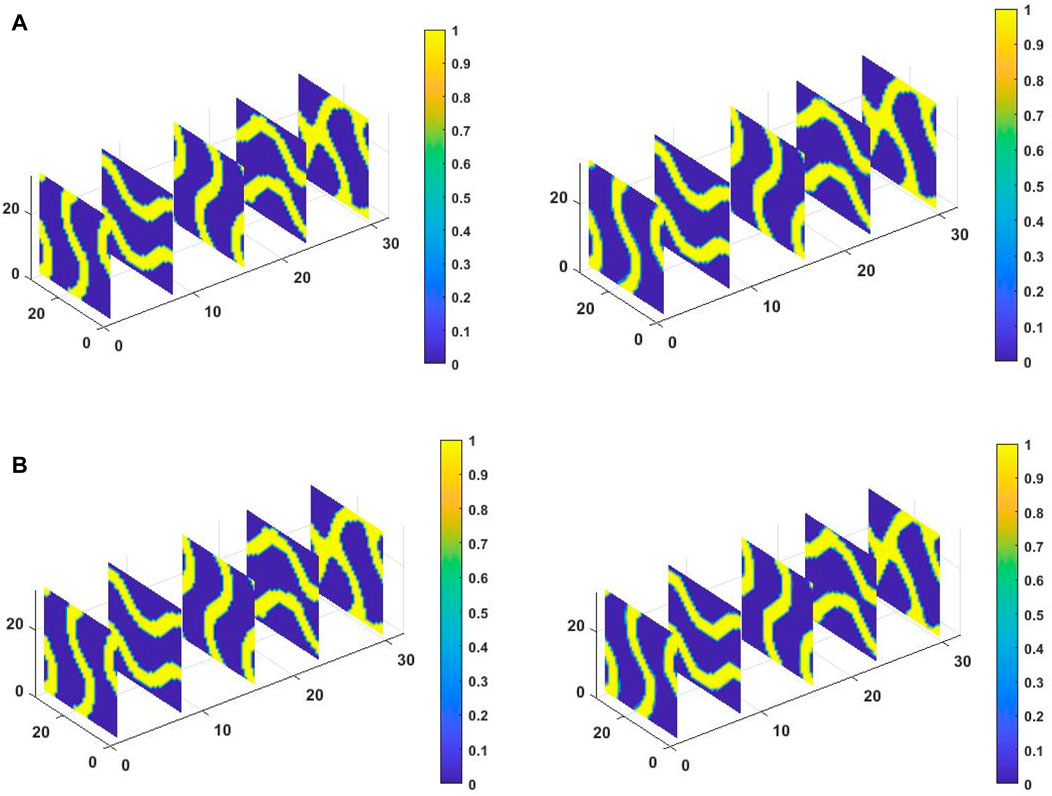
Figure 16. 1st, 8th, 16th, 23rd, and 30th 2D slice contours of densities in ground truth (left) and predicted (right) topologies for 35% volume fraction and a filter radius of 2 cm for (A) maximum bulk modulus and (B) maximum shear modulus.
The matching slices indicate that the prediction of the DL model for values of volume fraction and filtering radius not present in the training dataset is very accurate. The two metrics for demonstrating the effectiveness of the DL model shows accuracy up a to 95% match with a 10−3 error. The advantage of the DL model is that once the 3D training data is properly trained on a high-end computer, TO will occur instantly, even on a laptop, and the DL model can be re-used.
A similar study of TO by DL model used Viswanath et al. (2021) showed a higher MSE than this study, indicating that consideration of more TO parameters improved the model. The corresponding 2D study (Kollmann et al., 2020) showed a similar trend of MSE and DSC, hence indicating that this 3D DL model effectively captured the TO process as well as in 2D.
6 Future scope and applications
There are numerous directions for future research described in this paper, some of which are discussed in this section for the benefit of researchers:
1. Extend it to other TPMS or any lattices. The voxelization algorithm only requires the co-ordinate information. As an example, two other TPMS structures voxelized using these codes are shown in Figure 17.
2. To describe the geometry of a surface-based metamaterial, the shortcomings of using elemental density methods—the SIMP method—can be overcome by exploring the combination of level set methods with Equation 1 (Wang et al., 2003; Allaire et al., 2004; Luo et al., 2008).
3. The TO of TPMS-based metamaterials, gyroid in this study, involves the use of an initial design to maintain the TPMS structure. The goal was to observe changes in topology that would emerge and the extent to which curvature characteristics would be preserved. Most of the optimized designs reduced the thickness of the initial design; hence, a TO could be replaced with size optimization with the same thickness as the parameter, in which case the mean curvature properties could also be maintained. However, the same models of 3D CNNs are also applicable to such problems.
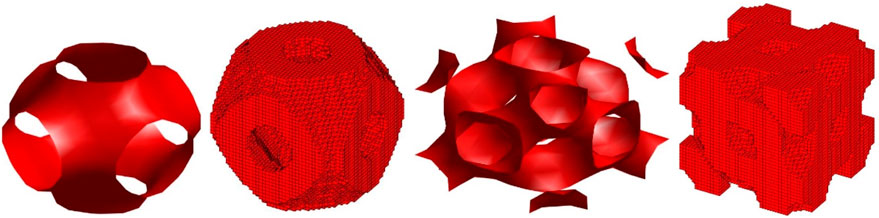
Figure 17. Voxelized TPMS structures of Schwarz Primitive and Schwarz Diamond.
Future applications of this research can further emphasize its significance. The 3D TO of a large mesh size is time-consuming, and generating a dataset of many such TO runs is expensive. A greater purpose and application should be the aim when performing such an exercise. The use of TPMS-based porous structure designs for lightweight mechanical structures, heat exchangers, and biomaterials has been investigated by studying the RUC design and then using the optimal unit cell to generate periodic macrostructures. Nevertheless, structural and material optimization of macrostructures may not be possible by using an optimal microstructure alone. Integrated TO—"concurrent TO”—which optimizes the microstructure material distribution at the same time when macrostructure properties are optimized has been widely studied (Gao et al., 2019b; Wu et al., 2020). Multiscale TO deals with optimization at two levels: 1) unit cell (micro-scale) optimization to obtain an optimal unit cell structure maximized for a mechanical property such as optimization is performed in this study; 2) optimization at the macro scale for the whole cellular structure built with specified matrix of unit cells (Gao et al., 2019b). For such a concurrent optimization, the finite elements at micro-unit cell structure and finite elements of the macro-cellular structure both together magnify the computational burden of optimization as the number of matrix computations is in the order of the finite element mesh size at the microscale multiplied by the finite element size at the macroscale. When a model is developed for determining the optimal microstructure corresponding to any desired mechanical property and TO parameters instantaneously, this model can be plugged into the macro analysis of such structures to prevent any such concurrent TO of the structure at micro- and macroscale. The concurrent TO involves the following processes (Gao et al., 2019b):
Find
where C is the structural compliance, M index refers to macrostructure, and m to microstructure.
where D0 is the constitutive matrix of the material and DH is the homogenized stiffness tensor of the microstructure optimized by TO. This TO is modeled in our study with a CNN model and hence can be used as an alternative to the concurrent TO to reduce the overall computational cost of the TO of the entire macrostructure. In this study, the bulk modulus and shear modulus is calculated from DH, which is one of the input parameters. Instead, for the concurrent TO, the DH can be the desired property to be attained, and the model is built via the same procedure as described in this study. Hence, major savings in computational time are achieved in macrostructure design because the microstructure design is predicted instantaneously by the CNN model in each iteration based on the TO parameters.
The advantages of this model can be exploited in similar applications where the macrostructure is analyzed with computationally intensive FE or CFD models for static (Abueidda et al., 2022) or dynamic analysis and involves microstructural property optimization. We are extending this approach to such applications as the future scope of this research. The MATLAB and PYTHON codes associated with the research are freely available for educational purposes.
7 Conclusion
This paper introduces a 3D CNN-based model for TO of Gyroid TPMS unit cells. Three concepts are presented in the paper: 1) a voxelized algorithm for unit cell design of 3D gyroid unit cells; 2) a homogenization-based 3D TO to achieve a maximum bulk modulus or shear modulus for the desired volume fraction and filtering radii of this microstructure; 3) a 3D CNN for 3D TO. To alleviate the computational burden caused by time-consuming 3D TO, a 3D surrogate CNN model with an encoder–decoder type architecture, used in segmentation modeling, is used to learn the topology of the RUC. The model could almost instantly imitate a similar pattern in the topology of the gyroid with very few data points. Moreover, the model was robust in terms of both the accuracy of prediction and prediction time. Hence, this CNN model could be used effectively, even on a laptop, for performing quality TO, which is otherwise unthinkable even on a powerful workstation or cluster. Another significant advantage of the trained DL model is its reusability for different TO cases. This work also shows promise in employing surrogate DL based models for a drastically accelerated unit cell design of 3D metamaterials involving computationally extensive TO, including multiscale metamaterial design. The novelty of this paper is that the MATLAB and PYTHON codes associated with the generation of the lattice until the DL model prediction is available together for the educational of researchers who are newly venturing into this area.
Data availability statement
The MATLAB and PYTHON codes are available in the Github repository https://github.com/AshaV17/Deep-Learning-for-3D-Topology-Optimization.git.
Author contributions
AV: conceptualization, data curation, formal analysis, investigation, methodology, writing–original draft, writing–review and editing. DA: methodology, project administration, software, writing–review and editing. MM: validation, writing–review and editing. RAA-R: writing–review and editing, funding acquisition. SK: resources, software, writing–review and editing. KK: methodology, investigation, funding acquisition, project administration, resources, supervision, writing–review and editing.
Funding
The authors declare that financial support was received for the research, authorship, and/or publication of this article. This publication is based upon work supported by Khalifa University under Award No. RCII-2019-003.
Acknowledgments
The authors would like to thank the National Center for Supercomputing Applications (NCSA) Industry Program, the Center for Artificial Intelligence Innovation, and the Research Computing team at Khalifa University.
Conflict of interest
The authors declare that the research was conducted in the absence of any commercial or financial relationships that could be construed as a potential conflict of interest.
Publisher’s note
All claims expressed in this article are solely those of the authors and do not necessarily represent those of their affiliated organizations, or those of the publisher, the editors, and the reviewers. Any product that may be evaluated in this article, or claim that may be made by its manufacturer, is not guaranteed or endorsed by the publisher.
References
Abadi, M., Agarwal, A., Barham, P., Brevdo, E., Chen, Z., Citro, C., et al. (2016). TensorFlow: large-scale machine learning on heterogeneous distributed systems. Distributed, Parallel, and Cluster Computing. doi:10.48550/arXiv.1603.04467
Abueidda, D. W., Almasri, M., Ammourah, R., Ravaioli, U., Jasiuk, I. M., and Sobh, N. A. (2019a). Prediction and optimization of mechanical properties of composites using convolutional neural networks. Compos. Struct. 227, 111264. doi:10.1016/j.compstruct.2019.111264
Abueidda, D. W., Elhebeary, M., Shiang, C.-S., Pang, S., Abu Al-Rub, R. K., and Jasiuk, I. M. (2019b). Mechanical properties of 3D printed polymeric Gyroid cellular structures: experimental and finite element study. Mater. Des. 165, 107597. doi:10.1016/j.matdes.2019.107597
Abueidda, D. W., Koric, S., Al-Rub, R. A., Parrott, C. M., James, K. A., and Sobh, N. A. (2022). A deep learning energy method for hyperelasticity and viscoelasticity. Eur. J. Mech. - ASolids 95, 104639. doi:10.1016/j.euromechsol.2022.104639
Abueidda, D. W., Koric, S., and Sobh, N. A. (2020). Topology optimization of 2D structures with nonlinearities using deep learning. Comput. Struct. 237, 106283. doi:10.1016/j.compstruc.2020.106283
Abueidda, D. W., Koric, S., Sobh, N. A., and Sehitoglu, H. (2021a). Deep learning for plasticity and thermo-viscoplasticity. Int. J. Plast. 136, 102852. doi:10.1016/j.ijplas.2020.102852
Abueidda, D. W., Lu, Q., and Koric, S. (2021b). Meshless physics-informed deep learning method for three-dimensional solid mechanics. Int. J. Numer. Methods Eng. 122, 7182–7201. doi:10.1002/nme.6828
Al-Ketan, O., and Abu Al-Rub, R. K. (2019). Multifunctional mechanical metamaterials based on triply periodic minimal surface lattices. Adv. Eng. Mater. 21, 1900524. doi:10.1002/adem.201900524
Al-Ketan, O., Pelanconi, M., Ortona, A., and Abu Al-Rub, R. K. (2019). Additive manufacturing of architected catalytic ceramic substrates based on triply periodic minimal surfaces. J. Am. Ceram. Soc. 102, 6176–6193. doi:10.1111/jace.16474
Allaire, G., Jouve, F., and Toader, A.-M. (2004). Structural optimization using sensitivity analysis and a level-set method. J. Comput. Phys. 194, 363–393. doi:10.1016/j.jcp.2003.09.032
Bellman, R. E. (1961). Adaptive control processes: a guided tour. Princeton, NJ: Princeton University Press.
Bendsøe, M. P. (1989). Optimal shape design as a material distribution problem. Struct. Optim. 1, 193–202. doi:10.1007/BF01650949
Bruns, T. E., and Tortorelli, D. A. (2001). Topology optimization of non-linear elastic structures and compliant mechanisms. Comput. Methods Appl. Mech. Eng. 190, 3443–3459. doi:10.1016/S0045-7825(00)00278-4
Dong, G., Tang, Y., and Zhao, Y. F. (2018). A 149 line homogenization code for three-dimensional cellular materials written in matlab. J. Eng. Mater. Technol. 141. doi:10.1115/1.4040555
Elmadih, W., Syam, W. P., Maskery, I., Chronopoulos, D., and Leach, R. (2019). Mechanical vibration bandgaps in surface-based lattices. Addit. Manuf. 25, 421–429. doi:10.1016/j.addma.2018.11.011
Engheta, N., and Ziolkowski, R. W. (2006). Metamaterials: physics and engineering explorations. John Wiley and Sons.
Gao, J., Li, H., Gao, L., and Xiao, M. (2018). Topological shape optimization of 3D micro-structured materials using energy-based homogenization method. Adv. Eng. Softw. 116, 89–102. doi:10.1016/j.advengsoft.2017.12.002
Gao, J., Li, H., Luo, Z., Gao, L., and Li, P. (2019a). Topology optimization of micro-structured materials featured with the specific mechanical properties. Int. J. Comput. Methods 17, 1850144. doi:10.1142/S021987621850144X
Gao, J., Luo, Z., Xia, L., and Gao, L. (2019b). Concurrent topology optimization of multiscale composite structures in Matlab. Struct. Multidiscip. Optim. 60, 2621–2651. doi:10.1007/s00158-019-02323-6
Gardan, J. (2016). Additive manufacturing technologies: state of the art and trends. Int. J. Prod. Res. 54, 3118–3132. doi:10.1080/00207543.2015.1115909
Goli, E., Vyas, S., Koric, S., Sobh, N., and Geubelle, P. H. (2020). ChemNet: a deep neural network for advanced composites manufacturing. J. Phys. Chem. B 124, 9428–9437. doi:10.1021/acs.jpcb.0c03328
Guedes, J., and Kikuchi, N. (1990). Preprocessing and postprocessing for materials based on the homogenization method with adaptive finite element methods. Comput. Methods Appl. Mech. Eng. 83, 143–198. doi:10.1016/0045-7825(90)90148-F
Guest, J. K., Prévost, J. H., and Belytschko, T. (2004). Achieving minimum length scale in topology optimization using nodal design variables and projection functions. Int. J. Numer. Methods Eng. 61, 238–254. doi:10.1002/nme.1064
Hamdia, K. M., Ghasemi, H., Bazi, Y., AlHichri, H., Alajlan, N., and Rabczuk, T. (2019). A novel deep learning based method for the computational material design of flexoelectric nanostructures with topology optimization. Finite Elem. Anal. Des. 165, 21–30. doi:10.1016/j.finel.2019.07.001
Jacob, A. (1991). “Mechanics of composite materials, volume 29,” in Studies in applied mechanics. 1st Ed, 1–328.
Kollmann, H. T., Abueidda, D. W., Koric, S., Guleryuz, E., and Sobh, N. A. (2020). Deep learning for topology optimization of 2D metamaterials. Mater. Des. 196, 109098. doi:10.1016/j.matdes.2020.109098
Liu, C., and Li, S. (2023). High-resolution topology optimization method of multi-morphology lattice structures based on three-dimensional convolutional neural networks (3D-CNN). Struct. Multidiscip. Optim. 66, 235. doi:10.1007/s00158-023-03688-5
Luo, J.-W., Chen, L., Min, T., Shan, F., Kang, Q., and Tao, W. (2020). Macroscopic transport properties of Gyroid structures based on pore-scale studies: permeability, diffusivity and thermal conductivity. Int. J. Heat. Mass Transf. 146, 118837. doi:10.1016/j.ijheatmasstransfer.2019.118837
Luo, Z., Wang, M. Y., Wang, S., and Wei, P. (2008). A level set-based parameterization method for structural shape and topology optimization. Int. J. Numer. Methods Eng. 76, 1–26. doi:10.1002/nme.2092
Michielsen, K., and Stavenga, D. G. (2008). Gyroid cuticular structures in butterfly wing scales: biological photonic crystals. J. R. Soc. Interface 5, 85–94. doi:10.1098/rsif.2007.1065
Mozaffar, M., Bostanabad, R., Chen, W., Ehmann, K., Cao, J., and Bessa, M. A. (2019). Deep learning predicts path-dependent plasticity. Proc. Natl. Acad. Sci. 116, 26414–26420. doi:10.1073/pnas.1911815116
Myers, R. H., Montgomery, D. C., and Anderson-Cook, C. M. (2016). Response surface methodology: process and product optimization using designed experiments. 4th Ed. Wiley Series in Probability and Statistics.
Neves, M. M., Rodrigues, H., and Guedes, J. M. (2000). Optimal design of periodic linear elastic microstructures. Comput. Struct. 76, 421–429. doi:10.1016/S0045-7949(99)00172-8
Osanov, M., and Guest, J. K. (2016). Topology optimization for architected materials design. Annu. Rev. Mater. Res. 46, 211–233. doi:10.1146/annurev-matsci-070115-031826
Rong, Q., Wei, H., Huang, X., and Bao, H. (2019). Predicting the effective thermal conductivity of composites from cross sections images using deep learning methods. Compos. Sci. Technol. 184, 107861. doi:10.1016/j.compscitech.2019.107861
Ronneberger, O., Fischer, P., and Brox, T. (2015). “U-net: convolutional networks for biomedical image segmentation,” in Medical image computing and computer-Assisted Intervention – MICCAI 2015, Lecture Notes in computer science. Editors N. Navab, J. Hornegger, W. M. Wells, and A. F. Frangi (Cham: Springer International Publishing), 234–241. doi:10.1007/978-3-319-24574-4_28
Settgast, C., Abendroth, M., and Kuna, M. (2019). Constitutive modeling of plastic deformation behavior of open-cell foam structures using neural networks. Mech. Mater. 131, 1–10. doi:10.1016/j.mechmat.2019.01.015
Sigmund, O. (2007). Morphology-based black and white filters for topology optimization. Struct. Multidiscip. Optim. 33, 401–424. doi:10.1007/s00158-006-0087-x
Sigmund, O., and Petersson, J. (1998). Numerical instabilities in topology optimization: a survey on procedures dealing with checkerboards, mesh-dependencies and local minima. Struct. Optim. 16, 68–75. doi:10.1007/BF01214002
Spear, A. D., Kalidindi, S. R., Meredig, B., Kontsos, A., and le Graverend, J.-B. (2018). Data-driven materials investigations: the next Frontier in understanding and predicting fatigue behavior. JOM 70, 1143–1146. doi:10.1007/s11837-018-2894-0
top3d (2022). top3d. Available at: https://www.top3d.app/(Accessed June 14, 2022).
Torquato, S., and Donev, A. (2004). Minimal surfaces and multifunctionality. Proc. Math. Phys. Eng. Sci. 460, 1849–1856. doi:10.1098/rspa.2003.1269
Viswanath, A., Modrek, M., Khan, K. A., and Al-Rub, R. K. A. (2021). Deep learning for topology optimization of triply periodic minimal surface based Gyroid-like structures. Proc. Am. Soc. Compos.-Sixth Tech. Conf. Compos. Mater. doi:10.12783/asc36/35824
Wang, M. Y., Wang, X., and Guo, D. (2003). A level set method for structural topology optimization. Comput. Methods Appl. Mech. Eng. 192, 227–246. doi:10.1016/S0045-7825(02)00559-5
Wang, Y., Lian, Y., Wang, Z., Wang, C., and Fang, D. (2024). A novel triple periodic minimal surface-like plate lattice and its data-driven optimization method for superior mechanical properties.
Wu, Y., Li, E., He, Z. C., Lin, X. Y., and Jiang, H. X. (2020). Robust concurrent topology optimization of structure and its composite material considering uncertainty with imprecise probability. Comput. Methods Appl. Mech. Eng. 364, 112927. doi:10.1016/j.cma.2020.112927
Xia, L., and Breitkopf, P. (2015). Design of materials using topology optimization and energy-based homogenization approach in Matlab. Struct. Multidiscip. Optim. 52, 1229–1241. doi:10.1007/s00158-015-1294-0
Yang, C., Kim, Y., Ryu, S., and Gu, G. X. (2019a). Using convolutional neural networks to predict composite properties beyond the elastic limit. MRS Commun. 9, 609–617. doi:10.1557/mrc.2019.49
Yang, C., Kim, Y., Ryu, S., and Gu, G. X. (2020). Prediction of composite microstructure stress-strain curves using convolutional neural networks. Mater. Des. 189, 108509. doi:10.1016/j.matdes.2020.108509
Yang, E., Leary, M., Lozanovski, B., Downing, D., Mazur, M., Sarker, A., et al. (2019b). Effect of geometry on the mechanical properties of Ti-6Al-4V Gyroid structures fabricated via SLM: a numerical study. Mater. Des. 184, 108165. doi:10.1016/j.matdes.2019.108165
Yu, X., Zhou, J., Liang, H., Jiang, Z., and Wu, L. (2018). Mechanical metamaterials associated with stiffness, rigidity and compressibility: a brief review. Prog. Mater. Sci. 94, 114–173. doi:10.1016/j.pmatsci.2017.12.003
Zhang, Z., Liu, Q., and Wang, Y. (2018). Road extraction by deep residual U-net. IEEE Geosci. Remote Sens. Lett. 15, 749–753. doi:10.1109/LGRS.2018.2802944
Nomenclature
Keywords: triply periodic minimal surface, Gyroid, homogenization MATLAB code, topology optimization, deep learning PYTHON code
Citation: Viswanath A, Abueidda DW, Modrek M, Abu Al-Rub RK, Koric S and Khan KA (2024) Designing a TPMS metamaterial via deep learning and topology optimization. Front. Mech. Eng. 10:1417606. doi: 10.3389/fmech.2024.1417606
Received: 15 April 2024; Accepted: 22 July 2024;
Published: 26 August 2024.
Edited by:
Denis Benasciutti, University of Ferrara, ItalyReviewed by:
Weizhu Yang, Northwestern Polytechnical University, ChinaChitaranjan Pany, Vikram Sarabhai Space Centre, India
Chi Wu, The University of Sydney, Australia
Copyright © 2024 Viswanath, Abueidda, Modrek, Abu Al-Rub, Koric and Khan. This is an open-access article distributed under the terms of the Creative Commons Attribution License (CC BY). The use, distribution or reproduction in other forums is permitted, provided the original author(s) and the copyright owner(s) are credited and that the original publication in this journal is cited, in accordance with accepted academic practice. No use, distribution or reproduction is permitted which does not comply with these terms.
*Correspondence: Kamran A. Khan, a2FtcmFuLmtoYW5Aa3UuYWMuYWU=