 Ding Zhang
 Yu Pei
- State Key Laboratory of Precision Electronic Manufacturing Technology and Equipment, Guangdong University of Technology, Guangzhou, China
The fluctuation of product quality is closely related to the degradation of the equipment in multi-stage manufacturing systems. This paper proposes a critical measure approach for a quality-reliability coupled network of multi-stage manufacturing systems via network controllability. The impact of component degradation will be transmitted, expanded, and accumulated in multiple manufacturing stages, leading to quality flaws or even shutdowns of the entire system. An important measurement method via controllability analysis is provided by quantifying the impact of attacking the quality-reliability coupled network. By quantifying the control ability of the fault source node on the key quality attribute node, the weakness that affects the processing accuracy of a production line is identified. Case studies of real production lines are applied to verify the effectiveness, and comparative results show the method can guide the quality-reliability improvement of manufacturing systems.
1 Introduction
A highly reliable production line requires the system to maintain the specified production efficiency and the processed products to meet the quality inspection requirements. The quality-reliability of the production line describes the ability of the index value of the workpiece quality to keep in line with the technical requirements. The accuracy-reliability describes the ability of the production line to maintain the machining accuracy. As time goes by, the performance degradation of equipment parts will decrease machining accuracy. Although it may not be enough to cause the accuracy of a single piece of equipment to fail, its impact will be transmitted and expanded in multiple manufacturing stages. After accumulation, the production line will not process qualified workpieces, which will cause unnecessary downtime for maintenance activities and significantly reduce quality-reliability.
System reliability analysis identifies the impact of failures on the system. Its purpose is to measure the weakness of a system so that improvement measures can be implemented. For a large-scale processing system, accuracy fluctuations become extremely complicated after being transmitted in multiple stages. Its topological structure presents the characteristics of a large-scale network, which hides a wealth of uncertainty propagation information. Using graph theory or network knowledge to analyze topological structure is a new development. Therefore, this article starts from the perspective of the relationship of production line quality and reliability. By quantifying the control ability of the fault source node on the key quality attribute node, the weakness that affects the processing accuracy of the production line is identified to improve the quality reliability of the system processing.
The paper is organized as follows. Section 2 presents the state of this field. The logical flow of quality-reliability analysis via network controllability is provided in section 3. Section 4 focuses on establishing a reliability-quality coupled network modeling of a production line. In section 5, based on the controllability analysis of complex networks and identifying key attribute nodes, the weakness that affects the processing accuracy of a production line is identified. Section 6 shows two examples to verify the algorithm proposed in this paper. Finally, concluding remarks are summarized in Section 7.
2 Literature Review
At present, many scholars have gradually begun to study the relationship between the quality and reliability of production lines. Jiang and Murthy (Jiang and Murthy, 2009) measured the impact of manufacturing system product quality on machining process reliability. Jin et al. (Jin and Chen, 2001) first proposed the interactive effect of quality and reliability. Chen and Jin (Yong and Jin, 2005) proposed a QR chain (Quality-Reliability Chain) to describe a process of multi-station transfer of component reliability and workpiece quality along the production process. Sun (Sun et al., 2009) proposed an integrated model of quality and reliability for multi-station manufacturing systems. The model usually sets the strength of interaction relationship between quality and reliability as a certain interaction coefficient to evaluate the reliability under this coefficient. He et al. (2014) considered the interactive effects of quality and reliability, and proposed a reliability evaluation model based on the probability of product qualification and degradation of system components. Chen et al. (2021) proposed a reliability evaluation method that considers the quality-reliability dependency of a multi-state system, and use the quality state-space model to quantify the quality deviation. Zhou (Zhou and Lu, 2018) was focused on the bidirectional interaction mechanism between station reliability and product quality, and developed a station reliability evaluation method. Regarding the predictive failure probability of each machine and the production control policy, Wang et al. (2020) proposed predictive maintenance. Although the predecessors proposed appropriate reliability evaluation and design methods for the production line, they believed that the equipment of the production line was independent of each other, and each manufacturing stage was equally important and did not consider the impact of machining accuracy on the evaluation and design. However, the performance degradation of different equipment has different effects on the transmission of accuracy fluctuations. In this context, measuring the weaknesses that affect the quality-reliability of a production line from the perspective of accuracy is particularly important.
Researchers usually establish corresponding network models for large and complex systems to identify the quality-reliability coupling relationship and measure importance nodes, thereby indirectly performing reliability analysis. For example, Zhang et al. (2013) proposed to use the in-degree, out-degree, and shortest path of a complex network to identify the importance of nodes in the material flow manufacturing network. Yang et al. (2013) identified brittle points that affect the stability of multi-product production lines by using network topology characteristics such as utilization, shortest path, and clustering coefficient. Haifeng (2010) used network to represent fault data structure and introduced the modular concept of complex network community structure analysis to diagnose compressor fault. The popular method (Datta and Goyal, 2019) to evaluate the network reliability is mostly through minimal paths (MP) or minimal cuts (MC) of a network. Lin and Chen (Tan et al., 2017) proposed a maximal flow method to research MP in a stochastic-flow network. For the controllability of dynamic complex networks, Zhou (Tan et al., 2017) selected an index to measure the controllability of networks quantitatively. According to this index, they compared the controllability between different network structures. Zhou et al. (2013)considered the role of nodes in network efficiency and degree distribution and the importance of adjacent edges, then provided a new method for measurement of node centrality in complex directed networks and made the evaluation of node centrality more accurate. Wang (Wang et al., 2016) introduced a new structural controllability analysis approach based on the reachability matrix to identify the minimum set of driver nodes, which could further control complex networks. The importance of nodes in a complex network has an important impact on the stability of the network. Based on previous ideas, Yang (Yang et al., 2019) considered degree centrality, tight centrality, and intermediate centrality and proposed a method for comprehensively evaluating the importance of nodes in complex networks. The entropy weight method that overcomes the influence of subjective factors is used to calculate the weight of each index. Mousavi and Haeri, (2016) introduced the zero expansion rule through the concept of a balanced set, providing a sufficient number of control nodes to ensure the controllability of some undirected networks. Chin et al. (2017) defined the notion of super driver nodes and discussed the effects that root and leaf nodes on driver and super driver nodes. Then they distinguished driver nodes from super driver nodes by calculating and evaluating node properties to control a network. Xiang (Xiang et al., 2019) had made great progress in the research of network controllability and has a comprehensive understanding of network controllability from many aspects, such as network topology and node-system dynamics.
However, it is difficult for a complex coupling network to summarize the importance of the fluctuation source node only with topological network indicators such as degree, betweenness centrality, and clustering coefficient. For example, the degree only judges the importance of a node from the number of connected edges. The clustering coefficient only determines its importance from the number of edges of its neighbor nodes, which lacks the overall consideration of the network. From the perspective of the network topology, the ability of nodes to intervene in the network is different, and attacks on different nodes have different effects on the network. This enlightens us to measure the importance of fluctuation sources based on their ability to control the network to overcome the limitations of the traditional degree, centrality, and other topological characteristic indicators.
Therefore, on the basis of previous research results, from the perspective of how to effectively control a network, this paper proposes a method for evaluating the importance of fluctuation sources based on network controllability analysis and then proposes an accuracy-oriented method for identifying production line weakness, and verifies the effectiveness of this method.
3 Logical Flow
In this section, the logic flow of the proposed method structure is mainly introduced. As shown in Figure 1, the method contains three parts, which are network modeling, network controllability analysis, and importance measure.
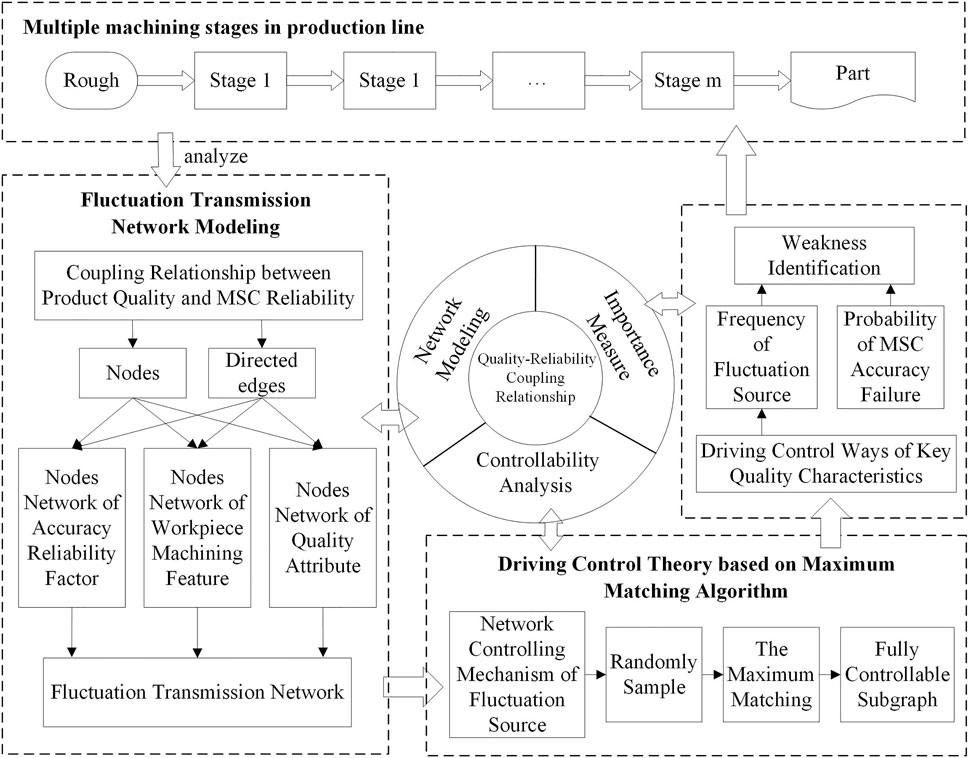
FIGURE 1. Quality-reliability oriented system importance measure process.
Specifically, it includes the following:
Step 1: Network modeling. There is a coupling between quality attributes of workpieces in the multi-manufacturing stages, performance degradation of machining system components (MSC), and deviation of quality characteristics of workpieces. Based on this relationship, the nodes and directed edges of the network can be abstracted, thereby constructing a fluctuation propagation network model oriented to the quality-reliability of the production line.
Step 2: Network controllability analysis. From the perspective of the control network, the control ability of the node is measured, and the maximum matching algorithm obtains the driving control mode of the fluctuation source in graph theory.
Step 3: Importance measure. According to the control method of fluctuation, the source to quantify its ability to control key quality attributes. Comprehensively considers the probability of occurrence of accuracy failure to determine weakness so as to guide the increase of accuracy reliability or maintenance measures.
4 Reliability-Quality Coupled Network Modeling
The influencing factors that lead to poor quality characteristics of workpieces in machining production lines have multiple sources. The specific sources include uncertain factors in processing equipment, measuring devices, personnel operations, external manufacturing environment, processing methods, workpiece materials, tools, fixtures, and so on (Riascos et al., 2007). When the performance of MSC declines in a certain process, this decline factor will become a source of fluctuations. It will not only cause fluctuations in its own accuracy, but also affect the processing accuracy of other processes related to it. Therefore, this section focuses on the coupling relationship between MSC, such as supporting fixtures, measuring devices, and tools of machining equipment and the deviation of workpiece quality characteristics.
4.1 Relationship Between Quality-Reliability and Error Fluctuation
In actual production, we hope that a highly reliable production line will run for a long time and produce high-quality workpieces. However, when the manufacturer configures the production line in the design stage, it often ensures processing efficiency and line balancing. With processing equipment as the main body, continuous running time is measured under the no-failure condition to evaluate the reliability of the production line. After the production line is actually delivered to a user, the reliability of use may be significantly lower than the reliability index given by the manufacturer. One of the reasons for this phenomenon is ignoring the coupling effect on MSC quality-reliability. The hard faults of MSC directly lead to equipment shut down for maintenance. Although MSC soft failure (decreased machine tool accuracy, wear of fixtures or tools, etc.) does not directly cause downtime, they cause poor product size, which may also trigger downtime detection and need to diagnose quality problems. Figure 2 shows the coupling relationship between MSC soft failure, hard failure, and workpiece quality in the machining process.
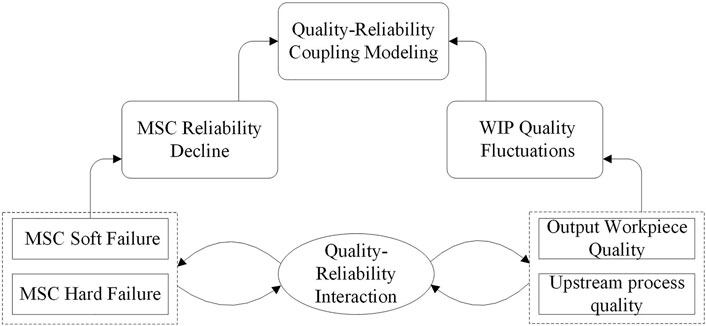
FIGURE 2. Coupling relationship between MSC reliability and workpiece quality.
Workpieces usually need to be processed in multiple manufacturing stages, as shown in Figure 3; they are affected by the hard failure and soft failure of MSC at this stage and the quality level of the upstream processing stage. Therefore, it is necessary further to study the quality-reliability coupling relationship after production line configuration.
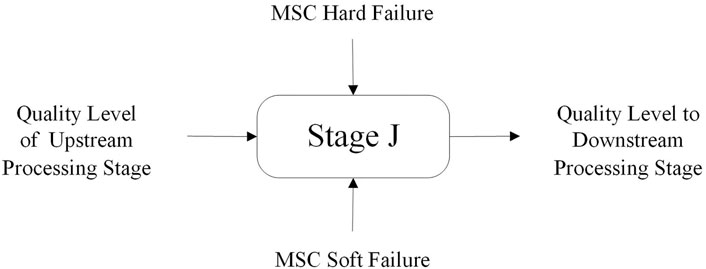
FIGURE 3. Quality-reliability coupling relationship of a machining stage.
The coupling relationship between quality-reliability and its transmission process along multiple manufacturing stages is shown in Figure 4. This effect can include the following aspects:
1) The effects of reliability factors on quality factors (Reliability-Quality Effects, R-Q Effects): MSC’s soft failure and hard failure cause product quality problems in this manufacturing stage.
2) The effects of quality factors on reliability (Quality-Reliability Effects, Q-R Effects): refers to the influence of product quality problems on MSC reliability in the downstream manufacturing stage.
3) Quality effects transfer process caused by datum constraint (Datum Effects, DE): Refers to the processing of features in a certain manufacturing stage based on features processed in the upstream stage, resulting in error propagation.
4) Evolution Effects (ER): Refers to the process in which there is a sequential relationship between processing procedures, which leads to propagation of parts errors.
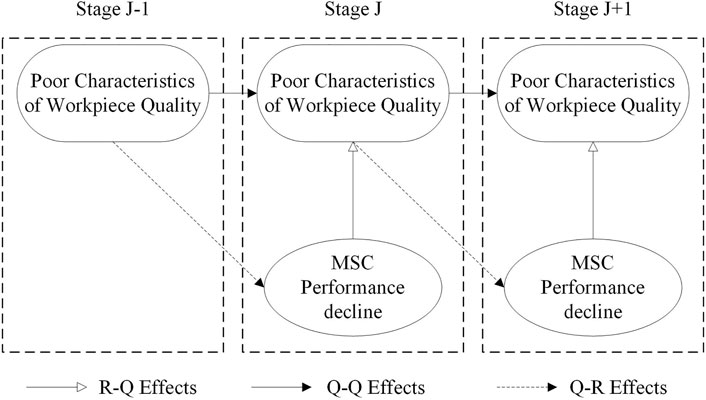
FIGURE 4. Quality-reliability coupling relationship of multi-stage processing.
Figure 5 shows the structure of a piston machining production line, which mainly completes rough and finished processes of outer piston circles, ring grooves, combustion chamber, pinhole, and valve pit. Machining equipment includes special CNC lathes, vertical CNC milling machines, and precision combined boring machines.
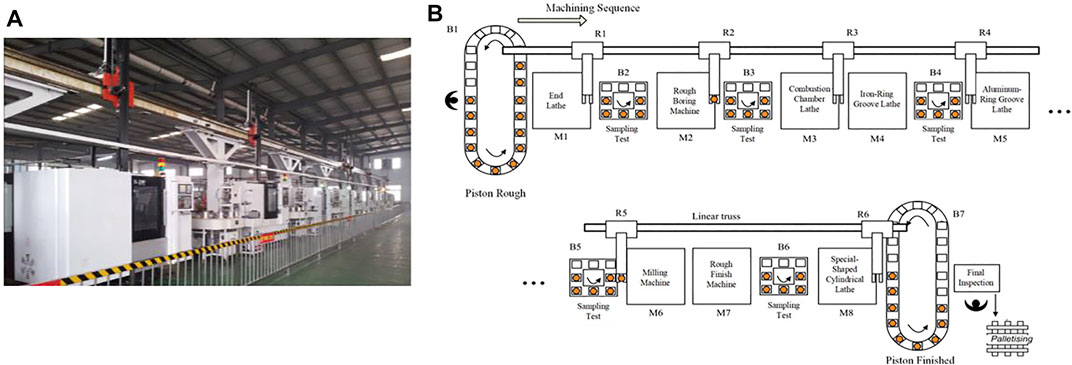
FIGURE 5. Piston production line. (A) Production line workshop (B) Machining process.
The coupling relationship between equipment accuracy reliability factors of the piston production line and the error transmission process of the workpiece is shown in Figure 6. When degradation factors such as wear and fatigue occur in the machine tool equipment layer, key accuracy indicators will be unreliable, and fluctuations will be transmitted along multiple manufacturing stages. When there is a continuous deviation of critical workpiece dimensions, it needs to be shut down for maintenance, triggering quality diagnosis and maintenance activities. The sources of fluctuations are diverse, and network propagation occurs along multiple transmission paths. This relationship becomes more and more complex with the increase in the manufacturing stage of the production line and the types of workpieces to be processed.

FIGURE 6. Fluctuation propagation effect of MSC performance degradation.
4.2 Construction Steps of Fluctuation Transmission Network
According to the processing information, processing characteristics of workpiece and equipment accuracy factors that affect processing characteristics are abstracted into nodes, and the relationship between them is abstracted into edges. Then fluctuation transmission network of production line processing can be constructed. The specific modeling steps are as follows:
Step 1: Construct a network of machining feature nodes. Given production line workpiece set
Where
Step 2: Construct a network of accuracy reliability factors based on machining characteristics. Given machining feature
where
Step 3: Construct a network of quality attributes based on machining characteristics. Given machining feature
Step 4: Combine workpiece processing feature network, accuracy reliability factor network, and quality attribute network. The edges
5 Importance Measure via Network Controllability
Some nodes seem to have a specific ability to control the network, and the fluctuation in their functions will cause a series of chain reactions, which will affect the state of other nodes. Therefore, based on network controllability analysis, this section quantifies the control ability of nodes on crucial quality attributes to measure its importance.
5.1 Network Controllability Analysis
Watts and Strogatz, (1998) reported the phenomenon of small-world networks in 1998. Barabasi and Albert (Barabasi et al., 1999) led the scale-free properties of complex networks in 1999. Liu et al. published an article on the controllability of complex networks in Nature in 2011. Combining complex networks with control theory opens new avenues for the controllability of networks (Diao et al., 2014). Since then, many scientific researchers have researched network controllability and have achieved fruitful results (Sorrentino et al., 2007; Pedro et al., 2014; Hou et al., 2015; Gao et al., 2016; Hou et al., 2016).
Nonlinear processes drive most real complex systems, but the literature (Ching-Tai, 1974; Liu et al., 2011) proved that its controllability is similar to linear systems in many aspects structurally. The elements of a complex system are abstracted as nodes, and the connection relationship between nodes is directed edges, which can construct a network model. According to control theory, given a linear steady system:
If given any initial state
Similarly, if for any given initial state
The simple network with four nodes shown in Figure 7A, matrix
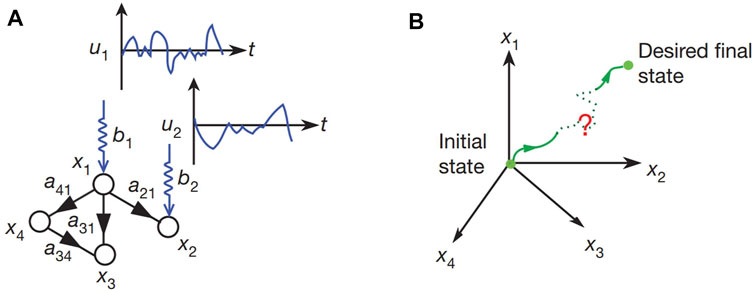
FIGURE 7. Network controllability diagram (Liu and Jiang, 2010). (A) Four-node network (B) State evolution path.
There are two input signals
According to Eq. 7,
The network is fully controllable, not only depending on the input of external signal but closely related to weight between directed edges, according to the new concept of structural controllability proposed by Lin in 1974 (Hopcroft and Karp, 1971), for different weight combinations of matrix
In Eq. 11, the elements of matrix
However, this is only one of many control input methods. At this time, each node has two choices of control and non-control. If a brute-force search is used to obtain all possible ranks of the controllability matrix, then a total of
To avoid the brute-force search for driver nodes, Liu et al. (Liu and Jiang, 2010) creatively combined network controllability analysis with graph theory analysis and proved that the number of minimum driver nodes could be obtained by a maximum matching algorithm, which solved the calculation problem of minimum driver nodes. For a directed network, if all directed edges in directed edges set
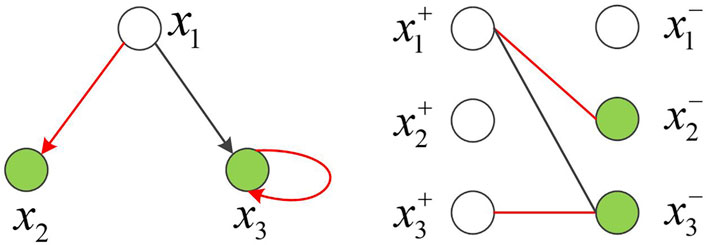
FIGURE 8. Schematic diagram of three-node network maximum matching.
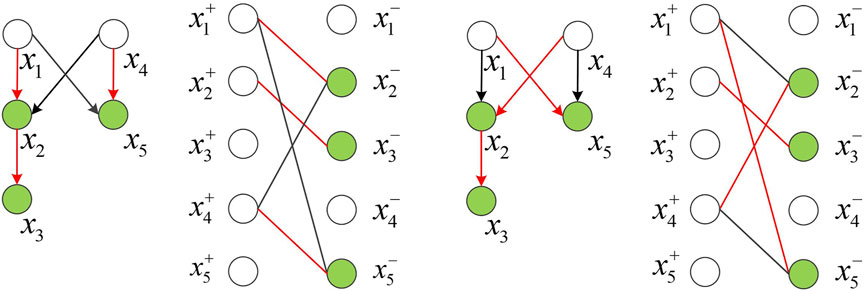
FIGURE 9. Schematic diagram of five-node network maximum matching. (A) Maximum matching one (B) Maximum matching two.
Liu et al.(Liu and Jiang, 2010) pointed out that if want to control nodes state fully, the minimum number of Driver Nodes required as the following formula:
As nodes and edges increase, the number of maximum matchings will increase so that the minimum driver nodes control methods will also increase. For complex networks, there are algorithms such as Hopcroft-Karp that can solve the maximum matching of the bipartite graph within
We can construct a cactus structure similar to graph theory through the maximum matching algorithm and select the root of the independent disjoint cactus structure as the input node to completely control the entire network.
5.2 Driving Control Ways of Key Quality Characteristics
The structure of a fluctuation transmission network makes many possible ways to cause quality deviation, as shown in Figure 5. Although the deterministic relationship (weight) of the mutual influence between network nodes is unknown, the directed edges can be constructed to indicate a mutual relationship between them. The external signals of
The combination of different fluctuation sources determines the state space of the system. That is, the degraded state of different equipment components will ultimately be represented at a level of accuracy reliability. As shown in Figure 10, by applying external control signals (different degradation states of equipment) to these driver nodes, the key quality attribute nodes (also referred to as target nodes in this section) can be controlled.
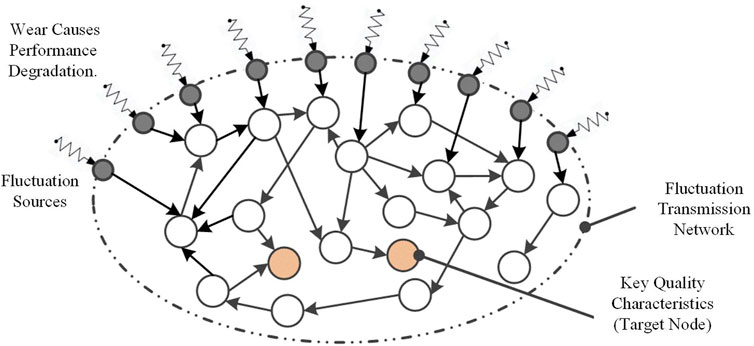
FIGURE 10. Drive control of fluctuation sources.
Assuming that network has
5.3 Accuracy-Reliability Oriented Importance Measure
The network controllability analysis provides a way to quantify the control ability of fault source nodes on key quality characteristics nodes (target nodes) and then measure the importance that affects the accuracy reliability of the production line.
The focus of this section is not to use a maximum matching algorithm to find the least set of driver nodes, but to identify the control ability of fluctuation source on target nodes, thereby identifying its importance. Several key quality characteristics often determine the quality of the workpiece. In the fluctuation transmission network, some nodes can always appear as the root of the cactus structure, controlling key quality characteristics nodes. And the other nodes have never been able to control key quality characteristics nodes, and most nodes are in between. Given this, the importance of the fluctuation source node can be measured by the frequency of occurrence of cactus root in the maximum matching.
Some scholars have proposed measures of the importance of node Control capacity index and Control centrality. The control ability is defined as the probability of appearing in a set of all minimum driver nodes. In the network structure of this section, the fluctuation source node that represents a degrading factor of equipment always acts as driver nodes, so this method cannot be used to distinguish importance. In addition, control centrality measures a node’s control ability over an entire network, but it fails to measure its control ability over target nodes.
In summary, this section proposes the concept of Target Control Capacity (TCC). In Figure 11, the algorithm for control ability of fluctuation source node
Step 1: Given fluctuation transmission network
Step 2: Apply the Hopcroft-Karp algorithm to randomly sample to obtain the largest matching and determine a fully controllable subgraph of each matching plan. Find the root of the cactus structure of key quality characteristics node (target node), and determine the set of roots
Step 3: Calculate the frequency of fluctuation source node
Step 4: When frequency change stabilizes (less than or equal to 0.001), or the algorithm has traversed all matchings, obtain the importance of
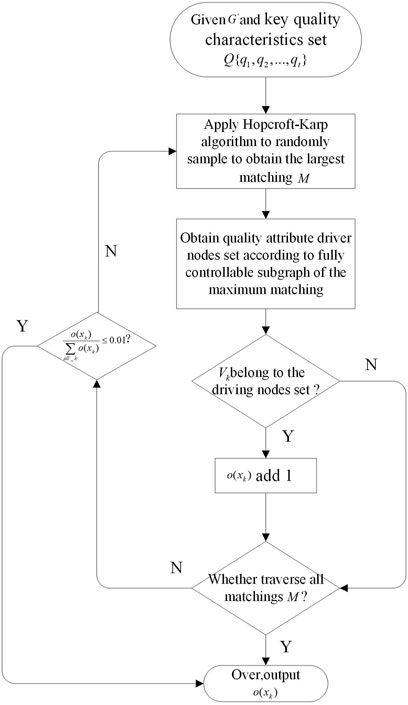
FIGURE 11. Target node
The importance of fluctuation source node
Among them,
6 Case Studies
In this section, we give two examples to illustrate the developed methodology. The results show that network reliability can effectively measure the importance of fluctuation sources, thereby identifying the weak links that affect accuracy and reliability.
6.1 Case Study of a Launcher Part Machining Line
In order to verify the effectiveness of weakness identification, this section takes a launcher part machining line (Liu and Jiang, 2007) as a case and compares the method in this paper with it.
The coaxiality of hole A of the launcher part is a key quality characteristic, and the specification value of the shaft diameter of hole A is
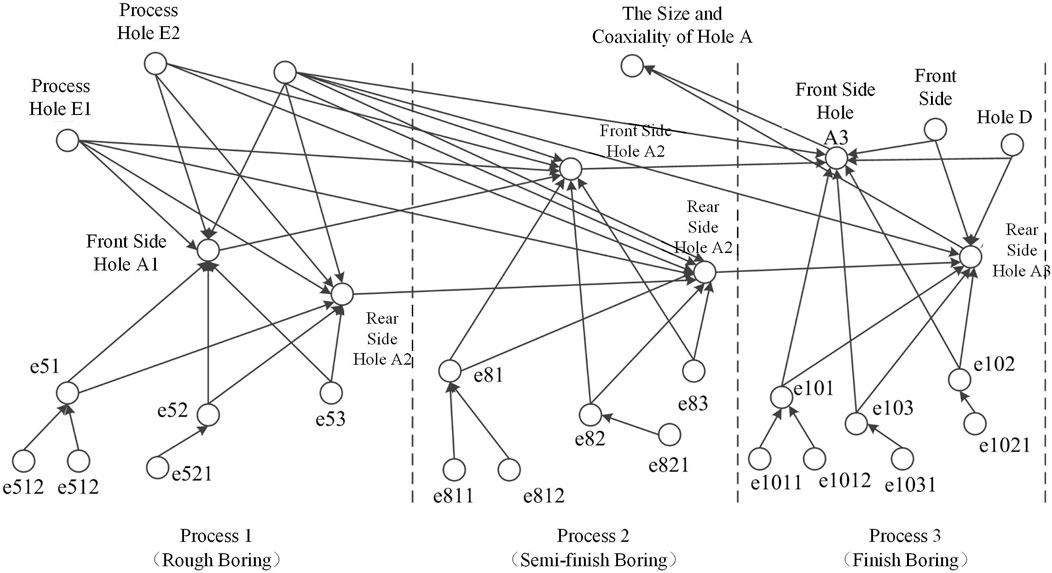
FIGURE 12. Launcher part machining error propagation network (Liu and Jiang, 2007).
In Figure 12, the physical meaning of MSC and accuracy reliability factor nodes are shown in Table 1.
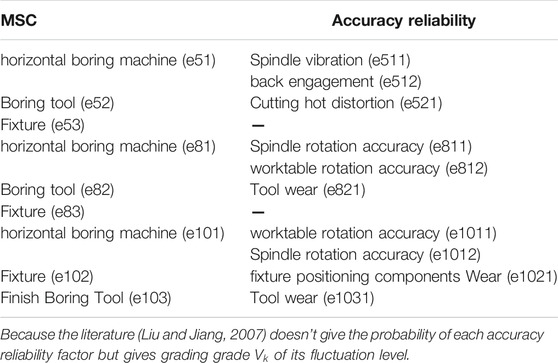
TABLE 1. The MSC and accuracy reliability factors of hole a
Therefore, this article modifies the probability of Eq. 14 as follows:
The literature (Liu and Jiang, 2007) determines important nodes by measuring the fluctuation transmission effect of nodes on key quality characteristics. The conclusion is that the finish boring process e101 and e102 have a greater impact on coaxiality. Using the algorithm in this article, measure the ability of each MSC node to control key quality characteristics of coaxiality on hole A, and the results obtained are shown in Table 2. It can be seen from Table 2 that it is determined that e103, e101, and e102 have a greater impact on quality characteristics, and the wear of fine boring tools has the most significant impact. Both methods show that when improving coaxiality quality characteristics of hole A, the e101 and e102 of MSC need to be adjusted. That is, to improve rotation accuracy of table and spindle of the horizontal boring machine to improve system accuracy reliability.
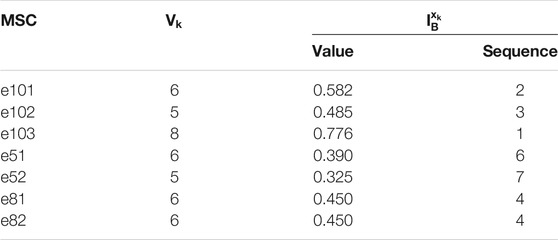
TABLE 2. Algorithm result of nodes control ability.
This case shows that the method in this paper can effectively obtain the importance of fluctuation sources, thereby identifying the weakness that affects accuracy and reliability.
6.2 Case Study of a Piston Production Line
Figure 13 shows the structural model of the fluctuation transmission network of a piston production line. The network has six characteristic processing nodes, two key quality characteristic nodes, and 32 precision reliability factor nodes.
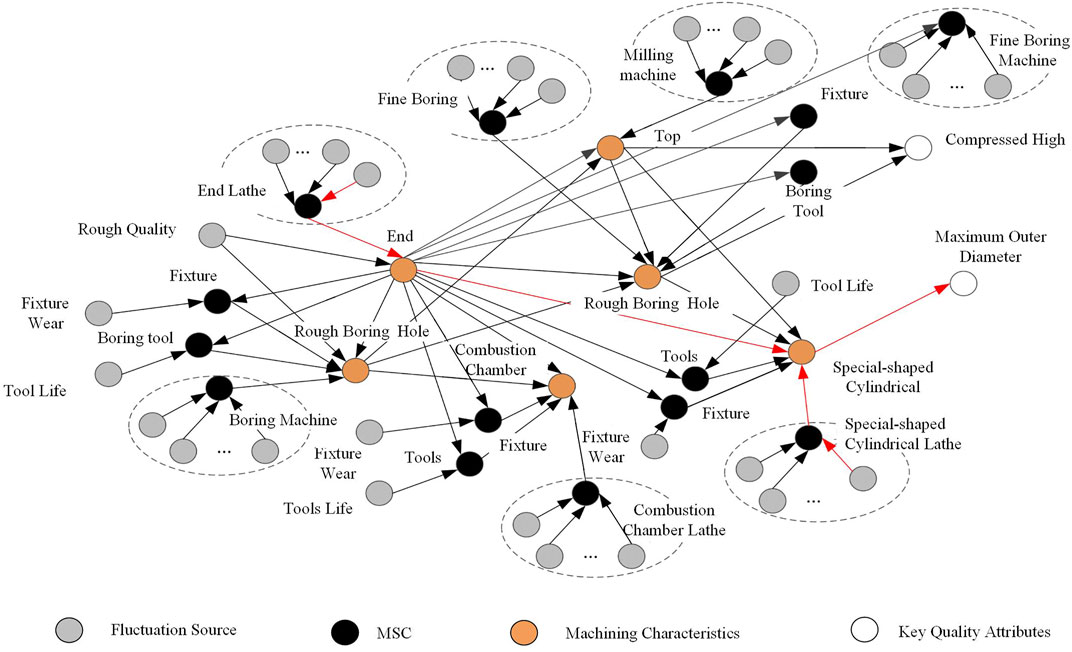
FIGURE 13. Piston Production Line error propagation network.
The in-degree of accuracy reliability factor node (the fluctuation source node in Figure 13) representing performance degradation of machine tool components is 0, which must be the driver nodes of the network. Over time, these nodes will experience varying degrees of performance degradation during their life cycle. This performance degradation can be understood as the network is controlled by “external input signals” and the driving state of the network can fully control the accuracy of the production line. The combination of different fluctuation source nodes corresponds to different precision states of the production line, and each state has a variety of network drive control methods. The maximum matching algorithm can be used to search for control methods to identify system weaknesses. The piston’s compression height and the maximum outer diameter are two key quality characteristics, as shown in Figure 13. Different drive control methods can be used to control these two target nodes through the maximum matching algorithm.
According to the algorithm in Figure 11, the accuracy reliability factor nodes of equipment can be determined to control compression height and maximum outer diameter. Through the maximum matching of a network, control methods of these nodes can be found. Among many control methods, finding a driver node that is reachable to the node of compression height and maximum outer diameter and traversing all maximum matchings will quantify the control ability of the fluctuation source. The results obtained are shown in Table 3.
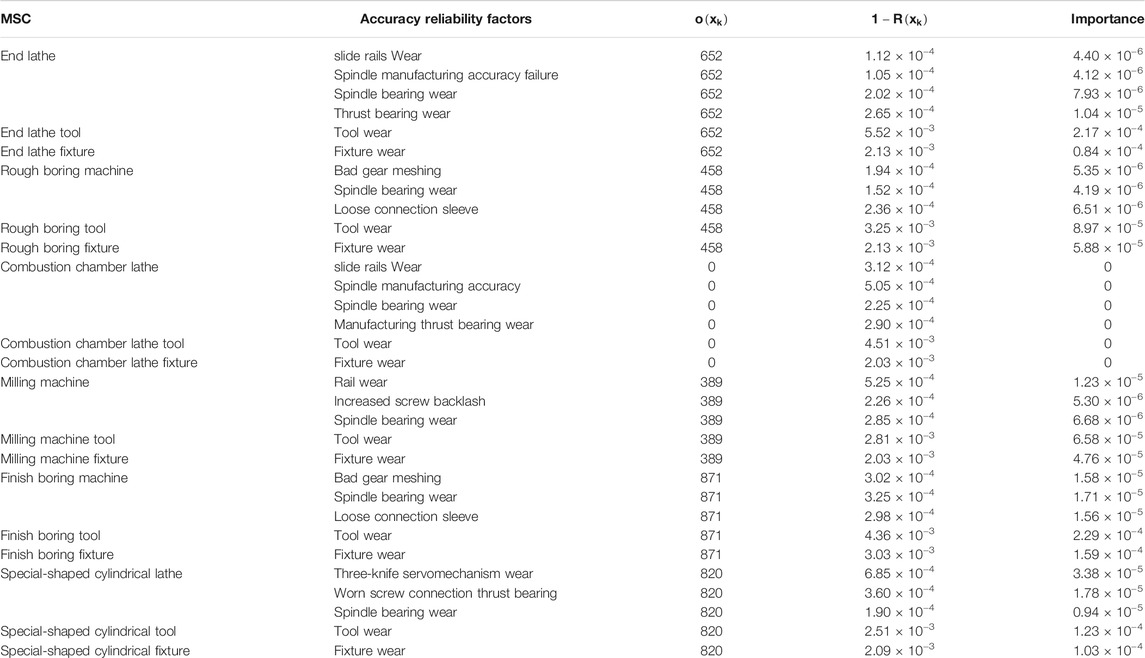
TABLE 3. Accuracy Reliability Oriented system weakness identification.
It can be seen from Table 3 that the node with the greatest control capability for two key quality characteristics is the source of fluctuations for the boring finish machines. These fluctuation source nodes have the same value
7 Conclusion
The accuracy of the production line puts forward higher requirements from the perspective of the workpiece processing process. This paper proposes a method for importance measure in production line system based on network controllability analysis. The performance degradation of the production line equipment will spread along the multi-stage manufacturing process. When the network scale is large, it is difficult to establish a complex coupling relationship among many nodes by using quantitative analysis methods such as FT and BN. The evaluation results are not ideal due to simulation accuracy or lack of training data. In a directed network, applying external control signals can effectively drive the state evolution of the entire network. Inspired by this, the use of network controllability analysis to quantify the control ability of networks can achieve the purpose of identifying a weakness. This paper provides a new idea for reliability analysis of machining systems and has certain reference significance for quality-reliability analysis and importance measure of a complex system.
Data Availability Statement
The original contributions presented in the study are included in the article/Supplementary Material, further inquiries can be directed to the corresponding author.
Author Contributions
DZ, YP, and QL contributed to conception and design of the study.
Funding
This project is supported by the National Key R and D Program of China (2019YFB170620X), National Natural Science Foundation of China (Grant Nos. 51805095 and 71971181), The Guangdong Provincial Natural Science Foundation (Grant No. 2020A1515010879), Hong Kong Scholar Program (XJ2019058), The Science and Technology Planning Project of Guangdong Province of China (Grant Nos. 2019B090916002 and 2019A050503010).
Conflict of Interest
The authors declare that the research was conducted in the absence of any commercial or financial relationships that could be construed as a potential conflict of interest.
Publisher’s Note
All claims expressed in this article are solely those of the authors and do not necessarily represent those of their affiliated organizations, or those of the publisher, the editors and the reviewers. Any product that may be evaluated in this article, or claim that may be made by its manufacturer, is not guaranteed or endorsed by the publisher.
References
Barabasi, A. L., Albert, R., and Albert, R. (1999). Emergence of Scaling in Random Networks[J]. Science 286 (5439), 509509–512512. doi:10.1126/science.286.5439.509
Chen, Z., Zhou, D., Xia, T., and Pan, E. (2021). Reliability Evaluation for Multi-State Manufacturing Systems with Quality-Reliability Dependency. Comput. Ind. Eng. 154, 107166. doi:10.1016/j.cie.2021.107166
Chin, S. P., Cohen, J., Albin, A., Hayvanovych, M., Reilly, E., Brown, G., et al. (2017). A Mathematical Analysis of Network Controllability through Driver Nodes. IEEE Trans. Comput. Soc. Syst. 4 (2), 40–51. doi:10.1109/tcss.2017.2698725
Datta, E., and Goyal, N. K. (2019). Evaluation of Stochastic Flow Networks Susceptible to Demand Requirements between Multiple Sources and Multiple Destinations. Int. J. Syst. Assur. Eng. Manag. 10 (5), 1302–1327. doi:10.1007/s13198-019-00876-9
Diao, G., Zhao, L., and Yao, Y. (2014). A Weighted-Coupled Network-Based Quality Control Method for Improving Key Features in Product Manufacturing Process[J]. J. Intell. Manufacturing 27 (3), 1–14. doi:10.1007/s10845-014-0887-6
Gao, X.-D., Wang, W.-X., and Lai, Y.-C. (2016). Control Efficacy of Complex Networks. Sci. Rep. 6, 28037. doi:10.1038/srep28037
Haifeng, D. U. (2010). Fault Diagnosis Strategy Based on Complex Network Analysis[J]. J. Mech. Eng. 46 (3), 90–96.
He, Y., Shen, Z., and Yin, C. (2014). Reliability Analysis Modeling of Manufacturing Systems Based on Process Quality Data[J]. Beijing Hangkong Hangtian Daxue Xuebao/Journal Beijing Univ. Aeronautics Astronautics 40 (8), 1027–1032.
Hopcroft, J. E., and Karp, R. M. (1971). A N5/2 Algorithm for Maximum Matchings in Bipartite: Switching and Automata Theory,in 1971, 12th Annual Symposium on[C].
Hou, B., Xiang, L., and Cong, L. (2016). Recent Advances and Challenges on Control of Complex Networks in 2016 35th Chinese Control Conference (CCC)[C].
Hou, L. L., Lao, S. Y., Xiao, Y. D., and Bai, L. (2015). Recent Progress in Controllability of Complex Network[J]. Acta Physica Sinica 64 (18). doi:10.7498/aps.64.188901
Jiang, R., and Murthy, D. N. P. (2009). Impact of Quality Variations on Product Reliability. Reliability Eng. Syst. Saf. 94 (2), 490–496. doi:10.1016/j.ress.2008.05.009
Jin, J. J., and Chen, Y. (2001). Quality and Reliability Information Integration for Design Evaluation of Fixture System Reliability[J]. Qual. Reliability Eng. Int. 17 (5). doi:10.1002/qre.416
Liu, D., and Jiang, P. (2010). Fluctuation Analysis of Process Flow Based on Error Propagation Network[J]. J. Mech. Eng. 46 (2). doi:10.3901/jme.2010.02.014
Liu, D. Y., and Jiang, P. Y. (2007). E-quality Control Architecture for Multistage Machining Processes[J]. Jisuanji Jicheng Zhizao Xitong/Computer Integrated Manufacturing Syst. CIMS 13 (4), 782–790.
Liu, Y.-Y., Slotine, J.-J., and Barabási, A.-L. (2011). Controllability of Complex Networks. Nature 473 (7346), 167–173. doi:10.1038/nature10011
Mousavi, S. S., and Haeri, M. (2016). “Controllability Analysis of Networks through Their Topologies,” in 2016 IEEE 55th Conference on Decision and Control (CDC).
Pedro, J. Z., Luis, U.-M., Carlos, H.-Y., and Iker, B.-V. (2014). Mathematical Foundations for Efficient Structural Controllability and Observability Analysis of Complex Systems[J]. Math. Probl. Eng. Theor. Methods Appl. 1, 2014. doi:10.1155/2014/676313
Riascos, L. A. M., Simoes, M. G., and Miyagi, P. E. (2007). A Bayesian Network Fault Diagnostic System for Proton Exchange Membrane Fuel Cells. J. Power Sourc. 165 (1), 267–278. doi:10.1016/j.jpowsour.2006.12.003
Sorrentino, F., di Bernardo, M., Garofalo, F., and Chen, G. (2007). Controllability of Complex Networks via Pinning. Phys. Rev. E Stat. Nonlin Soft Matter Phys. 75 (4 Pt 2), 046103. doi:10.1103/PhysRevE.75.046103
Sun, J., Xi, L., Pan, E., Du, S., and Ju, B. (2009). Integration of Product Quality and Tool Degradation for Reliability Modelling and Analysis of Multi-Station Manufacturing Systems. Int. J. Computer Integrated Manufacturing 22 (3), 267–279. doi:10.1080/09511920802209058
Tan, Z. Y., Ning, C., Chen, D., and Ling, G. (2017). An index to Measure Controllability of Complex Networks: 2017 36th Chinese Control Conference (CCC)[C].
Wang, L., Bai, Y. N., and Chen, M. (2016). Structural Controllability Analysis of Complex Networks in 2016 35th Chinese Control Conference (CCC)[C].
Wang, L., Lu, Z., and Ren, Y. (2020). Joint Production Control and Maintenance Policy for a Serial System with Quality Deterioration and Stochastic Demand[J]. Reliability Eng. Syst. Saf. 199, 106918. doi:10.1016/j.ress.2020.106918
Watts, D. J., and Strogatz, S. H. (1998). Collective Dynamics of 'small-World' networks[J]. England, United Kingdom: Springer Nature.
Xiang, L., Chen, F., Ren, W., and Chen, G. (2019). Advances in Network Controllability. IEEE Circuits Syst. Mag. 19 (2), 8–32. doi:10.1109/mcas.2019.2909446
Yang, S., Chen, S., and Chen, B. (2013). Stability Analysis of Mixed Production Lines Based on Process Routes Optimization[J]. Computer Integrated Manufacturing Syst. 19 (10), 2424–2431.
Yang, Y., Yu, L., Wang, X., Zhou, Z., Chen, Y., Kou, T., et al. (2019). A Novel Method to Evaluate Node Importance in Complex Networks[J]. Phys. A: Stat. Mech. its Appl. 256, 1. doi:10.1016/j.physa.2019.121118
Yong, C., and Jin, J. (2005). Quality-reliability Chain Modeling for System-Reliability Analysis of Complex Manufacturing Processes[J]. IEEE Trans. Reliability 54 (3), 475–488. doi:10.1109/TR.2005.853441
Zhang, F., Jiang, P., Zheng, M., and Cao, W. (2013). A Performance Evaluation Method for Radio Frequency Identification-Based Tracking Network of Job-shop-type Work-In-Process Material Flows. Proc. Inst. Mech. Eng. B: J. Eng. Manufacture 227 (10), 1541–1557. doi:10.1177/0954405413481713
Zhou, X., Yang, F., Zhang, F., and Hui, X. (2013). Evaluation Method of Node Centrality in Complex Directed Network in Fourth International Conference on Multimedia Information Networking & Security[C].
Keywords: importance measure, quality-reliability coupled network, network modeling, network controllability, network controllability
Citation: Zhang D, Pei Y and Liu Q (2022) Quality-Reliability Coupled Network Modeling and Importance Measure of Multi-Stage Manufacturing Systems via Network Controllability Analysis. Front. Mech. Eng 8:813778. doi: 10.3389/fmech.2022.813778
Received: 12 November 2021; Accepted: 17 January 2022;
Published: 09 February 2022.
Edited by:
Kunpeng Zhu, Chinese Academy of Sciences (CAS), ChinaReviewed by:
Junliang Wang, Donghua University, ChinaJunwei Yan, Wuhan University of Technology, China
Xin Lin, Wuhan University of Science and Technology, China
Copyright © 2022 Zhang, Pei and Liu. This is an open-access article distributed under the terms of the Creative Commons Attribution License (CC BY). The use, distribution or reproduction in other forums is permitted, provided the original author(s) and the copyright owner(s) are credited and that the original publication in this journal is cited, in accordance with accepted academic practice. No use, distribution or reproduction is permitted which does not comply with these terms.
*Correspondence: Ding Zhang, ZGluZ3poYW5nMzYxQDE2My5jb20=