 Muhammad Salman Khan1
 Tianbo Peng1,2
 Muhammad Adeel Khan1*
 Asad Khan1
 Mahmood Ahmad3,4*
 Kamran Aziz5
 Mohanad Muayad Sabri Sabri6
 N. S. Abd EL-Gawaad7
- 1Department of Bridge Engineering, College of Civil Engineering, Tongji University, Shanghai, China
- 2State Key Laboratory of Disaster Reduction in Civil Engineering, Tongji University, Shanghai, China
- 3Institute of Energy Infrastructure, Universiti Tenaga Nasional, Kajang, Malaysia
- 4Department of Civil Engineering, University of Engineering and Technology Peshawar (Bannu Campus), Bannu, Pakistan
- 5The Key Laboratory of Road and Traffic Engineering, Ministry of Education, Tongji University, Shanghai, China
- 6Peter the Great St. Petersburg Polytechnic University, Saint Petersburg, Russia
- 7Muhayil Asir, Applied College, King Khalid University, Abha, Saudi Arabia
Accurately predicting key engineering properties, such as compressive and tensile strength, remains a significant challenge in high-performance concrete (HPC) due to its complex and heterogeneous composition. Early selection of optimal components and the development of reliable machine learning (ML) models can significantly reduce the time and cost associated with extensive experimentation. This study introduces four explainable Automated Machine Learning (AutoML) models that integrate Optuna for hyperparameter optimization, SHapley Additive exPlanations (SHAP) for interpretability, and ensemble learning algorithms such as Random Forest (RF), Extreme Gradient Boosting (XGB), Light Gradient Boosting Machine (LGB), and Categorical Gradient Boosting (CB). The resulting interpretable AutoML models O-RF, O-XGB, O-LGB, and O-CB are applied to predict the compressive and tensile strengths of HPC. Compared to a baseline model from the literature, O-LGB achieved significant improvements in predictive performance. For compressive strength, it reduced the Mean Absolute Error (MAE) by 87.69% and the Root Mean Squared Error (RMSE) by 71.93%. For tensile strength, it achieved a 99.41% improvement in MAE and a 96.67% reduction in RMSE, along with increases in R2. Furthermore, SHAP analysis identified critical factors influencing strength, such as cement content, water, and age for compressive strength, and curing age, water-binder ratio, and water-cement ratio for tensile strength. This approach provides civil engineers with a robust and interpretable tool for optimizing HPC properties, reducing experimentation costs, and supporting enhanced decision-making in structural design, risk assessment, and other applications.
1 Introduction
Concrete is one of the most extensively used materials in building and civil engineering structures due to its numerous beneficial engineering characteristics. When reinforced, it offers exceptional strength, and its ability to be molded into various shapes while curing at room temperature makes it an ideal choice for constructing key structural components in apartments and high-rise buildings. Furthermore, concrete’s resistance to high temperatures and water exposure makes it particularly suitable for structures exposed to harsh environmental conditions, such as tunnels, bridges, dams, and reservoirs. The economic efficiency of concrete also plays a major role in its popularity. Conventional concrete is composed of relatively low-cost, readily available materials, including coarse aggregate (such as rocks), fine aggregate (such as sand), cement as the binding material, and water. This offers significant cost advantages compared to materials like steel, which require specialized processing in industrial facilities. Additionally, incorporating supplementary materials such as fly ash and blast furnace slag into the concrete mix can enhance its performance (Neville and Aïtcin, 1998; Leung, 2001). These additives, often industrial by-products, not only improve the material’s sustainability by reducing its environmental impact but also maintain or even strengthen structural integrity (Nguyen et al., 2021; Bouchelil et al., 2025).
Globally, around 3 billion tons of raw materials are used annually for concrete production (Ozturan et al., 2008; Liu et al., 2024a). Despite this, determining the optimal mix for desired strength remains a challenge for manufacturers. Traditional methods, such as 28-day compression tests, are labor-intensive, time-consuming, and prone to experimental errors, often requiring the entire process to be repeated if results are unsatisfactory (Neville, 2012; Yang et al., 2024). Assessing the compressive, flexural, and tensile strengths of concrete is a time-consuming process that requires specific equipment and skilled personnel. These properties, particularly compressive strength, are critical for engineers and concrete manufacturers on-site, as they define concrete grades (Ziolkowski and Niedostatkiewicz, 2019; Aloisio et al., 2022; Khan et al., 2023). In recent years, machine learning (ML) has emerged as a powerful tool for predicting compressive strength based on mix design inputs (Chou et al., 2014; Abuodeh et al., 2020; Ben Chaabene et al., 2020). The advantage of ML is its non-destructive nature, offering accurate predictions without the need for laboratory tests, provided sufficient historical data is available, thus enhancing efficiency and reducing the dependency on traditional methods (Gamil, 2023; Zhou et al., 2020).
The use of machine learning for predicting concrete strength was first introduced in 1998, where linear regression combined with artificial neural networks (ANN) was utilized to estimate the strength of HPC based on historical data (Yeh, 1998; Nunez and Nehdi, 2021; Khan et al., 2025). In recent years, advancements in artificial intelligence have enabled the development of various machine learning (ML) regression models, which have been widely applied to studying material properties (Mintarya et al., 2023; Eyo and Abbey, 2021). For instance, models such as support vector machines (SVM) (Safarzadegan Gilan et al., 2012; Lyu et al., 2021), decision trees (Erdal, 2013), random forests (RF) (Li et al., 2022; Pengcheng et al., 2020; Yasniy et al., 2024), and K-nearest neighbors (KNN) (Ghunimat et al., 2023) have been utilized for predicting the compressive strength of concrete. Advanced methods, such as deep learning, have also been employed using water-to-cement ratios, aggregates, and fly ash to predict recycled concrete’s compressive strength with high accuracy (Deng et al., 2018; Lu et al., 2019; Niu et al., 2024; Yao et al., 2022). Multi-objective genetic programming (MOGP) has also been utilized to predict long-term compressive strength and creep (Ghasemzadeh et al., 2016; Wang et al., 2025; Wang et al., 2024a). Neural networks have been effectively applied for strength prediction in recycled aggregate and demolition waste concrete (Duan et al., 2013; Dantas et al., 2013; (Liu et al., 2024b). Additionally, decision trees and random forests have been used to predict bridge load capacity from inventory data, while probabilistic axial capacity models have been applied to estimate load eccentricity and debonding (Mohamad Alipour et al., 2017; Contento et al., 2022; Wu et al., 2024; Guo et al., 2022). A review emphasized ML’s potential to accurately predict concrete mechanical properties when based on precise data (Ben Chaabene et al., 2020; Wang et al., 2024b; Long et al., 2024; Chen et al., 2024). Furthermore, ML and image processing have been employed to estimate concrete surface roughness, achieving over 93% accuracy (Alireza et al., 2021).
As ML continues to evolve, researchers are striving to enhance the effectiveness of ML algorithms, but deploying high-performance models presents challenges such as selecting the right model type, preparing datasets, and optimizing hyperparameters. Hyperparameter optimization, which involves identifying optimal values to control model behavior, is particularly crucial as it directly affects performance (Sun et al., 2023; Wojciuk et al., 2024; Lu et al., 2023). To address these challenges, automated machine learning (AutoML) has emerged, automating tasks like model selection and hyperparameter tuning to improve efficiency and reduce the need for manual intervention. Despite its advantages, the application of AutoML in civil engineering remains limited, particularly in the domain of high-performance concrete (HPC). This is a significant gap, as accurate prediction of key engineering properties, such as compressive and tensile strength, is essential for optimizing HPC design and reducing the costs associated with extensive experimentation.
Concrete’s heterogeneous nature, with its diverse constituents, makes its behavior complex and difficult to model. Developing accurate and reliable predictive models early in the design process is crucial for minimizing costs and improving efficiency. While AutoML models often achieve high accuracy, their complexity can make it difficult to interpret how individual input variables influence the outcomes. This lack of interpretability is a critical limitation in fields like civil engineering, where transparency and understanding of the factors driving predictions are essential (Liu and Sun, 2023; Huang et al., 2021; Ghasemi et al., 2023). To address this, SHapley Additive exPlanations (SHAP) has been developed as a tool to explain the contribution of each input variable to the model’s predictions, making the results more interpretable and enhancing their practical application (Zhao et al., 2023; Zhao et al., 2024). However, the integration of Machine learning models with advanced hyperparameter optimization techniques, such as Optuna, and interpretability tools like SHAP, remains underexplored in civil engineering applications.
This study aims to address these gaps by introducing next-generation explainable AutoML models that combine Optuna-based hyperparameter optimization, SHAP interpretability, and ensemble learning algorithms such as Random Forest (RF), Extreme Gradient Boosting (XGB), Light Gradient Boosting Machine (LGB), and Categorical Gradient Boosting (CB). The resulting models O-RF, O-XGB, O-LGB, and O-CB are applied to predict the compressive and splitting tensile strengths of HPC. Optuna, a state-of-the-art hyperparameter optimization framework, is particularly novel in this context, as its application in civil engineering and HPC modeling has been limited or unexplored. By leveraging Optuna’s advanced optimization capabilities, this study demonstrates how hyperparameter tuning can significantly enhance model performance and efficiency. The performance of these models is compared to a baseline model from the literature, which represents the best-reported model for predicting HPC properties. Among the proposed models, O-LGB emerged as the best performer, achieving training accuracies of 99.6% for compressive strength prediction and 100% for splitting tensile strength prediction. Compared to the baseline model, O-LGB achieved significant improvements in compressive strength prediction, reducing the Mean Absolute Error (MAE) by 87.69% and the Root Mean Squared Error (RMSE) by 71.93%. Additionally, O-LGB demonstrated a slight improvement in R2 (2.68%), reflecting its strong ability to explain the variance in compressive strength predictions. For tensile strength, O-LGB excelled with a 99.41% improvement in MAE, a 96.67% reduction in RMSE, and a 2.04% increase in R2, further showcasing its superior performance. To enhance interpretability, SHAP analysis was employed to identify the key factors influencing the predictions. For compressive strength, critical factors included age, cement content, water, and blast furnace slag (BFS), while for tensile strength, the most influential factors were compressive strength (fcu), water/binder ratio (w/b), curing age, and water/cement ratio (w/c). These insights provide valuable guidance for optimizing HPC mix designs and improving material performance.
2 High performance concrete data collection and evaluation criteria
2.1 Dataset 1: concrete compressive strength
The first Dataset, consisting of 1,133 samples of concrete compressive strength, was obtained from the UCI Machine Learning Repository (Nguyen et al., 2021; Cheng, 2024; Cheng, 2008). The statistical information, which is directly extracted and calculated from the data, as shown in Table 1. Notably, all data points were complete, so no missing data handling was necessary.
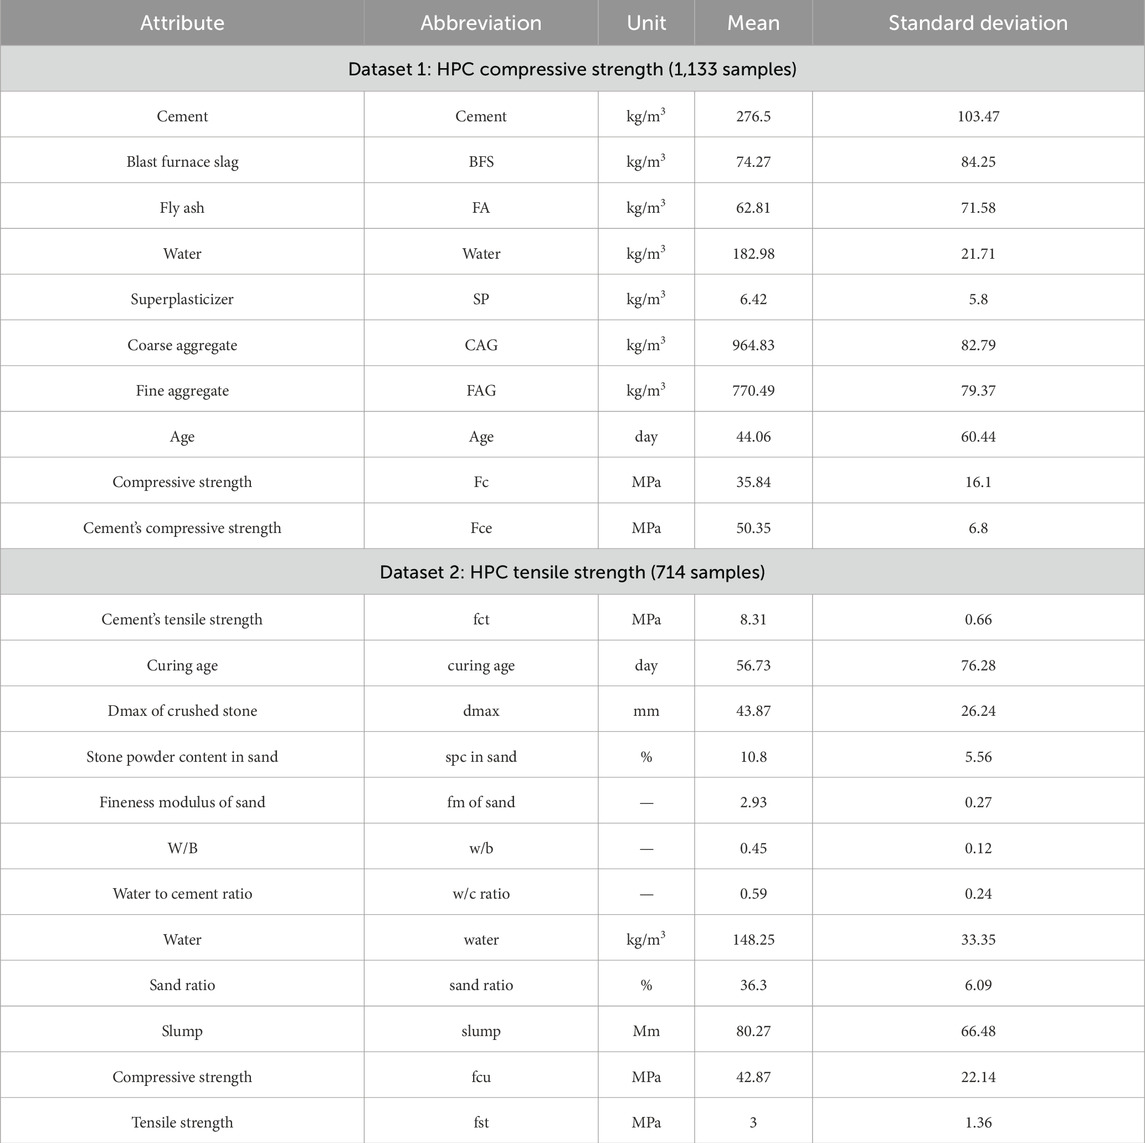
Table 1. Statistical analysis of datasets.
To explore the relationships between the input and output variables in the dataset, the correlations among the features is analyzed. Correlation is a statistical tool that helps describe how one feature is related to another. Insights gained from this analysis can assist in selecting the most suitable predictive model for optimizing the prediction results. Pearson’s method is chosen for calculating the correlation coefficient, as shown in Equation 1.
In this formula, ρ is the Pearson correlation coefficient, with X and Y representing the two features.
The equation ensures that the Pearson coefficient falls within the range of −1 to 1. A value of 0 implies no correlation, meaning there is no direct relationship between the two features. A coefficient of 1 indicates a perfect positive correlation, while −1 indicates a perfect negative correlation. In other words, an increase in one feature is accompanied by an increase (for a positive correlation) or a decrease (for a negative correlation) in the other. A value closer to 1 or -1 suggests a stronger association, while a value nearer to 0 indicates a weaker relationship.
A perfect positive correlation, for example, occurs when a quantity is correlated with itself, resulting in a coefficient of 1. However, in Pearson correlation, it is important to note that a near-zero correlation does not necessarily imply independence. Even with a strong underlying relationship, the correlation coefficient may still be small in some cases.
The correlation matrix for dataset 1 shown in Figure 1 reveals important insights into the relationships between various concrete mixture components and compressive strength. Cement shows the highest positive correlation with compressive strength (0.489), indicating that increasing cement content tends to enhance the strength of the concrete. Superplasticizer (SP) and age also show positive correlations with compressive strength, at 0.356 and 0.324 respectively, suggesting that the inclusion of SP and longer curing times improve the concrete’s load-bearing capacity. Conversely, water content displays a negative correlation of −0.278 with compressive strength, aligning with the well-established principle that excessive water weakens concrete. Other components, like coarse aggregate (CAG) and fly ash (FA), show weaker correlations with compressive strength (−0.155 and −0.064 respectively), indicating a lesser but still significant influence on overall concrete performance. The matrix further shows that certain variables, such as SP and water, are negatively correlated with each other (−0.588), demonstrating the balance required when adjusting mixture proportions. These findings emphasize the importance of optimizing material proportions to achieve the desired concrete strength.
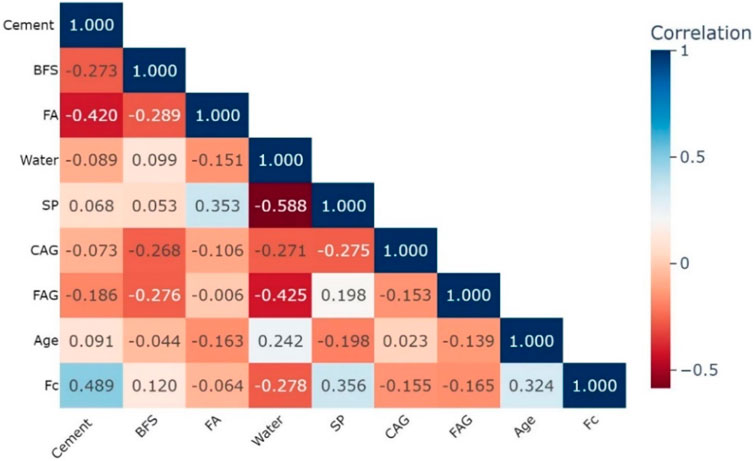
Figure 1. Pearson correlation plot of features in dataset 1.
2.2 Dataset 2: concrete tensile strength
Dataset 2, comprising 714 samples that record both input and output data related to tensile strength, is taken from Zhao et al. (2017). A statistical summary of this dataset is presented in Table 1. In their study, Zhao et al. conducted exploratory data analysis (EDA) to manage the issue of missing data, employing an imputation strategy to ensure the use of all features. The missing values were addressed using the mean imputation method, a widely adopted approach that replaces missing entries with the average value of the respective feature (Brown, 1994; Kang, 2013; He et al., 2024).
Following the same approach as outlined for Dataset 1, a correlation matrix for the input features of Dataset 2 (after imputing missing values) is illustrated in Figure 2.
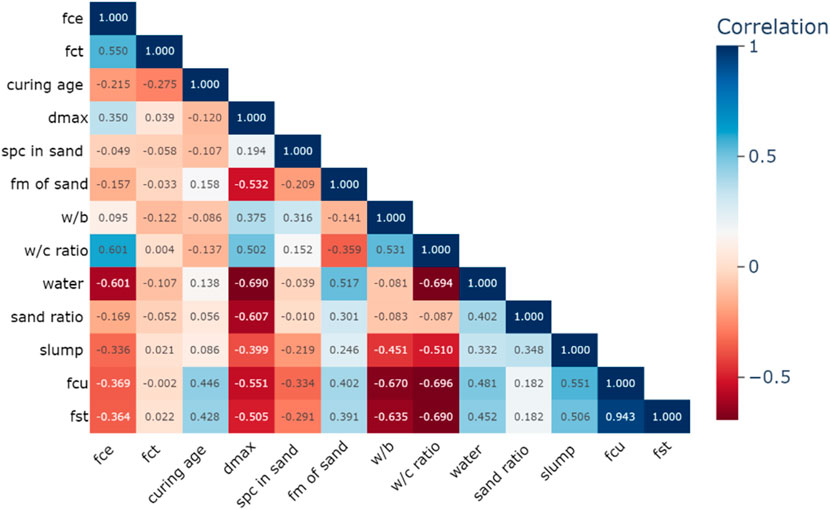
Figure 2. Pearson correlation plot of features in dataset 2.
Figure 2, highlights the relationships between key variables influencing the tensile strength (fst) of HPC. fst shows a strong positive correlation with compressive strength (fcu) (0.943), indicating that higher compressive strength leads to improved tensile strength. It also has a moderate positive correlation with slump (0.506), suggesting a link between workability and strength. Negative correlations are observed with w/c ratio (−0.690), w/b (−0.635), and dmax (−0.505). Other factors, like curing age, positively correlate with compressive strength (0.446), while fine aggregate properties (e.g., FM of sand and sand ratio) exhibit weaker relationships. Curing age shows a moderate positive relationship with compressive strength (0.446), suggesting that longer curing improves strength properties over time. Fine aggregate properties, such as the fm of sand and sand ratio, show weaker correlations with tensile strength but still play a role in mix design, particularly through their influence on water demand and workability.
2.3 Performance evaluation criteria
To assess the performance of prediction algorithms, four metrics are typically employed: the coefficient of determination (R2), root mean squared error (RMSE), mean absolute percentage error (MAPE), and mean absolute error (MAE). The R2 value, as given by Equation 2, measures the linear correlation between predicted and actual values, ranging from 0 to 1, with higher values indicating better model performance. RMSE, as shown in Equation 3, is the square root of the average squared differences between predicted and actual values, representing the model’s prediction accuracy. MAE, detailed in Equation 4, calculates the average of absolute differences between predicted and observed values, offering a measure of prediction precision. MAPE, shown in Equation 5, assesses prediction accuracy by calculating the average of the absolute percentage errors. Lower values for both RMSE and MAE signify improved model performance.
where, yi and
3 Machine learning algorithms and hyperparameter search space
3.1 Ensemble learning algorithms
This study utilizes ensemble learning techniques to predict both compressive and splitting tensile strength, focusing on two primary methods: bagging and boosting. Bagging works by splitting the dataset into several subsets, training models on each subset simultaneously, and then averaging the results for the final prediction. A well-known example is Random Forest (RF), introduced by Breiman (Breiman, 2001), which builds multiple decision trees from randomly selected features as shown in Figure 3. The parallel training of these trees enhances the model’s robustness and helps prevent overfitting. In regression tasks, the output is averaged across all trees, while in classification, the final prediction is based on majority voting.
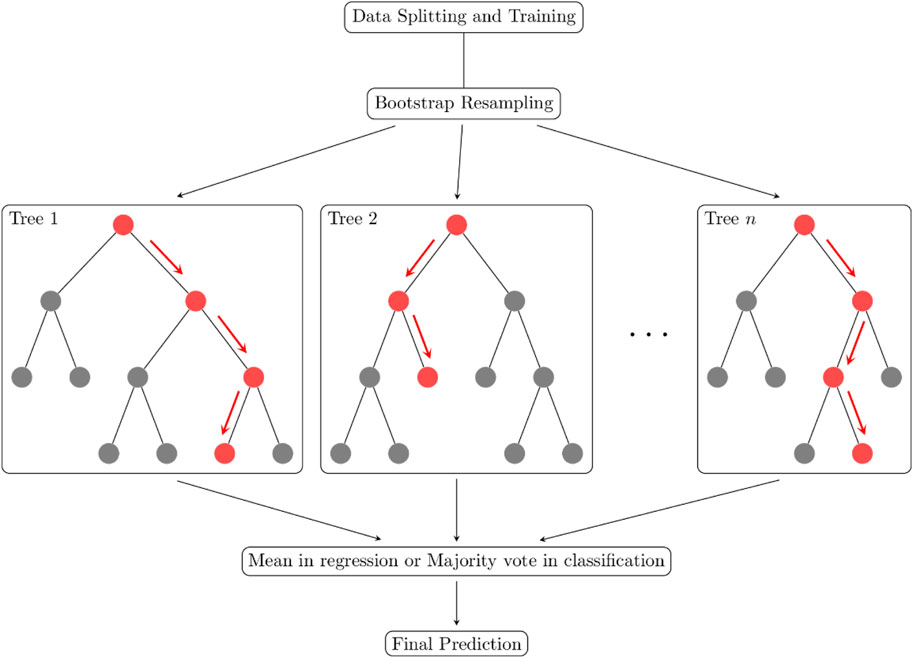
Figure 3. Flow chart of random forest.
Boosting, on the other hand, sequentially trains weak learners, with each iteration focusing on correcting errors from the previous one (Schapire, 1999). Adaptive Boosting (AB), initially developed by Freund and Schapire (Freund and Schapire, 1996), was a pioneering method in this category. Subsequent algorithms, such as Gradient Boosting Machine (GB) (Friedman, 2001), Extreme Gradient Boosting (XGB) (Chen and Guestrin, 2016), and Light Gradient Boosting Machine (LGB) (Ke et al., 2017), further enhanced accuracy and efficiency. LGB, known for its speed, uses techniques like gradient-based one-side sampling (GOSS) and exclusive feature bundling (EFB) to improve performance. Similarly, Categorical Gradient Boosting (CB) (Prokhorenkova et al., 2018) optimizes boosting for datasets with categorical variables, employing minimal variance sampling (MVS) to enhance split accuracy and performance across diverse data types.
3.2 Explainable AutoML models
Hyperparameter tuning is essential for enhancing the performance of machine learning models. Unlike model parameters, hyperparameters are not learned from the training data, necessitating a distinct optimization process. Traditionally, researchers have relied on manual tuning, which is time-intensive and heavily reliant on the expertise of the researcher. This manual approach often requires days or even weeks to achieve optimal results, underscoring the increasing demand for AutoML methods (Hertel et al., 2020). Optuna is an innovative, open-source optimization framework that employs the Tree-structured Parzen Estimator (TPE), a sequential model-based algorithm specifically designed for hyperparameter optimization. TPE constructs probabilistic models to sample hyperparameters more efficiently than conventional Bayesian optimization approaches (Xiao et al., 2024). In Optuna, hyperparameter tuning is framed as the optimization of an objective function, with hyperparameters being adaptively generated throughout each trial (Akiba et al., 2019). This approach integrates seamlessly with SHAP and ensemble learning models like RF, XGB, LGB, and CB, leading to explainable AutoML models such as O-RF, O-XGB, O-LGB, and O-CB. These models enhance both performance and interpretability, offering a robust AutoML solution. However, the use of Optuna in civil engineering applications remains relatively underexplored.
SHAP introduced by Lundberg and Lee (2017). in 2017, is a widely used tool for model interpretation, as it explains predictions by assessing the importance of individual features, their interactions, dependencies, and contributions to specific outcomes. SHAP improves the interpretability of AutoML models, particularly in predicting damage states, by providing a quantitative measure of each feature’s influence. The SHAP framework is based on an additive attribution approach, where the model’s output is represented as a linear combination of feature values, with each feature’s contribution calculated using Shapley values, as outlined in Equation 6.
where N represents the number of input features, øo denotes the base value, and øi is the Shapley value corresponding to the ith feature. The model’s output is derived by summing the contributions of all feature characteristics. This approach, rooted in game theory, aims to interpret the marginal contribution of each feature to the model’s output, providing insights from both a local (individual prediction) and global (entire dataset) perspective. Locally, SHAP offers precise details on how individual features influence specific predictions, while globally, it reveals broader trends in feature importance. This dual focus is particularly useful for interpreting complex machine learning models, as it clarifies the impact of each feature (Hadzima-Nyarko et al., 2020; Zhao et al., 2023). Shapley values are used to compute the contribution of each feature, ensuring a fair and accurate evaluation of feature importance, as represented in Equation 7.
where øi represents the Shapley value for feature i, ᵹ refers to a subset of features, f denotes the black-box model, and N is the total number of features. This formulation ensures a fair and precise assessment of each feature’s contribution, offering valuable insights into the model’s decision-making process.
3.3 Hyperparameters search space configuration for optuna
For hyperparameter optimization using Optuna, different models were tuned with specific parameter ranges as shown in Table 2. These ranges were selected to capture the variability in model performance while ensuring a comprehensive search space. The hyperparameters for O-XGB, O-RF, O-CB, and O-LGB are essential for fine-tuning model performance. For O-XGB, the n_estimator parameter controls the number of boosting rounds, balancing accuracy and computation, while max_depth manages tree complexity, preventing overfitting by limiting how deep trees can grow. The learning_rate determines the step size during training. Subsample introduces randomness by selecting a fraction of data for each tree, and gamma prevents unnecessary splits by enforcing a minimum loss reduction threshold. O-RF hyperparameters include n_estimator, which dictates the number of trees to enhance model robustness, and max_depth to limit how deep the trees grow. The min_samples_split and min_samples_leaf parameters control the minimum number of samples required to split a node and form a leaf. Additionally, max_features determines how many features are considered at each split, sqrt or log2 adding randomness to improve diversity among trees.
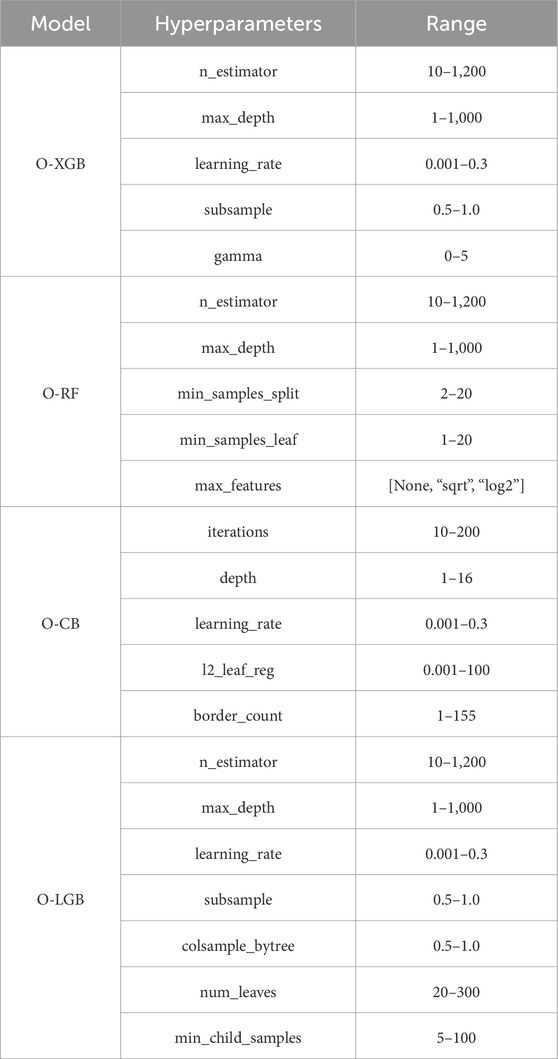
Table 2. Hyperparameters ranges for Optuna.
O-CB optimizes performance through iterations, which sets the number of boosting rounds, and depth, limiting tree size to balance accuracy and speed. The learning_rate fine-tunes the contribution of each tree, while l2_leaf_reg applies L2 regularization to prevent overfitting by penalizing large leaf values. Border_count defines the number of splits for numerical features, controlling how finely patterns are captured. Whereas, O-LGB shares many similarities with XGBoost but offers unique hyperparameters like num_leaves, which defines the maximum number of leaves per tree, allowing for more complex decision boundaries. Min_child_samples ensures a minimum number of data points in leaves, reducing overfitting in small data splits. Additionally, colsample_bytree controls the fraction of features considered at each split, and subsample determines the fraction of data used for training, promoting diversity among trees.
3.4 Conceptual framework of research
The conceptual framework of this research as shown in Figure 4 involves a structured approach starting from data collection, where two datasets comprising 1,133 and 714 samples. Feature analysis follows, incorporating both Pearson Correlation Matrix and Statistical Analysis, which includes computing minimum, maximum, mean, and standard deviation values for deeper insights into the data. In the model development phase, the study proposes using explainable models like O-XGB, O-RF, O-CB, and O-LGB, compared against a base model from literature (Nguyen et al., 2021). Performance evaluation is conducted using metrics like MAE, RMSE, MAPE, and R2. Model ranking analysis then identifies the best-performing model, followed by an improvement of each metric relative to base model and final interpretation using SHAP analysis for feature significance, ensuring the model’s interpretability.

Figure 4. Conceptual framework of research.
This structured flow ensures a thorough evaluation and comparison of various machine learning models, focusing on explainability, performance metrics, and feature importance, helping in the selection of the optimal model for predicting compressive strength and splitting tensile strength of HPC.
4 Results and discussion
4.1 AutoML model performance comparison
The results of predicting the compressive strength and splitting tensile strength of HPC using Optuna integrated with SHAP and different ML algorithms (XGB, RF, CB, and LGB) highlight some key differences in performance across models. These results are evaluated based on common metrics such as MAE, RMSE, MAPE, and R2, which indicate the accuracy and efficiency of each model.
For compressive strength as shown in Table 3, O-XGB shows relatively good performance, especially in training where it achieves an MAE of 0.661, RMSE of 1.234 and MAPE of 2.42, along with a strong R2 of 0.994, indicating a nearly perfect fit during training. However, when tested on unseen data, the MAE increases to 2.929, RMSE to 3.979, MAPE of 10.08 and the R2 drops slightly to 0.939. This drop suggests that while the model fits the training data well, there is a noticeable decline in performance during testing, likely due to overfitting or lack of generalization. O-RF, on the other hand, performs worse than O-XGB, with an even larger gap between training and testing performance. During training, the MAE is 1.281, RMSE is 1.972, MAPE of 4.49, with a high R2 of 0.985. However, in testing, the model struggles, with a much higher MAE of 3.777, RMSE of 5.246, MAPE of 12.23, and the R2 drops to 0.894, suggesting it does not generalize well to new data. Whereas, O-CB strikes a good balance between training and testing. In training, it shows decent results with an MAE of 1.205, RMSE of 1.788 and MAPE of 4.23, along with an R2 of 0.988. During testing, its MAE improves to 2.642, RMSE to 3.759 and MAPE of 8.95, with a respectable R2 of 0.945. This suggests that CB maintains strong generalization, handling the testing data more efficiently compared to the other models. Finally, O-LGB delivers the best training performance for compressive strength prediction, with an incredibly low MAE of 0.304 and RMSE of 1.061, MAPE of 1.02 and a near-perfect R2 of 0.996. During testing, although its MAE and RMSE increase to 2.651 and 3.813, respectively, it still maintains a high R2 of 0.944, indicating that this model is highly reliable and consistent across both training and testing phases. Overall, O-LGB emerges as the best model for compressive strength prediction due to its balance of excellent training results and strong testing performance.
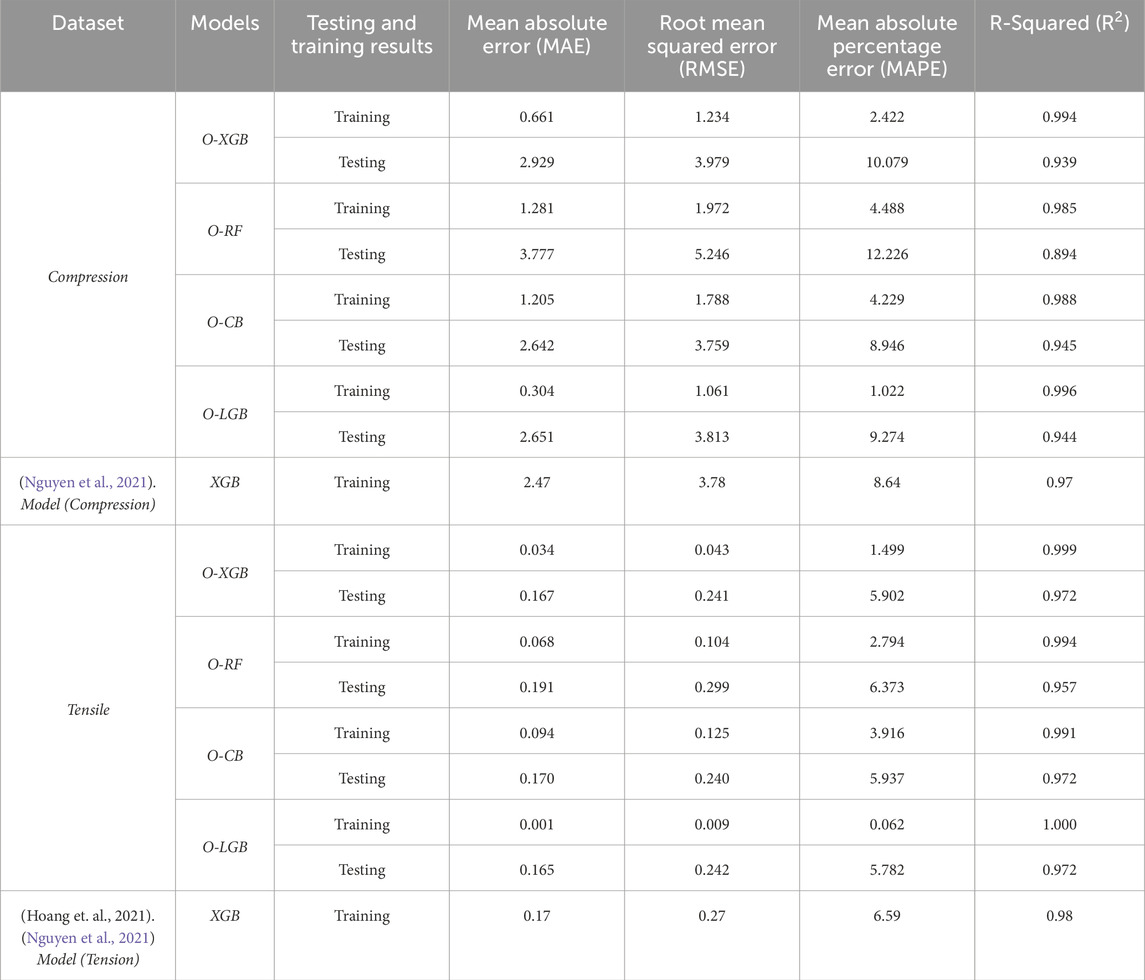
Table 3. Model performance comparison.
For splitting tensile strength (fst) as shown in Table 3, O-XGB demonstrates outstanding training performance with an MAE of 0.034, RMSE of 0.043, MAPE of 1.50 and an R2 of 0.999, showing near-perfect predictions. However, when tested, the MAE increases to 0.167, RMSE to 0.241, and MAPE of 5.90, with an R2 of 0.972, showing a slight decline in performance but still achieving impressive results overall. O-RF again performs worse in testing compared to training, with an MAE of 0.068, RMSE of 0.104, and MAPE of 2.80 during training, and an R2 of 0.994. In testing, however, the MAE rises to 0.191, RMSE to 0.299, MAPE of 6.37 and R2 drops to 0.957, indicating that this model may have difficulties generalizing on unseen data. Whereas, O-CB performs similarly to O-XGB, with training results showing an MAE of 0.094, RMSE of 0.125, MAPE of 3.92 and an R2 of 0.991. During testing, the MAE improves slightly to 0.170, the RMSE remains at 0.240, and MAPE of 5.94, with an R2 of 0.972, suggesting that CB performs equally well for both training and testing, making it a robust model for splitting tensile strength predictions. O-LGB, however, stands out with an almost perfect fit during training, showing an MAE of 0.001, RMSE of 0.009, MAPE of 0.06, and an R2 of 1.000. During testing, the MAE increases slightly to 0.165, with an RMSE of 0.242, MAPE of 5.78, but it still maintains a high R2 of 0.972, making it the top-performing model for tensile strength predictions as well.
When compared to the base model, where XGB was identified as the best-performing model (Nguyen et al., 2021), the models in this analysis significantly outperform it as depicted in Table 3. The base model reported an MAE of 2.47, RMSE of 3.78, and MAPE of 8.64 on training datasets for compressive strength, both of which are considerably higher than the values achieved in this study, particularly by O-LGB. Similarly, for tensile strength, the base model’s MAE of 0.17, RMSE of 0.27 and MAPE of 6.59 are slightly worse than the results from Optuna models, with O-LGB and O-XGB delivering superior performance.
Figures 5, 6 present regression plots comparing the actual and predicted values from four AutoML models during both the training and testing phases, along with a best-fit line. These plots also display the R2 scores. In Figure 6, O-LGB stands out, achieving R2 scores of 0.944 for the testing set and 0.996 for the training set, showcasing excellent performance. O-XGB follows closely, with R2 scores of 0.939 for testing and 0.994 for training, indicating a similarly strong fit. Both models effectively handle outliers, as seen in Figure 5. Likewise, Figure 6 highlights the regression plots for splitting tensile strength predictions. O-LGB once again achieves the highest R2 scores of 0.972 for testing and 1.000 for training, reinforcing its leading performance. O-XGB performs nearly as well, with R2 scores close to O-LGB, demonstrating robust predictive ability.
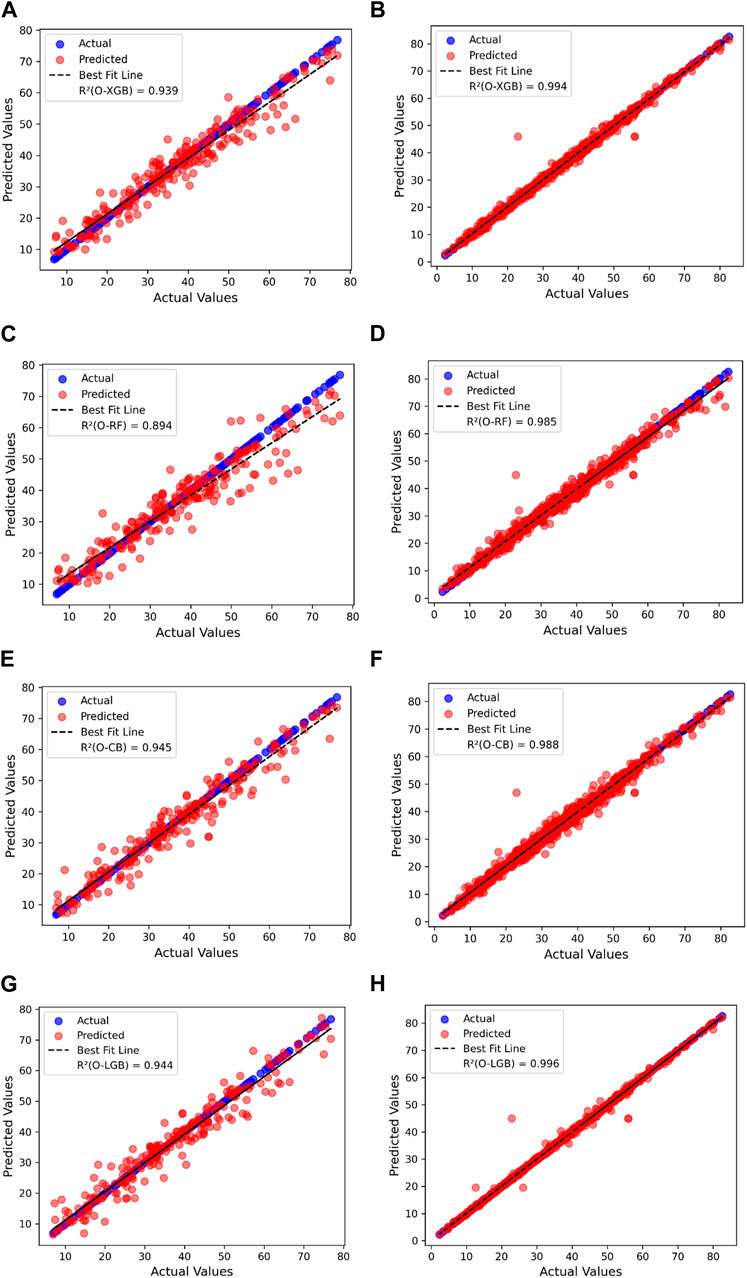
Figure 5. Actual vs. predicted values of compressive strength of HPC on testing and training dataset. (A) O-XGB prediction on testing data. (B) O-XGB prediction on training data. (C) O-RF prediction on testing data. (D) O-RF prediction on training data. (E) O-CB prediction on testing data. (F) O-CB prediction on training data. (G) O-LGB prediction on testing data. (H) O-LGB prediction on training data.
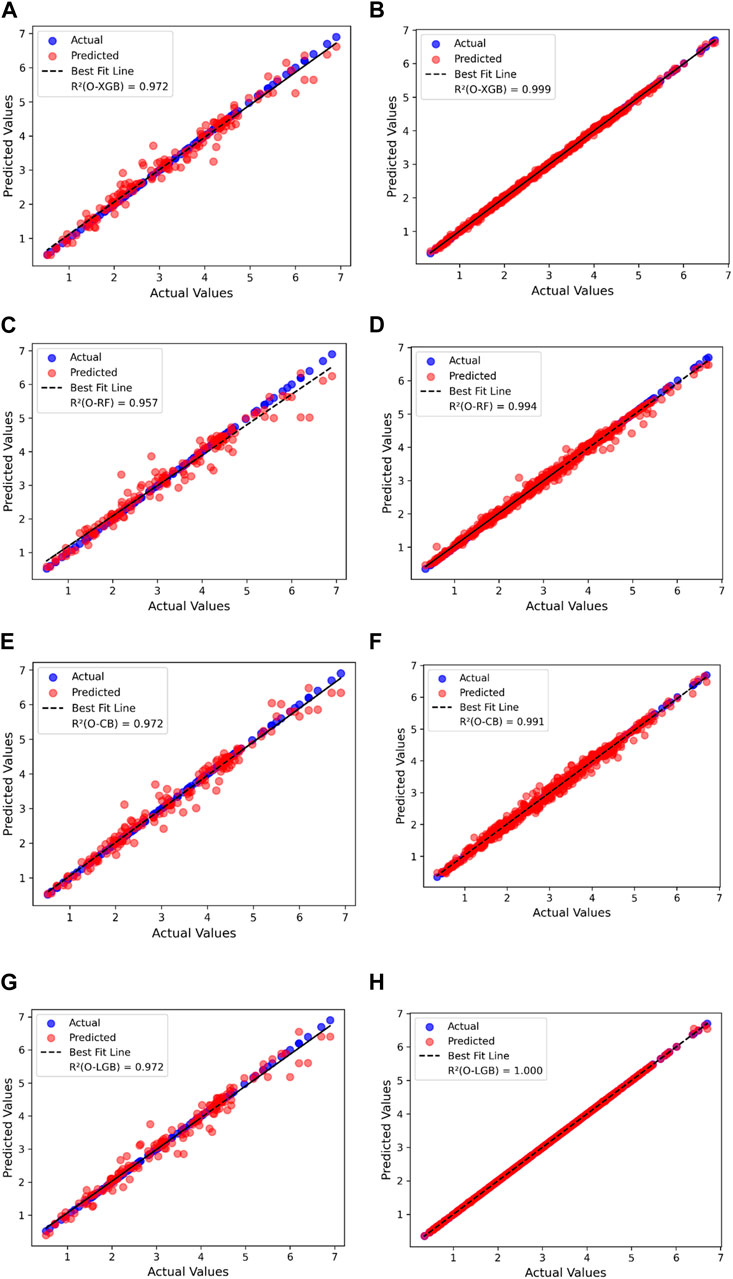
Figure 6. Actual vs. predicted values of splitting tensile strength of HPC on testing and training dataset. (A) O-XGB prediction on testing data. (B) O-XGB prediction on training data. (C) O-RF prediction on Testing data. (D) O-RF prediction on training data. (E) O-CB prediction on testing data. (F) O-CB prediction on training data. (G) O-LGB prediction on testing data (H) O-LGB prediction on training data.
4.2 Model improvement (%)
To compare the performance of different models (O-XGB, O-RF, O-CB, O-LGB) with a base model, improvements are calculated for key metrics: MAE and RMSE on a training dataset. The formula used is the percentage improvement of the model metric relative to the base model, with higher reductions in MAE and RMSE indicating better performance. The improvements are aggregated across these metrics, and models are ranked based on their overall performance, with the model showing the highest improvement across all metrics ranked the highest. This process can be repeated for both compressive strength and tensile strength predictions, allowing easy interpretation of model improvement relative to the base model.
For compressive strength as shown in Figure 7, O-XGB shows substantial improvement with a 73.24% reduction in MAE and a 67.35% reduction in RMSE, reflecting a significant boost in accuracy and error minimization. O-RF offers moderate improvements, with a 48.14% reduction in MAE and 47.83% in RMSE, O-CB, similarly, achieves a 51.21% improvement in MAE and 52.70% in RMSE, showing that it handles errors moderately well, though less effectively than O-XGB. O-LGB stands out with the highest improvements for compressive strength, reducing MAE by 87.69% and RMSE by 71.93%. Overall, O-LGB is the most accurate model for compressive strength prediction of HPC, closely followed by O-XGB, with both outperforming the other models in terms of error reduction.
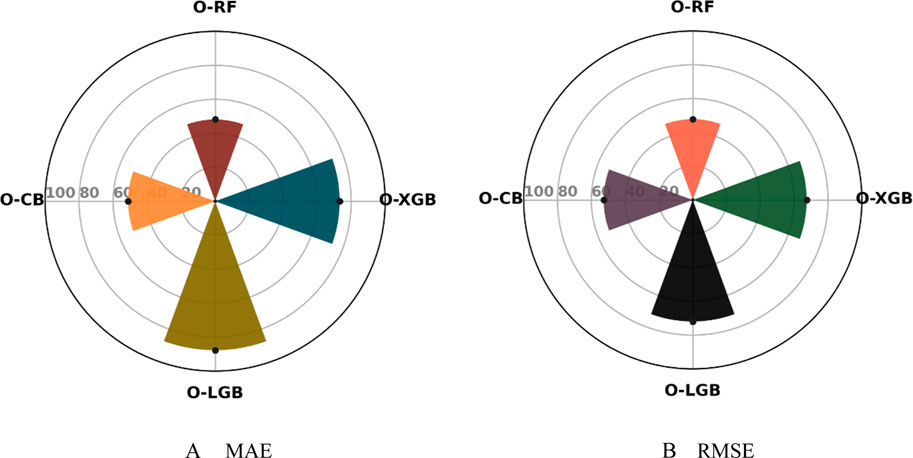
Figure 7. Performance improvement for compressive strength of HPC relative to base model.
For tensile strength as shown in Figure 8, O-XGB delivers significant accuracy gains, with an 80% reduction in MAE and an 84.07% reduction in RMSE. O-RF follows with a 60% improvement in MAE and 61.48% in RMSE, showing decent error reduction. O-CB provides the lowest gains for tensile strength, with a 44.71% improvement in MAE and a 53.70% reduction in RMSE. O-LGB emerges as the top performer for tensile strength, with a near-perfect 99.41% improvement in MAE and a 96.67% reduction in RMSE, far exceeding the other models. O-LGB consistently provides the most significant improvements across all metrics for tensile strength prediction of HPC, making it the most accurate model, with O-XGB performing well but still falling behind O-LGB in this task.
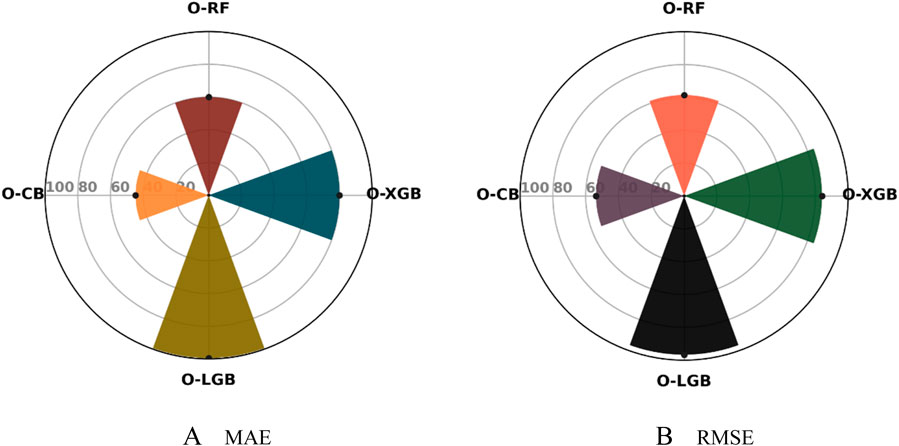
Figure 8. Performance Improvement for Splitting tensile strength of HPC relative to Base model.
4.3 Model score analysis
The score analysis reveals that the O-LGB model consistently outperformed all other models in predicting both compressive and splitting tensile strength as shown in Table 4. For compressive strength, O-LGB achieved the highest total score of 28, with 16 points in the training phase and 12 points in the testing phase, ranking first across all metrics (MAE, RMSE, MAPE, and R2). Similarly, for splitting tensile strength, O-LGB ranked first again, earning a total score of 30, with 16 points during training and 14 during testing. In this scoring analysis, a score of 4 indicates the best performance for each metric, while 1 represents the lowest. These results highlight that O-LGB consistently outperformed O-XGB, O-RF, and O-CB in both strength prediction tasks.
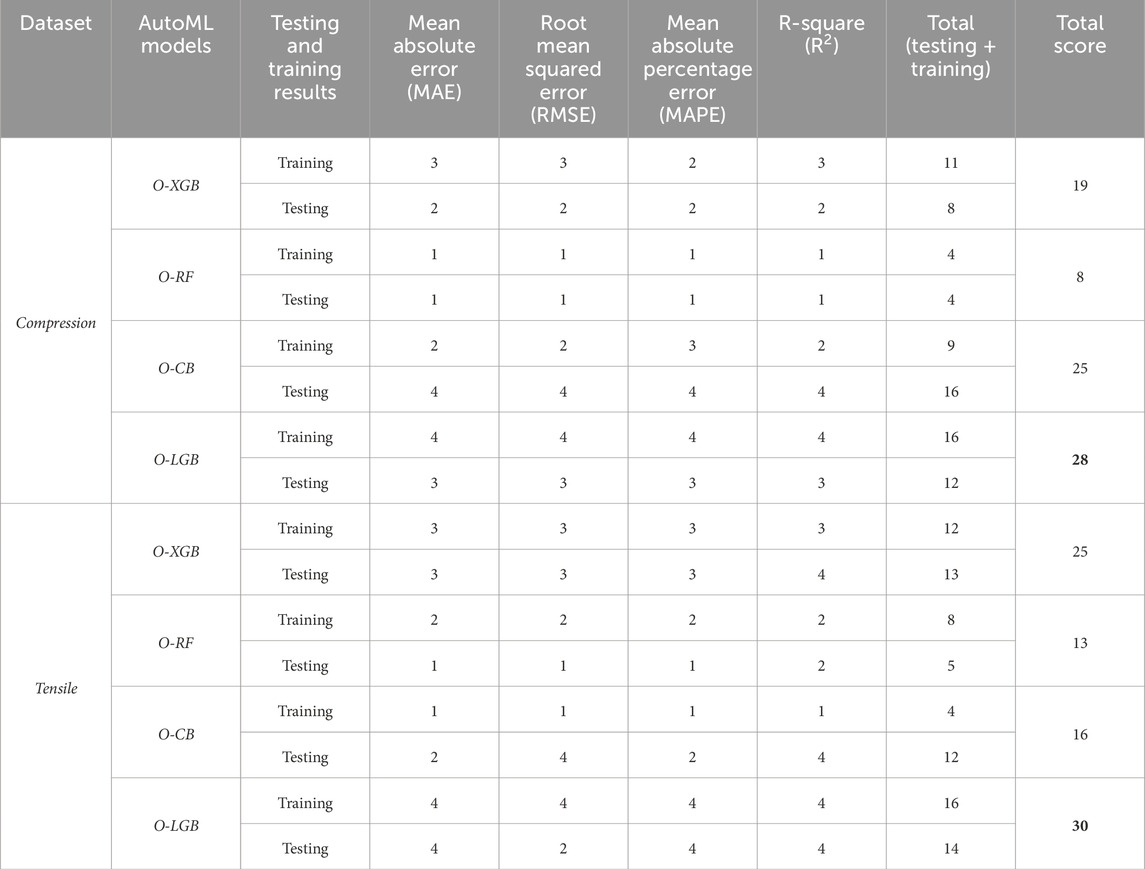
Table 4. Model score analysis.
5 Global feature interpretation
Among the four AutoML models, O-XGB, O-RF, O-CB, and O-LGB, O-LGB is the best-performing model after model score analysis. The optimized hyperparameter for predicting the compressive strength and tensile strength of HPC using O-LGB are shown in Table 5. Additionally, SHAP analysis is performed using the best-performing model to determine the individual feature contributions to compressive and tensile strength predictions.
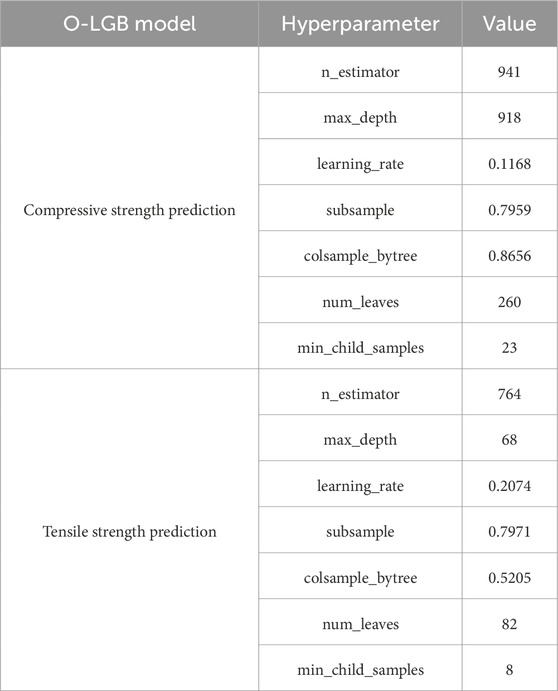
Table 5. Optimized selected hyperparameters of O-LGB.
SHAP visualizations provide a comprehensive understanding of how various features influence a ML model’s prediction. The SHAP heatmap illustrates the impact of input features on the predicted compressive and splitting tensile strength of HPC, where each row represents a feature, and each column corresponds to a dataset instance. The color scale reflects the magnitude of the SHAP values, with red indicating a positive contribution and blue a negative one. The black curve at the top demonstrates the variation in predictions across instances, while the heatmap below shows how each feature contributes to these predictions. Additionally, a bar plot ranks features by their global importance. The SHAP decision plot complements this by visualizing the contribution of each feature to the model’s predictions across multiple instances. Furthermore, the SHAP dependency plot reveals interactions between features, showing how they affect each other and the overall model output, offering a deeper insight into feature dependencies.0.
5.1 Impact of features on compressive strength of HPC
The SHAP heatmap as shown in Figure 9A and decision plot as shown in Figure 9B together provide a detailed understanding of how different features influence the predicted compressive strength of HPC. From the decision plot, it is evident that Age and Cement are the most influential features, contributing significantly to higher predictions of compressive strength. In the decision plot, the red lines for Age and Cement indicate their strong positive impact, especially in instances where both features are high. This relationship is further supported by the heatmap, where Age and Cement show consistently strong contributions, with red areas indicating a positive effect across many instances. Age, in particular, plays a dominant role in pushing predictions upward, which is aligned with the established understanding that concrete strength increases with age.
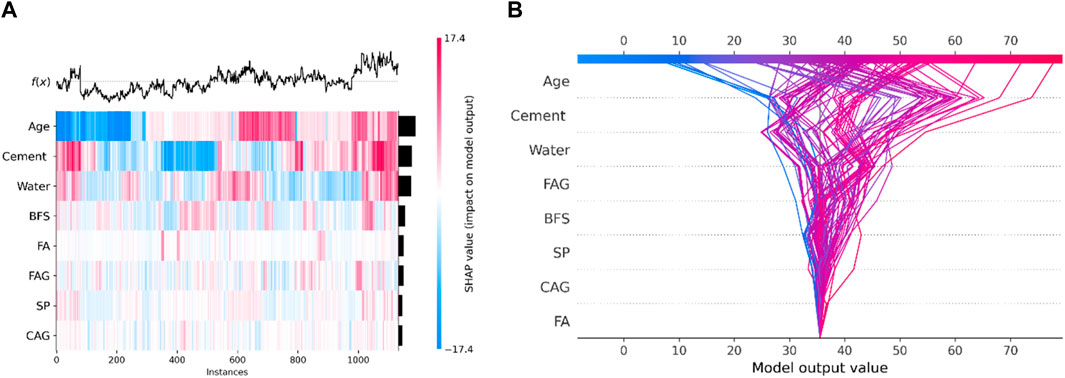
Figure 9. Global impact of features on compressive strength of HPC. (A) SHAP heat map. (B) SHAP decision plot.
Water shows a more complex interaction in both the decision plot and heatmap. In the heatmap (Figure 9A), the alternating bands of blue and red for water show that its effect is not uniform. In some instances (red zones), water has a positive impact, slightly increasing compressive strength, while in others (blue zones), it has a negative impact, reducing the strength. This variation indicates that water’s contribution is highly dependent on the accompanying feature values, such as Cement, BFS, and FA. For example, when combined with higher cement content or balanced supplementary materials, water might assist in hydration and improve strength, but when in excess or combined with specific material ratios, it dilutes the paste and reduces strength. The heatmap captures mixed behavior of water through its gradient of colors. In the decision plot (Figure 9B), this interplay is further clarified. The blue lines show instances where water negatively impacts the predicted compressive strength, especially at higher levels, consistent with the understanding that excess water weakens the concrete by diluting the paste. However, some pink and red lines indicate that in specific scenarios, water can positively contribute to compressive strength. These variations in the slope and direction of the lines reflect how water interacts differently depending on the values of other features. For instance, a steep blue line suggests a strong negative influence of water in those instances, possibly due to an imbalance with Cement or BFS, while a red line suggests a positive influence, likely due to improved hydration or workability when paired with other optimal material proportions.
Other features, such as BFS (Blast Furnace Slag), FAG (Fine Aggregate), and SP, play secondary roles, as seen in both plots. These features contribute positively or negatively depending on the instance, with their influence more dependent on the specific mix composition. The decision plot shows variability in their contributions, indicating that their impact is less consistent compared to Age and Cement. The heatmap further confirms this variability, showing that while these features are important, their influence is context-dependent and often moderated by other factors in the mix, such as water content and the proportion of cementitious materials. Together, the decision plot and heatmap emphasize the critical role of Age, Cement, and Water in determining compressive strength, with other features contributing in more complex, instance-specific ways.
Similarly, The SHAP dependency graph as shown in Figure 10 reveals complex interdependencies among input features affecting the predicted compressive strength of concrete. Cement has a strong, consistent positive impact, with its increasing content significantly boosting strength, while water shows a more intricate relationship, lower levels enhance strength, but excess water reduces it, although this negative effect can be mitigated by higher cement levels. BFS and FA positively contribute up to a certain limit, beyond which their effects stabilize. SP interacts minimally with BFS, showing diminishing returns as its concentration increases. FAG reduce compressive strength, while CAG offer a slight positive influence. Aging of the concrete strongly enhances strength up to 100 days, particularly when paired with higher cement content. Overall, cement, age, and a balanced water-to-cement ratio are the most critical factors, while BFS, FA, SP, and aggregates have more complex and secondary effects.
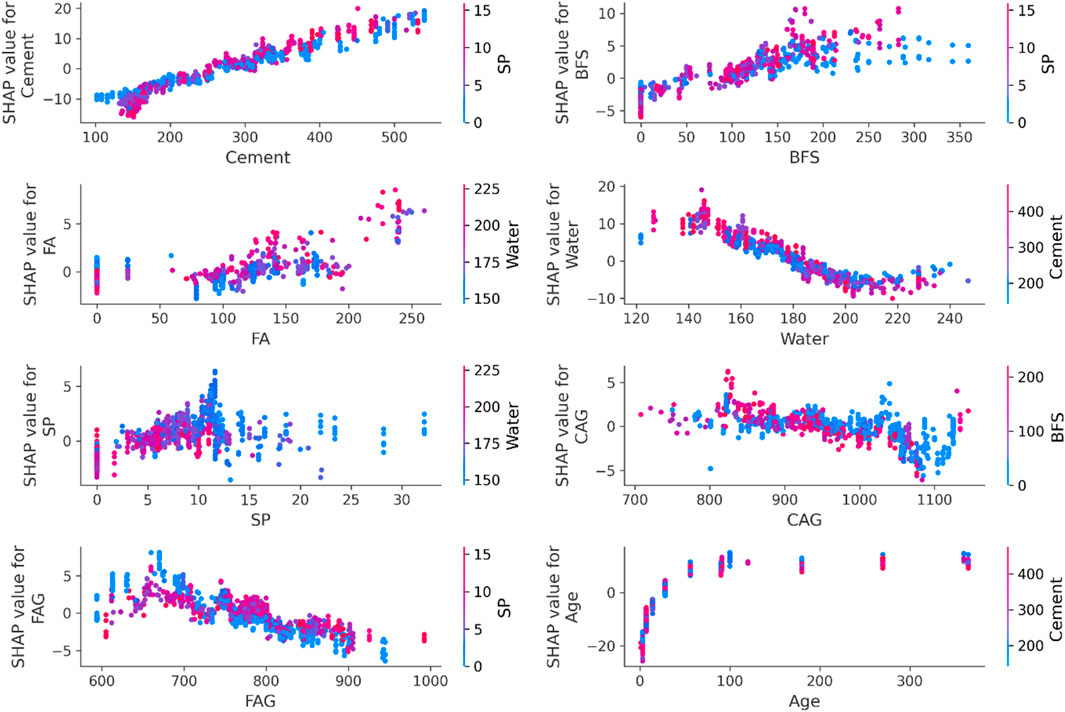
Figure 10. Feature dependency on compressive strength of HPC.
5.2 Impact of features on splitting tensile strength of HPC
The SHAP heatmap (Figure 11A) and decision plot (Figure 11B) offer a clear view of how each feature contributes to the predicted splitting tensile strength of HPC. Starting with the most influential feature, fcu plays a dominant role in determining splitting tensile strength. In both the heatmap and decision plot, fcu generally shows a strong positive impact, where higher values of fcu significantly increase the predicted splitting tensile strength. This is reflected by the predominantly red SHAP values in the heatmap and the sharp upward shifts in the decision plot, indicating that as compressive strength increases, the splitting tensile strength also tends to increase. However, the heatmap also shows instances with blue SHAP values, indicating that fcu can have a negative impact in certain cases, particularly when its value is lower.
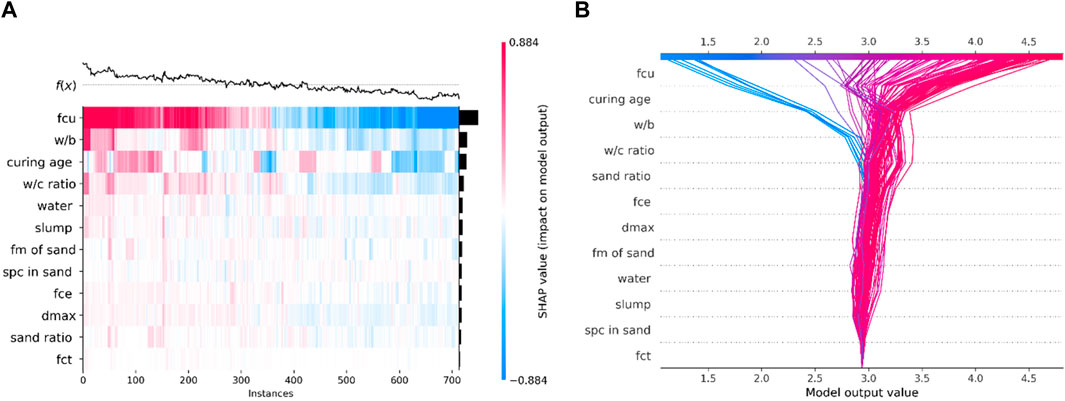
Figure 11. Global impact of features on splitting tensile strength of HPC. (A) SHAP heat map. (B) SHAP decision plot.
The w/b is another significant feature, as seen in both visualizations. In the heatmap, a lower w/b ratio results in positive SHAP values (red), suggesting that a lower ratio positively influences the splitting tensile strength. Conversely, higher w/b ratios contribute negatively to the prediction (blue). In the decision plot, this feature causes substantial shifts in model output depending on the instance. Lower w/b ratios improve the predicted tensile strength, which aligns with the understanding that less water in the mix leads to stronger and more durable concrete, thus enhancing its tensile strength. Curing age also has a notable impact on splitting tensile strength, contributing positively in most cases. The heatmap shows predominantly positive SHAP values for this feature, especially as curing age increases, indicating that longer curing periods allow the concrete to develop higher tensile strength. The decision plot confirms this, as the predictions for splitting tensile strength increase with curing age. This reflects the well-known fact that longer curing times enhance the strength properties of concrete, including its tensile strength.
Other features, such as the w/c, dmax, sand ratio, and slump, show more variability in their effects on splitting tensile strength. The heatmap illustrates a mix of red and blue SHAP values for these features, indicating that their contributions vary depending on the specific instance. For example, a lower w/c ratio generally increases tensile strength, while higher values reduce it. dmax shows both positive and negative contributions depending on the context, suggesting that the optimal aggregate size depends on other factors in the mix. The decision plot shows diverging lines for these features, further reflecting their complex and variable contributions to the model’s predictions. These features are important but interact more intricately with other variables, making their influence on splitting tensile strength less consistent compared to fcu, w/b, and curing age.
Similarly, Figure 12 highlight the interdependencies between various input features and their contributions to predicting splitting tensile strength. Key factors like fcu, curing age, and w/b ratio have strong positive impacts, with curing age and fcu significantly enhancing tensile strength, especially at lower w/b ratios. Cement’s compressive (fce) and tensile strength (fct) also contribute positively, with stronger effects at higher fcu values. In contrast, higher water content and slump levels negatively affect tensile strength, particularly when the water content exceeds optimal levels, which is exacerbated by larger aggregate sizes (dmax). Stone powder content in sand (spc) and fineness modulus (fm) have complex roles, where finer sand and higher sand ratios generally boost strength, while high sand ratios interact positively with higher compressive strength. Overall, curing age, fcu, and a balanced w/b ratio are the most crucial factors for improving splitting tensile strength, while excessive water and slump can detract from the strength predictions.
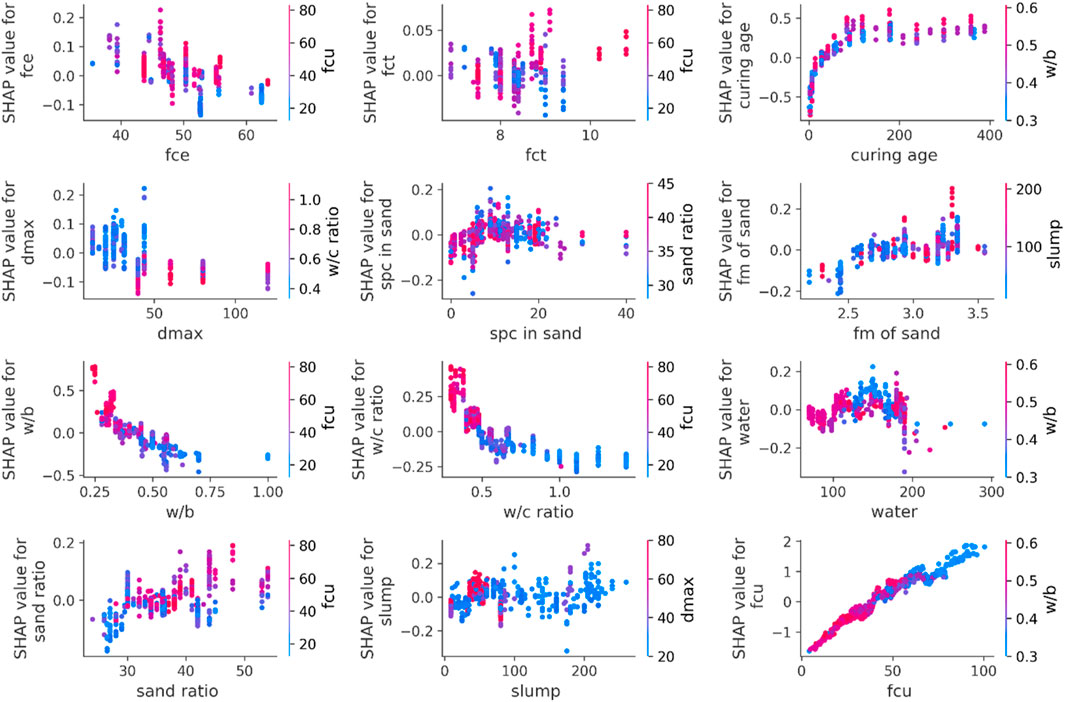
Figure 12. Feature dependency on splitting tensile strength of HPC.
6 Conclusion
This research focused on predicting essential engineering properties of high-performance concrete (HPC), specifically compressive and tensile strength, using explainable AutoML models. By integrating Optuna for hyperparameter optimization, SHapley Additive exPlanations (SHAP) for interpretability, and ensemble learning algorithms such as XGB, RF, CB, and LGB, the study successfully developed robust and interpretable models for predicting HPC properties. Among the models, O-LGB demonstrated superior performance, significantly outperforming the baseline model from the literature. For compressive strength, O-LGB reduced the Mean Absolute Error (MAE) by 87.69% and the Root Mean Squared Error (RMSE) by 71.93%, while also improving R2 by 2.68%. For tensile strength, the model achieved a 99.41% reduction in MAE and a 96.67% reduction in RMSE, with a modest R2 improvement of 2.04%. These results highlight the reliability and accuracy of O-LGB in both training and testing phases, making it a highly effective tool for predicting HPC properties. The significant reduction in prediction errors demonstrates the potential of Optuna-based AutoML models to enhance the efficiency and precision of machine learning applications in civil engineering.
The integration of SHAP analysis added a critical layer of interpretability to the models, addressing a common limitation of traditional machine learning approaches. For compressive strength, age and cement content were identified as the most critical factors, while water played a complex role, often reducing strength when present in excess. For tensile strength, the most influential factors were compressive strength (fcu), water-binder ratio (w/b), and curing age. SHAP decision plots and heatmaps revealed the interactions between these features, providing valuable insights into the relationships between concrete composition and strength properties. These findings underscore the importance of maintaining an optimal balance in HPC mix design to achieve desired strength characteristics. By combining high accuracy with interpretability, this study bridges the gap between advanced machine learning models and their practical application in civil engineering.
This study makes several important scientific contributions. It demonstrates the effectiveness of applying Optuna-based hyperparameter optimization in civil engineering, significantly enhancing model performance and reducing prediction errors. Additionally, the integration of SHAP analysis with AutoML models addresses the critical need for interpretability, providing valuable insights into the factors influencing HPC properties. The study evaluates multiple AutoML models (O-RF, O-XGB, O-CB, and O-LGB), highlighting the superior performance of O-LGB in terms of accuracy, reliability, and interpretability. The proposed framework offers a practical and efficient approach for optimizing HPC properties, enabling accurate predictions of compressive and tensile strength, improving structural design, and guiding the optimization of HPC mix designs. By reducing reliance on extensive experimental testing, this approach offers significant time and cost savings while improving risk assessment and quality control in construction projects.
Future studies should explore larger and more diverse datasets to validate the robustness of the models and ensure their generalizability to different HPC formulations and environmental conditions. Additionally, the framework could be extended to predict dynamic properties, such as durability, shrinkage, or creep, under varying environmental conditions, as well as other engineering properties of HPC, such as modulus of elasticity or thermal properties, to create a more comprehensive predictive framework. Real-time applications could also be developed by integrating the proposed models into construction workflows, enabling on-site optimization of HPC mix designs. Finally, the framework could be applied to other materials or domains, such as asphalt concrete, geopolymers, or advanced composites, to explore its broader applicability.
Data availability statement
Publicly available datasets were analyzed in this study. This data can be found here: The datasets generated and/or analyzed during the current study are available in the UCI Machine Learning Repository [https://archive.ics.uci.edu/dataset/165/concrete+compressive+strength] and data article “Dataset of tensile strength development of concrete with manufactured sand” [https://www.sciencedirect.com/science/article/pii/S2352340917300628] The data presented in this study are also available on request from the corresponding authors.
Author contributions
MSK: Conceptualization, Data curation, Formal Analysis, Investigation, Methodology, Software, Validation, Visualization, Writing–original draft. TP: Conceptualization, Methodology, Supervision, Validation, Writing–review and editing. MAK: Data curation, Formal Analysis, Investigation, Validation, Visualization, Writing–review and editing. AK: Data curation, Validation, Visualization, Writing–review and editing. MA: Data curation, Investigation, Validation, Writing–review and editing. KA: Investigation, Validation, Writing–review and editing, Data curation. MMSS: Funding acquisition, Resources, Validation, Writing–review and editing. NE-G: Funding acquisition, Resources, Validation, Writing–review and editing.
Funding
The author(s) declare that financial support was received for the research, authorship, and/or publication of this article. The current work was assisted financially to the Dean of Science and Research at King Khalid University via the Large Group Project under grant number RGP. 2/100/45. The research is partially funded by the Ministry of Science and Higher Education of the Russian Federation as part of the World-class Research Center program: Advanced Digital Technologies (contract No. 075-15-2022-311 dated 20.04.2022).
Acknowledgments
The authors extend their appreciation to the Deanship of Scientific Research at King Khalid University for funding this work through large Groups Project under grant number RGP.2/100/45.
Conflict of interest
The authors declare that the research was conducted in the absence of any commercial or financial relationships that could be construed as a potential conflict of interest.
Generative AI statement
The author(s) declare that no Generative AI was used in the creation of this manuscript.
Publisher’s note
All claims expressed in this article are solely those of the authors and do not necessarily represent those of their affiliated organizations, or those of the publisher, the editors and the reviewers. Any product that may be evaluated in this article, or claim that may be made by its manufacturer, is not guaranteed or endorsed by the publisher.
References
Abuodeh, O. R., Abdalla, J. A., and Hawileh, R. A. (2020). Assessment of compressive strength of Ultra-high Performance Concrete using deep machine learning techniques. Appl. Soft Comput. J. 95, 106552. doi:10.1016/j.asoc.2020.106552
Akiba, T., Sano, S., Yanase, T., Ohta, T., and Koyama, M. (2019). “Optuna,” in Proceedings of the 25th ACM SIGKDD International Conference on Knowledge Discovery and Data Mining, New York, NY, USA, August 4-8, 2019 (ACM), 2623–2631. doi:10.1145/3292500.3330701
Alireza, V., Pouyanfar, S., Mantawy, I. M., Mantawy, I. M., and Azizinamini, A. (2021). Machine learning and image processing approaches for estimating concrete surface roughness using basic cameras. Computer-Aided Civ. Infrastructure Eng. 36 (2), 213–226. doi:10.1111/mice.12605
Aloisio, A., Pasca, D. P., Battista, L. D., Rosso, M. M., Cucuzza, R., Marano, G. C., et al. (2022). Indirect assessment of concrete resistance from FE model updating and Young’s modulus estimation of a multi-span PSC viaduct: experimental tests and validation. Structures 37 (January), 686–697. doi:10.1016/j.istruc.2022.01.045
Ben Chaabene, W., Flah, M., and Nehdi, M. L. (2020). Machine learning prediction of mechanical properties of concrete: critical review. Constr. Build. Mater 260, 119889. doi:10.1016/j.conbuildmat.2020.119889
Bouchelil, L., Shah Bukhari, S. J., and Khanzadeh Moradllo, M. (2025). Evaluating the performance of internally cured limestone calcined clay concrete mixtures. J. Sustain Cem. Based Mater 14 (1), 198–208. doi:10.1080/21650373.2024.2432002
Brown, R. L. (1994). Efficacy of the indirect approach for estimating structural equation models with missing data: a comparison of five methods. Struct. Equ. Model. 1 (4), 287–316. doi:10.1080/10705519409539983
Chen, R.-S., Zhang, H. Y., Hao, X. K., Yu, H. X., Shi, T., Zhou, H. S., et al. (2024). Experimental study on ultimate bearing capacity of short thin-walled steel tubes reinforced with high-ductility concrete. Structures 68, 107109. doi:10.1016/j.istruc.2024.107109
Chen, T., and Guestrin, C. (2016). “XGBoost,” in Proceedings of the 22nd ACM SIGKDD International Conference on Knowledge Discovery and Data Mining, New York, NY, USA, August 13 - 17, 2016 (ACM), 785–794. doi:10.1145/2939672.2939785
Cheng, Y. I. (2008). UCI machine learning repository: concrete slump test data set. Available at: https://archive.ics.uci.edu/ml/datasets/Concrete+Slump+Test.
Cheng, Y. I. (2024). UCI machine learning repository: concrete compressive strength data set. Available at: https://archive.ics.uci.edu/ml/datasets/Concrete%0A+Compressive+Strength.
Chou, J. S., Tsai, C. F., Pham, A. D., and Lu, Y. H. (2014). Machine learning in concrete strength simulations: multi-nation data analytics. Constr. Build. Mater 73, 771–780. doi:10.1016/j.conbuildmat.2014.09.054
Contento, A., Aloisio, A., Xue, J., Quaranta, G., Briseghella, B., and Gardoni, P. (2022). Probabilistic axial capacity model for concrete-filled steel tubes accounting for load eccentricity and debonding. Eng. Struct. 268, 114730. doi:10.1016/j.engstruct.2022.114730
Dantas, A. T. A., Batista Leite, M., and De Jesus Nagahama, K. (2013). Prediction of compressive strength of concrete containing construction and demolition waste using artificial neural networks. Constr. Build. Mater 38, 717–722. doi:10.1016/j.conbuildmat.2012.09.026
Deng, F., He, Y., Zhou, S., Yu, Y., Cheng, H., and Wu, X. (2018). Compressive strength prediction of recycled concrete based on deep learning. Constr. Build. Mater 175, 562–569. doi:10.1016/j.conbuildmat.2018.04.169
Duan, Z. H., Kou, S. C., and Poon, C. S. (2013). Prediction of compressive strength of recycled aggregate concrete using artificial neural networks. Constr. Build. Mater 40, 1200–1206. doi:10.1016/j.conbuildmat.2012.04.063
Erdal, H. I. (2013). Two-level and hybrid ensembles of decision trees for high performance concrete compressive strength prediction. Eng. Appl. Artif. Intell. 26 (7), 1689–1697. doi:10.1016/j.engappai.2013.03.014
Eyo, E. U., and Abbey, S. J. (2021). Machine learning regression and classification algorithms utilised for strength prediction of OPC/by-product materials improved soils. Constr. Build. Mater 284, 122817. doi:10.1016/j.conbuildmat.2021.122817
Freund, Y., and Schapire, R. E. (1996). “Experiments with a new boosting algorithm,” in ICML’96: Proceedings of the Thirteenth International Conference on International Conference on Machine Learning, Italy, July 3-6, 1996, 148–156.
Friedman, J. H. (2001). Greedy function approximation: a gradient boosting machine. Ann. Statistics 29 (5). doi:10.1214/aos/1013203451
Gamil, Y. (2023). Machine learning in concrete technology: a review of current researches, trends, and applications. Front. Built Environ. 9 (February), 1–16. doi:10.3389/fbuil.2023.1145591
Ghasemi, M., Zhang, C., Khorshidi, H., Zhu, L., and Hsiao, P.-C. (2023). Seismic upgrading of existing RC frames with displacement-restraint cable bracing. Eng. Struct. 282, 115764. doi:10.1016/j.engstruct.2023.115764
Ghasemzadeh, F., Manafpour, A., Sajedi, S., Shekarchi, M., and Hatami, Z. (2016). Predicting long-term compressive creep of concrete using inverse analysis method. Constr. Build. Mater 124, 496–507. doi:10.1016/j.conbuildmat.2016.06.137
Ghunimat, D., Alzoubi, A. E., Alzboon, A., and Hanandeh, S. (2023). Prediction of concrete compressive strength with GGBFS and fly ash using multilayer perceptron algorithm, random forest regression and k-nearest neighbor regression. Asian J. Civ. Eng. 24 (1), 169–177. doi:10.1007/s42107-022-00495-z
Guo, M., Huang, H., Zhang, W., Xue, C., and Huang, M. (2022). Assessment of RC frame capacity subjected to a loss of corner column. J. Struct. Eng. 148 (9). doi:10.1061/(ASCE)ST.1943-541X.0003423
Hadzima-Nyarko, M., Nyarko, E. K., Lu, H., and Zhu, S. (2020). Machine learning approaches for estimation of compressive strength of concrete. Eur. Phys. J. Plus 135 (8), 682. doi:10.1140/epjp/s13360-020-00703-2
He, L., Pan, J., Hee, Y. S., Chen, H., Li, L. G., Panda, B., et al. (2024). Development of novel concave and convex trowels for higher interlayer strength of 3D printed cement paste. Case Stud. Constr. Mater. 21, e03745. doi:10.1016/j.cscm.2024.e03745
Hertel, L., Collado, J., Sadowski, P., Ott, J., and Baldi, P. (2020). Sherpa: robust hyperparameter optimization for machine learning. SoftwareX 12, 100591. doi:10.1016/j.softx.2020.100591
Huang, H., Guo, M., Zhang, W., Zeng, J., Yang, K., and Bai, H. (2021). Numerical investigation on the bearing capacity of RC columns strengthened by HPFL-BSP under combined loadings. J. Build. Eng. 39, 102266. doi:10.1016/j.jobe.2021.102266
Kang, H. (2013). The prevention and handling of the missing data. Korean J. Anesthesiol. 64 (5), 402–406. doi:10.4097/kjae.2013.64.5.402
Ke, G., Meng, Q., and Finley, T. (2017). “LightGBM: a highly efficient gradient boosting decision tree,” in Advances in neural information processing systems. The MIT Press.
Khan, M. S., Peng, T., Ali, S. M., Rehman, F. U., and Wu, Y. (2023). Cost optimization of prestressed U-shaped simply supported girder using box complex method. Sustainability 15 (14), 11457. doi:10.3390/su151411457
Khan, M. S., Peng, T., Ka, T. S., and Akhlaq, H. (2025). Enhancing seismic performance of bridges with a novel friction tension only brace (FTOB). Computational and Experimental Simulations in Engineering, 1–13. doi:10.1007/978-3-031-77489-8_1
Leung, C. K. Y. (2001). Concrete as a building material. Encycl. Mater. Sci. Technol. 2, 1471–1479. doi:10.1016/b0-08-043152-6/00267-9
Li, H., Lin, J., Lei, X., and Wei, T. (2022). Compressive strength prediction of basalt fiber reinforced concrete via random forest algorithm. Mater Today Commun. 30, 103117. doi:10.1016/j.mtcomm.2021.103117
Liu, G., and Sun, B. (2023). Concrete compressive strength prediction using an explainable boosting machine model. Case Stud. Constr. Mater. 18, e01845. doi:10.1016/j.cscm.2023.e01845
Liu, X., Liu, X., Zhang, Z., and Ai, X. (2024a). Effect of carbonation curing on the characterization and properties of steel slag-based cementitious materials. Cem. Concr. Compos 154, 105769. doi:10.1016/j.cemconcomp.2024.105769
Liu, Y., Wang, B., Fan, Y., Yu, J., Shi, T., Zhou, Y., et al. (2024b). Effects of reactive MgO on durability and microstructure of cement-based materials: considering carbonation and pH value. Constr. Build. Mater 426, 136216. doi:10.1016/j.conbuildmat.2024.136216
Long, X., Iyela, P. M., Su, Y., Atlaw, M. M., and Kang, S.-B. (2024). Numerical predictions of progressive collapse in reinforced concrete beam-column sub-assemblages: a focus on 3D multiscale modeling. Eng. Struct. 315, 118485. doi:10.1016/j.engstruct.2024.118485
Lu, D., Liang, J., Du, X., Ma, C., and Gao, Z. (2019). Fractional elastoplastic constitutive model for soils based on a novel 3D fractional plastic flow rule. Comput. Geotech. 105, 277–290. doi:10.1016/j.compgeo.2018.10.004
Lu, D., Meng, F., Zhou, X., Zhuo, Y., Gao, Z., and Du, X. (2023). A dynamic elastoplastic model of concrete based on a modeling method with environmental factors as constitutive variables. J. Eng. Mech. 149 (12). doi:10.1061/JENMDT.EMENG-7206
Lundberg, S. M., and Lee, S-I. (2017). “A unified approach to interpreting model predictions,” in Advances in neural information processing systems (Curran Associates, Inc), 4765–4774.
Lyu, F., Fan, X., Ding, F., and Chen, Z. (2021). Prediction of the axial compressive strength of circular concrete-filled steel tube columns using sine cosine algorithm-support vector regression. Compos Struct. 273, 114282. doi:10.1016/j.compstruct.2021.114282
Mintarya, L. N., Halim, J. N. M., Angie, C., Achmad, S., and Kurniawan, A. (2023). Machine learning approaches in stock market prediction: a systematic literature review. Procedia Comput. Sci. 216, 96–102. doi:10.1016/j.procs.2022.12.115
Mohamad Alipour, J. C., Harris, D. K., Ozbulut, O. E., Ozbulut, O. E., and Carroll, J. (2017). Load capacity rating of bridge populations through machine learning: application of decision trees and random forests. J. Bridge Eng. 22 (10), 04017076. doi:10.1061/(asce)be.1943-5592.0001103
Neville, A., and Aïtcin, P. C. (1998). High performance concrete - an overview. Mater. Structures/Materiaux Constr. 31 (2), 111–117. doi:10.1007/bf02486473
Nguyen, H., Vu, T., Vo, T. P., and Thai, H. T. (2021). Efficient machine learning models for prediction of concrete strengths. Constr. Build. Mater 266, 120950. doi:10.1016/j.conbuildmat.2020.120950
Niu, Y., Wang, W., Su, Y., Jia, F., and Long, X. (2024). Plastic damage prediction of concrete under compression based on deep learning. Acta Mech. 235 (1), 255–266. doi:10.1007/s00707-023-03743-8
Nunez, I., and Nehdi, M. L. (2021). Machine learning prediction of carbonation depth in recycled aggregate concrete incorporating SCMs. Constr. Build. Mater 287, 123027. doi:10.1016/j.conbuildmat.2021.123027
Ozturan, M., Kutlu, B., and Ozturan, T. (2008). Comparison of concrete strength prediction techniques with artificial neural network. Build. Res. J. 56 (1), 23–36.
Pengcheng, L., Xianguo, W., Hongyu, C., and Tiemei, Z. (2020). Prediction of compressive strength of high-performance concrete by random forest algorithm. IOP Conf. Ser. Earth Environ. Sci. 552 (1), 012020. doi:10.1088/1755-1315/552/1/012020
Prokhorenkova, L., Gusev, G., Vorobev, A., Dorogush, A. V., and Gulin, A. (2018). “CatBoost: unbiased boosting with categorical features,” in Advances in neural information processing systems, The MIT Press, 31.
Safarzadegan Gilan, S., Bahrami Jovein, H., and Ramezanianpour, A. A. (2012). Hybrid support vector regression – particle swarm optimization for prediction of compressive strength and RCPT of concretes containing metakaolin. Constr. Build. Mater 34, 321–329. doi:10.1016/j.conbuildmat.2012.02.038
Schapire, R. E. (1999). “A brief introduction to boosting,” in Proceedings of the 16th International Joint Conference on Artificial intelligence, USA, Jul. 1999, 1401–1406.
Sun, B., Cui, W., Liu, G., Zhou, B., and Zhao, W. (2023). A hybrid strategy of AutoML and SHAP for automated and explainable concrete strength prediction. Case Stud. Constr. Mater. 19, e02405. doi:10.1016/j.cscm.2023.e02405
Wang, J., Han, J., Zhu, C., Lu, W., Zhang, Y., He, X., et al. (2024a). Structural optimization and engineering application of concrete-filled steel tubular composite supports. Eng. Fail Anal. 159, 108082. doi:10.1016/j.engfailanal.2024.108082
Wang, J., Liu, X., Zhang, Z., and Liu, Y. (2024b). Synergistic utilization, critical mechanisms, and environmental suitability of bauxite residue (red mud) based multi-solid wastes cementitious materials and special concrete. J. Environ. Manage 361, 121255. doi:10.1016/j.jenvman.2024.121255
Wang, Z., Wang, K., Han, Q., Ni, J., and Wu, Z. (2025). Crack imaging of underwater concrete components using interfacial waves and transducer array. Mech. Syst. Signal Process 224, 111998. doi:10.1016/j.ymssp.2024.111998
Wojciuk, M., Swiderska-Chadaj, Z., Siwek, K., and Gertych, A. (2024). Improving classification accuracy of fine-tuned CNN models: impact of hyperparameter optimization. Heliyon 10 (5), e26586. doi:10.1016/j.heliyon.2024.e26586
Wu, Y., Fan, Y., Zhou, S., Wang, X., Chen, Q., and Li, X. (2024). Research on the cross-sectional geometric parameters and rigid skeleton length of reinforced concrete arch bridges: a case study of Yelanghu Bridge. Structures 69, 107423. doi:10.1016/j.istruc.2024.107423
Xiao, X., Zou, Y., Huang, J., Luo, X., Yang, L., Li, M., et al. (2024). An interpretable model for landslide susceptibility assessment based on Optuna hyperparameter optimization and Random Forest. Geomatics, Nat. Hazards Risk 15 (1). doi:10.1080/19475705.2024.2347421
Yang, L., Gao, Y., Chen, H., Jiao, H., Dong, M., Bier, T. A., et al. (2024). Three-dimensional concrete printing technology from a rheology perspective: a review. Adv. Cem. Res. 36 (12), 567–586. doi:10.1680/jadcr.23.00205
Yao, Y., Huang, H., Zhang, W., Ye, Y., Xin, L., and Liu, Y. (2022). Seismic performance of steel-PEC spliced frame beam. J. Constr. Steel Res. 197, 107456. doi:10.1016/j.jcsr.2022.107456
Yasniy, O., Mytnyk, M., Maruschak, P., Mykytyshyn, A., and Didych, I. (2024). Machine learning methods as applied to modelling thermal conductivity of epoxy-based composites with different fillers for aircraft. Aviation 28 (2), 64–71. doi:10.3846/aviation.2024.21472
Yeh, I.-C. (1998). Modeling of strength of high-performance concrete using artificial neural networks. Cem. Concr. Res. 28 (12), 1797–1808. doi:10.1016/s0008-8846(98)00165-3
Zhao, H., Wang, Y., Liu, X., Wang, X., Chen, Z., Lei, Z., et al. (2024). Review on solid wastes incorporated cementitious material using 3D concrete printing technology. Case Stud. Constr. Mater. 21, e03676. doi:10.1016/j.cscm.2024.e03676
Zhao, S., Hu, F., Ding, X., Zhao, M., Li, C., and Pei, S. (2017). Dataset of tensile strength development of concrete with manufactured sand. Data Brief. 11 (136), 469–472. doi:10.1016/j.dib.2017.02.043
Zhao, W., Feng, S., Liu, J., and Sun, B. (2023). An explainable intelligent algorithm for the multiple performance prediction of cement-based grouting materials. Constr. Build. Mater 366, 130146. doi:10.1016/j.conbuildmat.2022.130146
Zhou, X., Lu, D., Du, X., Wang, G., and Meng, F. (2020). A 3D non-orthogonal plastic damage model for concrete. Comput. Methods Appl. Mech. Eng. 360, 112716. doi:10.1016/j.cma.2019.112716
Keywords: high performance concrete, machine learning, ensemble learning algorithm, SHAP, Optuna, compressive strength, split tensile strength
Citation: Khan MS, Peng T, Khan MA, Khan A, Ahmad M, Aziz K, Sabri Sabri MM and Abd EL-Gawaad NS (2025) Explainable AutoML models for predicting the strength of high-performance concrete using Optuna, SHAP and ensemble learning. Front. Mater. 12:1542655. doi: 10.3389/fmats.2025.1542655
Received: 10 December 2024; Accepted: 02 January 2025;
Published: 21 January 2025.
Edited by:
Kasra Momeni, University of Alabama, United StatesReviewed by:
Pavlo Maruschak, Ternopil Ivan Pului National Technical University, UkraineYu Xia, Guangdong University of Education, China
Copyright © 2025 Khan, Peng, Khan, Khan, Ahmad, Aziz, Sabri Sabri and Abd EL-Gawaad. This is an open-access article distributed under the terms of the Creative Commons Attribution License (CC BY). The use, distribution or reproduction in other forums is permitted, provided the original author(s) and the copyright owner(s) are credited and that the original publication in this journal is cited, in accordance with accepted academic practice. No use, distribution or reproduction is permitted which does not comply with these terms.
*Correspondence: Muhammad Adeel Khan, YWRlZWxAdG9uZ2ppLmVkdS5jbg==; Mahmood Ahmad, YWhtYWRtQHVuaXRlbi5lZHUubXk=