 Rui Yu
 Wenhang Li
- School of Materials Science and Engineering, Jiangsu University of Science and Technology, Zhenjiang, China
Wire Arc Additive Manufacturing (WAAM) can flexibly produce high-performance parts that meet the requirements of deep-sea environments, but it has problems with insufficient molding accuracy and surface smoothness, which require improved precision and quality. To address these challenges, this paper establishes a WAAM experimental system based on Cold Metal Transfer (CMT) technology. First, the influence of process parameters on multi-layer single-channel forming was studied. Second, a structured light visual sensing system based on a high-speed camera was developed. Finally, a method for controlling the camera’s triggering mode at low voltage was designed, effectively eliminating arc interference. The experiment extracted and preprocessed the laser stripe ROI (Region of Interest), extracted geometric size information of the weld seam, and then performed median filtering to extract the centerline and feature points. By constructing a CMT-based WAAM monitoring system, high reliability and quality control of the manufacturing process and weld formation have been achieved.
1 Introduction
Additive manufacturing methods are closely related to the design and production of deep-sea structures (Taşdemir and Nohut, 2021). In deep-sea environments, the required structural materials must have characteristics of high pressure and corrosion resistance, and Wire Arc Additive Manufacturing (WAAM) can flexibly meet these requirements. As one of the main methods of additive manufacturing, WAAM can produce large and complex-shaped metal parts (Xia et al., 2020). Additionally, this methods is advantageous for creating complex geometries, which plays a positive role in the design and fabrication of deep-sea structures.
Compared to other methods such as laser and electron beam techniques (Ma et al., 2020), WAAM offers simpler equipment, lower costs, higher material utilization, and reduced pollution, making it highly suitable for aerospace and marine applications (Xia et al., 2020). However, despite its benefits, the widespread application of WAAM still faces challenges in reliability, automation, and quality control.
WAAM can be divided into three main types based on the heat source: Gas Metal Arc Welding (GMAW) (Wang Y. et al., 2024), Gas Tungsten Arc Welding (GTAW) (Qi et al., 2024), and Plasma Arc Welding (PAW) (Zhou et al., 2024). GMAW has a deposition rate 2 to 3 times higher than GTAW and PAW (Ding et al., 2015), but it faces stability issues. GMAW also generates significant welding fumes and spatter (Wu et al., 2018), which are particularly problematic due to droplet formation. This indicates that the choice of welding process directly affects the processing conditions and productivity of the components. To address these challenges, Cold Metal Transfer (CMT) technology reduces heat input and enables precise control over the welding process. Therefore, further research on WAAM principles using CMT is essential for precise control in additive manufacturing and improving component quality.
Current research in WAAM primarily focuses on process control (Li et al., 2019; Xiong et al., 2016), offline modeling (Xiong et al., 2014; Geng et al., 2017), and thermal accumulation control (Yi et al., 2020; Wu et al., 2019; Scotti et al., 2020) to improve formation quality. These strategies typically depend on open-loop, offline manufacturing modes without feedback, lacking real-time monitoring and adjustment capabilities (Xiong and Wen, 2023). The high heat input and large molten pool in the WAAM process complicate bead geometry control (Wang S. et al., 2024), causing dimensional errors to accumulate with increasing height, resulting in deviations from expected dimensions. In industrial manufacturing, real-time monitoring and parameter adjustment are crucial for maintaining product quality.
Developing low-cost, efficient detection methods is essential for ensuring product quality. Compared to low-energy control and numerical simulation, sensor-based control enhances precision, stability, and adaptability through real-time monitoring and dynamic adjustment of shaping parameters. Different sensing methods, including spectral sensing (Hauser et al., 2021), acoustic sensing (Chabot et al., 2021), visual sensing (Yamaguchi et al., 2022), temperature sensing (Chen et al., 2021), and electrical sensing, can monitor various target parameters of the WAAM process in real-time. These technologies enable process control and quality assurance by extracting unique signals related to different aspects of the process. Spectral sensing offers non-contact advantages for detecting WAAM defects like porosity and oxides but is limited by long scan times and poor temporal and spatial resolution. Acoustic sensing can detect internal defects in real-time but is hindered by noise interference and signal complexity, which complicating accurate correlation with WAAM parameters. Electrical sensing suffers from parameter fluctuations and interference from industrial equipment, reducing signal quality and complicating analysis. Among these methods, visual sensing stands out by providing comprehensive and intuitive information about the molten pool and the formed component’s surface. This approach is highly effective and promising for enhancing the precision and quality control of the WAAM process.
This study focuses on improving sensing and control in wire arc additive manufacturing, specifically CMT additive manufacturing (Mirabi et al., 2024). The main research areas include: Section 2: Building a CMT additive manufacturing experimental platform. Section 3: Investigating the characteristics of multi-layer single-pass WAAM processes and examining factors influencing formation morphology. Section 4: Developing an arc additive manufacturing and process sensing system, including creating effective image processing algorithms to overcome arc light interference and developing an additive control system for precise process control. The innovation of this study lies in significantly enhancing the accuracy and quality of the WAAM based on CMT process through im-proved sensing and control technologies, thereby advancing its industrial applications.
2 Experiment system implementation
Figure 1 presents the schematic diagram of the vision sensing system for WAAM based on CMT, which primarily consists of a welding system and a visual sensing detection system. A photograph of this system is shown in Figure 2. The system primarily comprises a Fronius TPS5000 welding power source, wire feeder, welding torch, and a three-axis CNC machine.
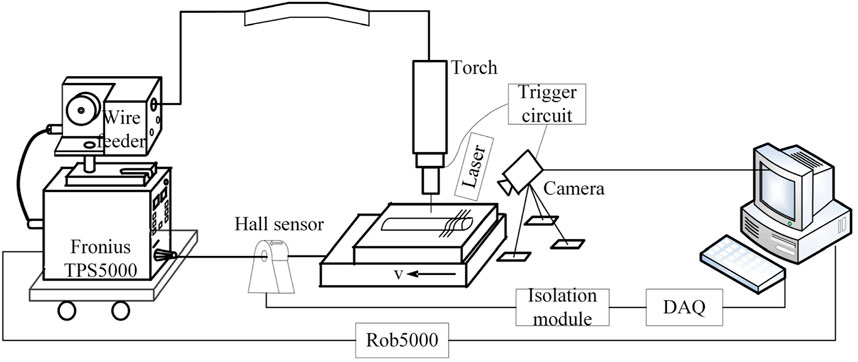
Figure 1. Schematic diagram of the vision sensing system for WAAM based on CMT.
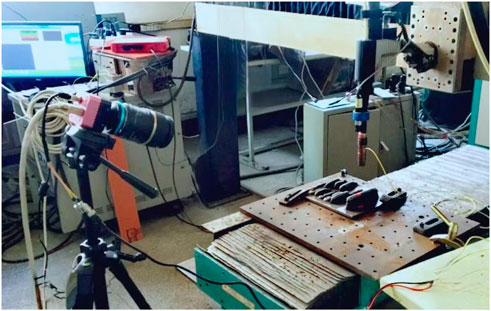
Figure 2. Photograph of the vision sensing system for WAAM based on CMT.
The visual sensing detection system mainly consists of three-line laser, high speed camera, trigger, an image acquisition card, and isolation modules. The three-line laser projects laser stripes onto the weld surface of the arc additive process, scanning the component surface. The camera captures reflected laser lines and collects size information about the molten pool from the workpiece. The image acquisition software interface handles parameter setting, data acquisition, and analysis. The system is implemented using Visual Studio and OpenCV technologies. The system performs active visual detection by scanning weld surfaces, providing detailed surface information and better meeting forming inspection requirements. The system also addresses challenges such as camera calibration, laser calibration for surface scanning, and mitigating arc light interference. A filter was applied to remove arc light interference, and the captured images were processed to extract geometric information. Calibration using a chessboard pattern was performed to enhance accuracy.
To verify the reliability of visual sensing algorithms and enhance real-time production quality in arc additive manufacturing, a CMT additive manufacturing supervisory control system was developed. The system measures current and voltage signals and outputs control signals. Multi-threaded programming was employed to effectively handle arc and vision sensing data analysis.
The welding wire used in the experiment is H08Mn2Si with a diameter of 1.2 mm, and its chemical composition is detailed in Table 1. The base metal used is Q345 steel plate with a thickness of 10 mm. The protective gas is 82% Ar+18% CO2, with a flow rate of 16 L/min.

Table 1. The component of the weld wire of H08Mn2Si(wt%).
The relevant welding parameters are listed in Table 2.
Table 2. Welding conditions.
3 Research on forming process
In multi-layer single-pass arc additive manufacturing, process parameters have a complex influence due to the overlapping and remelting of successive weld layers. This study focuses on the effects of voltage, current, deposition speed, and interlayer temperature on the formation of medium-thick-walled components in single-pass multi-layer scenarios. The melt width and bead height of each weld pass vary, resulting in an uneven surface of the wall component. To evaluate surface quality, a method for calculating surface roughness (WR) is introduced, as shown in Figure 3. The maximum wall width is denoted as W1, and the width of the processed functional section is denoted as W2. The formula for calculating WR as shown in Equation 1:
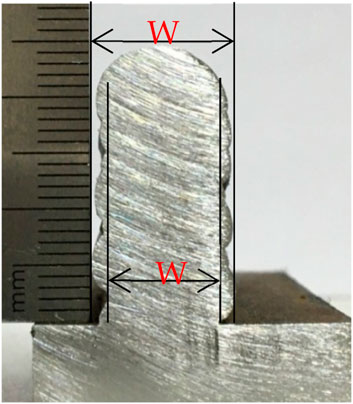
Figure 3. Schematic diagram of wall section calculation.
3.1 Effect of current
In Figure 4, multi-layer single-pass additive experiments were conducted at a deposition speed of 4 mm/s and a voltage of 17 V, using currents of 160 A, 180 A, 200 A, and 220 A, with each deposition consisting of 10 layers. The results show that the width of the wall component increases with deposition height, stabilizing after the 4th layer. This behavior can be attributed to faster heat transfer and weld pool solidification near the substrate, resulting in a smaller melt width. With an increase in the number of accumulated layers, the solidification rate of the weld pool slows down, leading to the expansion of the melt pool towards both sides and an increase in the deposition width.
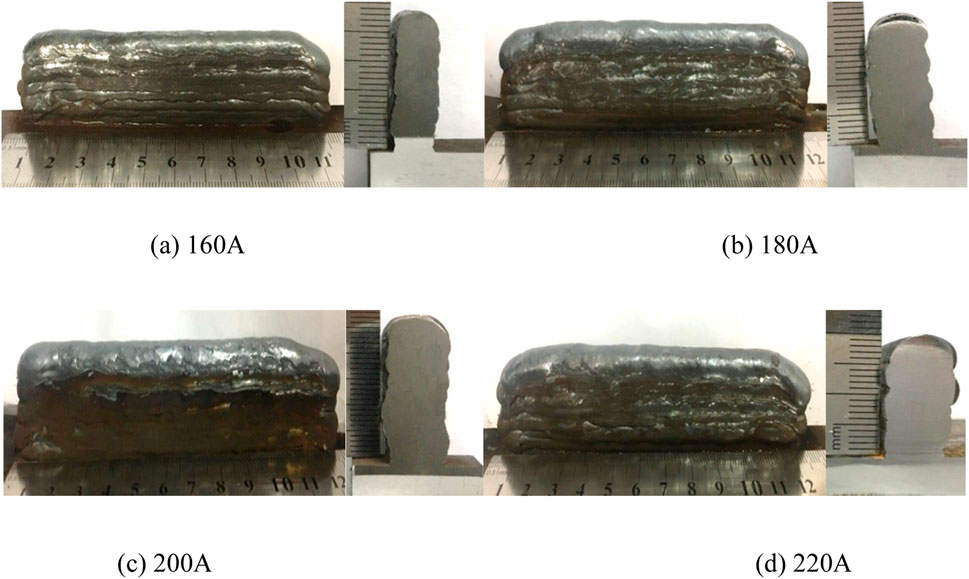
Figure 4. Weld bead macro morphology at various welding currents (Ua = 17 V, Vw = 4 mm/s). (A) 160 A (B) 180 A. (C) 200 A (D) 220 A.
The width of the wall component also increases with higher currents. At Ia = 160 A, the average width was 7.8 mm, increasing to 11.2 mm at Ia = 220 A. The reason is that the heat input becomes larger. Conversely, the height slightly decreases with higher currents. At Ia = 160 A, the height was 23.4 mm, decreasing to 20.2 mm at Ia = 220 A. There are significant differences in surface roughness of formed parts under different currents. Figure 5 shows the surface roughness was found to be the lowest at Ia = 160 A, while it was the highest at Ia = 220 A.
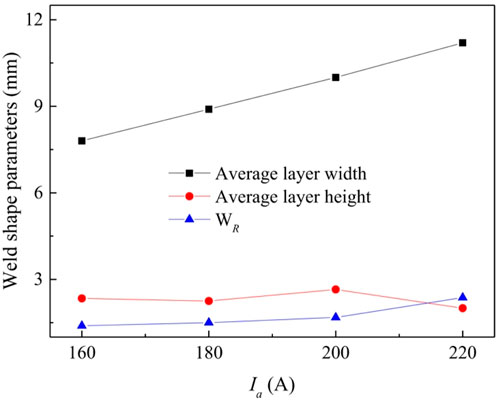
Figure 5. Effect of welding current on weld cross-section shape parameters.
3.2 Effect of voltage
Experiments were carried out in four groups under the conditions of 17 V, 18 V, 19 V, and 20 V, with a deposition rate of 4 mm/s and an additive current of 180 A. Based on the experimental results and dimensional measurements in Figures 6, 7, the overall thickness of the components increases with higher voltages. The variation in height per layer is relatively small with changes in voltage. Higher voltages increase heat input, causing the upper weld pool to flow downward and reducing forming accuracy. Therefore, it is advisable to select a reasonable range of voltages to achieve the desired melt width while avoiding excessively high voltage settings.
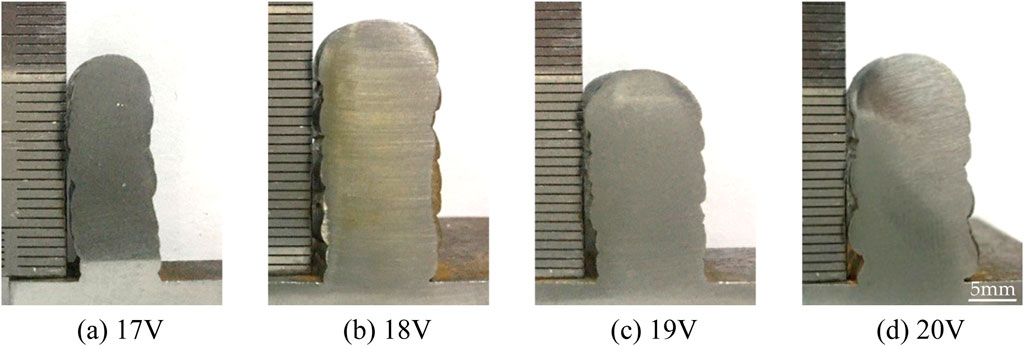
Figure 6. Cross-section formation under different welding voltages (Ia = 180 A, Vw = 4 mm/s). (A) 17 V. (B) 18 V. (C) 19 V. (D) 20 V.
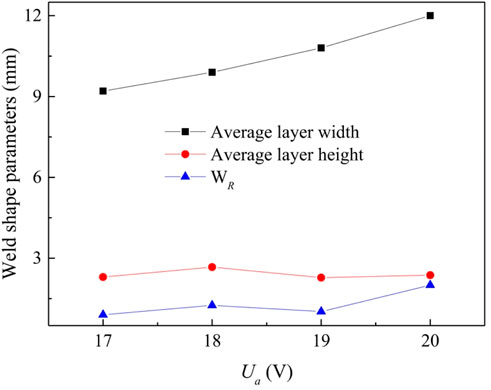
Figure 7. Effect of welding voltage on weld cross section shape parameters.
3.3 Effects of deposition speed
This section investigates the influence of deposition speed on multi-layer single-pass additive manufacturing. Experiments were conducted in four groups under a current of 160 A and a voltage of 17 V, with selected welding energies of 500 J/mm, 600 J/mm, 700 J/mm, and 800 J/mm, and the dimensions of each layer were measured after cooling. Figure 8 shows that as deposition speed decreases and welding wire energy increases, the layer width increases while the height slightly increases. This is due to higher welding heat input at lower deposition speeds, resulting in wider layers and more filling material per unit length.
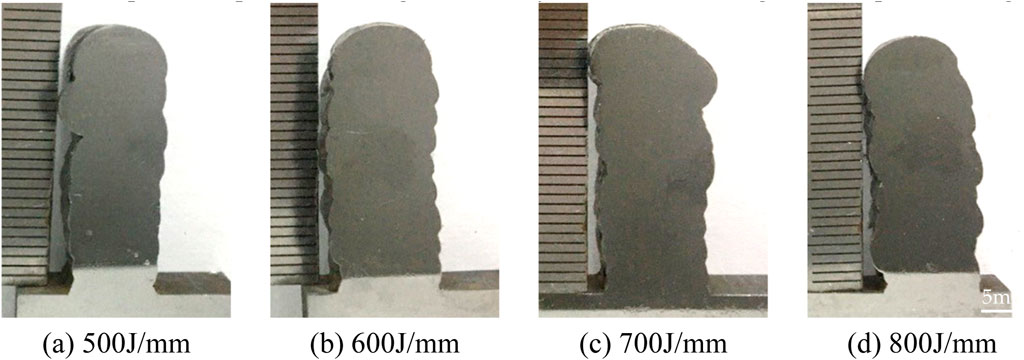
Figure 8. Cross-section formation under different heat inputs (Ua = 17 V, Ia = 160 A). (A) 500 J/mm. (B) 600 J/mm. (C) 700 J/mm. (D) 800 J/mm.
The width and height of deposited layers in multi-layer single-pass components vary, as shown in Figure 9. The second layer has a wider melt width but a significantly reduced height compared to the first layer. The first layer benefits from better cooling conditions and solidifies before the molten pool can fully spread. In contrast, when depositing the second layer, the accumulated heat from the first layer reduces the cooling rate, allowing for fuller spreading of the molten pool, resulting in increased width but decreased height. From the fourth layer onwards, although the cooling rate slows, the width and height of the molten pool tend to stabilize without further expansion.
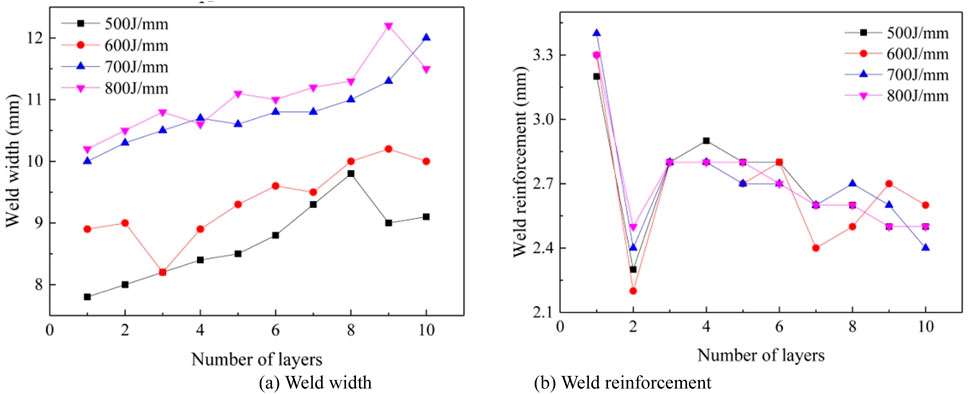
Figure 9. Influence of deposition speed on forming under different interlayer temperatures. (A) Weld width (B) Weld reinforcement.
3.4 Effect of interlayer temperature
This section investigates the impact of interlayer temperature Ta on the formation of thick-walled components in multi-layer single-pass additive manufacturing. To prevent excessive heat input and metal overflow, an appropriate cooling interval between layers is necessary. Surface temperature measurements were taken using an infrared thermometer to observe formation under different temperatures, as shown in Figure 10.
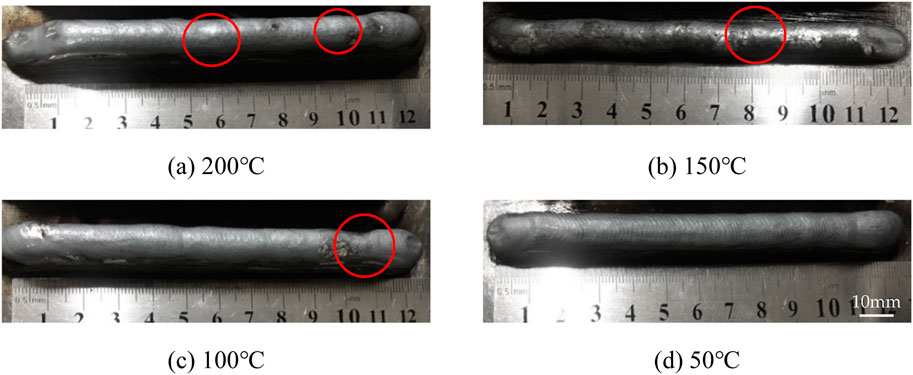
Figure 10. Weld bead macro morphology at different interlayer temperatures. (A) 200°C. (B) 150°C. (C) 100°C. (D) 50°C.
At Ta = 200°C, the higher temperature leads to better flowability of the liquid metal, resulting in an uneven surface with protrusions and depressions after solidification. Moreover, as the number of layers increases, occurs significant flow at the end of the melt pool, which severely affects the formation outcome. At Ta = 150°C, the melt pool surface remains uneven and exhibits bending. However, when the temperature is reduced to 100°C, there is an improvement in the melt pool formation. By setting an appropriate interlayer temperature, heat dissipation of the formed component can be increased, reducing heat accumulation during the additive process. At Ta = 50°C, the surface exhibits a scale-like pattern, indicating high flatness and good formation.
3.5 Effect of deposition trajectory
The study investigates how the deposition trajectory impacts the quality of multi-layer single-pass formation in arc additive manufacturing. Experiments in multi-layer single-pass arc additive manufacturing were performed using two different trajectories: same-side arc start and opposite-side arc start. The experimental results are shown in Figure 11.
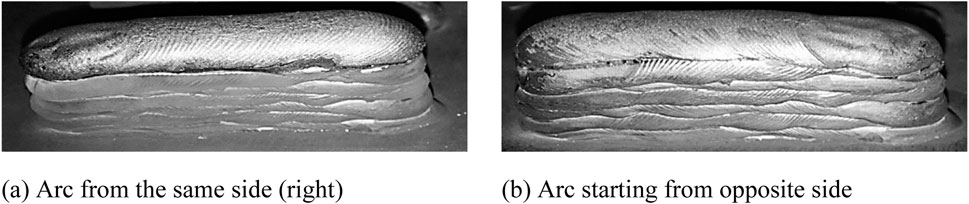
Figure 11. Influence of deposition trajectories on weld bead macro morphology (Ua = 17 V, Ia = 180 A, Vw = 4 mm/s, Ta = 50°C). (A) Arc from the same side (right). (B) Arc starting from opposite side.
The results indicate a height difference between the arc start and stop points of each weld layer, which increases with the number of overlaid weld layers. This height difference lead to tilting in multi-layer structures. However, using the opposite-side arc start trajectory compensates for the height difference, resulting in a more consistent height on both sides and an improved formation outcome. The experiments also revealed a height difference between the arc start and stop points of the weld bead, caused by varying metal filling. To solve this problem, experiments were conducted by manipulating the pre-welding dwell time and arc stop time. Reducing the pre-weld dwell time and increasing the arc stop time ensured better height consistency of the weld bead.
4 Visual sensing and image acquisition
To achieve high surface quality in WAAM, a visual sensing system was developed for image acquisition and analysis during the arc additive process.
4.1 Image acquisition
This system incorporates the design of image acquisition software and the implementation of image processing algorithms. Visual sensors accurately capture weld bead dimensions and surface features. Relying solely on the arc light emitted by the molten pool is insufficient for comprehensive analysis. Therefore, a fringe laser tracker was added, as shown in Figure 12.
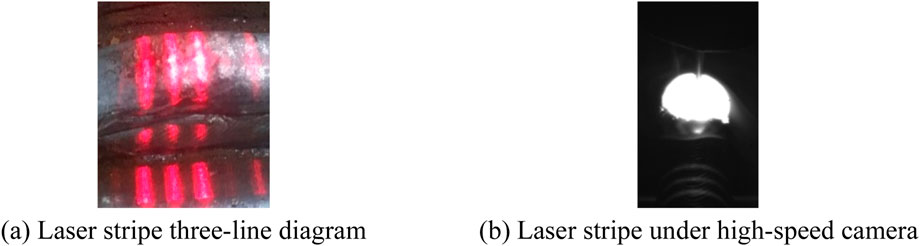
Figure 12. Laser scanning process. (A) Laser stripe three-line diagram. (B) Laser stripe under high-speed camera.
An optimized image acquisition method was proposed to mitigate the interference caused by arc light. This method includes designing the circuit board, adjusting camera modes, setting appropriate exposure time parameters, and employing light reduction and filtering techniques. These measures enable the camera to simultaneously capture light from the molten pool and the laser signal, effectively avoiding arc light interference. Threshold segmentation is used to process the image, eliminating the influence of reflected light from the previous weld bead. Experimental tests were conducted with a wire feed speed of 6.9 m/min and a voltage of 18 V. Comparing images captured under different conditions validated the effectiveness of the camera trigger circuit.
Figure 13A shows the image captured using the traditional method, where the molten pool is obscured by a large welding arc, making it difficult to obtain edge information. The structured light sensor cannot recognize the high-temperature region of the molten pool in arc additive manufacturing; it can only measure the solidified metal behind the molten pool. Figure 13B shows that the proposed method improves image clarity and stability, eliminating arc interference.
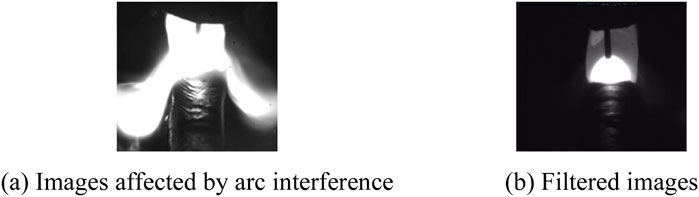
Figure 13. The molten pool image collected by the trigger control board. (A) Images affected by arc interference. (B) Filtered images.
4.2 Arc additive image processing algorithm
4.2.1 Image ROI and preprocessing
Figure 14 presents the image processing workflow for the acquired images in the visual sensing system. The process begins with extracting the Region of Interest (ROI) to eliminate unnecessary information.
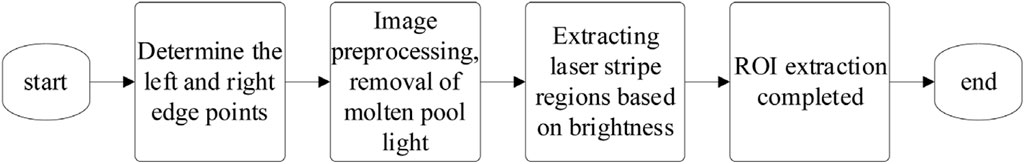
Figure 14. The flowchart of ROI extraction.
The image contains two primary regions of interest: the molten pool area and the laser stripe area. A method using the grayscale distribution histogram was developed to divide the image into two parts for ROI extraction, as shown in Figure 15. Grayscale values below 100 primarily represent the background and laser stripes, while values above 200 correspond to the brighter molten pool area.
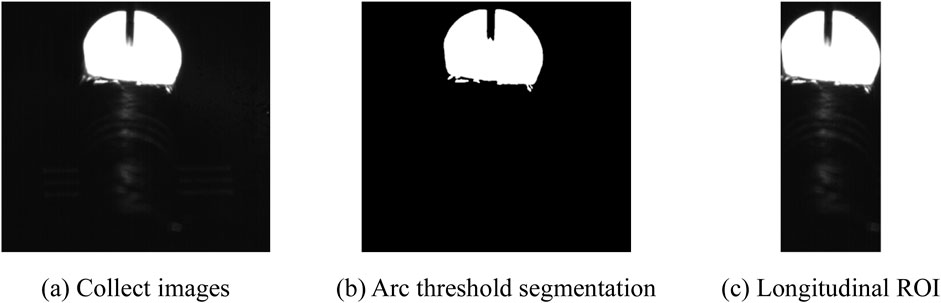
Figure 15. Location map of molten pool. (A) Collect images. (B) Arc threshold segmentation. (C) Longitudinal ROI.
After determining the molten pool position, preprocessing is conducted on the longitudinal ROI image to extract the edges of the molten pool. This process includes threshold segmentation to convert the image into binary form. The image is scanned column by column to extract the molten pool and the welding wire. By comparing the pixel coordinates, the width of the molten pool and welding wire can be determined. Additionally, comparing pixel coordinates allows the determination of whether the weld path is inclined.
To obtain the laser ROI, interference from the molten pool light must be removed. The image needs to be cropped and displayed within a specific region of the image window. After binarizing the image using the aforementioned method, the rows with the maximum and minimum vertical coordinates of pixels with a grayscale value of 0 are selected as the upper and lower boundaries, respectively, to segment the laser region.
To further separate the laser stripes, the image needs to be binarized again. However, in this experiment, the brightness of the laser stripes closely matches the background, making them difficult to distinguish. Additionally, the grayscale value ranges of both are unknown, making it impossible to determine the threshold value required for segmentation. To address this issue, the Otsu algorithm was utilized, which can adaptively determine the most suitable threshold. The resulting binarized image obtained using the Otsu algorithm is shown in Figure 16. After obtaining the binarized image, the regions of interest need to be separated to reduce computational complexity. The image is scanned row by row from top to bottom. The first pixel with a grayscale value of 255 indicates the upper boundary of the laser region, while the last pixel with a value of 255 marks the lower boundary. The region of interest between these boundaries represents the laser stripe area. Post-extraction, only the laser stripes remain, successfully isolating the ROIs of the molten pool area and the laser stripe area, thereby completing the image preprocessing. The original image contained 115,776 pixels, while the processed image was reduced to 40,224 pixels. This effectively decreases the workload associated with handling invalid areas and facilitates subsequent image processing steps, ultimately shortening the algorithm’s response time.
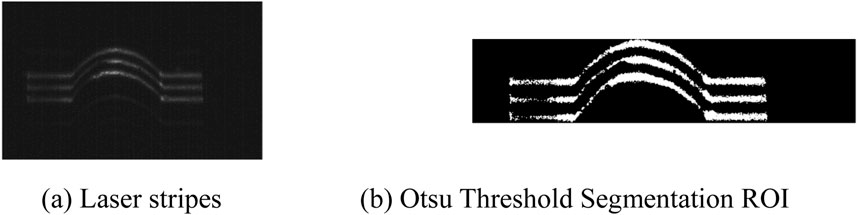
Figure 16. ROI of Otsu Threshold Segmentation Method. (A) Laser stripes. (B) Otsu Threshold Segmentation ROI.
4.2.2 Morphological operations
Due to the deformation and unevenness of the weld surface in arc additive manufacturing, the reflection of laser stripes in the image varies, resulting in different levels of thickness and brightness of the structured light. Even with the optimal threshold found by the Otsu algorithm, some weak light points can be mistakenly classified as the background, leading to inconsistent and uneven thickness in the processed stripe image. To address this issue, mathematical morphology operations can be employed. Dilation can be applied to increase the area of the bright regions, resulting in a complete and continuous laser stripe image, enabling further operations. However, the edges of the laser stripes contain numerous artifacts, necessitating image smoothing filters.
In order to choose the appropriate filtering method, a comparative study was conducted on three techniques: Gaussian filter, smoothing filter, and median filter, as shown in Figure 17. It can be observed that, compared to the Gaussian and smoothing filters, the median filter significantly improves edge quality, making it smoother. Therefore, the median filter is employed for denoising the image to achieve good edge quality.
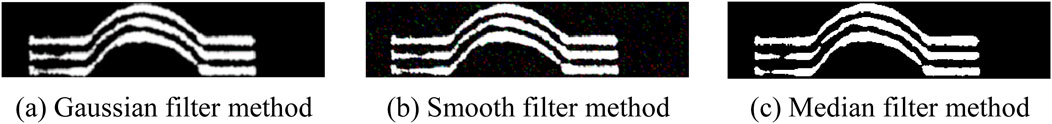
Figure 17. Filtering effect diagram. (A) Gaussian filter method. (B) Smooth filter method. (C) Median filter method.
4.2.3 Centerline and feature point extraction
After the aforementioned processing, the laser stripes become smooth and continuous; however, they still deform due to the complex surface morphology of the weld. Further processing is required to accurately capture the bending of the laser stripes.
Since the centroid method is only suitable for grayscale images following a Gaussian distribution, which does not align with the conditions of this experiment, a thinning method based on binary images was chosen. To simplify calculations, a parallel thinning algorithm was employed to process the laser stripes.
The thinning process is as follows: First, each pixel in the binary image is scanned, and its position as a boundary point is determined based on the eight surrounding points,. If the pixel lies on the boundary, additional checks are conducted to ascertain if it satisfies the 8-simple rule. If this condition is met, the pixel is then examined to identify whether it is an endpoint or an isolated point. If the criteria are not met, the pixel is removed. T this process is repeated for each subsequent point. Figure 18 illustrates the algorithm flow.
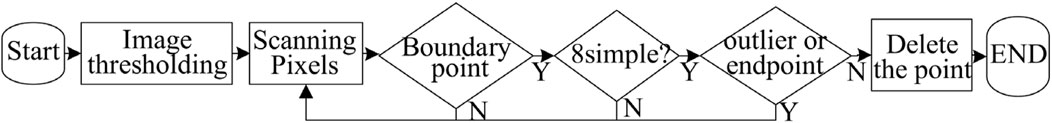
Figure 18. Flowchart of the centerline extraction algorithm.
After completing one iteration of the algorithm, the process repeats until no more points can be deleted. Then, the iteration terminates, completing the centerline extraction. The original wide laser stripes transform into single-pixel laser stripes while preserving the captured morphology, as shown in Figure 19.
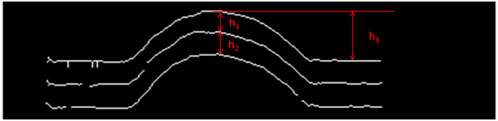
Figure 19. Center line extraction.
4.2.4 Surface defect image processing
During the arc additive process, protrusions or indentations on the weld surface deform the three laser stripes, as shown in Figure 20. When the laser illuminates a flat surface, the arcs of the three laser stripes remain parallel. Therefore, for each column of feature points, the vertical coordinate difference between adjacent laser stripes should remain constant, i.e., the spacings h1 and h2 should remain constant. The distance between the first and third laser stripes is approximately 8 mm, exceeding the defect size. Therefore, changes in the second laser stripe are analyzed. When scanning encounters a raised area on the surface, the slope of the feature points increases, decreasing h1 and increasing h2. When scanning reaches a depressed area on the surface, the slope of the feature points changes sign, leading to an increase in h1 and a decrease in h2. Based on these changes, the weld surface condition can be determined, providing a basis for subsequent parameter adjustments.

Figure 20. Schematic Diagram of Laser stripe Distance. (A) Surface Bulge. (B) Surface Depression.
4.2.5 Experimental results and verification
After a series of image processing steps, the algorithm calculates the width and height of the molten pool and extract feature points from the solidified weld. Based on the coordinates of the feature points, the pixel value of the vertex is calculated, and the information about the solidified weld surface is determined. By converting pixel differences in the width and height of the molten pool into actual measurements using the previously proposed algorithm, the reliability and interference resistance of the algorithm can be verified. Figure 21 shows the image processing algorithm flow.
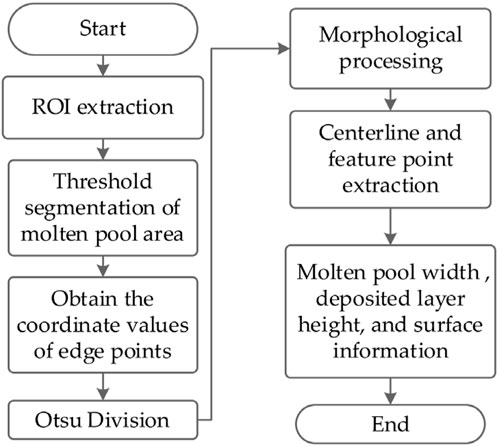
Figure 21. Flow chart of image processing algorithm.
To validate the algorithm’s reliability and resistance to interference, this experiment applied it to extract and calculate data from 10 welds. Figures 22A, B display the error distribution between the image processing results for the molten pool width and bead height and the actual measurements. The actual measurements were obtained by averaging three points on each layer. The figures show that the width error between the extracted feature points and the actual values is within 0.5 mm, while the bead height error is within 0.04 mm. These errors are all below 5%, which meets the experimental requirements. This indicates that the visual sensing system and image processing algorithm effectively capture the molten pool’s dimensions during the arc additive process.
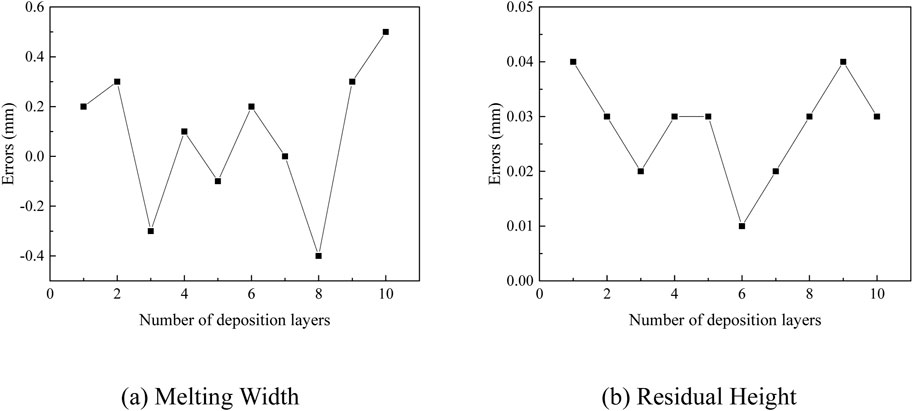
Figure 22. Error diagram of molten pool width and height. (A) Melting width. (B) Residual height.
4.3 Forming control validation experiment
The CMT additive manufacturing supervisory control system was applied in arc additive manufacturing experiments using the previously described process parameters and methods. The initial parameters were set as Ia = 180A, Ua = 17V, and Vw = 4.5 mm/s. During the experiments, images captured by the vision sensing system were transmitted to the industrial computer for processing through the designed algorithm. The system outputted morphology and dimensional information, which served as input for the signal generation software. The Rob5000 module adjusted the welding machine’s current and voltage output accordingly, resulting in the formation of a multi-layer single-pass component as shown in Figure 23.

Figure 23. Side view of the 40 mm part.
The component consisted 16 layers and had a height of 40 mm. Examining its cross-section revealed that the control group, compared to the group with fixed process parameters, exhibited improved surface quality, uniform melt width in each deposition layer, and reduced dimensional variations. The surface roughness was measured to be less than 1 mm. Even after exceeding 10 layers, the component maintained stable dimensions, greatly enhancing production quality.
The effects on the macrostructure and microstructure of the additive manufacturing parts were investigated using various techniques, to evaluate the grain microstructure. A comparative analysis of the microstructure of parts formed by different methods at the same height was conducted, as shown in Figure 24. It was found that the adjusted heat input was more suitable for the forming requirements, reducing the impact of heat accumulation on the microstructure. This led to a significant refinement of the grains in the control group, thereby improving performance.
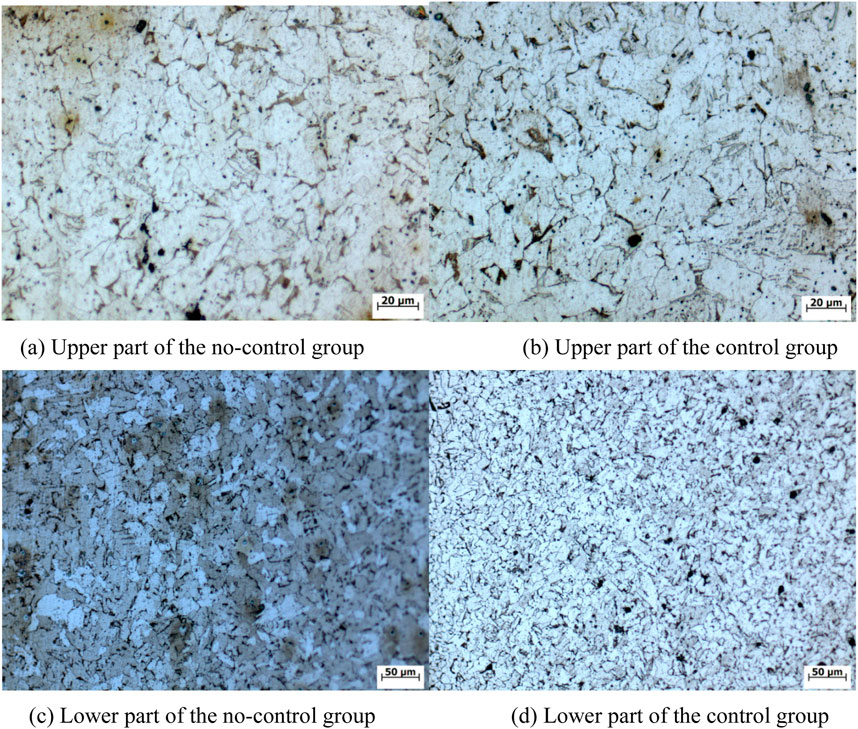
Figure 24. Comparison of microstructures. (A) Upper part of the no-control group. (B) Upper part of the control group. (C) Lower part of the no-control group (D) Lower part of the control group.
5 Conclusion
1) Stable dimensions in multi-layer, single-pass forming were observed beginning from the fourth layer when a current range of 160–180 A was applied. Higher currents led to increased surface irregularities and potential structural collapse. Deposition voltages ranging from 500 J/mm to 700 J/mm, combined with optimized deposition rates, were found to be beneficial for multi-layer, single-pass forming.
2) An alternating start-arc path was used to eliminate height discrepancies at the weld bead ends. Regression equations were established to quantify the relationship between process parameters and bead width and height.
3) A laser-based active vision sensing system was developed for real-time monitoring of bead dimensions during the CMT process. This system captures images exclusively during the CMT short-circuit transition to enhance stability. Segmentation, edge detection, and morphological processing techniques were employed to extract bead width and height from the captured images.
4) A monitoring system was developed to integrate sensing data, allowing for adaptive adjustments of CMT parameters to enhance part quality. Trials successfully produced 40 mm-tall, 16-layer components with consistent geometry.
Data availability statement
The original contributions presented in the study are included in the article/supplementary material, further inquiries can be directed to the corresponding author.
Author contributions
RY: Conceptualization, Data curation, Methodology, Writing–original draft, Writing–review and editing, Formal Analysis, Investigation, Software. WL: Conceptualization, Data curation, Methodology, Writing–original draft, Writing–review and editing. MW: Methodology, Writing–review and editing. JnW: Writing–review and editing. QH: Writing–review and editing. JyW: Writing–review and editing. SB: Writing–original draft.
Funding
The author(s) declare that financial support was received for the research, authorship, and/or publication of this article. The authors would like to thank the financial support from National Natural Science Foundation of China (No. 51775255 and No. 52375339).
Conflict of interest
The authors declare that the research was conducted in the absence of any commercial or financial relationships that could be construed as a potential conflict of interest.
Publisher’s note
All claims expressed in this article are solely those of the authors and do not necessarily represent those of their affiliated organizations, or those of the publisher, the editors and the reviewers. Any product that may be evaluated in this article, or claim that may be made by its manufacturer, is not guaranteed or endorsed by the publisher.
References
Chabot, A., Rauch, M., and Hascoët, J. Y. (2021). Novel control model of contact-tip-to-work distance (ctwd) for sound monitoring of arc-based ded processes based on spectral analysis. Int. J. Adv. Manuf. Technol. 116 (11–12), 3463–3472. doi:10.1007/s00170-021-07621-2
Chen, W., Xu, L. Y., Han, Y. D., Zhao, L., and Jing, H. (2021). Control of residual stress in metal additive manufacturing by low-temperature solid-state phase transformation: an experimental and numerical study. Addit. Manuf. 42, 102016. doi:10.1016/j.addma.2021.102016
Ding, D., Pan, Z., Cuiuri, D., and Li, H. (2015). A multi-bead overlapping model for robotic wire and arc additive manufacturing (waam). Robotics Computer-Integrated Manuf. 31, 101–110. doi:10.1016/j.rcim.2014.08.008
Geng, H. B., Xiong, J. T., Huang, D., Lin, X., and Li, J. (2017). A prediction model of layer geometrical size in wire and arc additive manufacture using response surface methodology. Int. J. Adv. Manuf. Technol. 93 (1–4), 175–186. doi:10.1007/s00170-015-8147-2
Hauser, T., Reisch, R. T., Breese, P. P., Nalam, Y., Joshi, K. S., Bela, K., et al. (2021). Oxidation in wire arc additive manufacturing of aluminium alloys. Addit. Manuf. 41, 101958. doi:10.1016/j.addma.2021.101958
Li, Y. J., Xiong, J., and Yin, Z. Q. (2019). Molten pool stability of thin-wall parts in robotic gma-based additive manufacturing with various position depositions. Robotics Computer-Integrated Manuf. 56, 1–11. doi:10.1016/j.rcim.2018.08.002
Ma, Y. Y., Hu, Z. L., Tang, Y., Ma, S., Chu, Y., Li, X., et al. (2020). Laser opto-ultrasonic dual detection for simultaneous compositional, structural, and stress analyses for wire + arc additive manufacturing. Addit. Manuf. 31, 100956. doi:10.1016/j.addma.2019.100956
Mirabi, H., Mirakhorli, F., Béland, J.-F., Nadeau, F., Demers, V., and Bocher, P. (2024). On selecting proper process parameters for cold metal transfer (CMT)–based wire arc additive manufacturing (WAAM) process. Int. J. Adv. Manuf. Technol. 133 (11-12), 6083–6093. doi:10.1007/s00170-024-14110-9
Qi, S., Liu, Y., Ren, H., Liu, C., Zhang, Q., Tang, X., et al. (2024). An innovative methodology in narrow gap gtaw for alternating magnetic field with synchronous swing of filler wire and arc. Int. J. Adv. Manuf. Technol. 133 (7-8), 3913–3925. doi:10.1007/s00170-024-13968-z
Scotti, F. M., Teixeira, F. R., Da Silva, L. J., de Araújo, D. B., Reis, R. P., and Scotti, A. (2020). Thermal management in waam through the cmt advanced process and an active cooling technique. J. Manuf. Process. 57, 23–35. doi:10.1016/j.jmapro.2020.06.007
Taşdemir, A., and Nohut, S. (2021). An overview of wire arc additive manufacturing (waam) in shipbuilding industry. Ships Offshore Struct. 16 (7), 797–814. doi:10.1080/17445302.2020.1786232
Wang, S., Liu, H. C. H., and Xiong, J. (2024b). Drop and hump behaviors in robotic arc-directed energy deposition with vertical position. Addit. Manuf. 82, 104049. doi:10.1016/j.addma.2024.104049
Wang, Y., Wen, L., Li, W., Su, X., Zhao, W., Xu, G., et al. (2024a). Effects of he-ar shielding gas compositions on arc plasma physical properties in rotating laser+gmaw hybrid fillet welding: numerical simulation. Opt. Laser Technol. 178, 111231. doi:10.1016/j.optlastec.2024.111231
Wu, B., Pan, Z., Ding, D., Cuiuri, D., Li, H., Xu, J., et al. (2018). A review of the wire arc additive manufacturing of metals: properties, defects and quality improvement. J. Manuf. Process. 35, 127–139. doi:10.1016/j.jmapro.2018.08.001
Wu, B. T., Pan, Z. X., Chen, G. Y., Ding, D., Yuan, L., Cuiuri, D., et al. (2019). Mitigation of thermal distortion in wire arc additively manufactured ti6al4v part using active interpass cooling. Sci. Technol. Weld. Join. 24, 484–494. doi:10.1080/13621718.2019.1580439
Xia, C. Y., Pan, Z. X., Polden, J., Li, H., Xu, Y., Chen, S., et al. (2020). A review on wire arc additive manufacturing: monitoring, control and a framework of automated system. J. Manuf. Syst. 57, 31–45. doi:10.1016/j.jmsy.2020.08.008
Xiong, J., and Wen, C. (2023). Arc plasma, droplet, and forming behaviors in bypass wire arc-directed energy deposition. Addit. Manuf. 70, 103558. doi:10.1016/j.addma.2023.103558
Xiong, J., Yin, Z. Q., and Zhang, W. H. (2016). Forming appearance control of arc striking and extinguishing area in multi-layer single-pass gmaw-based additive manufacturing. Int. J. Adv. Manuf. Technol. 87 (1–4), 579–586. doi:10.1007/s00170-016-8543-2
Xiong, J., Zhang, G. J., Hu, J. W., and Wu, L. (2014). Bead geometry prediction for robotic gmaw-based rapid manufacturing through a neural network and a second-order regression analysis. J. Intelligent Manuf. 25 (1), 157–163. doi:10.1007/s10845-012-0682-1
Yamaguchi, M., Komata, R., Furumoto, T., Abe, S., and Hosokawa, A. (2022). Influence of metal transfer behavior under ar and co2 shielding gases on geometry and surface roughness of single and multilayer structures in gmaw-based wire arc additive manufacturing of mild steel. Int. J. Adv. Manuf. Technol. 119 (1–2), 911–926. doi:10.1007/s00170-021-08231-8
Yi, H. J., Kim, J. W., Kim, Y. L., and Shin, S. (2020). Effects of cooling rate on the microstructure and tensile properties of wire-arc additive manufactured ti–6al–4v alloy. Metals Mater. Int. 26 (8), 1235–1246. doi:10.1007/s12540-019-00563-1
Keywords: WAAM, CMT, visual sensing, quality control, image processing
Citation: Yu R, Li W, Wu M, Wang J, Han Q, Wang J and Bing S (2025) Advanced visual sensing and control in CMT-based WAAM processes. Front. Mater. 12:1499635. doi: 10.3389/fmats.2025.1499635
Received: 21 September 2024; Accepted: 09 January 2025;
Published: 29 January 2025.
Edited by:
Xu Liang, Zhejiang University, ChinaReviewed by:
Xiaoyan Gu, Hubei University of Automotive Technology, ChinaHuabin Chen, Shanghai Jiao Tong University, China
Ziqiang Yin, University of Jinan, China
Copyright © 2025 Yu, Li, Wu, Wang, Han, Wang and Bing. This is an open-access article distributed under the terms of the Creative Commons Attribution License (CC BY). The use, distribution or reproduction in other forums is permitted, provided the original author(s) and the copyright owner(s) are credited and that the original publication in this journal is cited, in accordance with accepted academic practice. No use, distribution or reproduction is permitted which does not comply with these terms.
*Correspondence: Wenhang Li, bHdoX2FiY0BxcS5jb20=