- 1Centre for Rapid and Sustainable Product Development, Polytechnic of Leiria, Leiria, Portugal
- 2NCD-SWEET Beamline, ALBA Synchrotron Light Source, Barcelona, Spain
- 3Institute of Polymers and Composites, University of Minho, Guimarães, Portugal
- 4Visionary Equation Unip lda, Leiria, Portugal
Injection moulding is a very popular technology for shaping plastics. Its history stretches back to the nineteenth century, and, as a consequence, it has developed outside the framework of digitisation. In order to fully implement the concepts of Industry 4.0, we need to update these legacy technologies so that they can fully benefit from the developments inherent in the “Internet of Things” and allow the process of injection moulding to take full advantage of digital optimisation so that it can fit effectively in the digital factory. In this work, we explore the quantitative use of X-ray scattering as a technology that can provide dynamic and multiscale feedback during the injection moulding cycle to be able to exploit digital twin technology as a means to optimise the operational parameters involved in injection moulding and to enable digital design of moulds in the fullest sense. This manuscript provides a way to mark future work and draw these possibilities to a wider audience.
1 Introduction
Injection moulding (Párizs et al., 2022) is the most common technology for shaping thermoplastics, but it is yet to be fully incorporated into the concepts of Industry 4.0 (Lemstra and de Mesquita, 2023) and, thus, many of the advantages of digitalisation have yet to be realised. A few articles address the application of digital twin technology to injection moulding, but, in general, these are focused on the supply chain logistics (Supply chains Guo and Mantravadi, 2024; Abouzid and Saidi, 2023) rather than on optimising the process. This is not to say that digital technology does not play a major part in the development of injection moulding technology. Practically all moulds produced today are designed using CAD technology (Cao and Si, 2022), and the designs are evaluated using injection moulding simulations (Schröder, 2024) long before the mould itself is fabricated using digital manufacturing tools. However, it is fair to say that the design process depends heavily on the expertise and experience of the designer. We attribute much of this to the limited dynamic feedback systems in an injection moulding system. A typical system has a pressure sensor and a temperature sensor coupled with visual inspection (Zhang et al., 2022). One emerging approach to overcome this lack of information is to use a digital twin driven by data from simulation (He and Bai, 2021). Several studies and industrial applications have developed intelligent software to use temperature and pressure sensors in a quality control system to highlight injection moulding cycles that are different from the norm (Zhao et al., 2020), possibly due to variations in the feedstock properties, a critical problem in the use of recycled materials. This work is part of a larger programme at CDRSP on exploiting operando X-ray scattering measurements during polymer processing technologies (Arioli et al., 2023) through the use of quantitative multiscale dynamic feedback to optimise the processing conditions and parameters to yield specific properties and products. We expect that the ultimate role of this dynamic data will be to drive a digital twin system rather than relying on a model data-driven system with all the attendant validation problems.
2 Feedback methods during the injection moulding cycle
Fully understanding and optimising any manufacturing process requires feedback mechanisms; otherwise, the only feedback on the process arises from observation of the final part. Recent developments in imaging and image analysis mean that visual inspection can be performed automatically after moulding, for example, Yang et al. (2024). However, we should not let the simplicity and ease of visual inspection lead us to the conclusion that such a methodology is comprehensive. To take a specific example, weld lines are a relatively common problem in injection moulding (Li et al., 2024). These are formed when the flow front in a mould cavity meets an obstruction; for example, the flow of fluid polymer splits into two around an insert and rejoins on the far side of the obstruction and continues as a single flow front. In some cases, the material cools too much before the fronts meet, and there is poor mixing and adhesion. Weld lines arising in this manner may be visible on the external surface but may be difficult to spot. In the absence of a surface effect, a weld line will remain undetected; unless the product is optically clear, it is not possible to observe the interior of the part. It could be that the impingement of the flow fronts leads to structural defects in the interior of the product. Detection of such defects requires a probe that is able to penetrate the interior. We note here that, looking forward, we have already identified the value of employing the operando approach in a modified mould to explore and develop an understanding of weld lines at the nanoscale.
Providing quantitative feedback during the injection moulding cycle is a challenging task exacerbated by the fact that, in general, the mould cavity is fabricated from metal and that solidification first takes place at the mould surface, thereby shielding the interior from subsequent measurement using surface-mounted probes. Traditionally, moulds are fitted with simple single-channel sensors such as thermocouples and pressure devices. Infrared cameras provide a quantitative and spatially resolved measurement of the surface temperature of the product. The work by Bula et al. (2016) provides a good example of how infrared technology can be harnessed in this way. They used an infrared camera to measure the surface temperature of the part and the surface temperature of the mould cavity at the point at which the mould opens in the cycle and before the part is ejected. This is a very interesting and effective post-processing inspection procedure. Another emerging technology is ultrasonic technology. This area has been recently reviewed by Kariminejad et al. (2021), who emphasise the noninvasive nature of the probe and that conventional ultrasonic transducers are not suited to high temperatures, but new devices are emerging. The review highlights the high diversity of the measurements that can be addressed, including the assessment of preferred molecular orientation. Su et al. (2022) described a method to optimise the operational parameters in an injection mould cycle using the part weight as the measure of quality control. This is an interesting study, but it utilised extensive post-moulding evaluations. The work of Araújo et al. (2023) highlights the use of in-cavity pressure sensing as a method to identify failure during mould filling. The work of Chen et al. (2019) explores the use of a tie-bar profile sensor to optimise the changeover from mould filling to packing, which has been shown to have a strong influence on the quality of the part. This short overview of feedback methods used during injection moulding is only a small selection of the many articles addressing the matter. Some methodologies are suited to identifying problems during injection moulding, whereas others allow the optimisation of the process parameters to meet specific target part properties. In the remainder of this manuscript, we explore the possibility of using X-ray scattering measurements to achieve this.
3 Feedback strategy in this work
As the preceding section highlights, evaluating the processes involved in injection moulding during a moulding cycle is a particularly challenging task. In part, this arises from the short cycle time, but the greater challenge is the metallic mould cavity, which is central to the injection moulding technique. We can envisage several types of possible feedback:
I Dynamic feedback: quantitative measurements that can be used to adjust the injection moulding process during the cycle. Examples of this include adjusting the injection pressure and the mould temperature.
II Optimising feedback: quantitative measurements made in the current cycle that can be used to adjust the next injection moulding cycle, such as changing the injection pressure or the dimension gap between adjustable parts of the mould cavity. Such feedback will be invaluable when repeated measurements are under software control, as in the case of a digital twin system.
III Information feedback: Quantitative measurements that can be used to develop an enhanced understanding of the complex processes taking part in the mould cavity. Depending on the capabilities of the receiving station, for example, in a digital twin technology system, the information will inform the digital twin and allow the mimicking of the real system to be more accurate, or it may require expert evaluation.
We will discuss this different feedback from the perspective of common problems in Table 1, but we should never overlook the value of visual inspection after completing each moulding cycle.

Table 1. A table of parameters for the injection moulding system with an indication of whether the parameter can be adjusted within the cycle or only for the next cycle. The numerical values in the first column correspond to the values used in this work.
Table 1 lists the parameters for the injection moulding system used in this work, indicating whether the parameter can be changed during the moulding cycle. To a limited extent, this possibility will vary from one injection moulding system to another, and it is possible to envisage new equipment that could react to a greater level of dynamic feedback. In the lower part of the table, we list parameters that will form part of systems other than those used in this work.
4 Materials and methods
4.1 Materials
This work focused on three polyolefin-based materials. The first material is an isotactic polypropylene produced by REPSOL, ISPLEN® PR595C2M, which is a polypropylene random copolymer containing ∼3% ethylene with high fluidity intended for injection moulding. It is characterised by its high transparency and good organoleptic properties. Moulds are easily filled with this grade, permitting short cycle times. The resin exhibits a good balance of properties: optical transparency, stiffness, impact resistance, and organoleptic properties. This polypropylene contains a nucleating agent based on dibenzylidene sorbitol. This resin exhibits a melt flow rate (230 °C; 2.16 kg) of 45 g/10 min as evaluated by the ISO 1133 test method. This material is referred to as PPH.
We also used a low melt flow index isotactic polypropylene, namely, Molplen HP 500N from Lyndon Basell Molpen. HP500N is a homopolymer used for general-purpose injection moulding applications. It exhibits good flow and stiffness and is suitable for food contact applications. It exhibits a melt flow rate (230°C/2.16 kg) of 12 g/10 min. This material is referred to as PPL.
The third material used in this work was supplied by Lyndon Basell as Hostalen GC 7260, which is a high-density polyethylene resin used in general injection moulding applications. Hostalen GC 7260 provides good flowability and high rigidity and has been extensively used in injection moulding and other conversion processes. The manufacturers state that it is not intended for use in medical and pharmaceutical applications. It exhibits an MFI (190°C/2.16 kg) of 8.0 g/10 min. This material is referred to as PEL.
4.2 Operando measurement methods
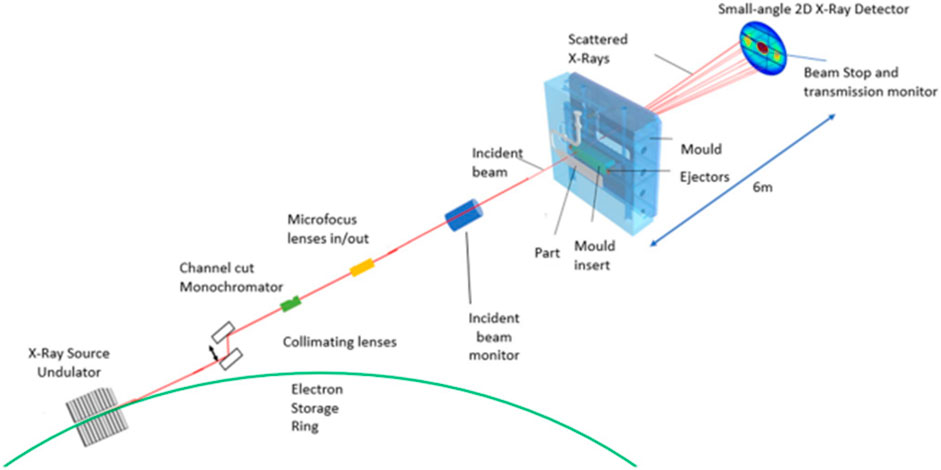
The operando X-ray scattering measurements were performed using a specially designed injection moulding system that was designed, fabricated, and tested at the Centre for Rapid and Sustainable Product Development (CDRSP). This has been described extensively in previous publications (Arioli et al., 2023; Costa et al., 2022; Costa et al., 2024). In this work, we have upgraded the injection moulding system to replace the cold runner with a single-nozzle hot runner, and as part of these changes, we relocated the injection unit to the side of the mould. The hot runner is not simply a heated cold runner, and in this work, we used a hot runner system tailored and developed by YUDO EU S.A. It consists of electrically heated components placed outside the mould due to geometrical restrictions, and it has the main function of conducting the molten plastic from the tip of the nozzle until the gate of the mould, maintaining a controlled adjustable temperature. The heated block is equipped with an inlet, a manifold, and a nozzle. The major parts of the experimental system are shown in Figure 1, which shows a schematic of the X-ray source, the mould assembly, and the small-angle X-ray scattering (SAXS) detector. The SAXS-to-sample distance was set at 6 m to ensure that the detector covers the required scattering vector range and that the zero-angle scattering can be masked by the beam stop and separated from the scattering data. This is also dependent on the beam stop size and shape and the physical dimensions of the detector. Figure 2 shows the injection moulding system mounted on the ALBA NCD-SWEET Beamline (Gonzalez et al.) in Barcelona. This shows the adjustable support for the injection unit with a free bearing support to allow the injection unit to move with the mould as it is repositioned using the translation stage on which the mould system is mounted. A part prepared using this equipment from a polypropylene, PPH, is shown in Figure 3.
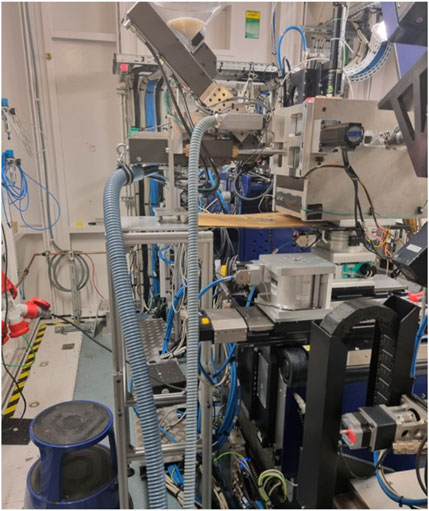
Figure 2. The equipment for operando X-ray scattering measurements during injection moulding mounted on the NCD-SWEET beamline at ALBA.
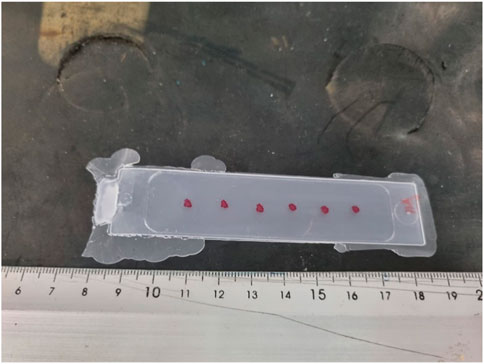
Figure 3. A photograph of a part fabricated by injection moulding using the operando equipment described in this manuscript. The red dots were added afterwards and mark the location of the six “windows” or sampling points.
The source of X-rays on the ALBA NCD-SWEET Beamline is an invacuum undulator, which is an array of permanent magnets driven by 3 GeV electrons. This provides a highly spatially and energetically collimated source. The most intense harmonic generated is at an energy of 12.4 keV corresponding to a wavelength of 1Å, delivering a flux at the sample position of 1.5·1012 ph/s at 12.4 keV @ 150 mA (BL11 NCD). Currently, the ALBA synchrotron light source operates at 250 ma, so the current flux will be 2.4·1012 ph/s at 12.4 keV @ 250 mA. The principal challenge in designing an operando X-ray scattering measurement system for injection moulding is the windows in the mould cavity. In this work, the mould cavity is fabricated from a standard aluminium alloy widely used for moulds, and we have prepared reasonably X-ray transparent windows using thinned areas of 0.08 mm thickness. For 12.4 keV photons, the transmission is ∼70% (Hubbell and Seltzer), and these windows are sufficiently strong to withstand the high pressure exerted by the fluid polymer during the injection phase. It could be that higher energy photons would be beneficial in increasing transmission, but, in that case, the scattered signal will be lower as the scattering factor decreases with increasing photon energy.
In this system, we can make several distinct measurements to provide feedback on the processes within the mould cavity. These measurements do not require the plastic to be transparent in the visible range. They are not restricted to measurements of the surface of the part. We now consider each of these measurement groups.
4.3 Measuring the absorption of the X-rays by the material within the mould cavity
As shown in Figure 1, the X-ray beam enters the mould cavity through one of six windows in the mould cavity prepared by precision machining of the metal to leave a thinned area of a thickness of 0.08 mm. There is an equivalent window on the opposite side of the mould cavity, and the transmitted unscattered beam eventually impinges on the SAXS detector mounted more than 6 m away; the vast fraction of this path is evacuated to eliminate the air and reduce the effects of scattering by the air molecules. This zero-angle transmitted beam is not detected by the SAXS area detector as an absorbing beam stop is positioned to absorb the beam and prevent it from saturating the detector. Mounted inside the beam stop is an X-ray-sensitive photodiode that produces a signal proportional to the X-ray intensity. This signal is integrated over the same time period as the SAXS detector and can be used to obtain information about the fluid polymer in the mould cavity at the point where the X-ray beam passes through the mould cavity. The X-ray beam has a cross-section of 200 µm × 100 µm. The intensity, I(t), at time t measured at the photodiode can be written as
where I0 is the intensity of the beam with an empty cavity, µ is the linear absorption coefficient, and d is the effective sample thickness. Equation 1 can easily be rearranged to yield the value of µd. Using tabulated values of the mass absorption coefficients for C and H for various photon energies (Hubbell and Seltzer), we obtained a value for u/ρ, where ρ is the density, which leads to a value of µ of 1.138 cm−1 for the 12 keV photons.
The incident X-ray beam intensity is more or less constant and depends on the current of the electrons in the “ring.” The ALBA synchrotron light source operates in the so-called “top-up” mode, in which small injections of current are made to maintain the ring current at a more or less constant value. This offers considerable advantages over the historical approach of injecting a large current, waiting for it to decay, and then refilling. The thermal load on the front end of each beamline is highly dependent on the ring current, and maintaining a near-constant current greatly increases the stability and reliability of each beamline. Data files contain the ring current at the time of the data accumulation, and the beamline includes an incident beam monitor, both of which can be used to correct for small variations in the incident beam intensity. The following experiments were performed using the second window counting from the gate, which corresponds to a distance of 30 mm.
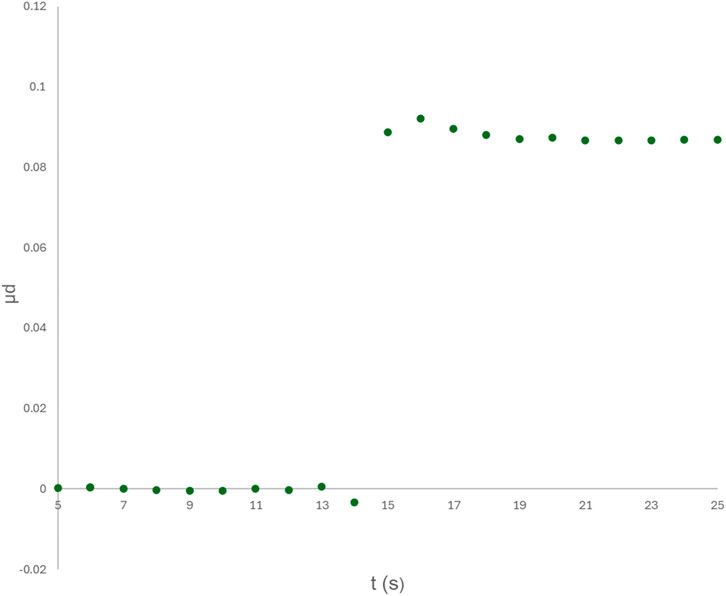
The purpose of this measurement is to provide dynamic feedback so that the injection moulding process can be dynamically optimised. For this purpose, we need fast processes relative to the injection mould cycle, see Figure 4. In earlier work, when first testing the operando X-ray scattering measurement system (Costa et al., 2022; Costa et al., 2024), we employed a 1 s data accumulation cycle time, and Figure 5 shows a plot of the measured value of µd against time during the injection moulding cycle.
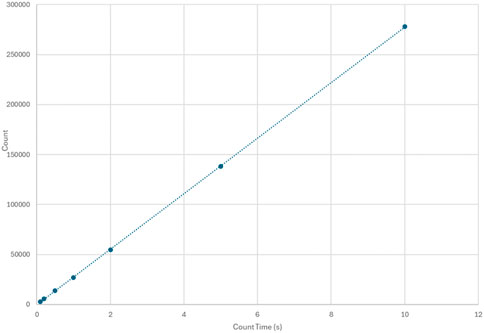
Figure 4. A plot of the integrated signal for the beam stop photodiode against the period of accumulation within an empty mould cavity.
The plot shows a steady value of ∼0, which suddenly jumps to a value approaching 0.1 between successive data measurements. We can also observe a small drop in the signal when it reaches a maximum. We can also observe a drop in the value when the first pressure stage completes and the second pressure stage begins. In these experiments, the first pressure was 40 bar, and the second pressure was 30 bar. As anticipated, the “mould filling” is faster than the 1 s data cycle. With only the SAXS detector active, the fastest data cycle possible is 37 ms, which corresponds to the latency time of the SAXS detector. We repeated the moulding cycle with a data cycle time of 0.1 s, and the resultant plot is shown in Figure 6.
We can observe the transition between the empty cavity and the filling process more clearly. The step up in the value of μd now contains a few points and shows, as we might expect, that the filling of the space probed by the X-ray beam is linear in time. We note the same change in the signal prior to the step up in value of μd, as observed in Figure 6, where the limited time resolution has blurred the signal to a certain amount. This part of the signal, which we can see more clearly in Figure 6, was a puzzle at first, as it suggests that the measured signal is higher than when measured from an empty cavity. At first, a simple explanation linked the nature of the signal to the effect of the injection process on the alignment of the mould, but the effect was repeated on successive injection moulding cycles, so that explanation was discounted. We know from other available timing information that the injection process starts at the deviation of the signal from ∼0. We now see this as the consequence of the detector geometry in the beamstop, and we are working to explore if changes to the design are possible to minimize or eliminate this effect.
The latency of the SAXS detector is 37 ms, so we measured the transmission signal with a data cycle of 0.050 s. Of course, as the data cycle shortens, the noise in the data increases. We will see in a later section the influence of this reducing data cycle time on the SAXS signal. Figure 7 shows a plot of μd as a function of time for a data cycle of 0.05 s. This is broadly similar to that shown in Figure 6. The data quality, even at this short data cycle time, is good. There is a rapid step up when the plastic enters the mould cavity. We note that when comparing the curves with a 0.05 s data cycle for the two polypropylenes, there is a noticeable slowing of the rate of filling time for the polypropylene (PPL) with the lower melt flow index than that recorded for PPH.
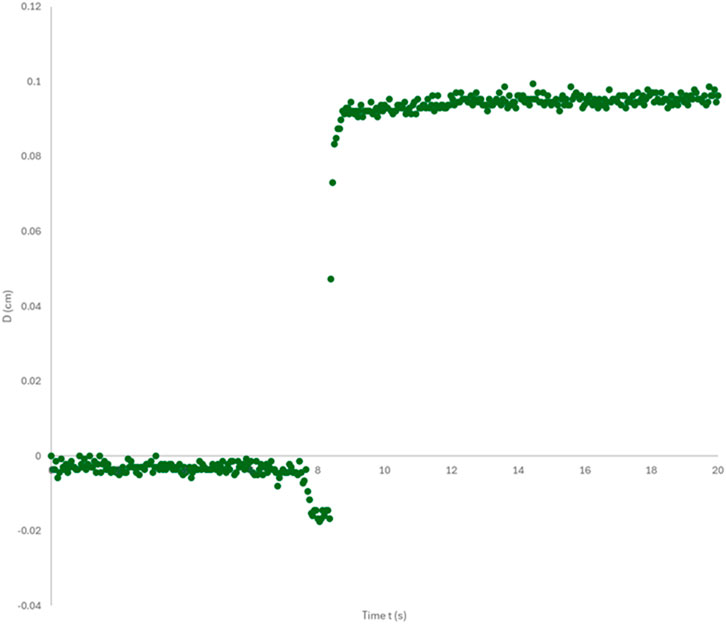
Figure 7. A plot of μd obtained from analysis of the transmission signal as a function of time for a time cycle of 0.05 s.
Clearly, the use of the transmission signal is straightforward, and quantitative information is available on a time scale sufficiently fast to provide dynamic feedback to control, for example, the pressure applied to ensure complete filling. There are options to adjust the position of the sampling X-ray beam along the mould cavity length.
4.4 Small-angle X-ray scattering data
X-ray scattering arises from differences in electron density within the sample, and, as most industrial thermoplastics have broadly similar elemental composition, these electron density differences arise from density differences (BL11 NCD). These may arise from changes in the scale of mixing to the development of organized structures, such as occur for block copolymers and in the crystallisation of polymers to form chain-folded lamellar crystals, the morphology of which has a major impact on properties. Thus, we might expect that SAXS measurements will be most effective in terms of semi-crystalline polymers, block copolymers, and in mixtures of polymers and less effective with amorphous thermoplastics.
Figure 8 shows an SAXS pattern recorded with a data cycle time of 10 s for PPH corresponding to the time points shown graphically. At time t = 0 s, the pattern shows an elliptical nature, indicating that materials have already entered the mould cavity. In Figure 8B, we can observe a well-developed SAXS pattern typical of a semi-crystalline polymer, in which crystallisation has been driven by row nuclei, which are extended chains parallel to the flow direction in the mould. We can see two well-defined maxima on the horizontal axis that arise from stacks of chain-folded lamellar crystals. The peak position gives the long period and the repeating distance in the stack. The morphology of the chain-folded crystals is a strong determining factor of the product properties. The peak position determines the long period, which, with a knowledge of the degree of crystallinity, we can determine the crystal thickness, which is largely determined by the temperature of crystallisation. Using calibration curves determined for the same material, we can use this information to determine the temperature of the polymeric material in the mould cavity and thus determine the rate of cooling at different parts of the mould. The peak intensity gives information on the level of crystallinity. The peak height will increase until the proportion of crystalline material in the lamellar stack is 50%. After that, interpretation is more challenging. The azimuthal variation in the intensity at the same scattering angle as the maxima can be used to quantitatively determine the level of preferred orientation. Obtaining such information in a time-resolved manner gives valuable information on the properties of the product, as it allows the first material to be crystallised to be differentiated from that which takes place at a later time. Post analysis of the product using electron microscopy coupled with differential etching can reveal the complex morphologies that form and the variation in crystallinity in different parts of the product (Mitchell and Tojeira, 2016). Although such a post-analysis approach is very powerful, it cannot be performed in a time-resolved manner to give feedback to an optimisation process using digital twin technology. Of course, the SAXS data shown in Figure 8 were obtained using a data cycle time of 10 s; we now explore the level of information available with a data cycle time of 0.05 s.
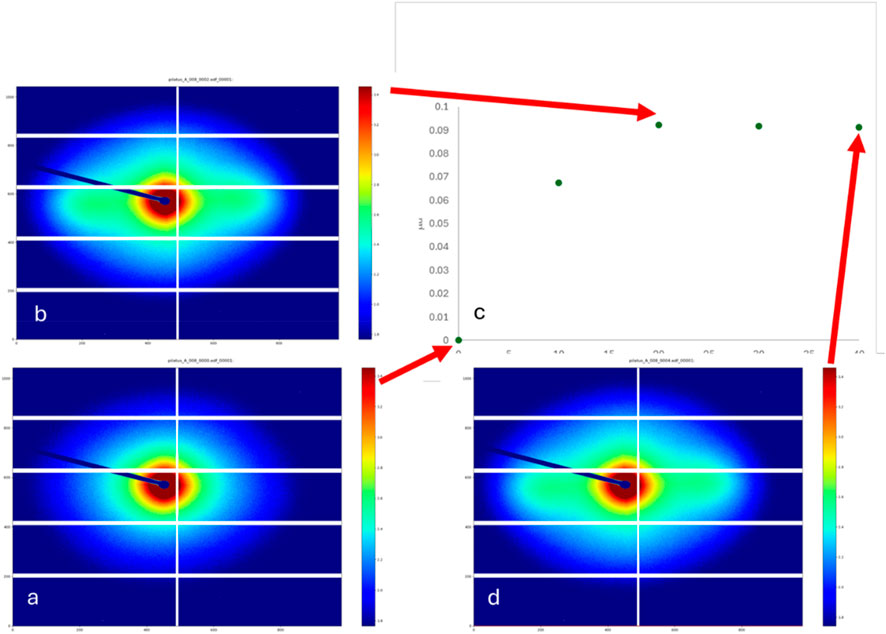
Figure 8. SAXS patterns recorded with a data cycle time of 10 s for PPH corresponding to the time points shown graphically.
Figure 9 shows the raw SAXS pattern recorded with a data cycle time of 0.05 s. We can see that there is a higher level of noise, but we can also see that there is a clear feature positioned in the same manner as that shown in Figure 8B. The SAXS detector is essentially an array of independent photo counters. Figure 10A shows a plot of the intensity as a function of pixel number for a line that passes through the centre. The noise reduction in the equivalent line is now ±10 pixels wide, in which the value plotted is the average of the 20 pixels at that horizontal position. The position of the lamellar stack peak can be seen and evaluated in the graph shown in Figure 10B. Critical to this process is that the average is taken over geometrically equivalent pixels. We note that for a typical polymer processing technology, the sample symmetry is often close to a uniaxial case, and thus, we find it useful to work in polar coordinates |Q|, the modulus of the scattering vector Q, and α, the angle between the scattering vector and the symmetry axis of the sample (Mitchell and Tojeira, 2016). The recorded scattering pattern I (|Q|, α) may be represented as a series of spherical harmonics with amplitudes I2n(|Q|). Only the even harmonics are required, as any non-absorbing sample must exhibit an inversion centre. This process of representing the scattering as a series of spherical harmonics has the principal advantage of separating the effects of preferred orientation from the structure of the material. Indeed, the calculation of the amplitudes of the spherical harmonics naturally leads to the evaluation of the level of preferred orientation in terms of a series of orientation parameters < P2>, <P4>, <P6>, <P8>, etc. (Mitchell and Tojeira, 2016; Mitchell et al., 2005). These are closely correlated with properties. The amplitude of the spherical harmonics can be readily calculated in Equation 2.
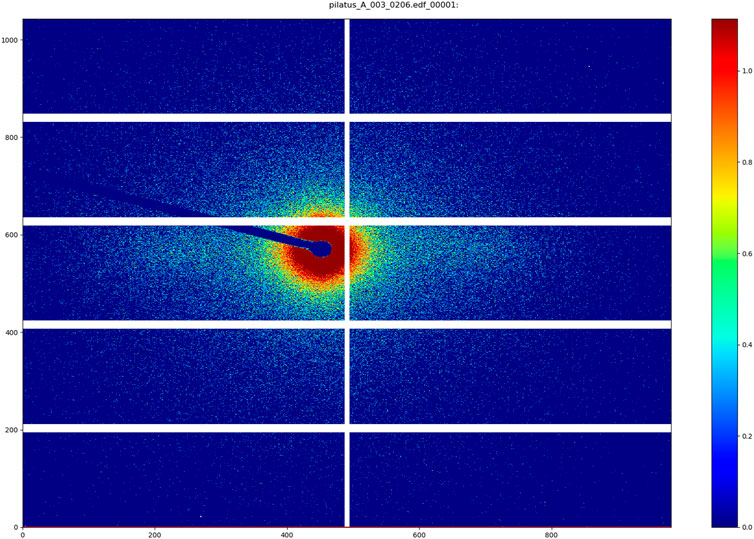
Figure 9. An SAXS pattern recorded with a data cycle time of 0.05 s for PPH corresponding to the time points shown graphically.

Figure 10. (A) A plot of a single-pixel width line through the zero-angle position and (B) a plot of the averaged intensity of a 20-pixel width line through the zero-angle position.
The orientation distribution function D(α) can be described in a similar manner using the amplitudes of a series of spherical harmonics D2n. X-ray scattering enables the complete orientation distribution function to be obtained in comparison to the more limited information available from birefringence and spectroscopy measurements (Mitchell and Windle, 1988).
Calculating these spherical harmonics naturally involves the integration over a number of geometrically related pixels, and hence, such functions will have a much-reduced noise, enabling quantitative measurements to be made.
4.5 Wide-angle X-ray scattering data
We describe wide-angle X-ray scattering (WAXS) data here for completeness. In our current system, it is not possible to collect the WAXS data due to the geometry of the mould system, but we are currently developing a revised system that will enable the observation and recording of WAXS data. WAXS data provide information on the crystal structure of the phases present in the product (Mitchell and Tojeira, 2016). Some polymers, such as isotactic polypropylene, exhibit several different crystal structures with different properties. In the case of iPP, these crystal structures include α, β, and γ, and rapid cooling can lead to a so-called mesomorphic phase. Each of these has very different properties. In the same way, it is possible to use the ratio of the area of the sharp peaks to the broad amorphous peaks to calculate the level of crystallinity over the complete crystallisation range. Finally, it is possible to use the azimuthal variation in intensity to evaluate the preferred orientation of the crystal planes. Each analysis procedure is quantitative and mathematically rigorous.
5 Relationship between X-ray scattering and injection moulding parameters
In the preceding section, we described the data that can be extracted in an operando manner about the preferred orientation, the structure, and the morphology during the transformation of the molten polymer to a solid part within the mould cavity. Of course, this is all useful information to understand the processes involved in injection moulding and to drive a digital twin if that is the selected approach to use the data. In this section, we describe the more direct connections between these data and the parameters listed in Table 1.
5.1 Voids
The largest contrast or electron density difference arises from voids. Figure 11 shows the small-angle X-ray scattering pattern of an injection moulded copolymer sample based on polyhydroxybutyarate. The horizontal streak through the zero-angle point arises from small voids that have been extended in the flow direction, which is vertical on the page. Quantitative analysis of the peak shape can yield information on the shape of the voids. In this case, the voids are highly anisotropic extended voids parallel to the flow axis. In principle, the fraction of voids can also be calculated, but this requires the intensities recorded using the SAXS detector to be placed on an absolute scale (Zhang et al., 2009), a process regrettably rarely performed.
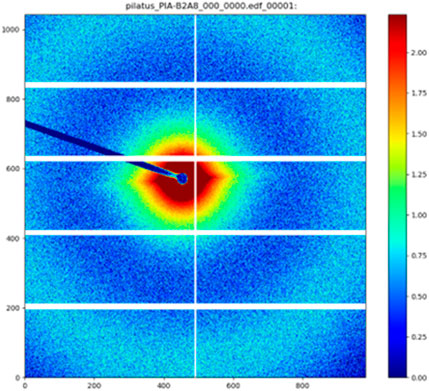
Figure 11. Small-angle X-ray scattering pattern of an injection moulded sample of a copolymer based on polyhydroxybutyrate. The flow direction in the mould cavity is vertical.
5.2 Short-shot and over-filling
The time-resolved measurement of the absorption factor of the material in the mould cavity is described in Section 4.3. This can be employed to evaluate the material thickness and whether this is less than or greater than the length within the mould cavity. In the event that filling of the mould cavity is confirmed by another method, the absorption measurement scan be used to evaluate the density of the material in the mould cavity.
5.3 Small-angle X-ray scattering measurements
Figure 12 shows two sequences of time-resolved SAXS patterns captured at the start of the injection cycle. Time runs from left to right. The flow direction in the mould cavity also runs from left to right. The top row marked A is for PPH, a nucleated polypropylene. The left-hand image at t = 0.00 s corresponds to an empty mould cavity. As we move to the images on the right, we can observe the emergence of a horizontal scattering feature that passes through the zero-angle position and corresponds to a row of nucleated crystals (da Silva et al., 2023), which lie normal to the flow direction. The very high level of preferred orientation is a characteristic of such crystals (da Silva et al., 2023). The last image in the sequence is for a pattern recorded after 9.50 s, and we can observe that the basic characteristics of the preceding image in terms of the anisotropy of the scattering are maintained. Typically, the first crystals form in the materials adjacent to the much cooler mould wall. Subsequent crystallisation takes place with the crystallisation front moving into the interior of the part. Clearly, in Figure 12A, the mode of crystallisation remains the same. In contrast, Figure 12B shows the crystallisation behaviour for PEH. Again, in the first few patterns starting from t = 0.00 s, we can see the emergence of the highly anisotropic horizontal feature, but as time increases, another more isotropic scattering emerges, indicating that the crystallisation mode changes as crystallisation progresses through the part. The crystal thickness of the chain-folded lamellar crystals is strongly correlated with the temperature of crystallisation. As we can determine the crystal thickness as a function of time, the crystallisation moving through the mould cavity provides a route to determining the temperature within the mould cavity rather than only in the mould wall and mould.
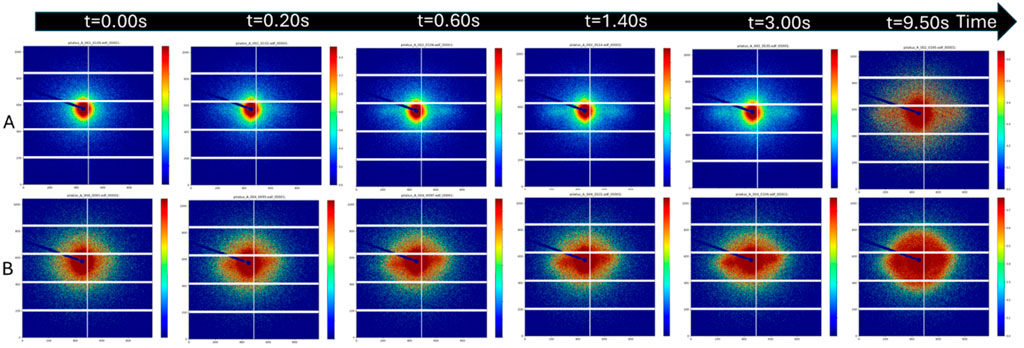
Figure 12. Time-resolved X-ray scattering patterns recorded using the operando methods described in this work.
Of course, we are not the first to identify the value of small-angle X-ray scattering in the study of injection moulded polymer products, and here we highlight some SAXS measurements of polyethylene (Zhao et al., 2020) and those of Zhu and Edward on polypropylene (Zhu and Edward, 2004). Structure–property relationships have been established for polymers (Kantz et al., 1972). The advantage of X-ray scattering is that it is a quantitative technique. Taking preferred orientation as a specific example, as outlined in Section 4.4, we can extract all the quantitative parameters from the SAXS patterns shown in Figure 12. These procedures enable us to reconstruct the complete orientation distribution function for each pattern. We can obtain this distribution for both the crystalline and amorphous components in the case of semi-crystalline polymers. The mechanical properties of the injected part have been shown to strongly depend on the morphology of the semi-crystalline polymer developed from the processing (Kantz et al., 1972), as well as some factors that depend on the known properties of the polymer chains. We can see that the X-ray scattering measurement can give information on the strength and modulus of the product. The data corresponding to the presence of a spatially varying morphology can be used to predict the level of warpage rather than using post-processing laboratory-based data (Li et al., 2019).
6 Discussions
In Section 4, we showed the time-resolving measurements it is possible to make using X-ray scattering data recorded during an injection moulding cycle. The processing required to produce the data interpretation is relatively modest and can be performed automatically without operator intervention. The use of polar coordinates greatly contributes to the averaging over geometrically related pixels, and the employment of spherical harmonics provides a rigorous mathematical framework to perform a subsequent analysis. We are currently developing a server using Python to provide a route to drive digital twin technology or feedback to the injection moulding system. These operando data provide two types of information: one, the transmission measurement provides information that can be used to control the injection moulding system to deliver specific operational parameters, such as pressure and mould filling, and two, the scattering data provide information related to product properties that is perhaps more suited to the use of digital twin technology to provide an optimum set of operational parameters through a reduced number of injection moulding cycles. Clearly, we also need to validate the X-ray scattering data-property relationships by producing samples that exhibit different data and measuring the properties. This could proceed in a standard approach or use machine learning (Wu et al., 2023).
We need to address the cost and availability of this equipment. Only Japanese super companies like Mitsubishi own a synchrotron (Mitsubishi Synchrotron online Mitsubishi Heavy Industries), but this is a test bed for the synchrotron technology. However, the Lightsources of the World website (Lightsources of the World online) states that there are more than 50 synchrotron facilities around the world; people commonly claim there are at least 70. Access is generally free and available to all researchers who will publish their work in the public domain. Facilities based in Europe are making a concerted effort to encourage industrial scientists to make use of these facilities. Indeed, there is currently a European Project “Remade@ARI” (the full title is ReMade@ARI (Recyclable Materials DEvelopment atAnalytical Research Infrastructures)), which is funded by the EU Commission’s Horizon Europe programme and co-funded by UK Research and Innovation (UKRI) and the Swiss State Secretariat for Education, Research and Innovation that offers supported access and analysis. However, it is better to view this current work as paving the way for further developments using the synchrotron light source as a proving ground for the technology. Essentially, the technology exists for localised facilities, namely, efficient area detectors and low-cost bright X-ray sources. If it works, it will be possible to locate it everywhere. There are a few limitations: the part must be reasonably X-ray transparent; only materials with a high level of mineral or metal fillers will be opaque. As already highlighted, the X-ray scattering data component works more effectively for semi-crystalline polymers, but this group includes the leading materials used in injection moulding and the developing biobased polymers.
7 Summary
This work has introduced the possibilities of using time-resolved X-ray data obtained during the injection moulding cycle of industrially relevant equipment.
1. We have shown that hard X-rays can provide three groups of useful data that inform on differing aspects of the injection moulding cycle.
2. The transmission measurements offer the possibility of dynamically controlling the pressure during moulding, which may be useful in limiting damage to the material and preventing the effective recycling of products.
3. The X-ray scattering provides quantitative information related to properties and will be useful in driving a multiscale digital twin system.
Data availability statement
The datasets presented in this study can be found in online repositories. The names of the repository/repositories and accession number(s) can be found below: The data obtained using the facilities of the ALBA synchrotron light source are subject to the generic data management policy at ALBA CELLS, as can be accessed at https://www.cells.es/en/users/call-information-1/bases/2023_03_06_data_policy_cells.pdf (accessed on 19 September 2023). The experimental data identifiers are available from the corresponding author after the end of the embargo period.
Author contributions
APM: formal analysis, investigation, methodology, and writing–review and editing. PV: investigation, methodology, and writing–review and editing. PC: resources, investigation, methodology, and writing–review and editing. JM: resources, investigation, methodology, visualization, funding acquisition, project administration, and writing–review and editing. MM: investigation, methodology, and writing–review and editing. PN: funding acquisition, project administration, resources, and writing–review and editing. PM: resources, investigation, methodology, supervision, project administration, funding acquisition, and writing–review and editing. AJP: resources, funding acquisition, project administration, and writing–review and editing. GRM: conceptualization, funding acquisition, formal analysis, investigation, methodology, project administration, resources, software, supervision, validation, visualization, data curation, writing–review and editing, and writing–original draft.
Funding
The author(s) declare that financial support was received for the research, authorship, and/or publication of this article. This work is supported by the Fundação para a Ciência e Tecnologia (FCT) through the following project references: MIT-EXPL/TDI/0044/2021, 10.54499/UIDB/04044/2023, PRR 2375 Bioshoes4All, and PRR INOVAM C644865234-00000004.
Acknowledgments
The work at ALBA was performed in collaboration with ALBA staff. The authors thank Yudo EU SA for the gift of the hot runner system.
Conflict of interest
Author GM was employed by Visionary Equation Unip lda.
The remaining authors declare that the research was conducted in the absence of any commercial or financial relationships that could be construed as a potential conflict of interest.
The author(s) declared that they were an editorial board member of Frontiers, at the time of submission. This had no impact on the peer review process and the final decision.
Publisher’s note
All claims expressed in this article are solely those of the authors and do not necessarily represent those of their affiliated organizations, or those of the publisher, the editors, and the reviewers. Any product that may be evaluated in this article, or claim that may be made by its manufacturer, is not guaranteed or endorsed by the publisher.
References
Abouzid, I., and Saidi, R. (2023). Digital twin implementation approach in supply chain processes. Sci. Afr. 21, e01821. doi:10.1016/j.sciaf.2023.e01821
Araújo, C., Pereira, D., Dias, D., Marques, R., and Cruz, S. (2023). In-cavity pressure measurements for failure diagnosis in the injection moulding process and correlation with numerical simulation. Int. J. Adv. Manuf. Technol. 126, 291–300. doi:10.1007/s00170-023-11100-1
Arioli, M., Massano, A. P., da Silva, D. P., Gameiro, F. A., Carreira, P., Malfois, M., et al. (2023). Time and spatially resolved operando small-angle X-ray scattering measurements during injection moulding of plastics. J. Manuf. Mater. Process. 7, 176. doi:10.3390/jmmp7050176
Bula, K., Różański, L., Marciniak-Podsadna, L. A. D. W., and Wróbel, D. (2016). The use of IR thermography to show the mold and part temperature evolution in injection molding. Mech. Tech. Mater 36, 40–43. doi:10.1515/amtm-2016-0008
Cao, S., and Si, G. (2022). Design of an automobile injection mould based on automation technology. Mob. Inf. Syst. 2022, 1–13. doi:10.1155/2022/8224364
Chen, J.-Y., Liu, C.-Y., and Huang, M.-S. (2019). Tie-bar elongation based filling-to-packing switchover control and prediction of injection molding quality. Polym. (Basel) 11, 1168. doi:10.3390/polym11071168
Costa, A. A., Gameiro, F., Massano, A. P., Arioli, M., da Silva, D. P., Carreira, P., et al. (2024). Industrially relevant injection moulding apparatus for in situ time-resolving small-angle X-ray scattering measurements. Int. J. Adv. Manuf. Technol. 132, 4737–4752. doi:10.1007/s00170-024-13651-3
Costa, A. A., Gameiro, F., Potêncio, A., Silva, D. P. d., Carreira, P., Martinez, J. C., et al. (2022). Evaluating the injection moulding of plastic parts using in situ time-resolved small-angle X-ray scattering techniques. Polymers 14, 4745. doi:10.3390/polym14214745
da Silva, D. P., Pratumshat, J. J., Pascoal-Faria, S., Mateus, P. A., and Mitchell, G. R. (2023) ““Crystallisation from anisotropic polymer melts” chapter 10 in “polymer crystallization: methods, characterization, and applications”,”. 978-3-527-35081-0. Nishar Hameed Wiley-VCH, 255–283.
Gonzalez, N., González, J. B., Colldelram, C., Llonch, M., Ladrera, J., Fontserè, A., et al. BEAM conditioning optics at the ALBA NCD-SWEET beamline mechanical eng, in Design of synchrotron radiation equipment and instrumentation MEDSI2018. Paris, France. doi:10.18429/JACoW-MEDSI2018-THPH14
He, B., and Bai, K. J. (2021). Digital twin-based sustainable intelligent manufacturing: a review. Adv. Manuf. 9, 1–21. doi:10.1007/s40436-020-00302-5
Hubbell, J. H., and Seltzer, S. M. NIST standard reference database 126 online X-ray mass attenuation coefficients. NIST. accessed on 6th June.
Kantz, M. R., Newman, H. D., and Stigale, F. H. (1972). The skin-core morphology and structure–property relationships in injection-molded polypropylene. J. Appl. Polym. Sci. 16, 1249–1260. doi:10.1002/app.1972.070160516
Kariminejad, M., Tormey, D., Huq, S., Morrison, J., and McAfee, M. (2021). Ultrasound sensors for process monitoring in injection moulding. Sensors (Basel) 21 (15), 5193. PMID: 34372430; PMCID: PMC8347947. doi:10.3390/s21155193
Lemstra, M. A. S. M., and de Mesquita, M. A., “Industry 4.0: a tertiary literature review technological forecasting and social change 186, (2023), Technol. Forecast. Soc. Change, doi:10.1016/j.techfore.2022.122204
Li, X., Wei, Q., Li, J., Yang, J., Guan, J., Qiu, B., et al. (2019). Numerical simulation on crystallization-induced warpage of injection-molded PP/EPDM part. J. Polym. Res. 26, 228. doi:10.1007/s10965-019-1869-3
Li, X.-J., Zuo, Z.-M., Mi, H.-Y., Dong, B. b., Antwi-Afari, M. F., Liu, C. t., et al. (2024). A review of research progress on the minimization of weld lines in injection molding. Int. J. Adv. Manuf. Technol. 132, 5179–5210. doi:10.1007/s00170-024-13607-7
Mitchell, G. R., Saengsuwan, S., and Bualek-Limcharoen, S. (2005). “Evaluation of preferred orientation in multi-component polymer systems using x-ray scattering procedures,” in Scattering methods and the properties of polymer materials. Progress in colloid and polymer science (Berlin, Heidelberg: Springer), 130, 149–158. doi:10.1007/b107341
G. R. Mitchell, and A. Tojeira (2016). “Controlling the morphology of polymers” 978-3-319-39320-9 (Switzerland: Springer). doi:10.1007/978-3-319-39322-3
Mitchell, G. R., and Windle, A. H. (1988). Orientation in liquid crystal polymers in developments in crystalline polymers. Appl. Sci. 115–175. doi:10.1007/978-94-009-1341-7
Mitshibushi Synchrotron online Mitsubishi Heavy Industries. Ltd. Glob. Website | Manuf. Technol. Electron Accel. 3GeV Synchrotron. (mhi.co.jp) (Accessed September 09, 2024).
Párizs, R. D., Török, D., Ageyeva, T., and Kovács, J. G. (2022). Machine learning in injection molding: an Industry 4.0 method of quality prediction. Sensors 22, 2704. doi:10.3390/s22072704
Schröder, T. (2024). Simulation in injection molding. 978-1-56990-916-4. Netherlands: Elsevier. doi:10.1016/C2023-0-00988-8
Su, C.-W., Su, W.-J., Cheng, F.-J., Liou, G.-Y., Hwang, S.-J., Peng, H.-S., et al. (2022). Optimization process parameters and adaptive quality monitoring injection molding process for materials with different viscosity. Polym. Test. 109, 107526. doi:10.1016/j.polymertesting.2022.107526
Supply chains Guo, D., and Mantravadi, S. (2024). The role of digital twins in lean supply chain management: review and research directions. Int. J. Prod. Res., 1–22. doi:10.1080/00207543.2024.2372655
Wu, F.-Y., Yin, J., Chen, S.-C., Gao, X.-Q., Zhou, L., Lu, Y., et al. (2023). Application of machine learning to reveal relationship between processing-structure-property for polypropylene injection molding. Polymer 269, 125736. doi:10.1016/j.polymer.2023.125736
Yang, W., Shan, S., Jin, M., Liu, Y., Zhang, Y., and Li, D. (2024). In-situ quality inspection system of injection parts based on transfer learning. Robotic Intell. Automation 44 (1), 152–163. doi:10.1108/RIA-10-2023-0143
Zhang, F., Ilavsky, J., Long, G., Quintana, J., Allen, A., and Jemian, P. (2009). Glassy carbon as an absolute intensity calibration standard for small-angle scattering. Metallurgical Mater. Trans. A 41, 1151–1158. doi:10.1007/s11661-009-9950-x
Zhang, Y., Shan, S., Frumosu, F. D., Calaon, M., Yang, W., Liu, Y., et al. (2022). Automated vision-based inspection of mould and part quality in soft tooling injection moulding using imaging and deep learning. CIRP Ann. 71, 429–432. doi:10.1016/j.cirp.2022.04.022
Zhao, P., Zhang, J.-F., Dong, Z.-Y., Huang, J., Zhou, H.-W., Fu, J.-H., et al. (2020a). Intelligent injection molding on sensing, optimization, and control. Adv. Polym. Technol. 7023616, 1–22. doi:10.1155/2020/7023616
Zhao, R., Chu, Z., and Ma, Z. (2020b). Flow-Induced crystallization in polyethylene: effect of flow time on development of shish-kebab. Polym. (Basel) 12 (11), 2571. PMID: 33147732; PMCID: PMC7693685. doi:10.3390/polym12112571
Keywords: injection moulding, dynamic feedback, multiscale, digital twin, industry 4.0
Citation: Massano AP, Vargas P, Carreira P, Matias J, Malfois M, Novo PJ, Martinho P, Pontes A and Mitchell GR (2024) Towards dynamic multiscale feedback during the injection moulding cycle of plastics. Front. Mater. 11:1466753. doi: 10.3389/fmats.2024.1466753
Received: 18 July 2024; Accepted: 30 September 2024;
Published: 11 November 2024.
Edited by:
Jian Wang, Beijing University of Chemical Technology, ChinaReviewed by:
Huaguang Yang, Kingfa Scientific and Technological Co., Ltd., ChinaYang Zhang, Technical University of Denmark, Denmark
Copyright © 2024 Massano, Vargas, Carreira, Matias, Malfois, Novo, Martinho, Pontes and Mitchell. This is an open-access article distributed under the terms of the Creative Commons Attribution License (CC BY). The use, distribution or reproduction in other forums is permitted, provided the original author(s) and the copyright owner(s) are credited and that the original publication in this journal is cited, in accordance with accepted academic practice. No use, distribution or reproduction is permitted which does not comply with these terms.
*Correspondence: Geoffrey R. Mitchell, Z2VvZmZyZXkubWl0Y2hlbGxAdmlzaW9uYXJ5ZXF1YXRpb24uY29t
 Anabela P. Massano
 Patricio Vargas
 Pedro Carreira
 Joao Matias1
 Paulo J. Novo
 Geoffrey R. Mitchell