 Huoda Dun1,2
 Song Chen
- 1Hebei Center for Ecological and Environmental Geology Research, Hebei GEO University, Shijiazhuang, China
- 2College of Urban Geology and Engineering, Hebei GEO University, Shijiazhuang, China
- 3Key Laboratory of Intelligent Detection and Equipment for Underground Space of Beijing-Tianjin-Hebei Urban Agglomeration, Ministry of Natural Resources, Hebei GEO University, Shijiazhuang, China
Tunnel construction in central and western China presents significant challenges primarily due to the complex geological conditions. The presence of water-rich zones compromises the stability of excavation faces, leading to potential safety risks and economic losses. This study investigates the Yingpan Mountain extra-long tunnel through numerical simulations, focusing on stress and displacement variations under varying conditions. The primary focus is on assessing the influence of water on tunnel stability, particularly under water-rich conditions. The study proposes effective evaluation methods for different construction stages. The findings offer valuable guidance for future engineering projects, thereby enhancing safety and efficiency in tunnel construction.
1 Introduction
Infrastructure serves as a critical pillar for both economic and social advancement, playing a strategic and foundational role (Zhang, 2021). Over the past decade, China has accelerated the construction of infrastructure such as tunnels, bridges, and highways. The achievements, as reflected in various data, are remarkable (People’s Republic of China, 2021). China’s vast mountainous regions, characterized by complex geological conditions, present significant challenges for tunnel engineering. In tunnel engineering, a large number of Class IV and V weak surrounding rocks have been encountered. Due to the poor grade of the surrounding rocks, the tunnel face is highly susceptible to instability when influenced by water. Tunnel construction in such geological contexts can severely impede project progress and pose serious threats to the safety of construction workers. Analyzing the stability of tunnel faces in weak surrounding rocks under water-rich conditions, and mitigating instability during the construction process, holds significant theoretical importance and practical engineering value.
Currently, both domestic and international practices involve theoretical analysis and numerical simulations to study the stability of the tunnel face (Wang et al., 2024). Leca and Dormieux (1990) applied three-dimensional limit equilibrium theory to determine the upper and lower bound solutions for the support pressure needed to maintain tunnel face stability. Mashimo and Suzuki (1998) conducted centrifugal model tests on sandy soil strata to investigate tunnel face stability in sandy layers. Cui et al. (2017) employed three-dimensional model experiments to examine the failure patterns and processes of tunnel faces in Class IV broken surrounding rocks under various loading conditions. De Buhan et al. (1999) analyzed the stability of tunnel faces in shallow circular tunnels located in water-rich areas, developing an analysis process for assessing the stability of surrounding rocks under seepage conditions using self-developed numerical software.
Regarding the issue of tunnel face stability under water-rich conditions, extensive research has been conducted by experts and scholars on both the stability of tunnel faces and the reinforcement measures needed, relying on theoretical analysis and numerical simulation (Editorial Department of China Journal of Highway, 2022; Wang D. M. et al., 2016) conducted research on the evolution process of water gushing and mud bursting in tunnels by combining model tests and numerical simulation; Zhao and Jia (2016) investigated the mechanical properties of weak surrounding rocks during construction using the GD method and Tai excitation. Ma et al. (2023) used the discrete element method to track and statistically analyze the development of fractures in the surrounding rock of the tunnel and the amount of water gushing and mud bursting in the tunnel, revealing the law of tunnel water gushing and mud bursting with the change of fault dip angle. Huang et al. (2015) established a discontinuum-hydraulic coupling model based on the joint orientation obtained from field statistics, studying the distribution characteristics of the seepage field under jointed conditions and the water pressure outside the lining. An et al. (2022) revealed the impact of water on the deformation of the tunnel face and surrounding rock through laboratory experiments and theoretical analysis, proposing a mass fractal dimension formula to quantify the degree of rock fragmentation. Wang et al. (2019) used numerical simulation and theoretical analysis to study the stability of the earth pressure shield tunnel face under different hydraulic gradients and proposed a new prediction formula. Zhong and Liao (2022) analyzed the stability of the tunnel face under stable seepage field conditions through a three-dimensional rotational mechanism and limit analysis method. Li et al. (2024) developed a coupled fluid-solid numerical model using the Material Point Method (MPM) to simulate seepage damage during the excavation of a submarine fault zone tunnel. Jiang et al. (2022), based on geological exploration and laboratory testing, proposed an analysis method and control measures for tunnel face failure in water-rich sandstone formations. Tu et al. (2024) proposed a three-dimensional continuous-discrete coupling method to simulate the destabilization process of the tunnel face considering the seepage effect. Shi et al. (2024), focusing on the construction issues of large shield tunnels in coastal water-rich formations, analyzed the disaster mechanism of pipe uplift based on field tests and numerical models and proposed corresponding engineering measures.
Research on tunnel face stability has primarily focused on tunnels in Class II and III surrounding rocks, with relatively fewer studies addressing tunnels in Class IV surrounding rocks. This paper concentrates on the Ying Pan Mountain long tunnel, which is situated in Class IV surrounding rock under water-rich conditions. The study emphasizes the influence of water, analyzing tunnel face stability under various conditions. It reveals the significant impact of water on tunnel face stability, offering valuable insights for practical engineering applications.
2 Engineering summary
2.1 Project overview
The Yingpan Mountain Tunnel is located in the northwestern part of Yunnan Province, nestled within the heart of the northwestern Hengduan Mountains on the Yunnan-Guizhou Plateau. The region is characterized by harsh climatic conditions, narrow terrain, and complex geological structures, marking it as a high-intensity seismic area. The Yingpan Mountain Tunnel is one of the major control projects of the Huaping to Lijiang Expressway.
The left line of the Yingpan Mountain Tunnel extends from milestone ZK18+588 to ZK29+860, covering a length of 11,272 m, and the right line from K18+580 to K29+890, covering a length of 11,310 m. Both lines are classified as ultra-long tunnels, with the highest elevation reaching 2,543 m. The tunnel features a separated dual carriageway design with four lanes. The tunnel’s topographical, geological, and environmental conditions are unique, rendering the construction process extremely complex (see Figure 1).
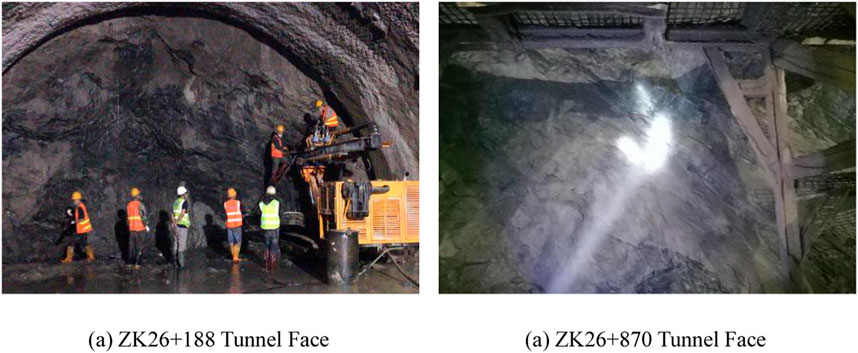
Figure 1. Real shot of Yingpanshan Tunnel face of the palm. (A) ZK26+188 Tunnel Face, (B) ZK26+870 Tunnel Face.
2.2 Engineering geological conditions
The tunnel site is situated in a tectonically eroded low mountainous area characterized by significant topographical undulation, as shown in Figure 2. The ground elevation along the tunnel’s central line ranges from 1,567.80 to 2,529.15 m, with a maximum relative height difference of 961.35 m and a maximum burial depth of 883 m. The natural slope of the mountain ranges between 35° and 45°, with well-developed surface vegetation. The tunnel entrances and exits are located on the mountainous front slope, where the natural slope is generally stable. The left main tunnel at the Huaping end, ZK26+188, has a surrounding rock mainly composed of slightly weathered dolomite, which is affected by folding, resulting in a fragmented rock mass, hard rock quality, well-developed joints and fractures, and developed fracture water, leading to poor overall stability of the surrounding rock.
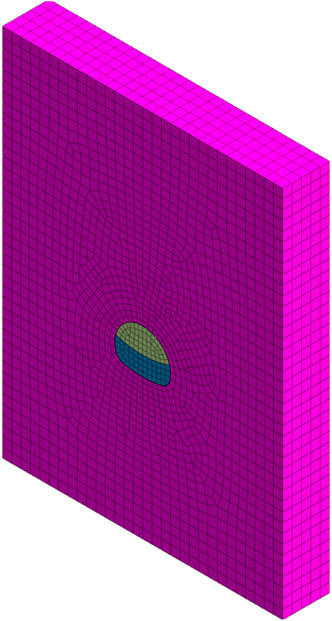
Figure 2. Overall numerical model of Yingpan mountain tunnel.
The overburden strata at the site consist of Quaternary Holocene colluvial deposits (QPdl) of silty clay and gravel, which are unevenly distributed. The underlying bedrock includes the Lower Proterozoic Huili Group gneiss and migmatite, Sinian Guanyin Cliff Formation mudstone and sandstone, Sinian Dengying Formation dolomite and dolomitic limestone, Devonian Middle Series limestone, Triassic Upper Series Ganhaizi Formation argillaceous sandstone and sandstone, Triassic Shezi Formation sandstone and mudstone, and early Neoproterozoic (02) quartz diorite.
3 Tunnel numerical simulation
3.1 Establishment of the numerical model
3.1.1 Three-dimensional model
The maximum excavation width of the tunnel cross-section is 12.38 m, with a maximum vertical excavation depth of 9.93 m. The selected tunnel model dimensions are 50 m in length, 10 m in width, and 80 m in height. The anchor bolt connection length is 2.5 m, with a total of 29 anchor bolts, and the arc length between the anchor bolts is 0.75 m. The model is shown in Figures 2, 3.
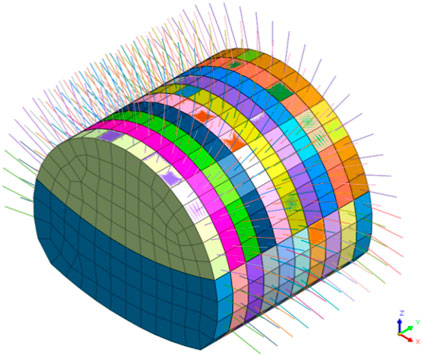
Figure 3. Axial view of tunnel support system.
Considering the geological conditions, the surrounding rock is treated as a single stratum, and the Mohr-Coulomb constitutive model is applied. The model’s displacement on the left and right sides, as well as at the ground surface, is constrained, with the upper surface being a free surface. The front, back, and bottom surfaces are set as impermeable boundaries, with the pore pressure at the water table set to zero (Lin, 2021; Dong et al., 2022). The analysis of the tunnel face is positioned 5 m behind the excavation direction, which is 5 m away from the initial tunnel excavation face (refer to Figure 4).
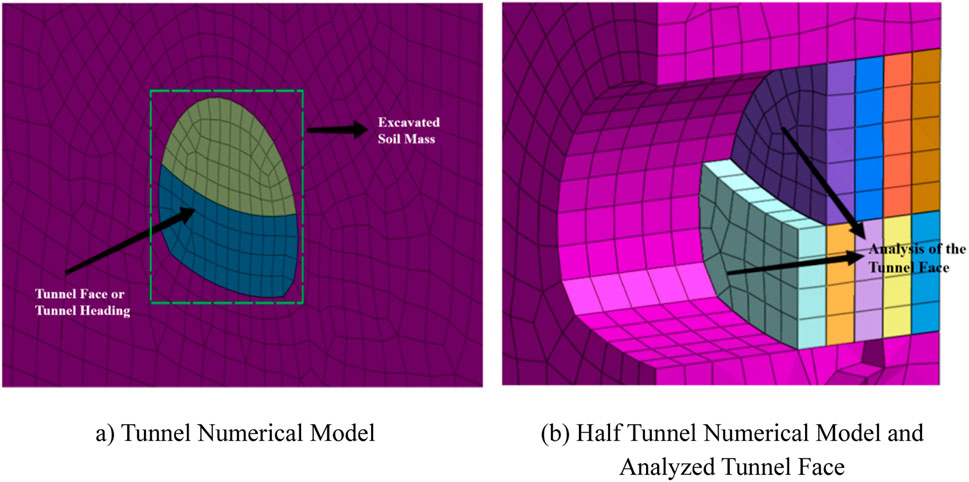
Figure 4. Numerical model of Yingpanshan tunnel face. (A) Tunnel Numerical Model, (B) Half Tunnel Numerical Model and Analyzed Tunnel Face.
This research focuses on the numerical simulation analysis of the section from ZK26+188 to ZK26+198 of the Yingpan Mountain Tunnel. The soil mass is simulated with “solid” elements, the initial support is modeled using “plate” elements, and the rock bolts are represented by “embedded truss” elements. The “activate/deactivate” commands are applied to simulate the excavation of soil and the implementation of support works (Sun et al., 2024; Zhu and Xing, 2019). The rock mass is treated as a homogeneous entity, considering only the self-weight load of the soil layer.
3.1.2 Calculation parameters
The parameters for the tunnel soil, structural materials, and structural properties are presented in Tables 1, 2.
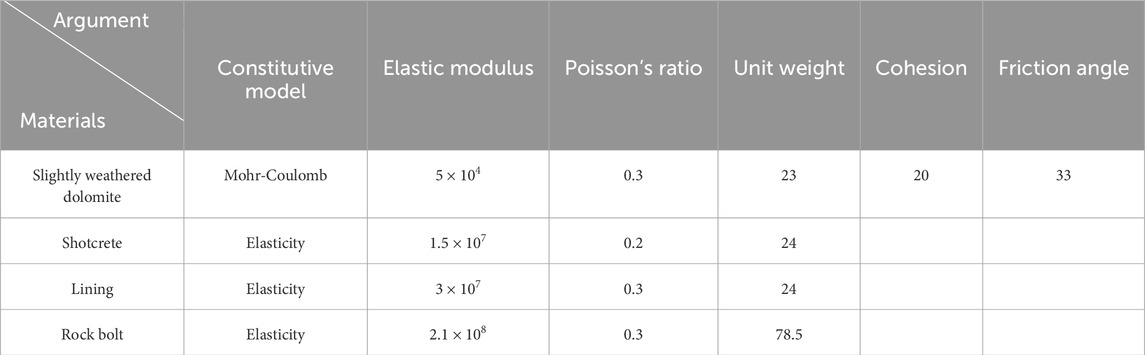
Table 1. Tunnel soil material and structural material parameter table.
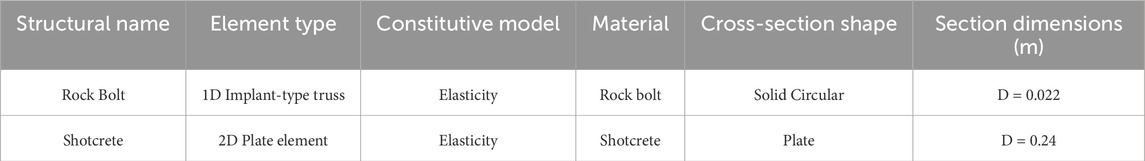
Table 2. Tunnel structure attribute parameter list.
3.1.3 Excavation conditions
The tunnel excavation employs the top-down bench method, with each step excavating 1 m. The main steps of tunnel construction are as follows:
1) Excavate the upper half-section of the pilot tunnel - Initial support for the upper pilot tunnel.
2) Excavate the lower half-section of the pilot tunnel - Initial support for the lower pilot tunnel.
The excavation conditions are presented in Table 3.
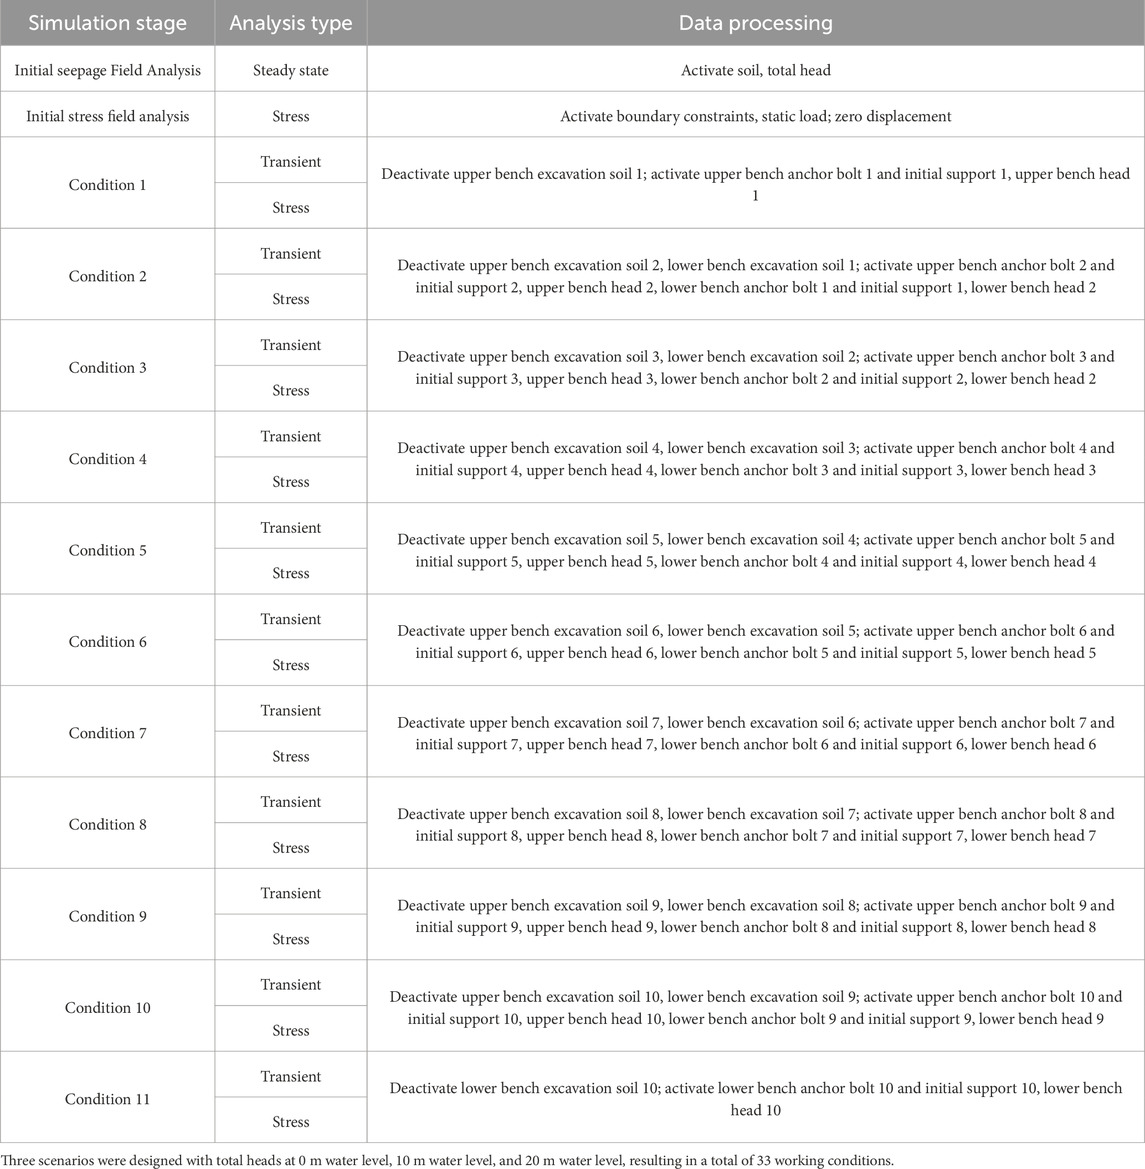
Table 3. Tunnel excavation simulation steps.
3.2 Solution of fluid-solid coupling problem in tunnel engineering
In the realm of tunnel engineering, the interplay between stress and seepage fields is known as fluid-solid coupling problems. This interaction is characterized by the stress field’s impact on the seepage field through its effects on the soil’s volumetric strain and porosity. Consequently, this leads to changes in permeability pressure and the volume force within the seepage field, which in turn influences the stress field (Zhang et al., 2018; Lan et al., 2023; Zhang et al., 2011).
Addressing fluid-solid coupling issues within the Midas/GTS software hinges on the formulation of a mathematical model, which is then resolved employing the Newton-Raphson iterative technique. Several assumptions underpin this approach (Editorial Department of China Journal of Highway, 2022; Hu, 2018):
1) Assume the geotechnical material is homogeneous and isotropic. Rock mass parameters are considered elastoplastic;
2) Tectonic stress fields are excluded from consideration; the model accounts solely for the stress field resulting from self-weight;
3) The model disregards soil compressibility and temperature effects, assuming a constant temperature state throughout the analysis (Xiao et al., 2022; Zhang et al., 2020; Kawanoue et al., 2023).
In MIDAS-GTS software, the model employs the finite element method to solve the seepage-stress coupling problem (Wang K. Z. el at., 2016). The solution steps are as follows:
1) Determination of the hydraulic head function: First, calculate the hydraulic head function H(x, y, z) using the seepage control equation. The control equations are given in Equation 1:
where, H is the total head at each calculation point; kx, ky, and kz are the initial permeability coefficients in the x, y, and z directions, respectively; and Q is the flow rate.
2) Calculation of Seepage Force: Based on the previously calculated hydraulic head function, we can further derive the seepage pressure and seepage body force within the seepage region. According to the basic principles of hydraulics, the calculation formulas for the seepage body force are given in Equations 2, 3.
where, f is the magnitude of the seepage body force; γw is the unit weight of water; fx, fy, and fz are the components of the seepage body force in the x, y, and z directions, respectively;
3) Conversion to Equivalent Nodal Loads: Within the finite element analysis framework, the calculated seepage body forces are converted into equivalent nodal loads acting on the rock mass structure through a specific transformation method. This conversion allows for the simulation of the mechanical response of the rock mass under the action of seepage forces.
4) Incorporation of Stress-Dependent Permeability: The normal stress values obtained from the previous step are incorporated into the permeability matrix of the equivalent continuous medium under load. Generally, the change in permeability is set as an exponential function of stress. Therefore, the permeability matrix of the equivalent continuous medium under load is given in Equation 4.
where,
5) Iterative Calculation: After completing the initial calculations of permeability coefficients and stress fields, multiple iterations of calculations are required, repeating steps 1) to 4). This process continues until the results meet the program’s set accuracy requirements or convergence criteria.
4 Result analysis
To more accurately study the stability of the tunnel’s surrounding rock, key analysis points were selected on the tunnel’s cross-sectional area (Lin, 2021; Zhu and Xing, 2019; Dong et al., 2022), with the locations depicted in Figure 5.
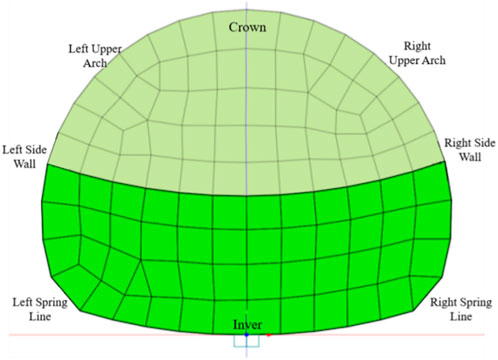
Figure 5. Schematic diagram of key analysis points on tunnel face.
4.1 Stress analysis of tunnel surrounding rock under natural conditions
The results above illustrate the stress distribution in the tunnel’s surrounding rock without any support measures. As shown in Figure 6, maximum stress concentrations are observed at the tunnel’s arch bottom and sidewalls, while stress values are relatively lower at the arch foot and the top plate of the tunnel contour. This analysis suggests that during tunnel construction, special attention should be paid to stress changes at the arch bottom and sidewalls. Timely reinforcement and stabilization measures should be implemented in these critical areas.
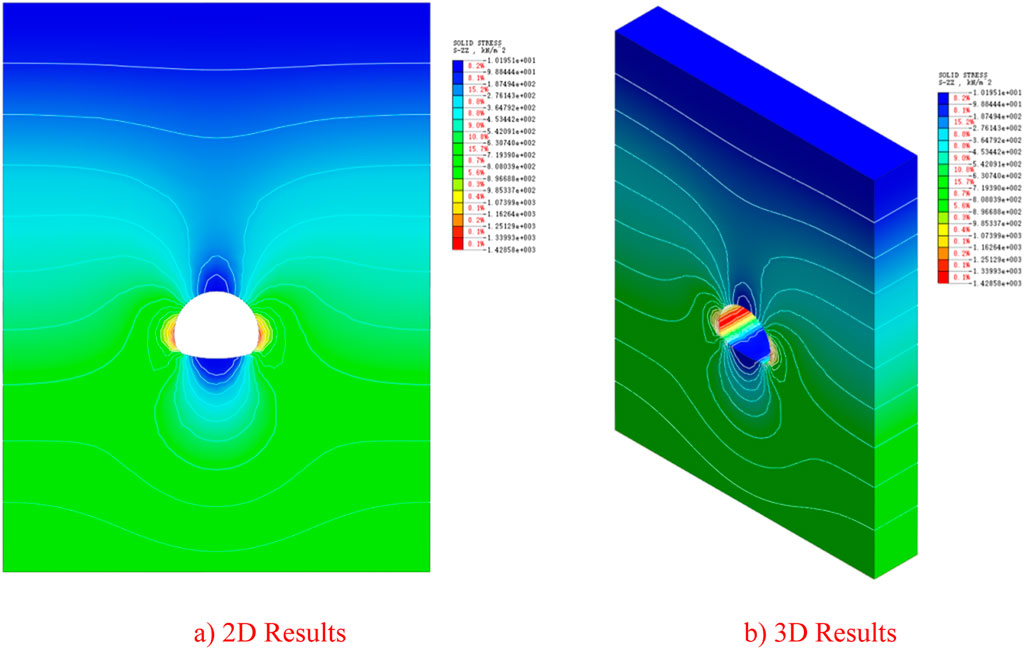
Figure 6. Tunnel stress nephogram. (A) 2D Results, (B) 3D Results.
The timely application of shotcrete and mortar anchor support during tunnel construction can mitigate issues such as subsidence of the surrounding rock and deformation of the tunnel’s inner walls due to stress reduction. Additionally, as the surrounding rock and the main support structure of the tunnel form an arch combination effect, the wall stress of the tunnel will gradually decrease.
4.2 Displacement analysis of tunnel surrounding rock
The above results depict the displacement distribution in the tunnel’s surrounding rock without any support measures. As shown in Figure 7, the maximum negative displacement value of 104 mm occurs at the arch top of the tunnel, while uplift occurs in the arch bottom region with a maximum positive displacement value of 109 mm. As the tunnel soil is excavated, the maximum displacement of the tunnel face occurs in the middle part, with the horizontal displacement decreasing towards the upper and lower directions of the tunnel face.
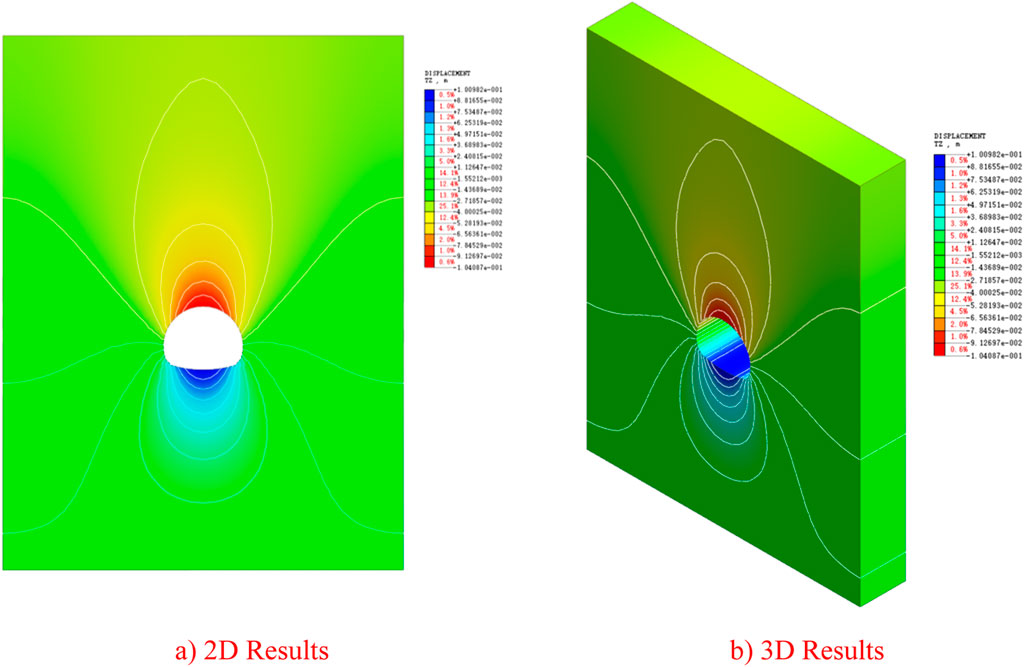
Figure 7. Tunnel displacement nephogram. (A) 2D Results, (B) 3D Results.
4.3 Analysis of the impact of water table level on tunnel stability
To study the effects of water table conditions on the displacement and deformation of a tunnel with high water content, as well as the extent of plastic zones, numerical computations were performed for three distinct water head heights: 0 m (at ground level), 10 m (10 m below ground level), and 20 m (20 m below the ground level) (Huang et al., 2018; Shan et al., 2019).
This analysis is crucial for understanding how different water pressure conditions, resulting from varying water table levels, can influence the structural behavior and stability of tunnels, particularly in geological formations with high water content. Negative values for water head height indicate the depth of the water table below ground level. The numerical calculations help predict the tunnel’s response to hydrostatic pressure and potential groundwater seepage forces.
4.3.1 Analysis of tunnel face deformation patterns
Analysis Results from Figures 8, 9.
1. Deformation Near the Tunnel Face: Maximum deformation occurs near the tunnel face’s arch bottom, gradually decreasing toward the arch top and arch bottom, presenting a bulging deformation pattern. This characteristic becomes more pronounced as the water table drops.
2. Impact of Water Table Lowering: As the water table drops, the horizontal displacement of the tunnel face generally increases, while the vertical displacement generally decreases For instance, at a 0-m groundwater level, the maximum horizontal displacement and settlement are 19.89 mm and 73.67 mm, respectively. At a 10-m groundwater level, these values are 96.38 mm and 27.21 mm, respectively. At a 20-m groundwater level, they are 124.80 mm and 36.38 mm, respectively. Figure 9 indicates that the primary deformation of the tunnel face is in the vertical direction.
3. Horizontal Displacement Patterns: When excavating to the reference tunnel face, the maximum horizontal displacement occurs at the invert position of the tunnel face and decreases towards the arch top and arch bottom, indicating that the excavation disturbs the surrounding rock more in the vertical direction than in the horizontal direction. The higher the water table, the more pronounced the displacement concentration.
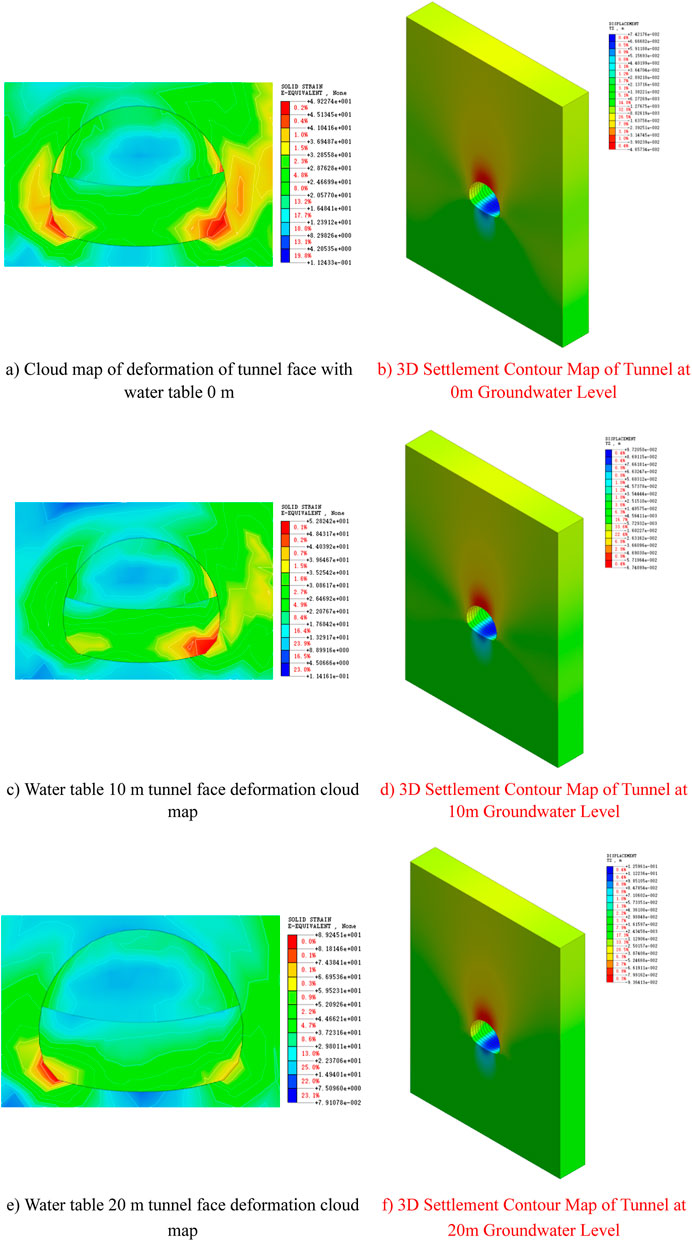
Figure 8. Tunnel deformation contour Maps. (A) Cloud map of deformation of tunnel face with water table 0 m, (B) 3D Settlement Contour Map of Tunnel at 0 m Groundwater Level, (C) Water table 10 m tunnel face deformation cloud map, (D) 3D Settlement Contour Map of Tunnel at 10 m Groundwater Level, (E) Water table 20 m tunnel face deformation cloud map, (F) 3D Settlement Contour Map of Tunnel at 20 m Groundwater Level.
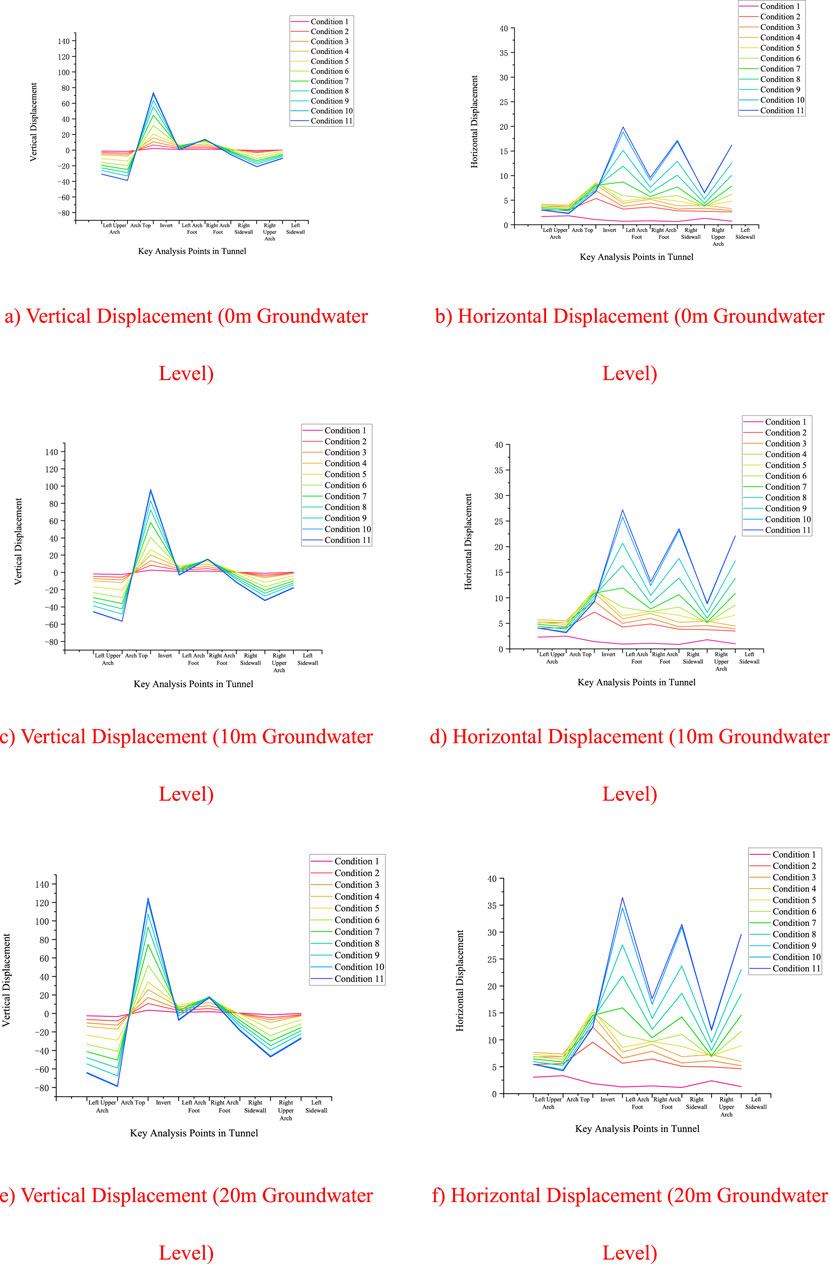
Figure 9. Tunnel face main control point displacement. (A) Vertical Displacement (0 m Groundwater Level), (B) Horizontal Displacement (0 m Groundwater Level), (C) Vertical Displacement (10 m Groundwater Level), (D) Horizontal Displacement (10 m Groundwater Level), (E) Vertical Displacement (20 m Groundwater Level), (F) Horizontal Displacement (20 m Groundwater Level).
Under different water level conditions, the stress distribution at the arch top and arch bottom of the tunnel shows significant differences. The higher the water level, the greater the stress at the arch top and arch bottom. During tunnel construction, it is crucial to consider the impact of groundwater level changes on the surrounding rock stress, especially the stress concentration phenomenon under high water level conditions. To ensure tunnel stability, effective support and reinforcement measures should be implemented in the arch top and arch bottom areas to prevent surrounding rock damage caused by excessive stress concentration.
4.3.2 Analysis of stress on the tunnel face and surrounding soil
As shown in Figure 10:
(1) Among the primary analysis points, when the groundwater level is at 0 and 10 m, the areas of maximum stress on the tunnel face and surrounding soil are located on the right side wall; at a groundwater level of 20 m, the area of maximum stress shifts to the left side wall. Additionally, the force exerted on the right side of the tunnel face is generally greater than that on the left side.
(2) As the groundwater level sequentially decreases from 0 to 10 and then to 20 m, the stress on the tunnel face and the surrounding soil increases progressively, with a significant concentration of stress occurring. This analysis indicates that tunnel face stability diminishes as the groundwater level declines. Consequently, when the groundwater level within the surrounding rock decreases, it is essential to strengthen tunnel support measures in a timely manner to enhance tunnel face stability.
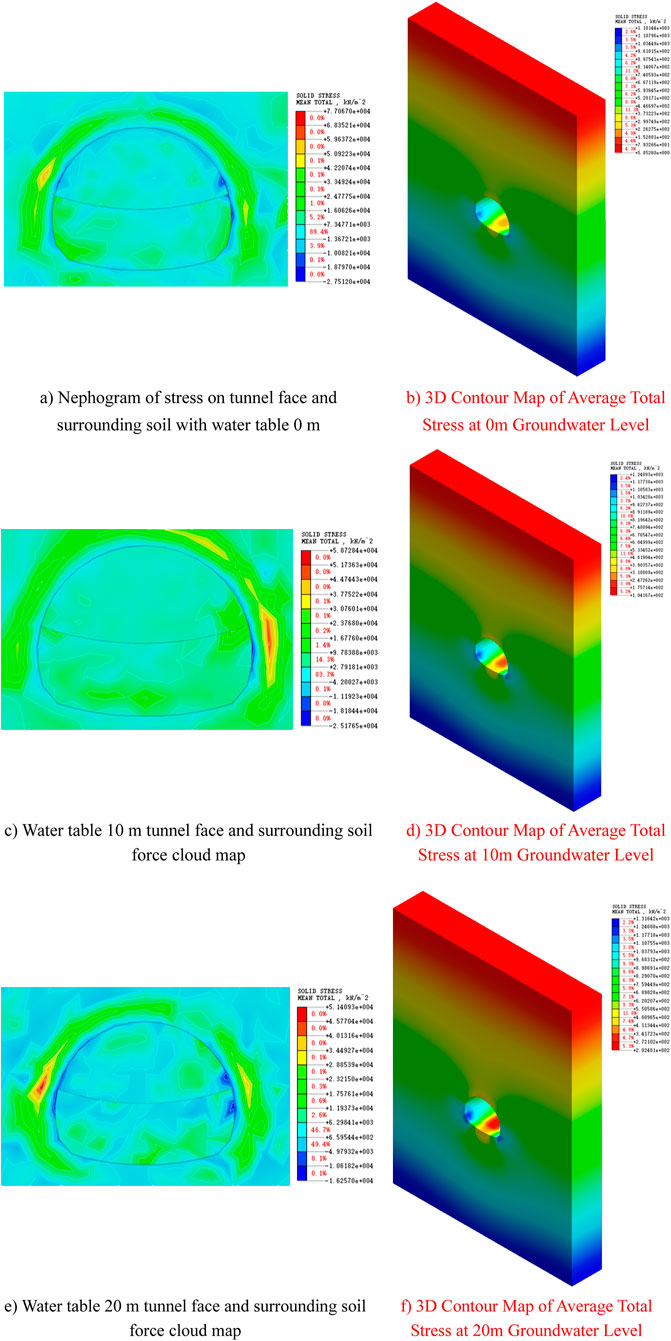
Figure 10. Tunnel stress field distribution contour Map. (A) Nephogram of stress on tunnel face and surrounding soil with water table 0 m, (B) 3D Contour Map of Average Total Stress at 0 m Groundwater Level, (C) Water table 10 m tunnel face and surrounding soil force cloud map, (D) 3D Contour Map of Average Total Stress at 10 m Groundwater Level, (E) Water table 20 m tunnel face and surrounding soil force cloud map, (F) 3D Contour Map of Average Total Stress at 20 m Groundwater Level.
4.3.3 Analysis of seepage field in tunnel face and surrounding soil
As shown in Figure 11, the pore water pressure around the tunnel varies significantly under different water level conditions. As the water level decreases, the gradient of the pore water pressure changes considerably. Especially under the 20-m water level condition, pore water pressure increases, indicating that the seepage force exerted by groundwater on the surrounding rock gradually intensifies.
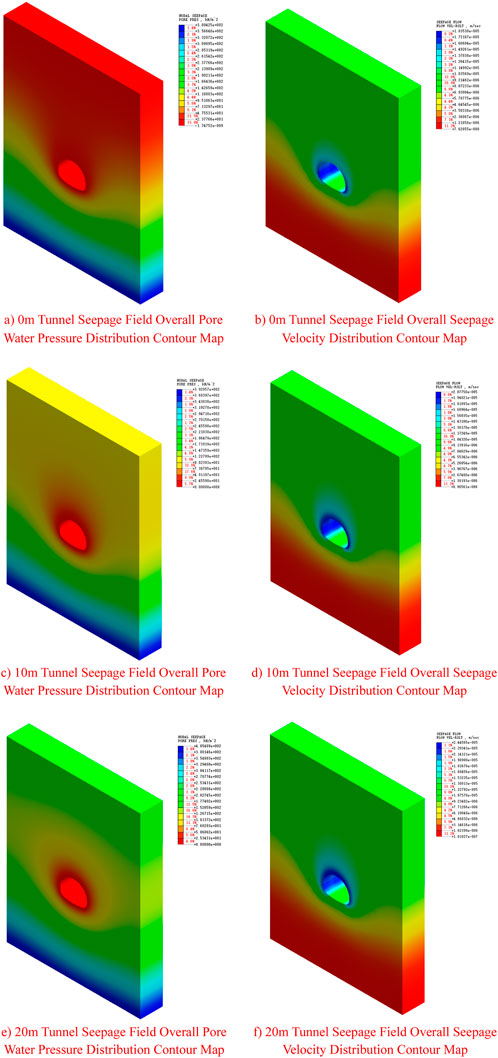
Figure 11. Tunnel seepage field distribution contour Maps. (A) Nephogram of stress on tunnel face and surrounding soil with water table 0 m, (B) 3D Contour Map of Average Total Stress at 0 m Groundwater Level, (C) Water table 10 m tunnel face and surrounding soil force cloud map, (D) 3D Contour Map of Average Total Stress at 10 m Groundwater Level, (E) Water table 20 m tunnel face and surrounding soil force cloud map, (F) 3D Contour Map of Average Total Stress at 20 m Groundwater Level.
The changes in seepage velocity under different water level conditions indicate that the higher the water level, the greater the seepage velocity. This is because a higher water level increases dynamic water pressure, leading to faster water flow. When the water level drops to 20 m, the seepage velocity increases significantly, indicating a rise in water flow around the tunnel. Under high water level conditions, seepage velocity and pore water pressure around the tunnel are elevated, which can lead to instability and increased deformation of the surrounding rock.
Under low water level conditions, although the seepage velocity decreases, the tunnel surrounding rock is still affected by changes in stress, especially with a significant increase in vertical displacement, which may cause further deformation of the tunnel structure.
The deformation of the tunnel under different water levels can be attributed to the following key factors:
1. When geotechnical materials absorb water, the bonding forces between particles significantly decrease. This leads to a reduction in compressive strength, shear strength, and other mechanical properties of the material.
2. Certain geotechnical materials expand when exposed to water and contract when dry. This repeated expansion and contraction can cause volume changes and structural damage in the soil, ultimately leading to the softening of the geotechnical material.
3. The infiltration of water alters the pore structure within the geotechnical material, causing changes in particle arrangement. This structural change often leads to a decrease in material density and a reduction in strength.
4. Water’s long-term erosion effect accelerates the softening of the geotechnical material, further weakening its strength and stability.
5. In geotechnical materials containing soluble minerals, the infiltration of water can trigger chemical reactions, leading to the dissolution of minerals or the formation of new ones. These reactions can alter the physical properties of the geotechnical material, further softening it.
Overall, the softening effect of water on geotechnical materials is primarily through physical and chemical processes that lead to a decrease in material strength and stability, thereby affecting the safety and durability of engineering structures.
5 Conclusion
This study investigates the stability of the surrounding rock of the Yingpan Mountain long tunnel under various hydraulic head conditions. Using numerical simulations in Midas/GTS software, the stress, displacement, and seepage fields of the tunnel cross-section were analyzed, leading to the following key conclusions:
1. The numerical simulation results indicate that as the hydraulic head increases, surface settlement, tunnel face deformation, and surrounding rock damage significantly worsen. At a hydraulic head of 0 m, the tunnel structure exhibits good stability. When the head increases to 10 m, stress concentration in the surrounding rock becomes evident, indicating the need for enhanced tunnel support. At 20 m, deformation and damage to the surrounding rock sharply increase, necessitating more aggressive drainage and support measures to ensure construction safety.
2. The study found that the maximum deformation of the tunnel face occurs at the bottom, becoming more pronounced as the water level decreases. Specifically, horizontal displacement of the tunnel face increases with decreasing water level, while vertical displacement shows a decreasing trend. Under high hydraulic head conditions, the stress difference between the tunnel top and bottom becomes significant, increasing the risk of stress concentration and failure at the arch top and bottom. Therefore, support and drainage measures should be adjusted according to water level conditions to ensure tunnel stability.
3. As the water level drops, stress on the tunnel face and surrounding soil gradually increases, with notable stress concentration. This indicates that during tunnel construction, changes in water level must be closely monitored due to their impact on surrounding rock stress, especially under high water level conditions where stress concentration can lead to rock failure. Strengthening tunnel support and controlling water levels under high water conditions can effectively prevent instability in the surrounding rock.
4. The study shows that changes in water level significantly affect the seepage field around the tunnel. At a hydraulic head of 20 m, seepage velocity and pore water pressure increase markedly, leading to greater instability and deformation of the surrounding rock. Even under low water level conditions, changes in the seepage field still affect the tunnel structure, particularly with increased vertical displacement potentially causing further structural deformation. Therefore, under high water conditions, monitoring the seepage field and implementing appropriate drainage measures are essential to controlling rock deformation.
In conclusion, this study highlights the significant impact of hydraulic head and associated seepage effects on the stability of tunnel surrounding rock, providing theoretical and practical guidance for tunnel design and construction under complex hydrogeological conditions. The effective use of numerical simulation technology can better integrate design and construction in tunnel engineering, thereby enhancing safety and economic efficiency.
Data availability statement
The original contributions presented in the study are included in the article/supplementary material, further inquiries can be directed to the corresponding authors.
Author contributions
HD: Conceptualization, Software, Writing–original draft. SC: Project administration, Writing–review and editing. HL: Investigation, Writing–original draft. CC: Data curation, Formal Analysis, Writing–original draft. YZ: Resources, Visualization, Writing–original draft. YY: Conceptualization, Writing–review and editing, Project administration.
Funding
The author(s) declare that financial support was received for the research, authorship, and/or publication of this article. This study is Supported by the Open Project Program of Hebei Center for Ecological and Environmental Geology Research (JSYF_202304), the National Pre-research Funds of Hebei GEO University in 2023 (KY202305), and the Technology Innovation Team Project of Hebei GEO University (KJCXTD2021-08).
Conflict of interest
The authors declare that the research was conducted in the absence of any commercial or financial relationships that could be construed as a potential conflict of interest.
Publisher’s note
All claims expressed in this article are solely those of the authors and do not necessarily represent those of their affiliated organizations, or those of the publisher, the editors and the reviewers. Any product that may be evaluated in this article, or claim that may be made by its manufacturer, is not guaranteed or endorsed by the publisher.
References
An, Y., Zhou, J., Hu, W., and Li, J. (2022). Effect of water on tunnel face and surrounding rock deformation. Indian Geotechnical J. 52, 1–12. doi:10.1007/s40098-021-00560-5
Cui, G. Y., Wang, D. Y., Ni, S. Z., Yuan, J. X., Ma, J. H., and Zhu, C. A. (2017). Model test research on bearing characteristics of steel fiber reinforced concrete lining in weak surrounding rock tunnel. Chin. J. Geotechnical Eng. (10), 1807–1813. doi:10.11779/CJGE201710008
De Buhan, P., Cuvillier, A., Dormieux, L., and Maghous, S. (1999). Face stability of shallow circular tunnels driven under the water table: a numerical analysis. Int. J. Numer. Anal. methods geomechanics 23 (1), 79–95. doi:10.1002/(sici)1096-9853(199901)23:1<79::aid-nag960>3.0.co;2-t
Dong, P., Li, C. C., Wang, Z. Z., Liu, B., Liu, Q. H., and Ma, Q. R. (2022). Study on seepage stress coupling in high groundwater level shield tunnels in the second phase of Hanjiang-to-Weihe River Project. J. Water Resour. Water Eng. (04), 202209. doi:10.11705/j.issn.1672-643X.2022.04.27
Editorial Department of China Journal of Highway (2022). Review of academic research on China's transportation tunnel engineering in 2022. China J. Highw. (04), 1–40. doi:10.19721/j.cnki.1001-7372.2022.04.001
Hu, W. X. (2018). Stability analysis of water-rich tunnel face. Master's Thesis. Xiangtan, China: Hunan University of Science and Technology.
Huang, K., Yang, W. J., An, Y. L., Hu, W. X., Fu, L., and Qiu, L. (2018). Influence of water level, advance rate, and support timing on the stability of water-rich tunnels. J. Central South Univ. Sci. Technol. 49 (11), 2843–2851. doi:10.11817/j.issn.1672-7207.2018.11.026
Huang, Y., Fu, Z., Chen, J., Zhou, Z., and Wang, J. (2015). The external water pressure on a deep buried tunnel in fractured rock. Tunn. Undergr. Space Technol. 48, 58–66. doi:10.1016/j.tust.2015.02.003
Jiang, Y., Zhou, P., Zhou, F., Lin, J., Li, J., Lin, M., et al. (2022). Failure analysis and control measures for tunnel faces in water-rich sandy dolomite formations. Eng. Fail. Anal. 138, 106350. doi:10.1016/j.engfailanal.2022.106350
Kawanoue, R., Yagihashi, T., Togashi, Y., and Osada, M. (2023). Experimental study of frictional resistance influences on tunnel face stability. IOP Conf. Ser. Earth Environ. Sci. 1124 (1), 012103. doi:10.1088/1755-1315/1124/1/012103
Lan, X. X., Lv, H. T., Han, B., Li, Y., Chen, W. C., Guo, J. J., et al. (2023). Advances in the study of deterioration mechanism and instability mechanism of grotto rock masses. Earth Sci. 48 (4), 1603–1633. doi:10.3799/dqkx.2022.307
Leca, E., and Dormieux, L. (1990). Upper and lower bound solutions for the face stability of shallow circular tunnels in frictional material. Géotechnique 40 (4), 581–606. doi:10.1680/geot.1990.40.4.581
Li, Z. Y., Zhou, M. L., and Huang, H. W. (2024). Modeling the seepage-induced damage in water-rich fault zones at tunnel faces by double point material point methods. IOP Conf. Ser. Earth Environ. Sci. 1333 (1), 012005. doi:10.1088/1755-1315/1333/1/012005
Lin, B. W. (2021). Stability analysis of tunnel surrounding rock based on finite element method. Western transportation science and technology, (03), 175–178. doi:10.13282/j.cnki.wccst.2021.03.049
Ma, E. L., Zhong, Y. J., and Yu, J. (2023). Structural damage analysis of tunnel close to fault fracture zone based on fracture mechanics. Highway (08), 375–382.
Mashimo, H., and Suzuki, M. (1998). Stability conditions of tunnel face in sandy ground. Centrifuge 98, 721–725.
People's Republic of China (2021). Outline of the 14th five-year plan for national economic and social development and the long-range objectives through the year 2035. People's Dly. 001. doi:10.28655/n.cnki.nrmrb.2021.002455
Shan, C., Zhong, Y. J., Yao, C. K., and Cao, X. Y. (2019). Transverse deviation testing of the lateral pressure section of a large-span shallow buried tunnel in weak surrounding rock. Highway (08), 214–220.
Shi, Z., Xu, J., Xie, X., Zeng, H., Xu, W., Niu, G., et al. (2024). Disaster mechanism analysis for segments floating of large-diameter shield tunnel construction in the water-rich strata: a case study. Eng. Fail. Anal. 157, 107953. doi:10.1016/j.engfailanal.2023.107953
Sun, Y. Z., Yin, F. D., Ye, X., Yang, S. B., and Wang, J. C. (2024). Influence of foundation pit excavation on under-construction roads and reinforcement measures. J. Shenyang Jianzhu Univ. Nat. Sci. Ed. (01), 114–122. doi:10.11717/j.issn.2095-1922.2024.01.13
Tu, S., Li, W., Zhang, C., Wang, L., Jin, Z., and Wang, S. (2024). Seepage effect on progressive failure of shield tunnel face in granular soils by coupled continuum-discrete method. Comput. Geotechnics 166, 106009. doi:10.1016/j.compgeo.2023.106009
Wang, D. M., Zhang, Q. S., Zhang, X., Wang, K., and Tan, Y. H. (2016). Experimental study on the evolution model of sudden water and mud disaster in tunnels through fault-fractured zones. Chin. J. Geotechnical Eng. 37 (10), 2851–2860. doi:10.16285/j.rsm.2016.10.016
Wang, K. Z., Tang, Y. Q., Li, W. P., Kong, L. M., and Qin, S. K. (2016). Deformation stability analysis of deeply buried diversion tunnel under seepage-stress coupling. J. Zhejiang Univ. Technol. (02), 207–211.
Wang, L., Han, K., Xie, T., and Luo, J. (2019). Calculation of limit support pressure for EPB shield tunnel face in water-rich sand. Symmetry 11 (9), 1102. doi:10.3390/sym11091102
Wang, X. L., Cui, J. Q., Zhang, P. Q., and Zhao, X. D. (2024). Design and stability analysis of support for deep fractured roadway under static and dynamic loading conditions. Metal. Mine (07), 17–23. doi:10.19614/j.cnki.jsks.202407003
Xiao, Q., Lei, S., Cui, K., Li, W., Han, X., Liu, J., et al. (2022). Effect of the longitudinal local wetting-induced collapse on tunnel structure in loess strata. Tunn. Undergr. Space Technol. 122, 104361. doi:10.1016/j.tust.2022.104361
Zhang, J. (2021). Public mutual REITs: a new way of infrastructure financing. Macroecon. Manag. (08), 14–21. doi:10.19709/j.cnki.11-3199/f.2021.08.005
Zhang, J., Huang, L., Peng, T., Wang, H., Zhang, Y., and Guo, L. (2020). Model testing on failure mechanism of tunnel face in sandy cobble stratum. Arabian J. Sci. Eng. 45, 4077–4089. doi:10.1007/s13369-020-04385-x
Zhang, Y. S., Xue, X. C., Zhuang, H. Y., and Liu, X. Z. (2018). Research on the impact of soft soil layer on surface settlement of metro narrow and deep excavation pit. Chin. J. Undergr. Space Eng. (06), 1639–1651.
Zhao, Y. C., and Jia, X. X. (2016). Analysis of mechanical behavior of different construction methods for a soft rock tunnel. Road Mach. and Constr. Mech. 33 (9), 80–85.
Zhong, J. H., and Liao, H. (2022). Stability analysis of 3D deep tunnel face under steady seepage flow condition. KSCE J. Civ. Eng. 26 (5), 2509–2518. doi:10.1007/s12205-022-1907-2
Keywords: water-rich condition, tunnel construction, face stability, numerical simulation, MIDAS/GTS
Citation: Dun H, Chen S, Liu H, Chen C, Zhang Y and Yuan Y (2024) Numerical simulation analysis of the stability of the construction face of a super long tunnel under conditions of precipitation and abundant water. Front. Mater. 11:1461308. doi: 10.3389/fmats.2024.1461308
Received: 08 July 2024; Accepted: 15 August 2024;
Published: 30 August 2024.
Edited by:
Bing Bai, Beijing Jiaotong University, ChinaReviewed by:
Dongyong Wang, Beijing University of Civil Engineering and Architecture, ChinaYan Qin, China University of Geosciences, China
Copyright © 2024 Dun, Chen, Liu, Chen, Zhang and Yuan. This is an open-access article distributed under the terms of the Creative Commons Attribution License (CC BY). The use, distribution or reproduction in other forums is permitted, provided the original author(s) and the copyright owner(s) are credited and that the original publication in this journal is cited, in accordance with accepted academic practice. No use, distribution or reproduction is permitted which does not comply with these terms.
*Correspondence: Song Chen, Y2hlbm5zb25nZ0AxNjMuY29t; Ying Yuan, eXVhbnlpbmdzb25AaGd1LmVkdS5jbg==