- 1First Institute of Oceanography, MNR, Qingdao, China
- 2Key Laboratory of Coastal Science and Integrated Management, MNR, Qingdao, China
- 3Key Laboratory of Ministry of Education for Coastal Disaster and Protection, Hohai University, Nanjing, China
- 4Department of Petroleum Engineering, Omidiyeh Branch, Islamic Azad University, Omidiyeh, Iran
This study investigates countercurrent air-water two-phase flow in vertical pipes with inner diameters of 26 mm and 44 mm and a height of 2000 mm, under controlled conditions to eliminate heat and mass transfer. Cutting-edge techniques were employed to measure the liquid film thickness (δ) and entrainment (e) within the annular flow pattern. The methodology involved a systematic comparative analysis of experimental results against established models, identifying the most accurate methods for predicting flow behavior. Specifically, the Schubring et al. correlation was found to most accurately predict e in 26 mm pipes, while the Wallis correlation was more accurate for 44 mm pipes. Additionally, interfacial shear stress was analyzed, confirming the high precision of the δ and e parameters. This research enhances the understanding of countercurrent air-water two-phase flow by providing reliable estimation methods for different pipe diameters and emphasizes the significance of accurately determining interfacial shear stress. Key findings include the identification of the most accurate models for different pipe sizes and addressing challenges in measuring δ and e under controlled conditions. The study’s novelty lies in its comprehensive comparative analysis of existing models, leading to improved predictions of flow dynamics in vertical pipes, thereby contributing valuable insights into two-phase flow behavior in geosciences and environmental engineering.
Highlights
•The study investigates countercurrent air-water two-phase flow in vertical pipes with 26 mm and 44 mm diameters.
• Liquid film thickness and entrainment were quantified using state-of-the-art techniques under controlled experimental conditions.
• The Oliemans correlation best predicted entrainment for 26 mm pipes, while the Wallis correlation was more accurate for 44 mm pipes.
•Precise estimation of interfacial shear stress and key parameters δ (film thickness) and e (entrainment fraction) was achieved, enhancing the understanding of flow behavior.
•A comprehensive analysis was conducted to identify the most reliable methods for predicting flow behavior, significantly advancing the understanding of two-phase flow dynamics.
Introduction
Two-phase flows are frequently encountered in various types of heat transfer equipment and industries, including ventilation systems, refrigeration systems, cooling towers, countercurrent flows inside vertical pipes in nuclear reactors and coal-fired power plants, the oil and gas industry, the petrochemical sector, and oil transmission pipelines (Choubineh et al., 2017; Ghorbani et al., 2019; Sorgun et al., 2015; Tang et al., 2023). Recent studies on two-phase flows have predominantly focused on concurrent flows (Akhtar et al., 2021; Azzopardi, 1986; Taitel et al., 1980; Wang et al., 2020a; Zhao et al., 2023). Despite the complexities in analyzing flow conditions that arise from the interactions of countercurrent flows of two phases, this paper aims to address these challenges. The countercurrent air/water interaction in cooling towers serves as a prominent example in this context. In countercurrent flow regimes, turbulence increases as each phase progresses, leading to blockage of the other phase’s entrance (Huang et al., 2023; Shagiakhmetov et al., 2016; Taitel et al., 1980). Predicting flow behavior in such cases is difficult due to the existence of distinct flow regimes (Ashraf et al., 2021; Azzopardi, 1986; Jayanti et al., 1990; Li et al., 2018; Liao et al., 2020; Rajabi et al., 2022; Sawant et al., 2008). Some researchers have developed semi-analytical models for water flow (Ashraf et al., 2024; Zhang et al., 2024), gas flow (Allawi et al., 2024; Cao M. et al., 2024) and Co2-brine flow (Thanh et al., 2024; Wang et al., 2020a; Wang et al., 2020b).
The annular flow regime is one of the most prevalent types of two-phase air-water flows within pipes, characterized by a broad range of gas and liquid flow rates (Hurlburt et al., 2006; Li et al., 2019; Liao et al., 2021; Manzoor et al., 2024; Shedd and Newell, 1998). This pattern is characterized by a thin liquid layer along the walls and a gas core in the center of the flow (Ahmed and Srivastava, 2017; Cao et al., 2021; Haider et al., 2021; Hu et al., 2024a; Wang et al., 2023). Since two-phase air/water annular flow occurs frequently in nuclear, chemical, and oil industries, recognizing and identifying this pattern is essential. Hence, detecting the dominant flow regime is the initial step in analyzing two-phase flows (Fershtman et al., 2021; Hu et al., 2024b; Shen, et al., 2024; Imran et al., 2019; Joonaki et al., 2017; Mehmooda et al., 2021). Given the inherent complexities, knowledge of two-phase flow patterns heavily depends on experimental data and relevant empirical relationships. Pipe diameter plays a significant role in determining the type of two-phase flow pattern (Ashraf et al., 2020; Cao D. et al., 2024; Jo and Yoon, 2018; Peng et al., 2021; Ren et al., 2021). Various classification criteria have been proposed for categorizing pipes by size. For example, Taitel et al. (1980) provided the following Equation 1 (Taitel et al., 1980):
Where;
In 1997, Ghiaasiaan et al. presented empirical relations for flow regimes and volume fractions of two-phase flow in steep and vertical channels. Their study, conducted with air, water, milk, and paraffin in a channel with a height of 2 m and an inner diameter of 1.9 cm at various angles relative to the vertical, highlighted the influence of liquid viscosity on volume fraction and flow patterns (Ghiaasiaan et al., 1997). In 1983, Taitel and Barnea proposed a model for countercurrent horizontal pipes using pressure drop and flow patterns. They identified the probable formation of two regions: one without a regime and another with possible annular, slug, and bubble flow patterns (Taitel and Barnea, 1983). In 1994, Hasan et al. utilized the drift flux model to investigate liquid volume fractions in vertical pipes with a height of 5.5 m and a diameter of 127 mm, presenting a model capable of examining slug and bubble flow patterns in countercurrent flow (Hasan et al., 1994). In 2006, Chen et al. evaluated the effect of pipe inner diameter on different regimes using R134a refrigerant in vertical pipes with diameters ranging from 1.1 to 4.26 mm, concluding that pipe diameter significantly influences flow pattern formation (Chen et al., 2006). In 2016, Besagni et al. (2017) examined the hydrodynamic properties of a bubble column in a vertical pipe with countercurrent flow, suggesting a new correlation the water volume fraction and acknowledging the influential effect of pipe diameter on liquid volume fraction (Besagni et al., 2017). Li et al. (2023) investigated the mechanical properties of hydrate-bearing sand-well interfaces. They found that interfacial shear strength, cohesion, and dilatancy increase with higher interfacial roughness and hydrate saturation. After hydrate dissolution, these properties decrease, with the decrease being more significant at higher roughness and saturation levels. They concluded that their proposed mechanical model accurately simulates the stress-displacement relationship, aiding stability evaluations of hydrate-bearing reservoirs (Li et al., 2023). Wang et al. (2024) investigated cavitation in Venturi tubes using high-speed photography and particle image velocimetry. They found that cavitation occurs at a pressure ratio of 0.595, with increased cavitation length as the ratio decreases. The flow becomes choked at 0.280. They concluded that cavitation evolves periodically, with vortices forming and fragmenting near the wall (Wang et al., 2024).
The annular flow pattern occurs at high gas velocities and low to medium liquid velocities. In this pattern, liquid flows as a film along the pipe wall and is also drawn in the form of droplets towards the gas core. The wavy interface between the gas core and the liquid film causes the liquid droplets to be sprayed and deposited. The thickness of the liquid film and the distribution of the droplets in the gas phase further complicate the prediction problem. Under equilibrium conditions, steady entrainment (e) is achieved due to the equal rates of spraying and depositing of droplets. This parameter plays a vital role in understanding and modeling the behavior of the annular flow pattern, which is affected by various factors such as pipe size, fluid velocity, and fluid properties. Several investigations have been conducted to predict this important parameter; among these studies, the following works are noteworthy:
In 1968, Wallis: Wallis proposed a new empirical correlation by substituting dynamic liquid viscosity for gas viscosity in the Paleev and Flipovich model. The results showed improved accuracy in predicting multiphase flow behaviors, concluding that liquid viscosity plays a crucial role in flow dynamics (Wallis, 1968). In 1986, Oliemans et al. (1986): This study introduced a correlation for vertical annular flows using the Harwell Database, spanning a range of pipe diameters and surface tensions. They achieved accurate predictions for various flow regimes, concluding that the correlation effectively covers a broad range of flow types (Oliemans et al., 1986). In 1989, Ishii and Mishima (1989): Ishii and Mishima developed a correlation based on the Reynolds number of the liquid phase and Weber number of the gas phase for annular flows. Their results showed good agreement with experimental data, concluding that these numbers are critical for accurate flow predictions (Ishii and Mishima, 1989). In 2002, Pan and Hanratty (2002): Pan and Hanratty established a correlation for vertical flow in pipes, focusing on the relationship between liquid droplet velocity and gas flow. They demonstrated that their correlation is reliable across a range of flow conditions, concluding that it effectively models droplet behavior in gas (Pan and Hanratty, 2002). In 2008, Schubring et al. (2008): Schubring et al. proposed a correlation accounting for δ in two-phase flows, achieving high accuracy. They identified challenges with large-scale experimental setups and highlighted the need for research on medium-sized pipes, emphasizing the impact of slope and phase velocity (Schubring et al., 2008). This study investigates several key aspects of two-phase flow patterns, focusing on countercurrent air-water flows in vertical pipes. It examines the comparative effects of pipe diameter on the accuracy of flow pattern predictions, specifically evaluating whether smaller (26 mm) or larger (44 mm) diameters yield more reliable results. Additionally, the research assesses the performance of established empirical correlations and models, such as those by Schubring et al. and Wallis, in predicting critical parameters like steady entrainment and liquid film thickness. The impact of interfacial shear stress on the formation and stability of annular flow patterns is explored to understand its role in flow stability. Furthermore, the study analyzes how varying fluid properties, such as viscosity and surface tension, and different flow conditions influence model accuracy. Finally, it aims to identify potential improvements to existing models to enhance their predictive capabilities for two-phase flows in small-to-medium diameter pipes.
This study investigates several key aspects of two-phase flow patterns, focusing on countercurrent air-water flows in vertical pipes. It evaluates the comparative effects of pipe diameter on the accuracy of flow pattern predictions, specifically assessing whether smaller (26 mm) or larger (44 mm) diameters yield more reliable results. Additionally, the research examines the performance of established empirical correlations and models, such as those by Schubring et al. and Wallis, in predicting critical parameters like steady entrainment and liquid film thickness. The impact of interfacial shear stress on the formation and stability of annular flow patterns is explored to understand its role in flow stability. Furthermore, the study analyzes how varying fluid properties, such as viscosity and surface tension, and different flow conditions influence model accuracy. Finally, the study aims to identify potential improvements to existing models to enhance their predictive capabilities for two-phase flows in small-to-medium diameter pipes.
This research offers a novel and significant contribution to the field of two-phase flow dynamics by providing a comprehensive and detailed analysis of countercurrent air-water flow in vertical pipes, specifically focusing on two different pipe diameters (26 mm and 44 mm). Unlike previous studies, this research meticulously investigates the entrainment (e) and liquid film thickness (δ) under controlled conditions that minimize heat and mass transfer, ensuring the accuracy of the results. The study employs advanced techniques and a comparative analysis of existing models, leading to the identification of the most reliable estimation methods for different pipe diameters, particularly highlighting the superior performance of the Schubring et al. model for the 26 mm pipe and the Wallis correlation for the 44 mm pipe. By analyzing the influence of interfacial shear stress and validating the proposed models against established data, the research addresses key challenges in accurately determining flow behavior parameters. The findings underscore the importance of removing insignificant variables in predictive models, thus refining the accuracy of two-phase flow predictions. This work significantly advances the understanding of flow dynamics in vertical pipes by providing a detailed evaluation of the predictive capabilities of existing models, thereby improving the reliability of flow behavior predictions and contributing to the development of more accurate and efficient engineering applications in geoenvironmental sciences.
Methodology
Experimental vertical setups
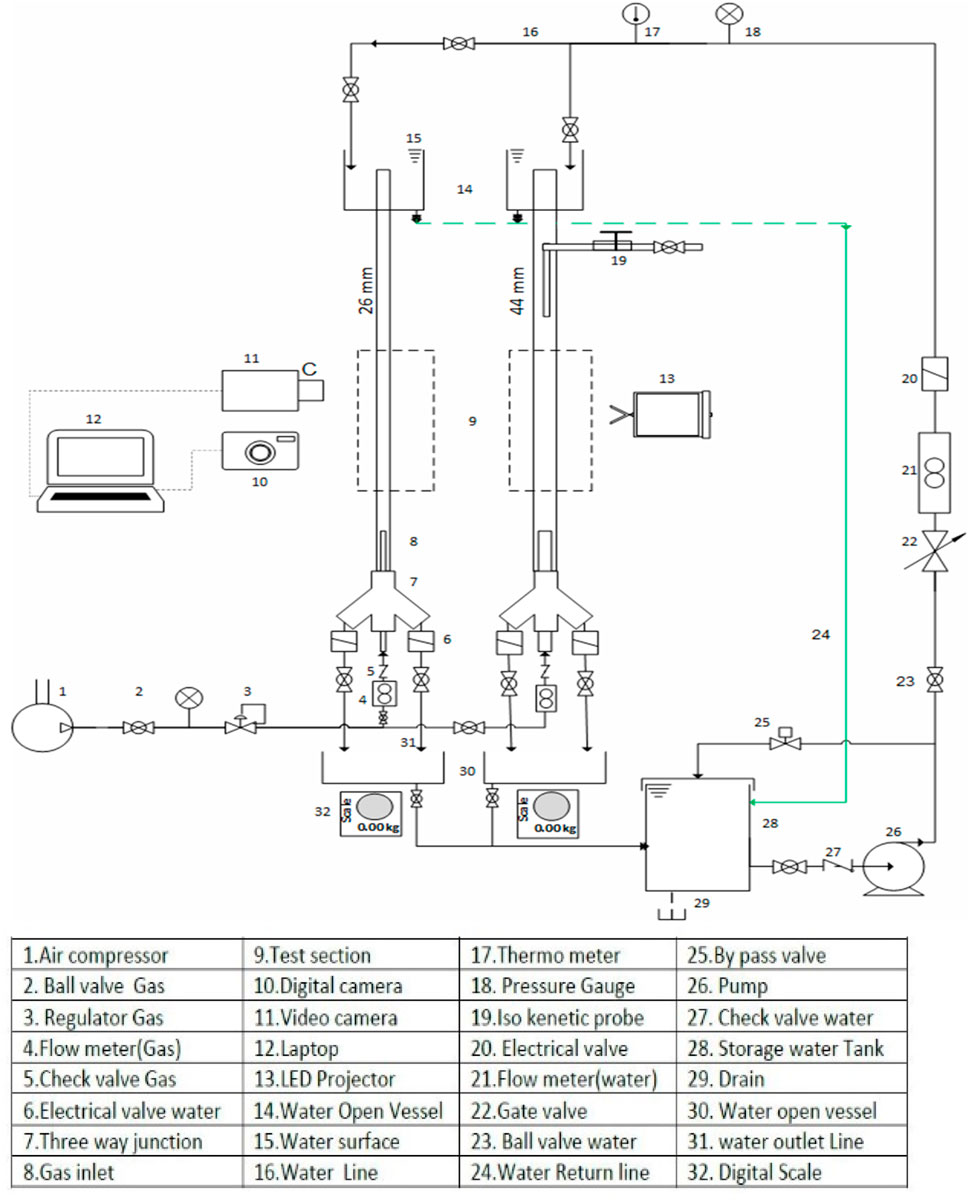
The schematics of the experimental setup, consisting of two pipes with heights of 2000 mm and inner diameters of 26 mm and 44 mm, are shown in Figure 1. For more convenient observation and analysis of two-phase flow regimes, transparent Plexiglas pipes were used. Moreover, while the scale of the experimental setup is representative of certain industrial scenarios, it may not fully reflect the complexities encountered in larger systems. In real-world applications, factors such as scale effects, material heterogeneity, and environmental conditions like temperature and pressure variations play significant roles in influencing flow dynamics. The smaller dimensions of the experimental pipes might not exhibit phenomena such as turbulence, phase separation, or pressure drops to the same extent as in full-scale systems. Therefore, while the controlled environment and specific material choices in the experiment provide clear insights into fundamental flow behaviors, further studies using materials and conditions more representative of actual geoenergy systems are necessary to fully validate and generalize these findings. Such studies would ensure that the models developed from these experiments are robust and reliable when applied to the design, operation, and optimization of industrial pipelines and energy extraction systems. Additionally, air and water were used as the working fluids. Under standard conditions, the density, dynamic viscosity, and surface tension of water were 998 kg/m³, 0.001 Pa s, and 0.073 N/m, respectively. A 7.5 kW compressor was used to supply the required compressed air flow rate. In the experiments, water and air were chosen as the liquid and gas phases.
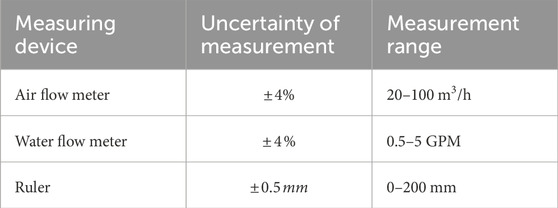
According to Figure 1, an 80-L main tank, equipped with a pump, was employed for pumping purposes. The separated water droplets from the two pipes were collected in a small tank for weighing and calculating efficiency. Excess air and liquid droplets were vented to the atmosphere at the outlet section of the pipe to reduce the back pressure of the system and increase the air flow rate. Air and water flow rates were measured through an air rotameter (model ACA 05-25 ZT) and a water rotameter (model Z-5008), both with accuracies of ±0.1 LPM, respectively, at a maximum pressure of 10 bars. In accordance with the ANSI/ASME standard (10), the maximum measurement uncertainties for the water and air flowmeters were ±4%. Under these conditions, the measurement values remained accurate under any environmental conditions. The temperature measurements were taken using thermometers with a precision of ±0.01°C and an uncertainty of 3% for air/water flows before they entered the pipe containing the two-phase flow. For pressure measurements, barometers with an accuracy of ±3 mbar and a maximum uncertainty of 1.38% were used.
The experiments consisted of two main components: 1) the rapid closure solenoid section, and 2) the isokinetic sampling section. Due to the short length of the pipe, the isokinetic sampling was not affected by the inlet, and the annular flow was fully developed in the measuring sections. To determine the structure and flow pattern of the two-phase water-air mixture at different velocities, images were captured by a Nikon D72 high-speed camera with a video recording speed of 240 f/s and a Casio camera (EX-ZR1200) with a video recording speed of 240 f/s and a resolution of 1.16 mp. The cameras were fixed at a specified height from the bottom of the pipe. The distance between the camera and pipes varied between 15–20 cm, depending on the flow conditions inside the pipe, to cover 15 cm of the pipe length. Additionally, a white light was shone on opaque white plates placed at a suitable distance behind the test pipe to diffuse the light over a wider area inside the pipe. As a result, the camera lens was focused on the flow structure, enhancing the quality of the captured images. In this setup, a one-way valve and a solenoid valve were embedded before the entrance of gas to the test pipe to largely prevent the penetration and return of water into the air path. Air and water entered the test pipe through two inlets with inner diameters of 20 mm.
Determination of flow pattern
Determining the flow pattern for countercurrent two-phase flow in vertical pipes with diameters of 26 mm and 44 mm, and evaluating the effect of pipe diameter on the flow pattern boundaries, are additional objectives of this study. The simplest procedure to develop a flow pattern map is to characterize the flow regimes by the superficial velocities of gas (usg) and liquid (usl) and to establish a relationship between them.
Determination of flow pattern for 26 mm pipe
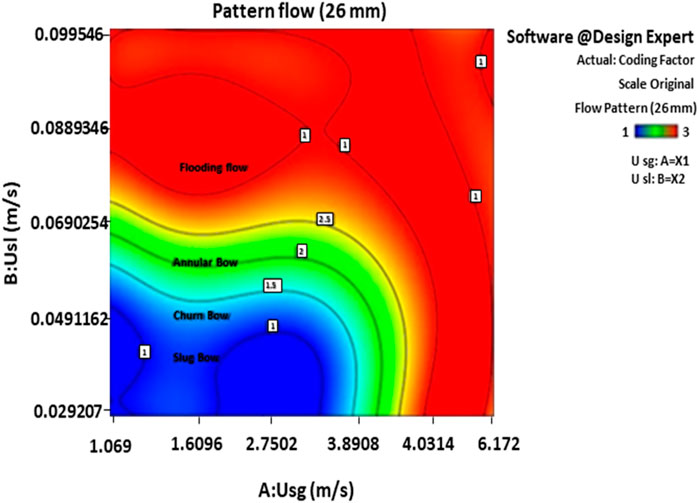
For this pipe, the ratio of length to inner diameter (L/D) was 76.92, and the experiments were conducted for 64 cases corresponding to the desired superficial velocities of water and air, in the ranges of 0.03–0.09 m/s and 1.3–5.2 m/s, respectively. No two-phase flow pattern appeared in areas with low superficial air velocity due to the air’s inability to enter, as blocked by the water column. With the gradual increase in air superficial velocity, slug, turbulent, annular, and eruptive patterns were observed. Initially, the slug regime was noted, where water containing numerous small bubbles trailing the Taylor bubble was detected. The Taylor bubble formed an umbrella-shaped dome, as shown in Figure 2A. Then, with the acceleration of the gas phase, the Taylor bubbles began to break down, and an unstable, transitional flow developed between the slug and annular flows. In this transition regime, the water was drawn upward due to air momentum, but then pulled downward again due to its higher density relative to air. The repetition of this process led to a continuous oscillating movement upward and downward (Figure 2B).
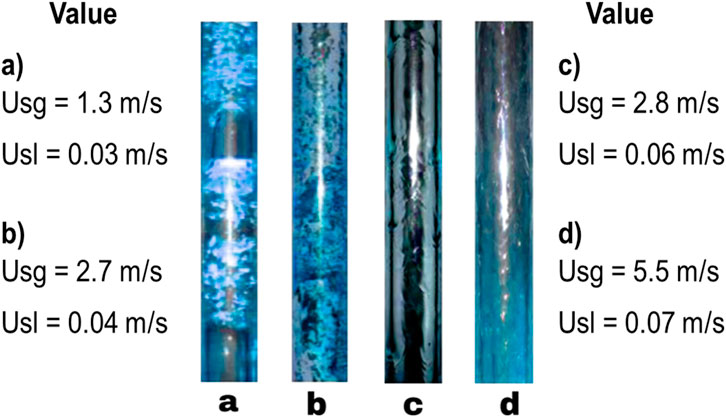
Figure 2. Observed flow patterns for the pipe with an inner diameter of 26 mm (A) slug, (B) churn, (C) annular, (D) flooding.
With a further increase in gas velocity, a combination of turbulent and annular regimes emerged, followed by a highly turbulent and oscillating flow for a period of time. After some amount of water exited the pipe, the flow pattern transitioned into an annular flow. This transition recurred as water accumulated again (with a Usg fluctuation magnitude of 5.2 m/s). The annular flow then developed in the middle of the pipe, with a layer of water around the pipe, forming the shape of an empty cylinder. The annular flow was defined as a gas core surrounded by a continuous liquid layer (Figure 2C). Eventually, in the return flow, the air velocity surpassed the water velocity, causing the air to prevent the water from flowing, which resulted in the upward movement of the water flow. As a result, the countercurrent flow transitioned into a concurrent upward flow. The observed flow patterns in the 26 mm pipe are depicted in Figure 3. In this figure, obtained from Design Expert software, codes 1, 2, and 3 represent slug, annular, and flooding flow (Figure 2D), respectively.
Flooding, which involves the upward transfer of annular waves, occurs in 26 mm pipes. This mechanism is observed in pipes with diameters of 26 mm and smaller. At low gas flow rates, the liquid film flow remains undisturbed. Shortly after the separation point, the waves return to the liquid and do not reach the upper part of the test section. The gas stream carries the waves upward for a short distance. As the gas flow increases further, the amplitude of the circular waves becomes so large that the available cross-sectional area of the gas stream is restricted. At this point, the subsequent waves are carried upward beyond the liquid inlet by the gas and may even occupy the entire tube. By maintaining a constant gas and liquid flow rate, waves are periodically formed near the liquid outlet and carried upwards by the gas from the liquid inlet. Flooding occurs at this stage. Large amounts of bubbles are present in the waves moving upwards. When flooding happens, the pressure gradient increases sharply due to the small diameter. According to this figure, the annular flow pattern was the dominant one observed in the experiments.
Determination of flow pattern in 44 mm pipe
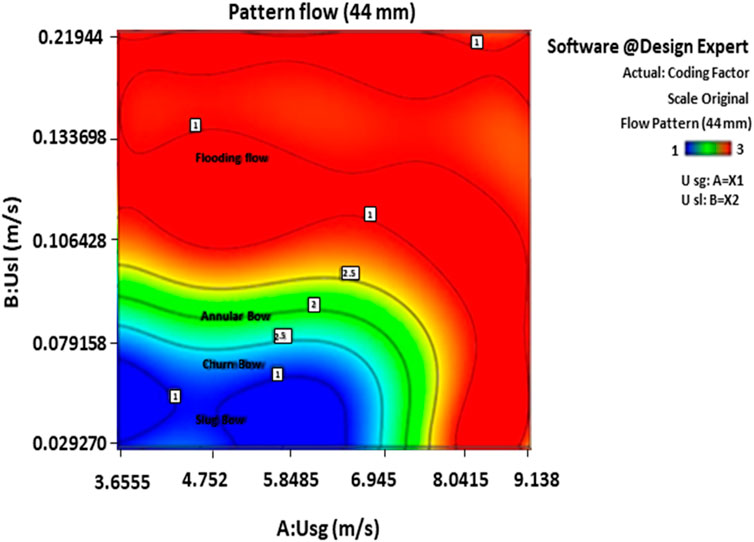
For this pipe, the ratio of length to inner diameter (L/D) was 45.45. The experiments were conducted for 64 cases, with the superficial velocities of water and air ranging from 0.01037 to 0.2075 m/s and 3.6555–9.138 m/s, respectively. The main flow patterns observed included slug-churn, annular, and reverse flow patterns. Compared to the 26 mm pipe, the length of the slug regime was slightly shorter, and the observed Taylor bubbles were relatively slower and smaller. This phenomenon was attributed to the increase in the water phase volume and the corresponding pressure (Figure 4A). Subsequently, a churn regime developed between the slug and annular regimes, covering a larger area than in the 26 mm pipe. On one hand, the faster breakdown of Taylor bubbles caused part of the slug regime in the smaller pipe to transition into churn flow. On the other hand, the increased volume of water inside the pipe reduced the air’s ability to penetrate the pipe’s center, leading to the annular regime transitioning into the churn regime (Figure 4B). Following this, a combination of churn and annular regimes was observed (Figure 4C). The flow then transformed into the annular regime due to the inability of the gas phase to displace the water, leading to the formation of a flooding flow, unlike in the 26 mm pipe. Consequently, part of the corresponding return flow in the smaller pipe transitioned into the annular regime. As previously mentioned, the extended turbulent regime delayed the onset of the annular regime (Figure 4C). Finally, the failure of the reverse flow to fully expel the water from the pipe resulted in a balance between the interaction of gas momentum and gravitational force at a cross-section of the pipe (Figure 4D). The observed flow patterns in the 44 mm pipe are illustrated in Figure 5. In this figure, generated by Design Expert software, Code 1, Code 2, and Code three represent the slug, annular, and flooding flows, respectively. Flooding, as characterized by “e,” is observed in the 44 mm pipe. This mechanism occurs in pipes with a diameter of 44 mm and larger under low liquid flow conditions. When the gas flow rate increases, small droplets form near the liquid outlet, but these droplets return to the liquid film in the same area. As the gas flow rate increases further, the number of droplets increases, and in the upper parts of the cross-section, droplets become visible above the liquid inlet to the gas outlet. They do not move upwards, but in some cases, waves are seen only in the lower half of the pipe. However, this occurrence of flooding through this mechanism is inaccurate. The dominance of the annular flow in the experiment can be inferred from this figure.
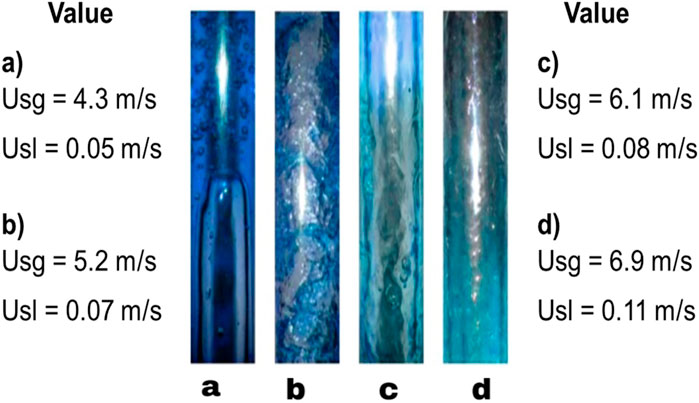
Figure 4. Observed flow patterns for the pipe with an inner diameter of 44 mm (A) slug, (B) Churn, (C) annular, (D) Flooding.
Shear stress theory in the interface of two-phase flow
In annular flow, unevenness occurs at the liquid surface, causing the annular air flow to be positioned in the middle of the pipe, surrounded by liquid. This is due to the slower velocity of the water compared to the gas, which results in some droplets separating from the liquid and moving with the gas. These separated droplets are referred to as “e” and symbolized by ‘e,’ which ranges from 0 ≤ e ≤ 1. The upper and lower limits are defined as:
If
If
This phenomenon increases the density of gas (ρ mix) relative to the pure gas density. Consider a control volume with a length of Δx, through which ṁg flows and where some liquid droplets separate and enter the gas flow. As a result, the mass flow rate of this element becomes ṁ mix (Equations 2, 3).
Where e represents entrainment, and m represents mass flow. It is worth noting that the isokinetic sampling method is used for the experimental calculation of e. Therefore, the two-phase shear stress (Equation 4) and the friction coefficient (Equation 5) of the interface can be calculated using the following relations (Equations 6–10):
Where τi represents the interfacial shear stress, influenced by pressure gradient (-dp/dz), mixture density (ρmix), gravitational acceleration (g), pipe diameter (D), and liquid film thickness (δ). The interfacial friction factor (fi) is calculated using interfacial shear stress (τi), gas density (ρg), superficial gas velocity (u(sg(m/s))), and superficial liquid velocity (u(sl(m/s))). The liquid film mass flow rate (mfl) is determined by liquid density (ρl), liquid film velocity (ufl), and liquid film cross-sectional area (Afl). Equations for ufl involve mfl, ρl, and Afl, while the liquid film cross-sectional area (Afl) is calculated using pipe diameter (D), liquid film thickness (δ), and its square (δ2). Finally, the mixture density (ρmix) is determined by gas density (ρg), entrained liquid fraction (e), liquid mass flow rate (mL), and gas mass flow rate (mg).
Results and discussion
Statistical evaluation of results obtained from software
The statistical models were evaluated by comparing the correlation coefficient, mean squared error (MSE), F-value, p-value, and ANOVA model, along with visual and graphical observations of the independent variables. The values of A, B, and AB shown in Tables 1–3 represent the superficial velocity of the gas, superficial velocity of the liquid, and the product of these two superficial velocities. Table 1 presents the results of δ and e values for the 26 mm pipe. Based on the provided p-value and F-value, the significant effect of A, B, AB, and A2 input variables on determining the thickness of the liquid film in the 26 mm pipe can be inferred. However, the B2 term (Usl2) was found to be insignificant and should be eliminated. Furthermore, A, B, AB, and B2 were significant variables in determining e for a 26 mm pipe, but the term A2 (Usg2) was insignificant and should be removed from the calculations. A more accurate estimation of the output variable can be achieved for the 26 mm pipe by eliminating insignificant variables.
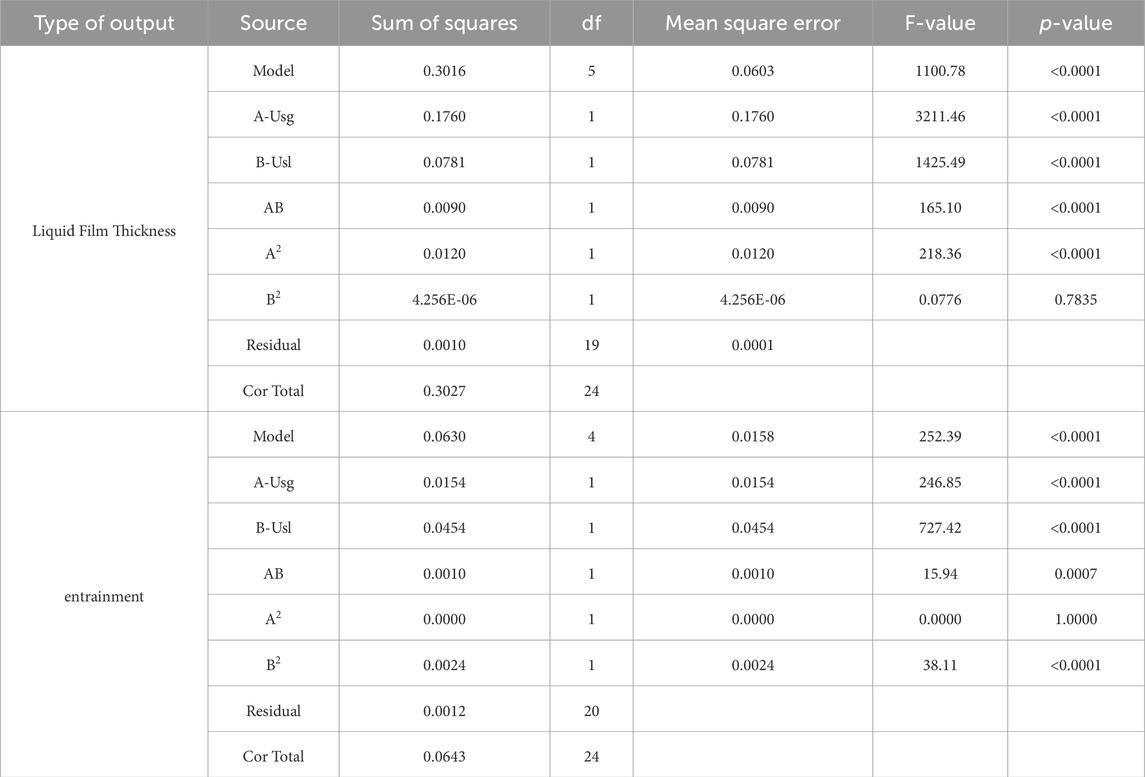
Table 1. Analysis of ANOVA model to define influential input variables in determining the δ and e for 26 mm pipe.
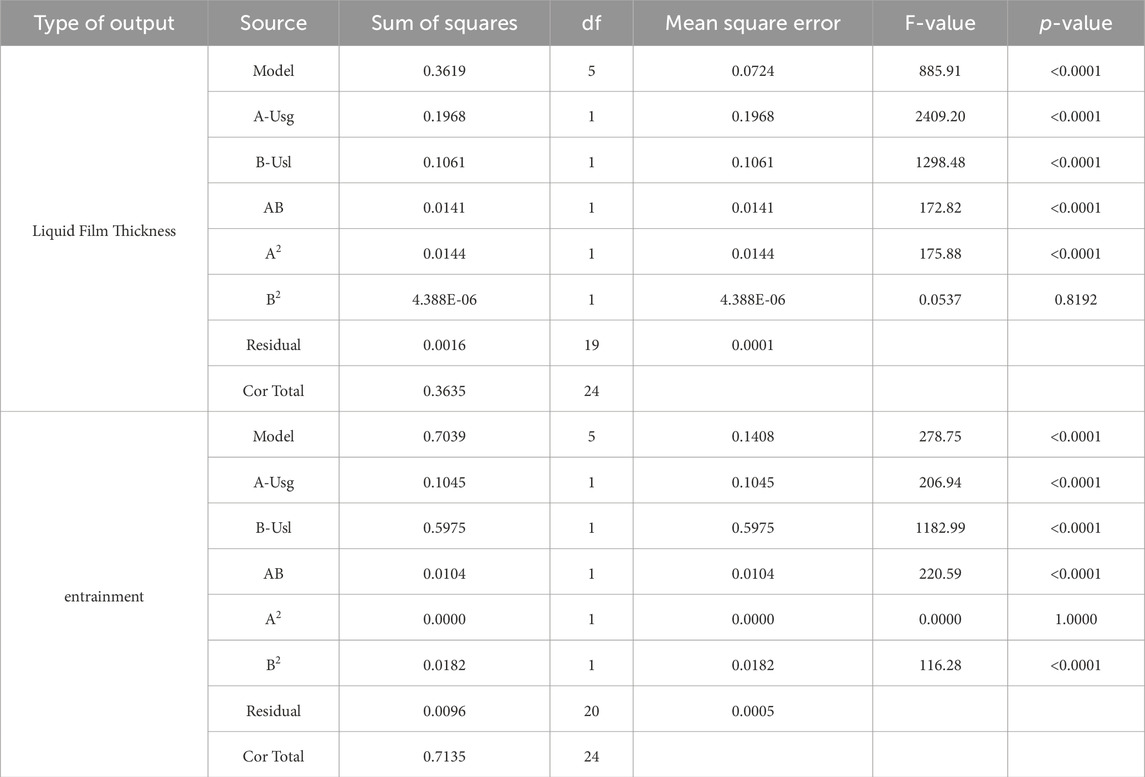
Table 2. Analysis of ANOVA model to define influential input parameters in determining the thickness of liquid film and e for 44 mm pipe.
The ANOVA analysis for the 44 mm pipe is also provided in Table 2. As can be inferred from this table, A, B, AB, and A2 variables were significant for determining the thickness of the liquid film in the 44 mm pipe, whereas B2 was insignificant. The significant variables for the determination of e in this pipe were A, B, AB, and B2, while A2 was considered insignificant.
For the parameters δ and e, the optimized values were defined by a quadratic model. The correlation coefficients for δ and e of the 26-mm pipe were 0.9966 and 0.9806, respectively. These values were 0.9957 and 0.9866 for the 44-mm pipe. Accordingly, the accuracy of the proposed models for the determination of δ and e in 26-mm and 44-mm pipes was established. The diagrams of δ versus superficial gas velocity and estimated values against real measurements for the 26-mm and 44-mm pipes are depicted in Figures 6, 8, respectively. When comparing the diagrams, the higher performance accuracy of the 26-mm pipe diagrams compared to the 44-mm pipe diagrams was noted. The corresponding diagrams for the e variable in the 26-mm and 44-mm pipes are illustrated in Figures 6A–D, respectively. By comparing the diagrams of these figures along with the experimental and engineering perspectives, the adequacy of the obtained design of experiments (DOE) correlation model for predicting δ and e was concluded.
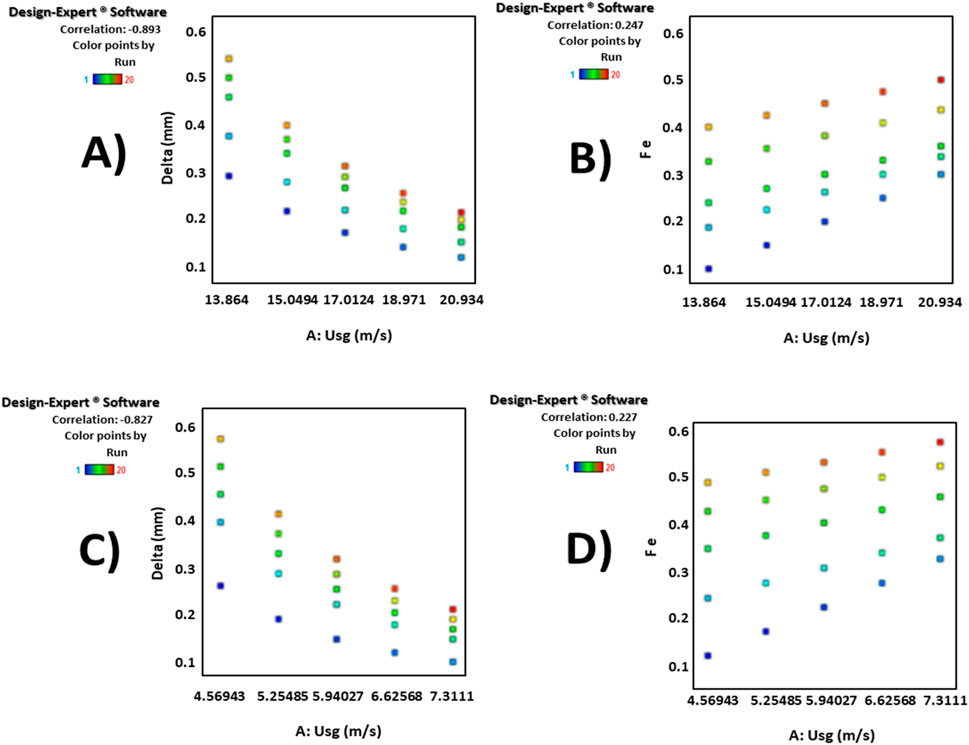
Figure 6. Diagram of (A) δ in 26 mm pipe for liquid velocity, (B) e versus superficial gas velocity in 26 mm pipe, (C) δ in 44 mm pipe liquid velocity, (B) e versus superficial gas velocity in 44 mm pipe.
For the purpose of comparing and evaluating the experimental results with empirical relations from other studies, various statistical indices were employed, including percentage error (PE), mean squared error (MSE), mean relative error (MRE), root mean squared error (RMSE), mean absolute relative error (MARE), coefficient of determination (R2), and standard deviation (STD) (Abad et al., 2022; Pan and Hanratty, 2002). The comparison of the obtained experimental data for determining the δ in 26 mm and 44 mm pipes with the results of Schubring et al. (2008) (Schubring et al., 2008) and Rahman et al. (2017) (Rahman et al., 2017) through the statistical indices is reported in Table 3. According to this table, good agreement was found in these references for the liquid film estimation in the 26 mm pipe; however, the accuracy of the Schubring et al. model was slightly higher. Conversely, the results for the 44 mm pipe revealed that the Schubring et al. results were more accurate.
The comparison between the calculated δ and the measured values is shown in Figure 7. As indicated in Table 3; Figure 7, the results from Schubring et al. demonstrate consistency with the experimental data and exhibit higher accuracy for both 26 mm and 44 mm pipes. In contrast, the model by Rahman et al. (2017) demonstrated a significant loss in precision when applied to 44 mm pipes. Consequently, it can be concluded that the Rahman et al. model is inadequate for predicting the behavior of pipes with diameters greater than 26 mm.
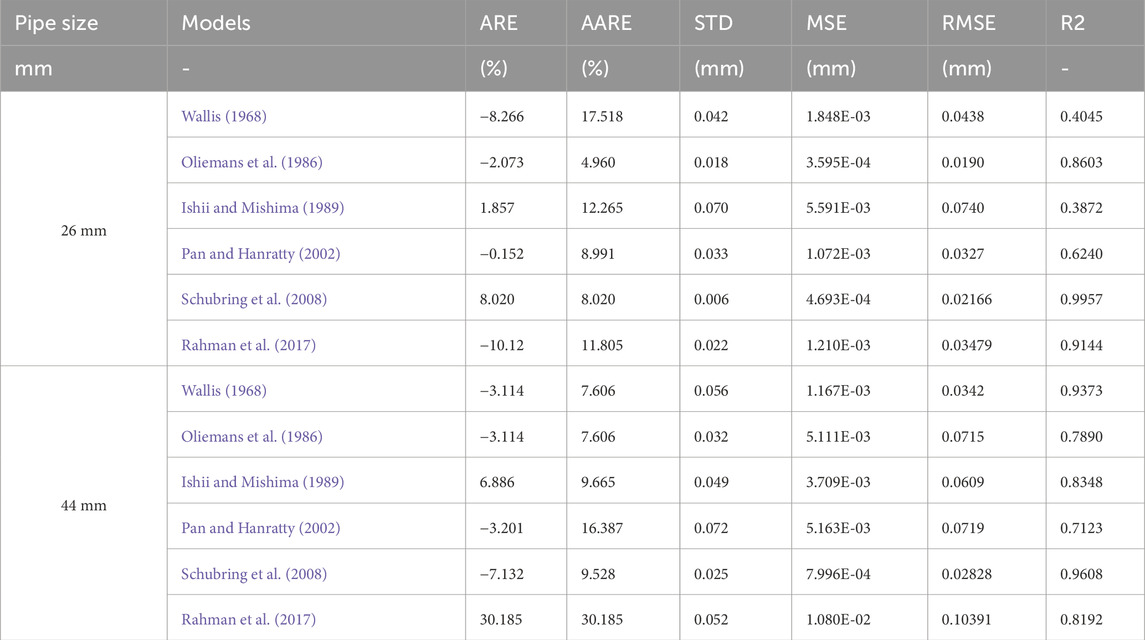
For the purpose of comparing and evaluating the prediction in 26 mm and 44 mm pipes with previous studies, the results presented in Table 4 were utilized. As observed, the highest performance accuracy for determining the in the 26 mm pipe was associated with the Oliemans et al. (1986) model, while the lowest performance accuracy was attributed to the Ishii and Mishima (1989) model. Additionally, for the 44 mm pipe, the highest and lowest performance accuracy were linked to the Wallis (1968) and Pan and Hanratty (2002) models, respectively.
Models integrate experimental data by using the data to calibrate and validate their predictions, ensuring that the theoretical assumptions and mathematical formulations accurately reflect real-world behaviors. Certain models perform better under specific conditions because they are tailored to account for the particular characteristics of those conditions, such as fluid properties, flow regimes, or pipe dimensions. For instance, a model designed to capture the nuances of liquid film thickness in small-diameter pipes may incorporate specific terms or correction factors that enhance its accuracy for that scenario, whereas it might be less precise for larger pipes where different flow dynamics dominate. The cross-plot diagrams of calculated values of e versus measured ones for 26 mm and 44 mm pipes are represented in Figures 8, 9, respectively, for comparison with the previously proposed correlations. The coefficient of determination for the models of other researchers is provided in these diagrams. Based on these diagrams along with the results in Table 4, the order of performance accuracies for the previously proposed models is as follows:
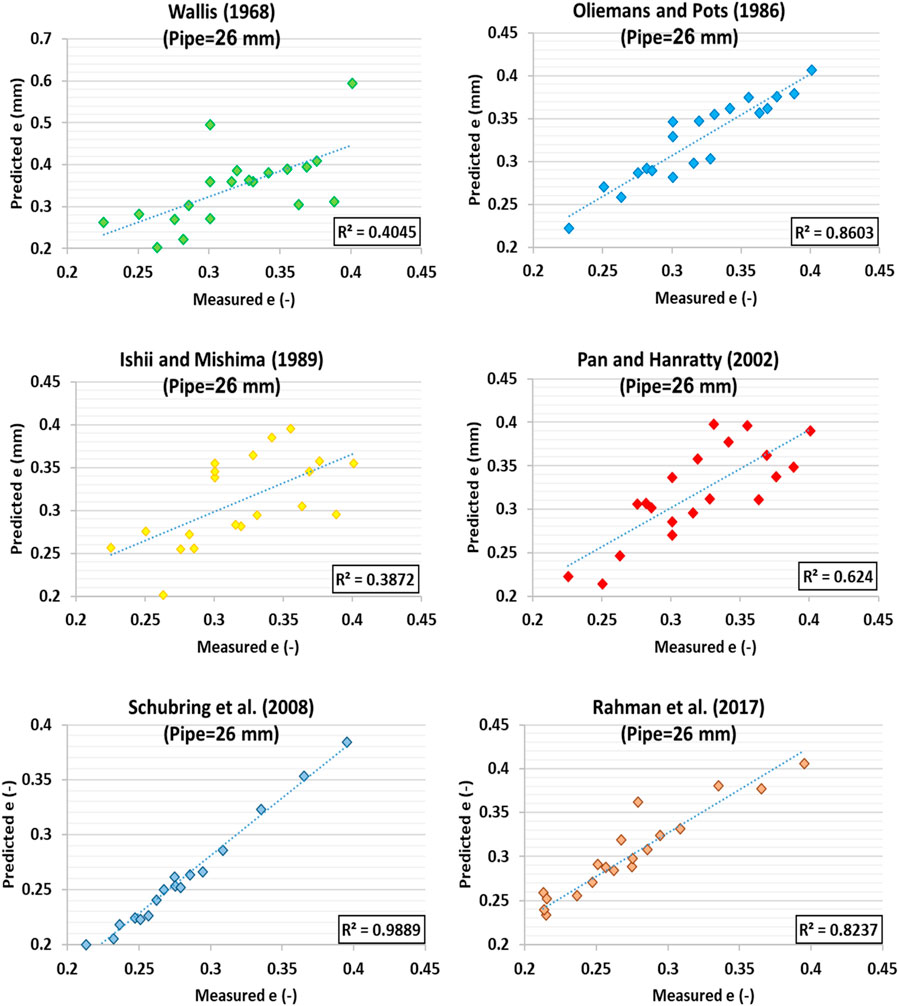
Figure 8. Cross plot diagram of calculated evalues against measured values for 26 mm pipe to evaluate the experimental results of previous models.
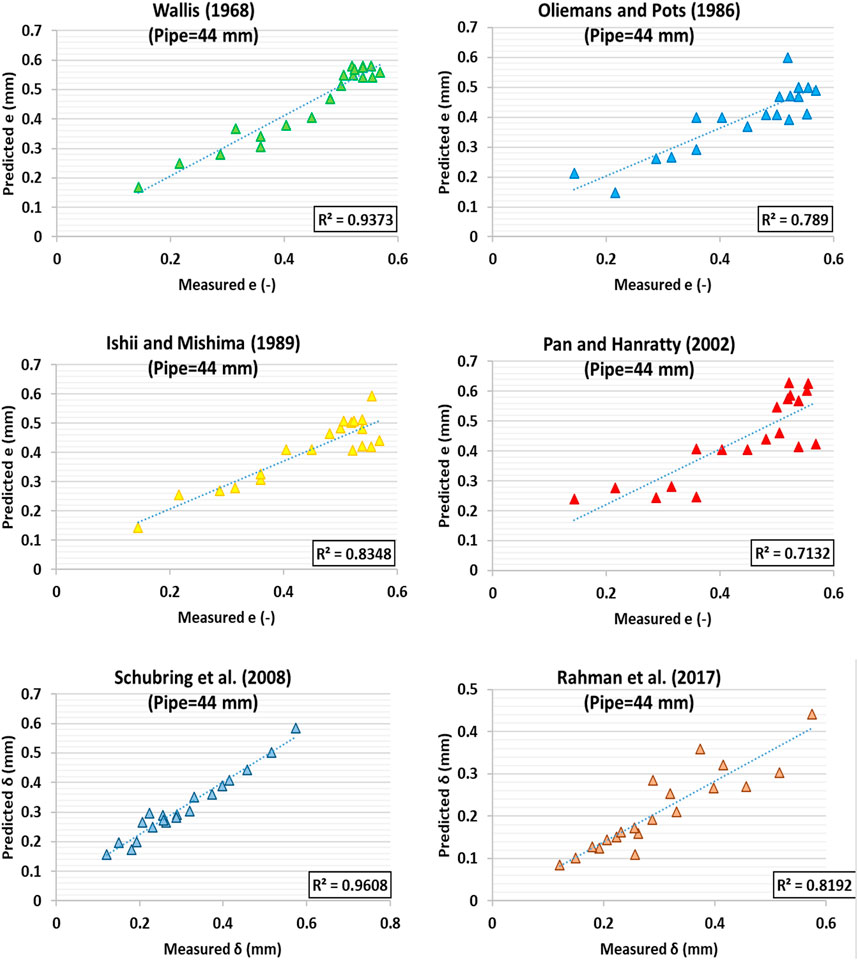
Figure 9. Cross plot diagram of calculated e values against measured values for 44 mm pipe to evaluate the experimental results of previous models.
For the 26 mm pipe: Schubring et al. (2008); Oliemans et al. (1986); Rahman et al. (2017); Pan and Hanratty (2002); Wallis (1968); Ishii and Mishima (1989).
For the 44 mm pipe: Schubring et al. (2008); Wallis (1968); Rahman et al. (2017); Ishii and Mishima (1989); Oliemans et al. (1986); Pan and Hanratty (2002).
Consequently, the inadequacy of the Ishii and Mishima (1989) model to determine the e for 26 mm pipes was inferred. The best model for this pipe size was the Oliemans et al. (1986) model. Moreover, the best model for the 44 mm pipe was the Wallis (1968) model, while the Pan and Hanratty (2002) model was unsuitable for determining the e in this size.
Validation of interfacial shear stress for experimental data
To validate the interfacial shear stress proposed in Equation 5, twenty experimental data points were utilized. Figure 10 illustrate the interfacial shear stress against superficial gas velocity for the 26 mm pipe (left side) and the 44 mm pipe (right side). Upon careful examination of these figures, lower values of interfacial shear stress were recorded for lower liquid superficial velocities, which increased with the enhancement of the liquid superficial velocity. This finding supports the experimental results of the conducted tests. As depicted in these figures, the highest interfacial shear stress value for the 26 mm pipe was associated with a liquid superficial velocity of 0.0747 m/s, while it was equal to 0.0498 m/s for the 44 mm pipe.
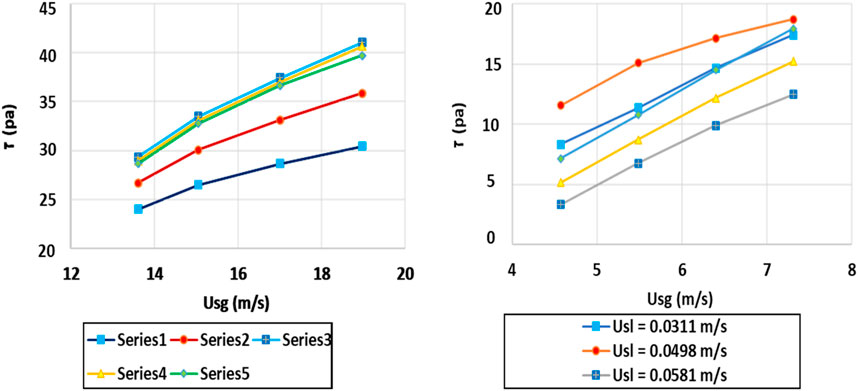
Figure 10. Interfacial shear stress in terms of superficial gas velocity for different liquid velocities in 26 mm pipe (left side) and 44 mm pipe (right side).
Measure the liquid film thickness
In this article, the height of the liquid surface is measured using graduated rulers. The rulers are placed in several positions in the test section of the pipe and are arranged along a vertical path across the entire width of the pipe section. The rulers are transparent, ensuring that there is no visual disturbance during the filming and imaging of the two-phase flow. Accurate calculation of liquid height is one of the most important parameters in measuring interface shear stress. Research indicates that when the apparent velocity of the gas is high, the value of hL decreases; conversely, when the apparent velocity of the gas is low, the value of hL increases.
Uncertainty, limitations and its calculation
All major factors affecting measurement accuracy should be considered, along with correction steps to minimize measurement uncertainty. When the accuracy of the measuring equipment is known for each parameter (e.g., pipe diameter, pressure difference, temperature), the uncertainty of measuring the flow rate associated with each parameter can be predicted. This prediction method is based on the theoretical relationship of each parameter with fluid flow. Numerous standards are available for evaluating and estimating the contribution of measurement uncertainty for each measurement parameter (Ansi/Asme, 1986).
Uncertainty means the possible estimate of the error. Since we do not always have the exact amount of the error, we report the error with uncertainty. The reasons for this include: variations due to repeated measurements, undetectable fluctuations in environmental conditions such as temperature, misalignment of connections, wear in components, reading errors, and small changes in the position of the measuring device.
The main purpose of a measurement is to determine the value of a specific quantity. Due to the errors created during the measurement process, the exact value cannot be determined, and only an estimate can be obtained. This estimate is complete when accompanied by a statement of uncertainty. The apparent velocities of water and air phases are obtained from Equation 11 (Holman, 2012).
Where, Q is the flow rate of the phases, usl is the apparent velocity of the air and water, and d is the inner diameter of the test pipe. The uncertainty of the apparent velocities of the air and water in all three tubes and at all test points is obtained using Equation (12) (Holman, 2012).
Where,
Tables 6, 7 respectively show the average uncertainties of air and water apparent velocities in the rectangular channel. The percent error is calculated based on the comparison of these values with the corresponding average apparent velocities. These tables indicate that the results show a low percentage of test uncertainties, demonstrating the high accuracy of the measuring equipment.
Despite the significant advancements in understanding countercurrent air-water two-phase flow in vertical pipes, several inherent limitations remain in this study. One primary limitation is the controlled nature of the experimental conditions, which does not account for real-world environmental variables, such as temperature variations and fluid impurities, that could affect flow dynamics and interfacial shear stress. Additionally, the study examines only two specific pipe diameters (26 mm and 44 mm), which may limit the generalizability of the findings to pipes of other sizes. The reliance on existing models and correlations, while validated through comparative analysis, may still introduce biases or inaccuracies if these models fail to fully capture the complex interactions across all flow regimes. Furthermore, the experimental setup’s restriction against heat and mass transfer may not accurately reflect practical scenarios where such transfers are unavoidable. Finally, the statistical evaluation, although robust, inherently assumes that the selected models and tested conditions are comprehensive, which may not always hold true, thus potentially limiting the applicability of the results to a broader range of operational conditions and pipe configurations.
The criterion for the number of test repetitions
Performing repeated tests is one way to increase the accuracy of test results. The confidence level is a parameter that can be used to control the number of repetitions of experiments to achieve the desired accuracy. Given that one of the goals of this research is to classify and present flow patterns, a 95% confidence level is the optimal value to achieve the objectives of this research. This level of confidence can be obtained using Equation 13 (Holman, 2012).
Where, n is the number of experiments, t is a value corresponding to the desired confidence level, and based on n = 3 and a 95% confidence level, it is equal to 4.303. a is the uncertainty resulting from the repetition of experiments. By replacing the values ω from Tables 6, 7, the uncertainty caused by repeating the experiment three times for the apparent velocities of air and water is presented in Table 8.
The role of interfacial shear stress in geoenergy
Interfacial shear stress is a critical parameter in two-phase flow systems because it governs the interaction between different fluid phases, such as liquid and gas, within pipelines, geothermal wells, and CO₂ sequestration sites. Accurate determination of interfacial shear stress is essential because it influences the distribution of phases, the stability of flow regimes, and the efficiency of heat and mass transfer. Inaccurate estimations can lead to issues such as excessive pressure drops, uneven phase distribution, and potential flow blockages, which compromise the performance and safety of geoenergy systems. For example, in oil and gas pipelines, incorrect shear stress predictions can result in pipeline erosion or failure, while in geothermal systems, they can lead to inefficient energy extraction and increased operational costs. Thus, precise modeling of interfacial shear stress is crucial for optimizing the design, operation, and safety of geoenergy infrastructure. Furthermore, the physical significance of these results lies in their implications for accurately modeling two-phase flow systems, which are critical in various geoenergy applications. The accuracy of the liquid film thickness and entrainment models directly impacts the reliability of predictions related to fluid dynamics within pipelines, geothermal wells, and CO₂ sequestration sites. In real-world systems, incorrect predictions of liquid film behavior can lead to suboptimal design and operation, such as insufficient cooling in geothermal extraction, increased risk of pipeline corrosion due to uneven liquid distribution, or inefficient CO₂ trapping in sequestration projects. Therefore, understanding the limitations and accuracy of these models is crucial for optimizing the performance, safety, and longevity of geoenergy systems.
Conclusion
Determining the key parameters of two-phase countercurrent liquid/gas flow in vertical pipes made of transparent Plexiglas for medium and small-sized pipes is fundamental for mechanical engineers. Hence, this paper aimed to define the influential parameters of two-phase flow, including entrainment (e), liquid film thickness (δ), and interfacial shear stress, and propose the corresponding experimental models. The main findings of this paper were as follows.
• Examining the ANOVA model for e in 26 mm and 44 mm pipes revealed the insignificance of the A2 parameter (square power of Usg). This variable should be eliminated from the calculations and presented models for better predictions.
•Examining the ANOVA model for δ in 26 mm and 44 mm pipes disclosed the insignificance of the B2 parameter (square power of Usl), which should be eliminated from calculations and presented models.
•The correlation coefficients of δ and e for the 26 mm pipe were 0.9966 and 0.9806, respectively. The respective values for the 44 mm pipe were equal to 0.9957 and 0.9866. These results express the high accuracy of the proposed models for determining the δ and e in 26 mm and 44 mm pipes.
• Comparison of the experimental data for the determination of δ in 24 mm and 44 mm pipes with the results of Schubring et al. (2008) and Rahman et al. (2017) revealed the closeness of the results of the two references for the 26 mm pipe. However, the accuracy of the Schubring et al. model was slightly higher. For the 44 mm pipe, the Schubring et al. model provided better performance and offered more acceptable results.
• According to the presented results for determining the e in the 26 mm pipe, the best model with the highest performance accuracy was the model of Schubring et al. (2008), while the lowest performance accuracy was attributed to the Ishii and Mishima (1989) model. Additionally, for the 44 mm pipe, the models with the highest and lowest performance accuracies in the determination of e were associated with the Schubring et al. (2008) and Pan and Hanratty (2002) models, respectively.
• The related results to the flow patterns showed the dominance of the annular flow pattern in 26 mm and 44 mm pipes.
•The high validity of the prediction correlations for δ and e models was inferred from the results of interfacial shear stress diagrams for experimental data. Furthermore, the highest interfacial shear stress for the 26 mm pipe was related to the superficial liquid velocity of 0.0747 m/s, while this value was equal to 0.0498 m/s for the 44 mm pipe.
Data availability statement
The raw data supporting the conclusions of this article will be made available by the authors, without undue reservation.
Author contributions
YW: Conceptualization, Formal Analysis, Resources, Software, Writing–original draft, Writing–review and editing. FL: Conceptualization, Data curation, Formal Analysis, Funding acquisition, Validation, Writing–original draft, Writing–review and editing. ZZ: Investigation, Methodology, Resources, Writing–original draft, Writing–review and editing. RL: Data curation, Investigation, Methodology, Validation, Visualization, Writing–original draft, Writing–review and editing. MS: Conceptualization, Formal Analysis, Investigation, Resources, Software, Visualization, Writing–original draft, Writing–review and editing.
Funding
The author(s) declare that financial support was received for the research, authorship, and/or publication of this article. The research was founded within the project No. 2022YFC3106100, The National Basic Research Program of China, “Key technologies for typical sandy coast erosion protection and active coastal construction”; Nos JSZRHYKJ202303 and JSZRHYKJ202105, Marine Science and Technology Innovation Project of Jiangsu Province.
Conflict of interest
The authors declare that the research was conducted in the absence of any commercial or financial relationships that could be construed as a potential conflict of interest.
Publisher’s note
All claims expressed in this article are solely those of the authors and do not necessarily represent those of their affiliated organizations, or those of the publisher, the editors and the reviewers. Any product that may be evaluated in this article, or claim that may be made by its manufacturer, is not guaranteed or endorsed by the publisher.
References
Abad, A. R. B., Ghorbani, H., Mohamadian, N., Davoodi, S., Mehrad, M., Aghdam, S. K.-y., et al. (2022). Robust hybrid machine learning algorithms for gas flow rates prediction through wellhead chokes in gas condensate fields. Fuel 308, 121872. doi:10.1016/j.fuel.2021.121872
Ahmed, T., and Srivastava, A. (2017). Understanding and evaluating the behavior of technical users. A study of developer interaction at StackOverflow. Human-centric Comput. Inf. Sci. 7, 8–18. doi:10.1186/s13673-017-0091-8
Akhtar, M. M., Mohammad, A. D., Ehsan, M., Akhtar, R., and Manzoor, Z. (2021). Water resources of Balochistan, Pakistan—a review. Arabian J. Geosciences 14 (4), 1–16. doi:10.1007/s12517-021-06502-y
Allawi, R. H., Al-Mudhafar, W. J., and Thanh, H. V. (2024). Developing A semi-analytical model for estimating mechanical properties of sandstone reservoirs: enhancing applications in hydrocarbon production and underground gas storage. Geoenergy Sci. Eng. 240, 213014. doi:10.1016/j.geoen.2024.213014
Ashraf, U., Anees, A., Zhang, H., Ali, M., Thanh, H. V., and Yuan, Y. (2024). Identifying payable cluster distributions for improved reservoir characterization: a robust unsupervised ML strategy for rock typing of depositional facies in heterogeneous rocks. Geomechanics Geophys. Geo-Energy Geo-Resources 10 (1), 131–222. doi:10.1007/s40948-024-00848-9
Ashraf, U., Zhang, H., Anees, A., Mangi, H. N., Ali, M., Zhang, X., et al. (2021). A core logging, machine learning and geostatistical modeling interactive approach for subsurface imaging of lenticular geobodies in a clastic depositional system, SE Pakistan. Nat. Resour. Res. 30 (3), 2807–2830. doi:10.1007/s11053-021-09849-x
Ashraf, U., Zhang, H., Anees, A., Nasir Mangi, H., Ali, M., Ullah, Z., et al. (2020). Application of unconventional seismic attributes and unsupervised machine learning for the identification of fault and fracture network. Appl. Sci. 10 (11), 3864. doi:10.3390/app10113864
Azzopardi, B. J. (1986). Disturbance wave frequencies, velocities and spacing in vertical annular two-phase flow. Nucl. Eng. Des. 92 (2), 121–133. doi:10.1016/0029-5493(86)90240-2
Besagni, G., Inzoli, F., De Guido, G., and Pellegrini, L. A. (2017). Gas holdup and flow regime transition in spider-sparger bubble column: effect of liquid phase properties. J. Phys. Conf. Ser. 796, 012041. doi:10.1088/1742-6596/796/1/012041
Cao, D., Gu, N., Wu, M., and Wang, J. (2024a). Cost-effective task partial offloading and resource allocation for multi-vehicle and multi-MEC on B5G/6G edge networks. Ad Hoc Netw. 156, 103438. doi:10.1016/j.adhoc.2024.103438
Cao, D., Zeng, K., Wang, J., Sharma, P. K., Ma, X., Liu, Y., et al. (2021). BERT-based deep spatial-temporal network for taxi demand prediction. IEEE Trans. Intelligent Transp. Syst. 23 (7), 9442–9454. doi:10.1109/tits.2021.3122114
Cao, M., Dai, Z., Jia, S., Samper, J., Ling, H., Du, Z., et al. (2024b). Identification of solute transport parameters in fractured granites with heterogeneous apertures. J. Hydrology 633, 130938. doi:10.1016/j.jhydrol.2024.130938
Chen, L., Tian, Y. S., and Karayiannis, T. G. (2006). The effect of tube diameter on vertical two-phase flow regimes in small tubes. Int. J. Heat Mass Transf. 49 (21-22), 4220–4230. doi:10.1016/j.ijheatmasstransfer.2006.03.025
Choubineh, A., Ghorbani, H., Wood, D. A., Moosavi, S. R., Khalafi, E., and Sadatshojaei, E. (2017). Improved predictions of wellhead choke liquid critical-flow rates: modelling based on hybrid neural network training learning based optimization. Fuel 207, 547–560. doi:10.1016/j.fuel.2017.06.131
Fershtman, A., Barnea, D., and Shemer, L. (2021). Wave identification in upward annular flow-a focus on ripple characterization. Int. J. Multiph. flow 137, 103560. doi:10.1016/j.ijmultiphaseflow.2021.103560
Ghiaasiaan, S. M., Wu, X., Sadowski, D. L., and Abdel-Khalik, S. I. (1997). Hydrodynamic characteristics of counter-current two-phase flow in vertical and inclined channels: effects of liquid properties. Int. J. Multiph. flow 23 (6), 1063–1083. doi:10.1016/S0301-9322(97)00027-X
Ghorbani, H., Wood, D. A., Moghadasi, J., Choubineh, A., Abdizadeh, P., and Mohamadian, N. (2019). Predicting liquid flow-rate performance through wellhead chokes with genetic and solver optimizers: an oil field case study. J. Petroleum Explor. Prod. Technol. 9 (2), 1355–1373. doi:10.1007/s13202-018-0532-6
Haider, G., Othayq, M., Zhang, J., Vieira, R. E., and Shirazi, S. A. (2021). Effect of particle size on erosion measurements and predictions in annular flow for an elbow. Wear 476, 203579. doi:10.1016/j.wear.2020.203579
Hasan, A. R., Kabir, C. S., and Srinivasan, S. (1994). Countercurrent bubble and slug flows in a vertical system. Chem. Eng. Sci. 49 (16), 2567–2574. doi:10.1016/0009-2509(94)e0084-4
Hu, J., He, Y., Luo, W., Huang, J., and Wang, J. (2024a). Enhancing load balancing with in-network recirculation to prevent packet reordering in lossless data centers. IEEE/ACM Transactions on Networking.
Hu, J., Shen, H., Liu, X., and Wang, J. (2024b). RDMA transports in datacenter networks: survey. IEEE Netw., 1. doi:10.1109/mnet.2024.3397781
Huang, Y.-C., Yang, Q., Huang, Y.-C., and Pan, J.-S. (2023). Optimization of water distribution network design using rafflesia optimization algorithm based on opposition-based learning. J. Internet Technol. 24 (5), 1079–1087. doi:10.53106/160792642023092405006
Hurlburt, E. T., Fore, L. B., and Bauer, R. C. (2006). A two zone interfacial shear stress and liquid film velocity model for vertical annular two-phase flow, 677, 684. doi:10.1115/fedsm2006-98512
Imran, M., Durad, M. H., Khan, F. A., and Derhab, A. (2019). Reducing the effects of DoS attacks in software defined networks using parallel flow installation. Human-centric Comput. Inf. Sci. 9, 16–19. doi:10.1186/s13673-019-0176-7
Ishii, M., and Mishima, K. (1989). Droplet entrainment correlation in annular two-phase flow. Int. J. Heat Mass Transf. 32 (10), 1835–1846. doi:10.1016/0017-9310(89)90155-5
Jayanti, S., Hewitt, G. F., and White, S. P. (1990). Time-dependent behaviour of the liquid film in horizontal annular flow. Int. J. Multiph. flow 16 (6), 1097–1116. doi:10.1016/0301-9322(90)90108-U
Jo, H., and Yoon, Y. I. (2018). Intelligent smart home energy efficiency model using artificial TensorFlow engine. Human-centric Comput. Inf. Sci. 8, 9–18. doi:10.1186/s13673-018-0132-y
Joonaki, E., Youzband, A. H., Burgass, R., and Tohidi, B. (2017). Effect of water chemistry on asphaltene stabilised water in oil emulsions-A new search for low salinity water injection mechanism.
Li, J., Zhang, Y., Lin, L., and Zhou, Y. (2023). Study on the shear mechanics of gas hydrate-bearing sand-well interface with different roughness and dissociation. Bull. Eng. Geol. Environ. 82 (11), 404. doi:10.1007/s10064-023-03432-9
Li, W., Chen, Z., Gao, X., Liu, W., and Wang, J. (2018). Multimodel framework for indoor localization under mobile edge computing environment. IEEE Internet Things J. 6 (3), 4844–4853. doi:10.1109/jiot.2018.2872133
Li, W., Xu, H., Li, H., Yang, Y., Sharma, P. K., Wang, J., et al. (2019). Complexity and algorithms for superposed data uploading problem in networks with smart devices. IEEE Internet Things J. 7 (7), 5882–5891. doi:10.1109/jiot.2019.2949352
Liao, Z., Pang, X., Zhang, J., Xiong, B., and Wang, J. (2021). Blockchain on security and forensics management in edge computing for IoT: a comprehensive survey. IEEE Trans. Netw. Serv. Manag. 19 (2), 1159–1175. doi:10.1109/tnsm.2021.3122147
Liao, Z., Peng, J., Huang, J., Wang, J., Wang, J., Sharma, P. K., et al. (2020). Distributed probabilistic offloading in edge computing for 6G-enabled massive Internet of Things. IEEE Internet Things J. 8 (7), 5298–5308. doi:10.1109/jiot.2020.3033298
Manzoor, Z., Ehsan, M., Khan, M. B., Manzoor, A., Akhter, M. M., Sohail, M. T., et al. (2024). Floods and flood management and its socio-economic impact on Pakistan: a review of the empirical literature. Front. Environ. Sci. 2480.
Mehmooda, A., Qadirb, A., Ehsana, M., Alic, A., Razad, D., and Aziza, H. (2021). Hydrogeological studies and evaluation of surface and groundwater quality of Khyber Pakhtunkhwa. Pakistan.
Oliemans, R. V. A., Pots, B. F. M., and Trompe, N. (1986). Modelling of annular dispersed two-phase flow in vertical pipes. Int. J. Multiph. flow 12 (5), 711–732. doi:10.1016/0301-9322(86)90047-9
Pan, L., and Hanratty, T. J. (2002). Correlation of entrainment for annular flow in vertical pipes. Int. J. Multiph. flow 28 (3), 363–384. doi:10.1016/S0301-9322(01)00073-8
Peng, W., Cao, X., Hou, J., Ma, L., Wang, P., and Miao, Y. (2021). Numerical prediction of solid particle erosion under upward multiphase annular flow in vertical pipe bends. Int. J. Press. Vessels Pip. 192, 104427. doi:10.1016/j.ijpvp.2021.104427
Rahman, M., Stevens, J., Pardy, J., and Wheeler, D. (2017). An improved film thickness model for annular flow pressure gradient estimation in vertical gas wells. J. Pet. Environ. Biotechnol. 8 (1).
Rajabi, M., Hazbeh, O., Davoodi, S., Wood, D. A., Tehrani, P. S., Ghorbani, H., et al. (2022). Predicting shear wave velocity from conventional well logs with deep and hybrid machine learning algorithms. J. Petroleum Explor. Prod. Technol. 13, 19–42. doi:10.1007/s13202-022-01531-z
Ren, Y., Zhu, F., Wang, J., Sharma, P. K., and Ghosh, U. (2021). Novel vote scheme for decision-making feedback based on blockchain in internet of vehicles. IEEE Trans. Intelligent Transp. Syst. 23 (2), 1639–1648. doi:10.1109/tits.2021.3100103
Sawant, P., Ishii, M., Hazuku, T., Takamasa, T., and Mori, M. (2008). Properties of disturbance waves in vertical annular two-phase flow. Nucl. Eng. Des. 238 (12), 3528–3541. doi:10.1016/j.nucengdes.2008.06.013
Schubring, D., Ashwood, A. C., Hurlburt, E. T., and Shedd, T. A. (2008). Optical measurement of base film thickness in annular two-phase flow, 665, 672. doi:10.1115/fedsm2008-55184
Shagiakhmetov, A. M., Tananykhin, D. S., Martyushev, D. A., and Lekomtsev, A. V. (2016). Investigation of the temperature influence on the gelation and the strength of water-shutoff composition based on carboxymethyl cellulose (Russian). Neft. khozyaystvo-Oil Ind. 2016 (07), 96–99.
Shedd, T. A., and Newell, T. A. (1998). Automated optical liquid film thickness measurement method. Rev. Sci. Instrum. 69 (12), 4205–4213. doi:10.1063/1.1149232
Sorgun, M., Murat Ozbayoglu, A., and Evren Ozbayoglu, M. (2015). Support vector regression and computational fluid dynamics modeling of Newtonian and Non-Newtonian fluids in annulus with pipe rotation. J. Energy Resour. Technol. 137 (3). doi:10.1115/1.4028694
Taitel, Y., and Barnea, D. (1983). Counter current gas-liquid vertical flow, model for flow pattern and pressure drop. Int. J. Multiph. Flow. 9 (6), 637–647. doi:10.1016/0301-9322(83)90113-1
Taitel, Y., Bornea, D., and Dukler, A. E. (1980). Modelling flow pattern transitions for steady upward gas-liquid flow in vertical tubes. AIChE J. 26 (3), 345–354. doi:10.1002/aic.690260304
Tang, Y., Liu, W., Singh, S., Alfarraj, O., and Tolba, A. (2023). Passenger flow forecast for low carbon urban transport based on Bi-level programming model. J. Internet Technol. 24 (5), 1067–1077. doi:10.53106/160792642023092405005
Thanh, H. V., Zhang, H., Rahimi, M., Ashraf, U., Migdady, H., Daoud, M. S., et al. (2024). Enhancing carbon sequestration: innovative models for wettability dynamics in CO2-brine-mineral systems. J. Environ. Chem. Eng. 12 (5), 113435. doi:10.1016/j.jece.2024.113435
Wallis, G. B. (1968). Phenomena of liquid transfer in two-phase dispersed annular flow. Int. J. Heat Mass Transf. 11 (4), 783–785. doi:10.1016/0017-9310(68)90081-1
Wang, J., Jin, C., Tang, Q., Xiong, N. N., and Srivastava, G. (2020a). Intelligent ubiquitous network accessibility for wireless-powered MEC in UAV-assisted B5G. IEEE Trans. Netw. Sci. Eng. 8 (4), 2801–2813. doi:10.1109/tnse.2020.3029048
Wang, J., Liu, Y., Rao, S., Zhou, X., and Hu, J. (2023). A novel self-adaptive multi-strategy artificial bee colony algorithm for coverage optimization in wireless sensor networks. Ad Hoc Netw. 150, 103284. doi:10.1016/j.adhoc.2023.103284
Wang, J., Zou, Y., Lei, P., Sherratt, R. S., and Wang, L. (2020b). Research on recurrent neural network based crack opening prediction of concrete dam. J. Internet Technol. 21 (4), 1161–1169.
Wang, Z., Zhao, Q., Yang, Z., Liang, R., and Li, Z. (2024). High-speed photography and particle image velocimetry of cavitation in a Venturi tube. Phys. Fluids 36 (4). doi:10.1063/5.0203411
Zhang, T., Wang, B.-R., Zhao, Y.-L., Zhang, L.-H., Qiao, X.-Y., Zhang, L., et al. (2024). Inter-layer interference for multi-layered tight gas reservoir in the absence and presence of movable water. Petroleum Sci. 21, 1751–1764. doi:10.1016/j.petsci.2024.01.009
Zhao, C., Liao, L. X., Chao, H.-C., Lai, R. X., and Zhang, M. (2023). Flow table overflow attacks in software defined networks: a survey. J. Internet Technol. 24 (7), 1391–1401. doi:10.53106/160792642023122407001
Nomenclature
Afl liquid film cross-sectional area
ufl liquid film velocity
mfl liquid film mass flow rate
τi interfacial shear stress
fi interfacial friction factor
D pipe diameter
ρmix mixture density
-dp/dz pressure gradient
usl superficial velocities of liquid flow
usg superficial velocities of gas flow
g gravitational acceleration
ρg Density of gas phases
ρl Density of liquid phases
δ liquid film thickness
mg gas mass flow rate
ml liquid mass flow rate
n number of experiments
Q flow rate
ωT uncertainty of the measured value
ωQ uncertainty of the flow meters
ωd uncertainty of the pipe diameters
e entrainment
Keywords: entrainment, optimization, flow patterns, two-phase flow, interfacial, vertical pipe, geoenvironmental science
Citation: Wang Y, Luo F, Zhu Z, Li R and Sina M (2024) Optimization of entrainment and interfacial flow patterns in countercurrent air-water two-phase flow in vertical pipes. Front. Mater. 11:1454922. doi: 10.3389/fmats.2024.1454922
Received: 26 June 2024; Accepted: 10 October 2024;
Published: 01 November 2024.
Edited by:
Mahbub Islam, Wayne State University, United StatesReviewed by:
Suhaib Umer Ilyas, Jeddah University, Saudi ArabiaHung Vo Thanh, Seoul National University, Republic of Korea
Copyright © 2024 Wang, Luo, Zhu, Li and Sina. This is an open-access article distributed under the terms of the Creative Commons Attribution License (CC BY). The use, distribution or reproduction in other forums is permitted, provided the original author(s) and the copyright owner(s) are credited and that the original publication in this journal is cited, in accordance with accepted academic practice. No use, distribution or reproduction is permitted which does not comply with these terms.
*Correspondence: Feng Luo, Zmx1b0BoaHUuZWR1LmNuJiN4MDIwMGE7; Mohammad Sina, bS5zaW5hMDA2OTFAZ21haWwuY29t
 Yongzhi Wang
 Feng Luo
 Zichen Zhu
 Ruijie Li
 Mohammad Sina