 Xiaoying Zhang1
 Rong Chang
94% of researchers rate our articles as excellent or good
Learn more about the work of our research integrity team to safeguard the quality of each article we publish.
Find out more
ORIGINAL RESEARCH article
Front. Mater., 05 September 2024
Sec. Structural Materials
Volume 11 - 2024 | https://doi.org/10.3389/fmats.2024.1410542
This article conducts experimental research on the influencing factors of the anti-skid performance testing system SCRIM for asphalt pavement. Studied the distribution pattern of anti-skid performance test results of the testing system under different testing speeds, test tires, temperature, water film thickness, test wheel position, tire wear degree, and other factors. Revealed the influence law of various influencing factors on the anti-skid performance of asphalt pavement. The test results indicate that the SFC test value decreases with the increase of vehicle speed. The test results of tires made of different materials vary greatly, and tires with wear exceeding 3 mm cannot be used for testing. The influence of water film thickness on the measured values varies depending on the SFC level. The SFC measurement value of the normal trajectory of the vehicle’s driving wheel track is the smallest, and the measurement value of the left trajectory is greater than that of the right trajectory. The SFC measurement decreases as the tire wear increases.
As the main pavement structure of highways, asphalt pavement directly bears the repeated effects of traffic loads and natural environment (Asi, 2007; Wang et al., 2013).Among them, the anti-skid performance of pavement is closely related to traffic safety, and anti-skid performance is an important evaluation index for the construction and maintenance of asphalt pavement on highways in China. The anti-skid performance of asphalt pavement refers to the braking performance of vehicles in motion. The anti-skid force generated by the sliding of the road surface is usually determined by the surface characteristics of asphalt pavement as the anti-skid performance of the pavement.
At present, the lateral force testing system SCRIM is used to test the anti-skid performance of the road surface. The existing testing methods are easily affected by conditions such as testing temperature, humidity, speed, and test tires. The reliability of the test results is not high. Many roads are in good condition, but SFC no longer meets the requirements (Fwa et al., 2003; Wang et al., 2013).
This article is based on the commonly used lateral force coefficient testing system for asphalt pavement. Study the distribution of test results for asphalt pavement maintenance engineering under different testing conditions, such as repeated test data under different testing speeds, tires, temperatures, and maintenance measures, and study the stability and reliability of the equipment’s test data. To lay the foundation for the accurate determination of the lateral force coefficient.
The dynamic square section and full scale ring road section of the Ministry of Transportation’s testing ground were selected as the test sections, which have the characteristics of low traffic volume, good road condition, and stable friction coefficient, as shown in Figure 1. This section is for the national lateral force coefficient comparison test.

Figure 1. Standard test road section.
The experimental equipment selected is the lateral force coefficient testing vehicle shown in the diagram, which is the standard equipment for testing the lateral force coefficient of road surface specified in the “On site Testing Regulations for Highway Roadbeds and Pavements” (JTG 3450). The detection results can be directly used for engineering evaluation (Araujo et al., 2015).
The working principle of the testing vehicle is to install a set of independent testing wheels on both sides of the testing vehicle, and the testing wheels are at a 20° angle with the direction of vehicle travel. The static standard load acting on the test wheel is 2kN, and the test tire is a smooth tire with a standard air pressure of (0.35 ± 0.01) Mpa (Tang et al., 2019). The lateral force coefficient detection vehicle is shown in Figure 2.
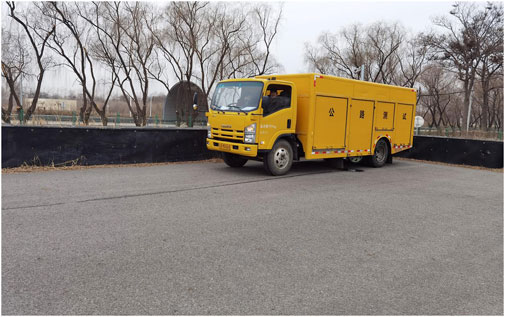
Figure 2. FC-2007 lateral force coefficient testing vehicle.
During testing, the test wheel acts vertically on the road surface and forms a water film with a thickness of no less than 1 mm through the water supply system (Rezaei et al., 2011; Plati et al., 2020). The test vehicle travels at a standard speed, and the frictional force generated between the road surface and the test wheel is continuously collected by a pressure sensor installed on one side of the test wheel perpendicular to the test wheel surface. The collected results are transmitted to the data analysis system of the main control computer for recording and calculation. Obtain the lateral force coefficient SFC of the road surface at this location, with a statistical unit length of 10 m. The main parameters of the equipment are as follows:
Test wheel angle: 20° from the direction of travel; Test wheel vertical load: 2,000 N ± 20 N; Test speed: 30–80 km/h; The structure of the testing wheel is shown in Figure 3.
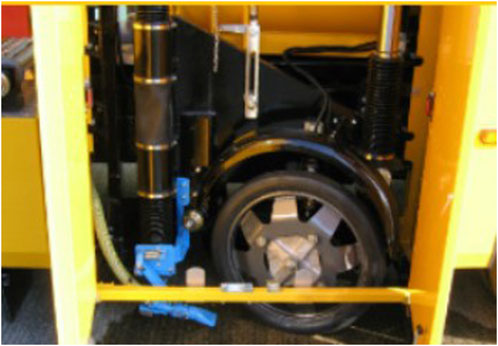
Figure 3. Schematic diagram of testing wheel.
Road friction refers to the resistance generated by the relative motion between the test tire and the road surface (Kotek and Florková, 2014). It is generated when the tire rolls or slides over the road surface. The maximum value for testing the lateral force coefficient is when the deviation angle is 20°, and its principle can be seen as a “sticky sliding effect”.
The mechanism of adhesive slip is the frictional force formed by the contact between the tire and the road surface during rolling. It mainly consists of two parts, adhesion force and retardation force. The adhesion force is mainly generated by the micro texture part of the graded crushed stone surface, which is the force formed by the bonding and cross-linking between the tire and aggregate micro textures (Dan et al., 2017; Lin and Tongjing, 2018). The adhesion force is mainly related to the road construction material, the cleanliness of the contact interface, and the driving speed. At low speeds, the tire rubber fully contacts the road surface structure to produce adhesion effects. The blocking force is mainly generated by the macroscopic structure of asphalt mixture, which is essentially the strain energy loss caused by the deformation of the tread rubber caused by the contact between the tire and the protruding structure. Generally speaking, the more protruding parts of the macroscopic structure, or the lower the hardness of the tire material, the greater the loss of strain energy. Therefore, for the lateral force coefficient, it is necessary to fully consider the influence of the tire surface force stickiness factor on accuracy (Cui et al., 2020; Kane and Edmondson, 2020).
This section takes driving speed, testing tires, testing temperature, water film thickness, testing trajectory position, and tire wear degree as different testing conditions to test the distribution characteristics of SFC under different influencing factors.
Maintain the system calibration parameters, tire wear degree, water film thickness greater than 1 mm, and temperature unchanged. Conduct tests at six speeds of 20 km/h, 30 km/h, 40 km/h, 50 km/h, 60 km/h, and 70 km/h on the same road section and within the ground temperature range of 25 °C. Each experiment is tested 5 times, and the average value is taken as the experimental result. Select one mainstream tire for testing.
The test temperature was 25°C, and the SFC values for different driving speeds obtained at two different SFC levels (57/69) are shown in Table 1.
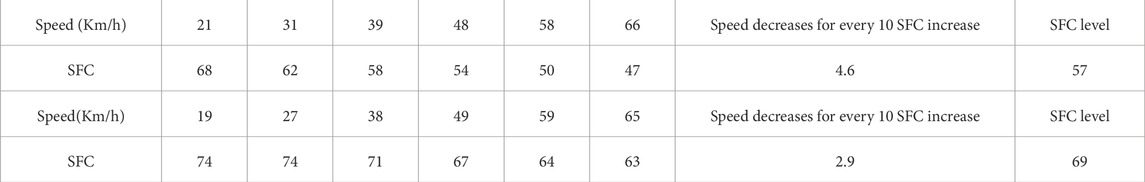
Table 1. SFC variation at different driving speeds.
As the speed increases, the SFC test value decreases. The higher the SFC level of the road, the smaller the change in SFC test results.
The anti-skid performance of the road surface provides adhesion between tires and the road for vehicles to travel quickly, ensuring the frictional resistance required for braking within a safe distance and reducing the probability of traffic accidents (Kane et al., 2010; Kane and Edmondson, 2018). Tire factors include tire structure type, tread pattern, tire inflation pressure, and wear condition. The frictional force generated by radial tires in contact with the road surface is higher than that of diagonal tires. The shape of tire surface patterns includes transverse groove patterns, longitudinal groove patterns, and block patterns. Vertical groove patterns can enhance lateral anti slip ability, while horizontal groove patterns can enhance longitudinal anti slip ability and grip. The block pattern falls between the two, and the density of the tire pattern also has a significant impact on the friction between the tire and road. The lower the density of the pattern, the larger the contact area between the tire and the ground, and the greater the adhesion between the tire and the ground. Therefore, car tires are gradually moving towards wide tire designs.
Maintain the system calibration parameters, test speed of 50 km/h, tire wear of less than 1 mm, water film thickness of more than 1 mm, and temperature of 18°C–22°C unchanged, and use test tires from different manufacturers for testing Each experiment is tested 5 times, and the average value is taken as the experimental result. Select road sections with lateral force coefficients SFC0-40, 40-60, and above 60 for testing. The SFC data of different types of tires obtained through testing are shown in Table 2.
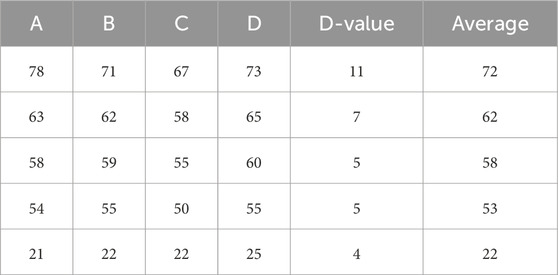
Table 2. SFC data for different test tires.
There are significant differences in the measured values of different tires, and the differences increase with the increase of SFC level. Tires have a significant impact on the test results of SFC. When retesting or conducting comparative tests on SFC data, the same brand new tires should be used for testing.
Due to the partial performance changes of road materials and test wheel tire rubber caused by temperature changes, temperature is an important factor affecting the lateral force coefficient test value (Carret et al., 2015; Kogbara et al., 2018).
To study the applicability of the current temperature correction coefficient to different climates in different regions of China, SFC tests were conducted on road sections under different temperature conditions. The SFC test results of the road sections were converted to an equivalent value of 25°C and compared with the actual test results. Maintain the system calibration parameters, test speed of 50 km/h, tire batch, tire wear less than 1 mm, and water film thickness greater than 1 mm unchanged, and conduct tests at different ground temperatures (temperature selection is 0°C–70°C, divided every 5°C). Testing can be conducted at different time periods based on temperature changes, with five tests per group. The average value is taken as the test result. Select one mainstream tire for testing. The experimental results are shown in Figure 4.
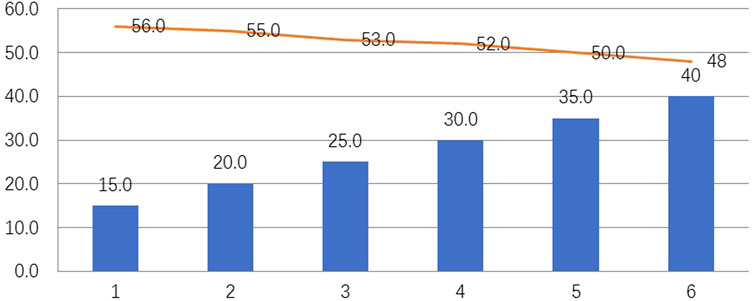
Figure 4. SFC changes due to temperature influence.
The thickness of water film is one of the important factors affecting the anti-skid performance of road surfaces. In theory, a too thin water film thickness will increase the contact area between the road surface and tires, leading to larger test results. On the contrary, excessive water film thickness can reduce the contact area between the road surface and tires, and even cause water drift, resulting in smaller test results.
By controlling the change in sprinkler volume, tests were conducted separately (with water film thickness ranging from 0 to 2 mm and intervals of 0.5 mm, i.e., no water, water film thickness of 0.5, 1.0, 1.5, 2.0 mm). Each group was tested 5 times, and the average value was taken as the test result. The testing process under different water film thicknesses is shown in Figure 5; Table 3.
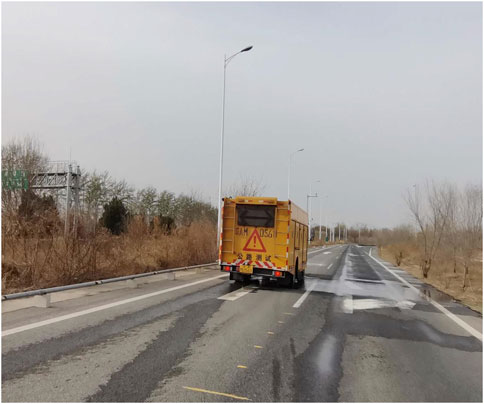
Figure 5. SFC testing process (different water film thicknesses).
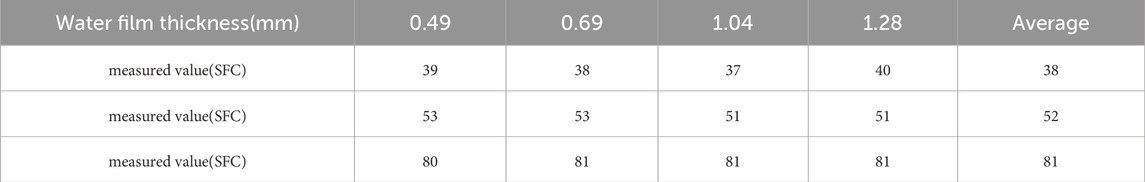
Table 3. SFC test results under different water film thicknesses.
The influence of water film thickness on the measured values varies depending on the level of SFC (Büchler et al., 2018). The average lateral force coefficient of asphalt pavement under different water film thicknesses fluctuates to a certain extent and is basically consistent with the theoretical analysis results. As the water film thickness increases, the lateral force coefficient gradually decreases, and the lateral force coefficient is inversely proportional to the water film thickness.
The constant water supply under dynamic measurement conditions is crucial to ensure the formation of a uniform thickness of water film on the tested road surface. A water quantity control system can be installed on the SCRIM system to achieve constant water supply under dynamic measurement conditions, ensuring the formation of a uniform thickness of water film on the tested road surface.
By controlling the changes in the position of the test track, tests were conducted separately (with the track position selected as the middle track, 50 cm to the left of the track, 50 cm to the right of the track, and the centerline of the lane). Each group was tested 5 times, and the average value was taken as the test result.
The data obtained from the analysis and testing are shown in Table 4.

Table 4. SFC test results at different trajectory positions.
The normal trajectory has the smallest measurement value, the trajectory is biased towards both sides, the measurement value increases, and the trajectory is biased towards the left measurement value greater than the trajectory towards the right measurement value. Based on the results, it is speculated that this may be related to the driver’s driving habits.
The SCRIM testing system uses smooth rubber tires to simulate the most unfavorable wet driving conditions (Poulikakos et al., 2022). Testing the degree of tire wear can lead to changes in tire pressure and the contact area between the tire and the ground, thereby affecting the accuracy of the test results. This study analyzed the impact of different tire wear levels on the test results by conducting SCRIM tests on tires with different levels of wear.
Three types of test tires with different degrees of wear (brand new tires, 2 mm of wear and tear, and 3 mm of wear and tear) were used for the experiment. Each experiment is tested 5 times, and the average value is taken as the experimental result.
The data obtained from the analysis and testing are shown in Table 5; Figure 6.
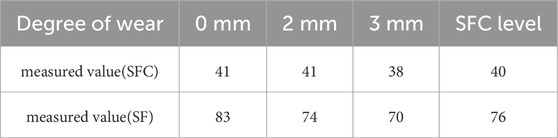
Table 5. SFC test results under different tire wear levels.
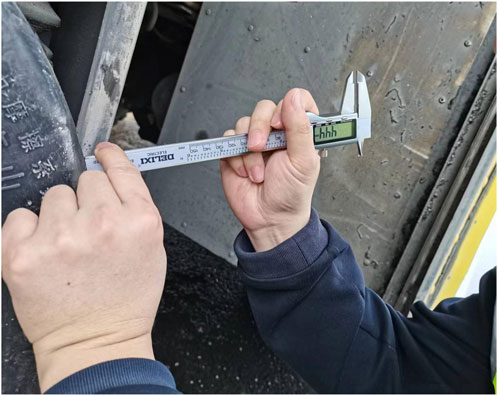
Figure 6. Test the degree of tire wear.
The wear of the tire increases, the measured value decreases, and the higher the SFC level, the greater the change. The test results using new tires have higher values than those using old tires, with a maximum SFC difference of 3, indicating that worn test tires will reduce the SFC test results. So when the diameter of the test tire is reduced by more than 6 mm (i.e., 3 mm tread wear) or there is obvious damage or cracking compared to the new tire, a new tire must be replaced. Rubber tires are not completely homogeneous materials, so testing the degree of tire wear can change the tread characteristics, tire contact area, and tire pressure of the tire, ultimately affecting the accuracy of the test results.
The testing results of the SCRIM system are greatly affected by different testing conditions. In the daily anti-skid performance testing process, attention should be paid to the following relevant influencing factors to ensure the accuracy of SFC test results.
(1) The SFC test value decreases with the increase of vehicle speed, and the higher the SFC level of the road itself, the smaller the change in SFC test value.
(2) The test results of tires from different manufacturers vary greatly, increasing with the increase of SFC level. Tires have a significant impact on the test results of SFC. When retesting or conducting comparative tests with questionable test data, new tires from the same manufacturer should be selected for testing. When the tire wear exceeds 3 mm, it is no longer used for testing., Before each test, the tire pressure should be calibrated.
(3) The influence of water film thickness on measurement varies depending on the level of SFC. There is a certain fluctuation in the mean lateral force coefficient of asphalt pavement under different water film thicknesses. As the thickness of the water film increases, the lateral force coefficient gradually decreases, and the lateral force coefficient is inversely proportional to the thickness of the water film. By controlling the water volume at different driving speeds, the water film thickness can reach 0.5 mm.
(4) The SFC measurement value of the normal trajectory of the vehicle’s driving wheel track is the smallest, and the trajectory is biased towards both sides, causing the measurement value to increase. The trajectory is biased towards the left, and the measurement value is greater than that towards the right. This may be determined by the driver’s driving habits.
(5) The changes in the degree of tire wear during testing can alter the tread characteristics, tire contact area, and tire pressure of the tire, ultimately having a significant impact on the accuracy of the test results. The SFC measurement decreases as the tire wear increases. The test results using new tires have higher values than those using old tires.
The original contributions presented in the study are included in the article/Supplementary Material, further inquiries can be directed to the corresponding authors.
XZ: Writing–review and editing. RC: Writing–original draft. ZX: Writing–review and editing, Methodology. JW: Writing–review and editing, Software. ZT: Writing–review and editing, Supervision.
The author(s) declare that financial support was received for the research, authorship, and/or publication of this article. This research was funded by Jiangxi Provincial Department of Transportation Science and Technology Project “2022H0001”.
Authors XZ and ZT were employed by Jiangxi Communications Investment Group Co., Ltd. Author ZX was employed by Jiangxi Communications Investment Group Co., Ltd., Road Network Operation Management Company.
The remaining authors declare that the research was conducted in the absence of any commercial or financial relationships that could be construed as a potential conflict of interest.
All claims expressed in this article are solely those of the authors and do not necessarily represent those of their affiliated organizations, or those of the publisher, the editors and the reviewers. Any product that may be evaluated in this article, or claim that may be made by its manufacturer, is not guaranteed or endorsed by the publisher.
Araujo, V. M. C., Bessa, I. S., and Branco, V. T. F. C. (2015). Measuring skid resistance of hot mix asphalt using the aggregate image measurement system (AIMS). Constr. Build. Mater. 98, 476–481. doi:10.1016/j.conbuildmat.2015.08.117
Asi, I. M. (2007). Evaluating skid resistance of different asphalt concrete mixes. Build. Environ. 42 (1), 325–329. doi:10.1016/j.buildenv.2005.08.020
Büchler, S., Falchetto, A. C., Walther, A., Riccardi, C., Wang, D., and Wistuba, M. P. (2018). Wearing course mixtures prepared with high reclaimed asphalt pavement content modified by rejuvenators. Transp. Res. Rec. J. Transp. Res. Board 2672, 96–106. doi:10.1177/0361198118773193
Carret, J. C., Falchetto, A. C., Marasteanu, M. O., Di Benedetto, H., Wistuba, M. P., and Sauzeat, C. (2015). Comparison of rheologicalparameters of asphalt binders obtained from bending beam rheometer and dynamic shearrheometer at low temperatures. Road Mater. Pavement Des. 16 (1), 211–227. doi:10.1080/14680629.2015.1029696
Cui, P., Wu, S., Xiao, Y., Yang, C., and Wang, F. (2020). Enhancement mechanism of skid resistance in preventive maintenance of asphalt pavement by steel slag based on micro-surfacing. Constr. Build. Mater. 239, 117870. doi:10.1016/j.conbuildmat.2019.117870
Dan, H. C., He, L. H., and Xu, B. (2017). Experimental investigation on skid resistance of asphalt pavement under various slippery conditions. Int. J. Pavement Eng. 18 (6), 485–499. doi:10.1080/10298436.2015.1095901
Fwa, T. F., Choo, Y. S., and Liu, Y. (2003). Effect of aggregate spacing on skid resistance of asphalt pavement. J. Transp. Eng. 129 (4), 420–426. doi:10.1061/(asce)0733-947x(2003)129:4(420)
Kane, M., and Edmondson, V. (2018). Modelling the bitumen scour effect: enhancement of a dynamic friction model to predict the skid resistance of rubber upon asphalt pavement surfaces subjected to wear by traffic polishing. Wear 400, 100–110. doi:10.1016/j.wear.2017.12.013
Kane, M., and Edmondson, V. (2020). Long-term skid resistance of asphalt surfacings and aggregates’ mineralogical composition: generalisation to pavements made of different aggregate types. Wear 454, 203339. doi:10.1016/j.wear.2020.203339
Kane, M., Zhao, D., Do, M. T., Chailleux, E., and De-Lalarrard, F. (2010). Exploring the ageing effect of binder on skid resistance evolution of asphalt pavement. Road Mater. pavement Des. 11 (1), 543–557. doi:10.1080/14680629.2010.9690346
Kogbara, R. B., Masad, E. A., Kassem, E., and Scarpas, A. T. (2018). Skid resistance characteristics of asphalt pavements in hot climates. J. Transp. Eng. Part B Pavements 144 (2), 04018015. doi:10.1061/jpeodx.0000046
Kotek, P., and Florková, Z. (2014). Comparison of the skid resistance at different asphalt pavement surfaces over time. Procedia Eng. 91, 459–463. doi:10.1016/j.proeng.2014.12.026
Lin, C., and Tongjing, W. (2018). Effect of fine aggregate angularity on skid-resistance of asphalt pavement using accelerated pavement testing. Constr. Build. Mater. 168, 41–46. doi:10.1016/j.conbuildmat.2018.01.171
Plati, C., Pomoni, M., and Georgouli, K. (2020). Quantification of skid resistance seasonal variation in asphalt pavements. J. traffic Transp. Eng. Engl. Ed. 7 (2), 237–248. doi:10.1016/j.jtte.2018.07.003
Poulikakos, L. D., Pasquini, E., Tusar, M., Hernando, D., Wang, D., Mikhailenko, P., et al. (2022). RILEM interlaboratory study on the mechanical properties of asphalt mixtures modified with polyethylene waste. J. Clean. Prod. 375, 134124. doi:10.1016/j.jclepro.2022.134124
Rezaei, A., Masad, E., and Chowdhury, A. (2011). Development of a model for asphalt pavement skid resistance based on aggregate characteristics and gradation. J. Transp. Eng. 137 (12), 863–873. doi:10.1061/(asce)te.1943-5436.0000280
Tang, T., Anupam, K., Kasbergen, C., Scarpas, A., and Erkens, S. (2019). A finite element study of rain intensity on skid resistance for permeable asphalt concrete mixes. Constr. Build. Mater. 220, 464–475. doi:10.1016/j.conbuildmat.2019.05.185
Keywords: asphalt pavement, anti slip, tire wear degree, water film thickness, scrim
Citation: Zhang X, Chang R, Xu Z, Wang J and Tan Z (2024) Research on the influencing factors of anti-skid performance evaluation of asphalt pavement based on lateral force testing system. Front. Mater. 11:1410542. doi: 10.3389/fmats.2024.1410542
Received: 01 April 2024; Accepted: 24 April 2024;
Published: 05 September 2024.
Edited by:
Di Wang, University of Ottawa, CanadaReviewed by:
Wentong Wang, Shandong University of Science and Technology, ChinaCopyright © 2024 Zhang, Chang, Xu, Wang and Tan. This is an open-access article distributed under the terms of the Creative Commons Attribution License (CC BY). The use, distribution or reproduction in other forums is permitted, provided the original author(s) and the copyright owner(s) are credited and that the original publication in this journal is cited, in accordance with accepted academic practice. No use, distribution or reproduction is permitted which does not comply with these terms.
*Correspondence: Rong Chang, ci5jaGFuZ0ByaW9oLmNu; Zhixiang Xu, NjE3MzYyNDI2QHFxLmNvbQ==
Disclaimer: All claims expressed in this article are solely those of the authors and do not necessarily represent those of their affiliated organizations, or those of the publisher, the editors and the reviewers. Any product that may be evaluated in this article or claim that may be made by its manufacturer is not guaranteed or endorsed by the publisher.
Research integrity at Frontiers
Learn more about the work of our research integrity team to safeguard the quality of each article we publish.