
95% of researchers rate our articles as excellent or good
Learn more about the work of our research integrity team to safeguard the quality of each article we publish.
Find out more
ORIGINAL RESEARCH article
Front. Mater. , 13 October 2023
Sec. Environmental Degradation of Materials
Volume 10 - 2023 | https://doi.org/10.3389/fmats.2023.1269175
 Wang Chengzhong1*
 Niu Shuangjian2
The landslide disaster of weathered rock slope under seepage action is very common, and the research on its reinforcement and stability is the key of engineering. In this paper, the four grades slope of Yunmao Expressway in China is taken as an example. Based on the engineering monitoring results, the stability of slope reinforcement is studied by numerical simulation. The results of engineering monitoring deformation show that the reinforcement method can effectively guarantee the stability of the slope. The numerical simulation method is used to study the stability of reinforced slope under the influence of hydraulic gradient, anchorage length, anchoring force, and anchorage failure position. The numerical study results show that hydraulic gradient has a great influence on the slip of the sliding surface, and the safety factor decreases with the increase of hydraulic gradient. The greater the anchorage length, the greater the stability of the slope. The safety factor increases with increasing anchorage length. The anchoring force increases and the slope displacement decreases, and the change range is greater than other factors. The influence of anchorage failure on the four grades is that the first-grade is greater than the third-grade, the third-grade is greater than the second-grade, and the second-grade is greater than the fourth-grade.
With the development of infrastructure construction, large-scale excavation of rock slopes and engineering buildings have led to more prominent problems in its stability. There are irregular fault fracture zones, interlayer dislocation zones and other weak structural planes in natural slopes and artificial slopes (Tu and Deng, 2020; Feng et al., 2023; Zhang et al., 2023). In addition, the seepage caused by rainfall affects the stability of the slope, and has become one of the key technical problems restricting the construction of the project (Saada and Maghous, 2012; Geng et al., 2017; Sun and Wang, 2021; Xu et al., 2022). Therefore, it has become one of the important problems in geotechnical engineering to put forward reasonable support reinforcement technology and scientific maintenance guidance strategy to ensure slope stability.
The stability of rock slope is affected by various factors. The slope is affected by rainwater erosion and seepage. The internal slope is weakened, the mechanical properties of rock mass are weakened, and its stability is bound to be greatly affected (Orense et al., 2001; Das et al., 2020; Nishimura et al., 2020). Kim et al. (2018) carried out on sand slope by artificial rainfall, and then the slope stability analysis under seepage was carried out by numerical simulation. Using the nonlinear Mohr-Coulomb strength criterion, Deng et al. (2019) carried out the stress analysis of the slip surface and established the limit equilibrium analytical solution of slope stability. Gao et al. (2020) proposed a superposition calculation method for the steady-state seepage analysis of slope rock and soil structure based on the monitoring results of field stress and strain. Wang et al. (2021) applied the hydraulic distribution to the seepage force of the three-dimensional discrete rotation failure mechanism slope and evaluated the stability of the rock slope. Hu et al. (2022) studied the slope instability caused by seepage by combining finite element and discrete element methods, and obtained the critical hydraulic gradient of different slope instability.
Although some achievements have been made in the study of slope stability under seepage, most of them are aimed at the unsupported slope without considering the re-failure characteristics of the reinforced slope under seepage. At present, there are few studies on the reinforcement of seepage slope and the later stability limit. A lot of achievements have been made in the failure mechanism, failure mode and safety factor of unstable slope. However, there are few studies on the stability evolution characteristics of seepage slope after reinforcement, which still needs further study. There is no effective reference for the later reinforcement and maintenance of slope.
Numerical simulation and field engineering monitoring are widely used in the study of slope stability. The geological characteristics of the slope are detected by field engineering, and the deformation and stability of the slope can be reflected by in-situ monitoring (Zhao, 2021; Thomas et al., 2023; Yang et al., 2023). According to the field monitoring, the numerical simulation is created, and the deformation and instability evolution mechanism of the slope under various conditions are revealed by changing the slope shape, geological characteristics, and slip surface distribution. Therefore, the research method combining numerical simulation and engineering can more effectively reveal the evolution law of slope stability.
In view of this, based on a reinforced seepage slope of Yunmao Expressway, this paper analyzes the deformation characteristics of the slope through on-site monitoring, and reveals the operation mechanism of the slope reinforcement strategy. By means of numerical simulation, the stability evolution characteristics of seepage slope after reinforcement is studied when the influencing factors change such as hydraulic gradient, anchorage length, anchorage force and anchorage failure position. The variation patterns of horizontal and vertical displacement of slopes are revealed. Reveal the influence of various factors on the safety factor of slopes. By combining engineering monitoring with numerical research, engineering monitoring includes long-term deformation monitoring results before and after reinforcement, and numerical simulation considers changes in hydraulic gradients and anchoring structures. The range analysis method is used to evaluate the weight of the influencing factors.
Taking the Yunmao Expressway in China as an example, the influence degree on slope stability is analyzed with hydraulic gradient, anchorage length, anchorage force and anchorage failure position changing; the change mechanism of slip of slope is obtained under different influencing factors; The evolution laws of safety factor are revealed, and the prediction models of safety factor are proposed. The research results can provide scientific guidance for the selection of re-reinforcement strategies for the unstable state of the reinforced slope, and also provide a theoretical basis for the prediction of slope stability.
The slope is located in the low and gentle hills, and the terrain is undulating. The ground elevation of the slope is about 320–369 m, and the maximum natural slope angle is about 24°. The climate in the slope area is mild, the rainfall is abundant, and the surface runoff has a greater erosion on the slope foot. Atmospheric precipitation is the main recharge source of groundwater, which is discharged from the top of the slope to the foot of the slope. Rainwater mainly flows in the fracture zone, and the pore water content changes with the seasons. The permeability and water-bearing capacity are extremely uneven, the water level depth changes with the seasons, and the water volume is affected by the development degree of bedrock fissures. The rock strata that constitute the slope are mainly strongly weathered granite. The weathering is strongly semi-rock and semi-soil, and the strength is extremely low.
The results of geological exploration show that the mechanical parameters of strongly weathered granite are as follows: the cohesion is about 0.5 MPa, the friction angle is about 42o, the Poisson‘s ratio is about 0.26, the elastic modulus is about 6.5 GPa, and the weight is about 19 kN/m3. During the rainy season, rainwater penetrates through the thick residual layer and the fully weathered layer, and the sliding surface becomes the main water storage belt of the slope (the slope shape and rock characteristics are shown in Figure 1). Affected by the No.7 typhoon ‘Weipa’, the area where the site is located has continuous rainfall. On 5 August 2019, the on-site inspection found that a large-scale crack group appeared on the top of the right slope, and the crack width was about 2 mm–80 mm. Monitoring shows that there is a large surface displacement on the slope.
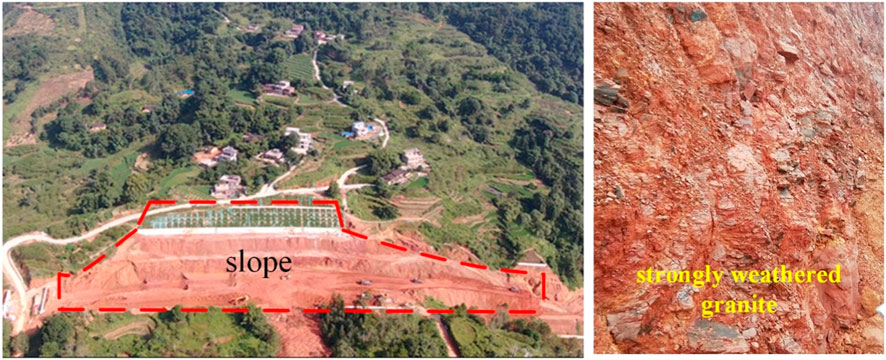
FIGURE 1. The overall shape and rock characteristics of the slope.
According to the follow-up monitoring data and crack location, the angle between the sliding direction and the route direction is about 70°. The landslide is about 355 m long along the route, with an average width of about 71 m. At present, the direct influence area with large deformation is about 25,100 m2, and the buried depth of the sliding surface is about 20 m–30 m. The different cracks on the slope are shown in Figure 2. Slope excavation destroys the original equilibrium conditions of rock mass, and rainwater infiltration makes the sliding zone (granite intrusion contact zone) soften and shear strength decrease. When the sliding force of the sliding body is greater than the viscous resistance of the sliding surface, the engineering landslide is gradually formed, and the landslide is generally in a sliding deformation state.
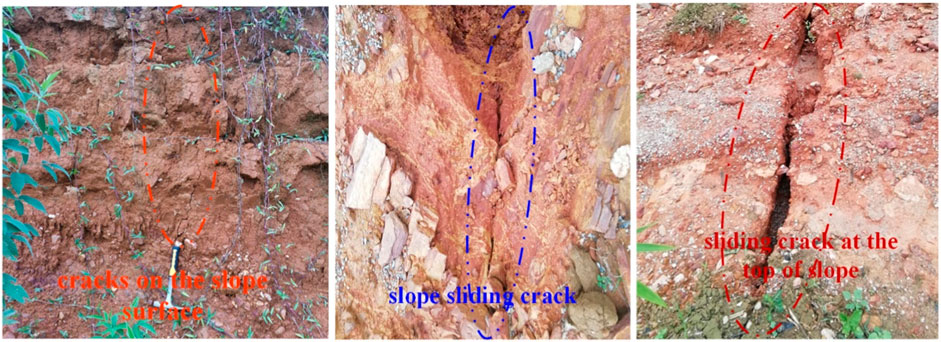
FIGURE 2. Different cracks in the slope caused by seepage after rainstorm.
The main reasons for conducting research on the Yunmao Expressway in this paper are as follows. The slope shows obvious slip characteristics before reinforcement, and the deformation is unstable. There is a large amount of water in the sliding surface of the slope, and the water level of the sliding surface changes obviously after rainfall, which belongs to the slope with typical seepage characteristics. The slope belongs to the fourth-grade slope, which is difficult to reinforce, and the stability of the slope after reinforcement is easily affected by external factors. The project relied on in this paper is mainly about the stability study of Yunmao expressway.
The slope rate of the original slope shape at all levels is as follows: the slope classification height is 10 m, the first, second and third grade slope rate is 1:1, and the fourth-grade slope rate is 1:1.25; the second-grade platform is 8 m wide, and the remaining platforms are 2 m wide.
The original reinforcement and protection measures are as follows: the first-grade is reinforced by lattice beam, the length of anchor rod is 8.5 m, and the 60 mm guest soil spray seeding protection in lattice beam; the second-grade adopts herringbone skeleton + three-dimensional network grass planting protection; the third-grade adopts herringbone skeleton + three-dimensional network grass planting protection; the fourth-grade is protected by three-dimensional network planting grass, and the slope is reinforced as shown in Figure 3. Several displacement piles are set up to continuously monitor the deformation of this high slope (Figure 3 is shown in detail). The main sliding surface is taken as an example to explain the deformation characteristics of the slope. The monitoring holes of the main sliding surface are SC-3, SC-4, and SC-7, which are located at the second-grade slope platform, the fourth-grade slope platform, and the top of the slope, respectively. The monitoring time began on 16 August 2019, and the longest continued until 16 September 2019. The changes of displacement (x- and y-directions) at different depths of each monitoring hole with time are shown in Figure 4, Figure 5.
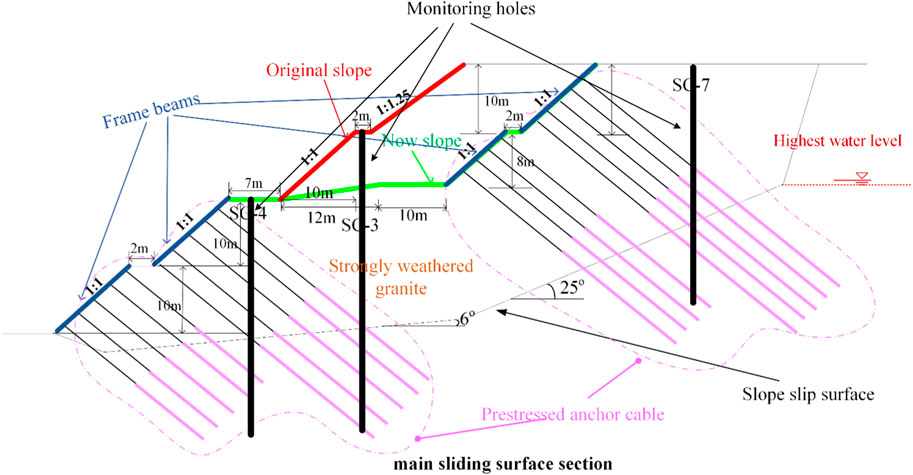
FIGURE 3. The schematic diagram of the main sliding surface section of the slope before and after re-reinforcement.
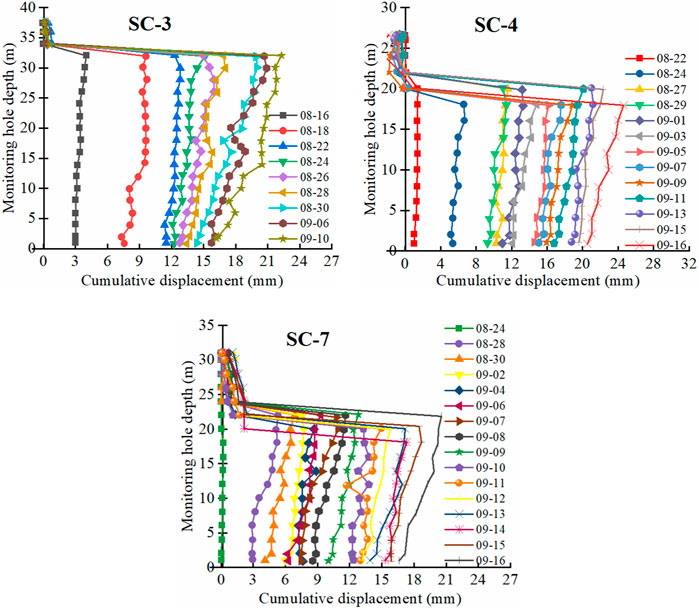
FIGURE 4. The variation of x-direction displacement with time at different depths at different monitoring points.
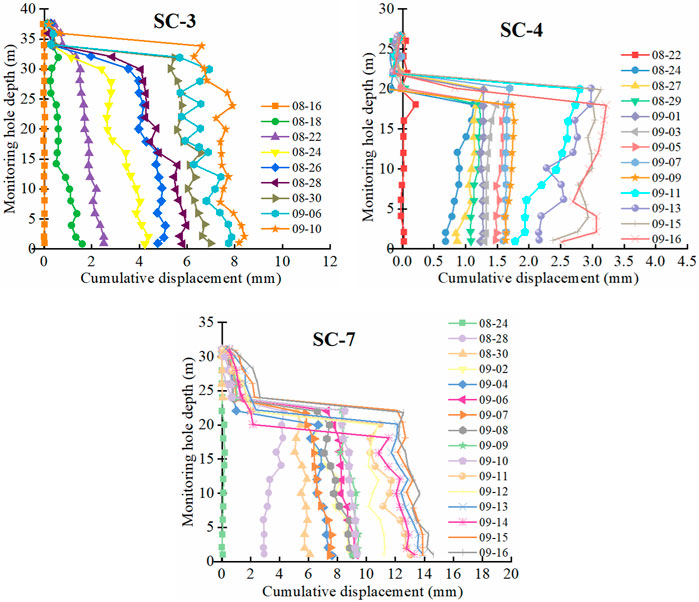
FIGURE 5. The variation of y-direction displacement with time at different depths at different monitoring points.
According to Figure 4, x-direction displacement of each position of the slope increases slightly with the increase of depth above the sliding surface. The displacement of x-direction at the slope top is relatively small, and the displacement is about 18 mm on September 16. The x-direction displacement at the slope foot is relatively large, and the displacement is about 24 mm on September 16. The increase rate of displacement in x-direction at each position is not much different. The displacement at each position decreases sharply, which is approximately below the sliding surface. Therefore, the displacement distribution in x-direction gradually decreases from the foot to the top. This is because the horizontal thrust component formed at the slope angle is large, so the displacement is relatively large.
From Figure 5, y-direction displacement above the sliding surface decreases slightly with the increase of depth. Compared with x-direction displacement, y-direction displacement of each position is relatively small. The displacement in y-direction at the slope top is relatively large. By September 16, the displacement in y-direction reached 15 mm. The displacement in y-direction at the slope foot is relatively small, and the displacement in y-direction is only about 3 mm. On the whole, the displacement of monitoring points SC-3 and SC-7 decreases with depth, and the displacement of SC-4 increases with depth. The displacement at the slope top can reach several times that at the slope foot. Therefore, the slope subsidence at the slope top is large due to sliding. The displacement in the y-direction of each position also decreases sharply with the increase of depth.
Through the displacement monitoring results, combined with the geological characteristics, the form of the sliding surface and the comprehensive slope rate, the basic situation of the landslide is comprehensively identified. The main reasons for the formation of the landslide are as follows:
1) Lithology and geological structure. The rock strata that constitute the slope are mainly strongly weathered granite. The weathering is strongly hypabyssal rock, and the strength is extremely low. The lithology and structure of the lower part of the slope are complex, which is the contact zone of metamorphic sandstone and granite intrusion. The late intrusion of granite leads to the complex composition of rock mass on the slope. Combined with the monitoring data, the sliding surface is the granite unconformity contact zone.
2) Topography. The landslide is located in the gentle position in the middle and front of the mountain, with a slope angle of about 10°. The upper part is steeper, with a natural slope angle of 24°. The middle part is a gentle and wide platform, which is easy to collect water.
3) Rainwater effect. During the heavy rainstorm period, the rainwater infiltrates through the thick residual layer and the fully weathered layer, and the water content of slippery residual layer and the fully weathered layer increases. The underlying sliding bed is mainly strongly weathered granite, and the interface of the slope sliding surface is stagnant water. The long-term rainwater infiltration makes the slope sliding surface soften, the interlayer bonding force deteriorate, and the shear strength decrease.
4) Engineering activities. Before the excavation of the slope, it is in a stable state. After excavation, the equilibrium condition of the original rock mass is destroyed, which provides the shear space for the slope slip.
In summary, due to the excavation of the slope, the original equilibrium conditions of the rock mass are destroyed, and the rainwater infiltration makes the sliding zone (metamorphic sandstone and granite intrusion contact zone) soften and the shear strength decrease. When the sliding force of the sliding body is greater than the viscous resistance of the sliding surface, an engineering landslide is gradually formed.
According to the results of geological survey and deep hole displacement monitoring, the shape of sliding surface is comprehensively determined. Combined with topography, monitoring, field investigation, the partition is determined. The distribution of deformation area and the reinforcement measures of potential deformation area are fully considered to ensure the stability of slope, control the continuous deformation of landslide body, and ensure the safety of residents and property above the landslide. The deformation monitoring of different positions of the main sliding surface after reinforcement is shown in Figure 4 and Figure 5. The main reinforcement measures are as follows:
In order to reduce the pile length, unloading the original third and fourth grade slope; the slope ratio of the first-to the fourth-grade is 1:1, the first-grade platform is increased to 3 m wide, the second-grade platform is increased from 8 m to 29 m wide, the wide platform is set to 1:6 gentle slope (as shown in Figure 3), and the third-grade platform is 2 m wide. The third-grade slope height is 8 m, and the rest of the slope height is graded every 10 m.
The first-, second-, third- and fourth-grade slopes are protected by anchor cable frame beam. The length of anchor cable in the first-grade slope is 20 m, the length of anchor cable in the second and third grade slopes is 34 m, the length of anchor cable in the fourth-grade slope is 40 m, and the anchorage length of anchor cable in each grade slope is 10 m. The prestress is 400 kN, the anchor cable spacing is about 3 m, and the angle with the slope is 90o. The three steel strands in the anchor cable are Φ15.24 mm, the tensile strength is 1860 MPa, and the elastic modulus is 195 GPa.
The second roadside ditch is used as the first intercepting ditch away from the top of the slope. After the change, another interception ditch is set on the top of the slope, and a platform ditch is set on each platform. In addition, 600 mm × 600 mm ditch is added to the secondary platform (before the gentle slope), with a wall thickness of 150 mm and a length of 180 m.
In the reinforcement measures, the reduced slope thrust after unloading the third- and fourth-grade of the original slope, and the addition of gentle slope can weaken the slope top sliding. The anchor cable can increase the bond strength between the slope slip surface and the rock mass, and effectively control the deformation and maintain the stability of the slope. The frame beam structure can effectively prevent the separation of weathered rock and slope on the slope, weaken the scouring effect of rainwater on the slope, and ensure the overall stability.
From Figure 6, after a series of reinforcement and unloading treatments, the deformation of each part of the slope is much smaller than that of the slope before the reinforcement treatment. The maximum deformation in the x-direction appears in SC-3, which is close to the turning point of the sliding surface. The maximum deformation of 3 months is 9 mm. As time increases, the displacement in x-direction increases gradually with the increase of depth. The x-direction displacement of monitoring points SC-3 and SC-7 changes obviously with depth and time. The change of monitoring point SC-4 is very small. The change of displacement in the x-direction shows that the reinforced anchor cable can effectively control the horizontal deformation of the sliding surface and ensure the stability of the slope.
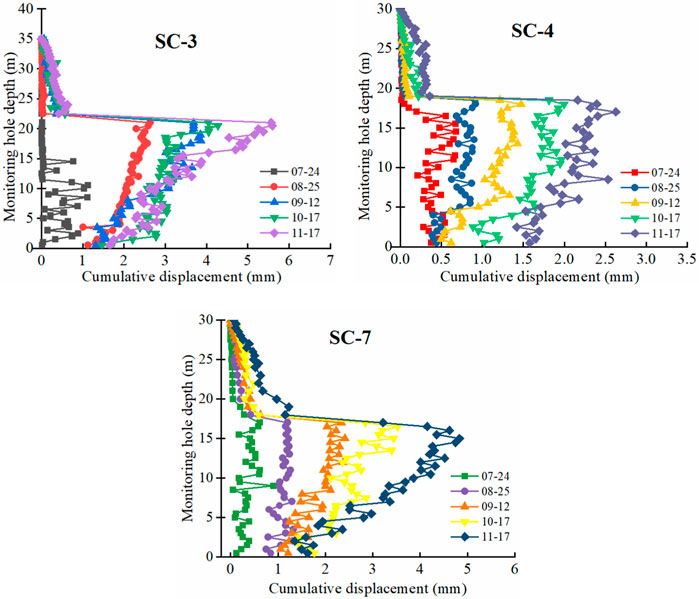
FIGURE 6. The displacement of different monitoring points in the x-direction changes with time at different depths after reinforcement.
Figure 7 shows the change of displacement in y-direction of different monitoring points, and the displacement in y-direction after reinforcement is much smaller than that before reinforcement. The displacement in y-direction is slightly larger than that in the x-direction. The maximum displacement in y-direction appears at the top of the slope, and the maximum deformation in 3 months is 9 mm. The displacement of the slope foot in y-direction is basically small due to the inhibition effect of reinforcement. The displacement in y-direction increases with the increase of time and decreases with the depth. The displacement of the y-direction at the top of slope is more different with time and depth. Compared with x-direction displacement, y-direction displacement of each monitoring position is smaller than that before reinforcement.

FIGURE 7. The displacement of different monitoring points in the y-direction changes with time at different depths after reinforcement.
Universal discrete element code (UDEC) is a two-dimensional discontinuous modeling numerical program based on discrete element method. The discontinuous medium is represented as a set of discrete blocks. The discontinuous boundary is considered as the boundary condition between blocks. The deformable block is subdivided into grids of finite difference elements, each of which responds according to a prescribed linear or nonlinear stress-strain law. The discontinuous relative motion is also controlled by the linear or nonlinear force-displacement relationship in the normal and shear directions.
UDEC is primarily intended for analysis in rock engineering projects, ranging from studies of the progressive failure of rock slopes to evaluations of the influence of rock joints, faults, bedding planes, etc. The blocks in UDEC can be rigid or deformable. There are seven built-in material models for deformable blocks, ranging from ‘zero’ block materials (representing hole-excavation), shear and volume yield models (including strain hardening/softening behavior). Different representations of joint material behavior are also available. The basic model is the Coulomb slip criterion, which specifies elastic stiffness, friction strength, cohesive strength, and tensile strength, as well as the expansion characteristics of joints.
The model with a sliding surface slope, in which the rock mass is characterized by a variable block, and the sliding surface is represented by a discontinuous boundary. In the process of modeling, the numerical model of the same size is established by determining the size of the slope surface at all levels of the slope. The size of the slip surface is embedded with discontinuous boundaries in the block according to the results of actual engineering detection, and then a numerical model that can be used for calculation is formed. The generation of the numerical model in this paper is shown in Figure 8.
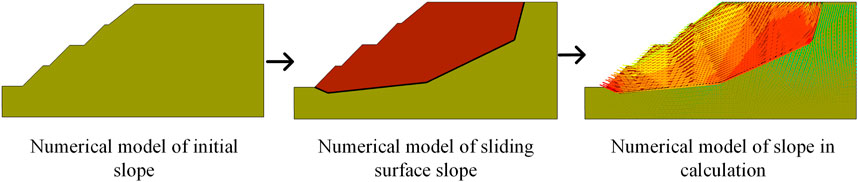
FIGURE 8. The establishment of slope numerical model.
According to the results of geological exploration, finite element numerical analysis method (UDEC) is used to establish the corresponding numerical model to analyze the stability of the reinforced slope under different influencing factors. Because the main sliding surface is the most serious failure in the sliding surface, its sliding deformation is also the largest in the subsequent monitoring, so the numerical analysis is conducted on the stability analysis of the main sliding surface of the slope. The size of the numerical simulation is consistent with the main sliding surface of the slope, and the specific size is shown in Figure 9C. The size of the slope surface and the sliding surface is consistent with that in Figure 3, and is no longer marked in Figure 9C. The left, right and lower boundaries of the numerical model are fixed boundaries, and the velocity and displacement on the boundary are both zero. The numerical model of the slope before and after reinforcement is shown in Figures 9A,B.

FIGURE 9. Discrete element numerical model of original, reinforced slope and monitoring points.
The monitoring points are named M1, M2, M3 and M4, respectively, as shown in Figure 9C. The prestressed anchor cable is used for reinforcement. The length of the first-grade slope anchor cable is 20 m, the length of the second-grade and third-grade slope anchor cable is 34 m, the length of the fourth-grade slope anchor cable is 40 m, the anchorage length of the slope anchor cable at all levels is 10 m, the pre-stress is 400 kN, the spacing of the anchor cable is about 3 m, and the angle with the slope surface is 90o. The mechanical parameters of the rock mass of the slope are the same as the actual slope exploration results, and the shape of the sliding surface is also consistent with the main sliding surface of the real slope. The mechanical parameters of the rock mass and the sliding surface are shown in Table 1, According to the “Code for Geological Survey of Water Resources and Hydropower Engineering” (GB50487-2008) published in China (Ministry of Water Resources of the People’s Republic of China, 2008), combined with the results of engineering geological survey in the paper, the hydraulic parameters are shown in Table 2. The tensile strength of the anchor cable is 1860 MPa and the elastic modulus is 195 GPa. The hydraulic gradient of the slope sliding surface is about 0.51 m/m.
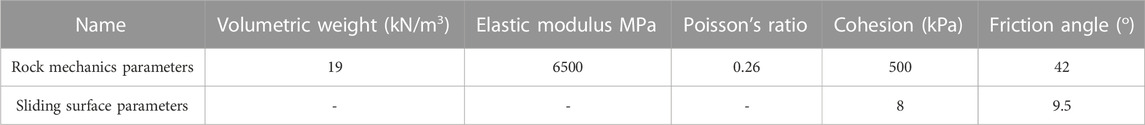
TABLE 1. Mechanical parameter settings for slope rock mass and sliding surface in numerical models.
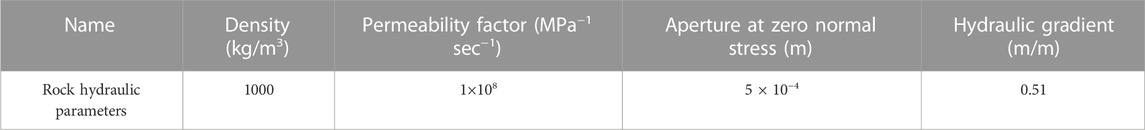
TABLE 2. Hydraulic parameters of rock.
After the slope is reinforced, the hydraulic gradient of the slope sliding surface changes under the rainfall effect, so the stability of the slope is greatly affected. Under the influence of geological structure factors, the anchoring force and anchorage length of prestressed anchor cable change, and anchorage failure occurs at different positions Based on the above factors affecting the stability of the slope, the discrete element numerical analysis is used to analyze the stability of the slope under the influence of the changes of hydraulic gradient, anchoring force, anchoring length, and anchorage failure position.
The variation of displacement in different monitoring points with depth before and after reinforcement obtained by numerical analysis method is shown in Figure 10. Before and after reinforcement, the displacement change of each monitoring point obtained by numerical calculation is basically consistent with the change rule of engineering monitoring results.
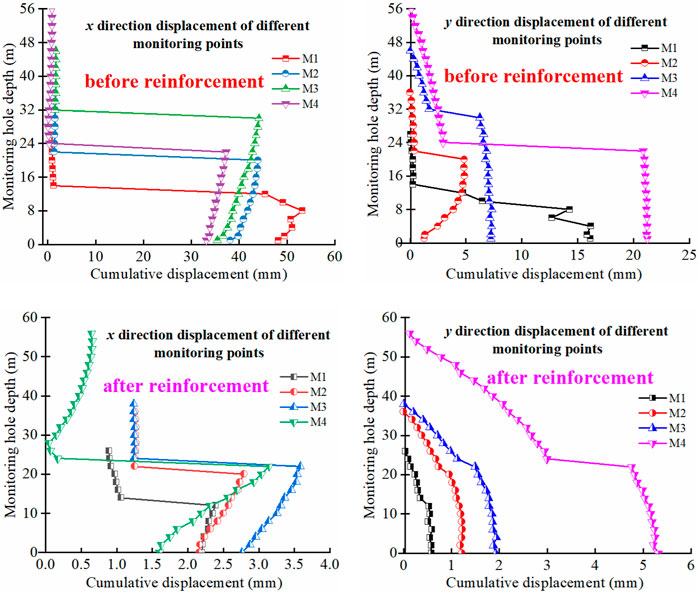
FIGURE 10. Displacement in x- and y-directions at different positions of the slope before and after reinforcement.
When the slope is not reinforced to reach the unbalanced force ratio (10–5), the slopes at all levels have a large displacement, and the slope is in a very unstable state. The x-direction displacement of the slopes at all grades is greater than the y-direction, which is consistent with the engineering monitoring results. When the unbalanced force ratio (10–5) is reached after reinforcement, the displacement of different depths of slopes at all levels is much smaller than that of unreinforced slopes, and the displacement in y-direction is slightly larger than that in x-direction, which is also consistent with the results of engineering monitoring. On the whole, the displacement in x-direction increases with the increase of depth, and the displacement in y-direction decreases with the increase of depth. The displacement variation law of each monitoring point in the actual project is basically consistent with the results obtained by numerical simulation, and the values are relatively close. Therefore, the discrete element method can well reflect the characteristics of the slope before and after reinforcement.
Figure 11 lists the slope displacement vector, slip surface shear displacement, safety factor and displacement distribution characteristics when the corresponding safety factor is reached before and after reinforcement. The maximum displacement of the slope before reinforcement appears at the slope toe, and the displacement direction is along the sliding surface direction. The deformation basically appears on the sliding surface, and the deformation on the rock mass is very small. After reinforcement, the anchor cable increases the connection between the sliding surface and the rock mass, effectively suppresses the deformation of the sliding surface, and increases the overall stability. When the sliding surface deforms, the rock mass also deforms due to the connection effect, but the deformation of the two is much smaller than that before reinforcement. The shear deformation of the sliding surface before reinforcement increases gradually from the top to the foot, and the shear deformation of the sliding surface after reinforcement is basically the same. Before reinforcement, the safety factor (K) of the slope is 1.01, which is in the state of critical sliding failure. After reinforcement, the safety factor (K) of the slope is 2.54, the anti-sliding force of the slope is far greater than the sliding force, and the slope is in a very stable state.
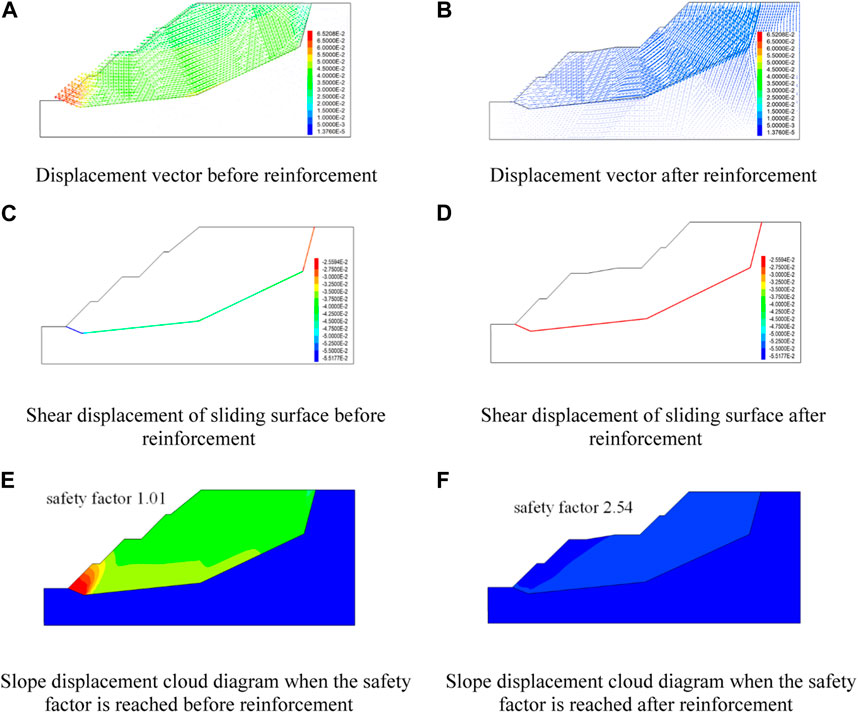
FIGURE 11. Comparison of displacement vector, sliding surface shear displacement and displacement when reaching factor of safety before and after slope reinforcement.
The sliding surface of the slope is the stagnant water surface, and the hydraulic gradient of different rainfall in the sliding surface will change greatly. According to the actual results, Yang et al. (Yang et al., 2022) obtained the relationship between slope hydraulic gradient (G) and rainfall, and the corresponding relationship between different rainfall and hydraulic gradient range is shown in Table 2. According to Table 3, five groups of hydraulic gradient ranges (0.2, 0.4, 0.5, 0.6, and 0.7) are designed respectively, and five groups of hydraulic gradients correspond to different rainfall amounts. Therefore, the influence of hydraulic gradient change of sliding surface on slope stability is studied.
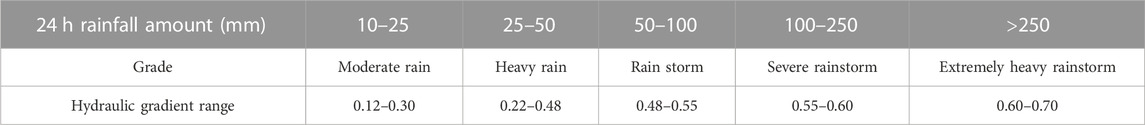
TABLE 3. Rainfall grade and hydraulic gradient range.
The displacement of each monitoring point when the unbalanced force ratio (10–5) is reached under different hydraulic gradients is shown in Figure 12. Under different hydraulic gradients, the displacement trends of each monitoring point are similar, but they are affected by hydraulic gradients. The displacement in x-direction and y-direction increases with an increase in hydraulic gradient. The variation of displacement fluctuation in x-direction at all grades is greatly affected by hydraulic gradient, and the difference increases with an increase in hydraulic gradient. The increase of hydraulic gradient directly affects the slip, so the horizontal deformation is quite different. When the y-direction displacement hydraulic gradient at the foot of the slope is small, the fluctuation with depth is large. With the increase of hydraulic gradient, the displacement fluctuation is obviously reduced, and the displacement difference between different hydraulic gradients is reduced. The maximum displacement difference in y-direction also appears at the top of the slope. In summary, the hydraulic gradient has a great influence on the horizontal slip characteristics of sliding surface, and has little influence on sliding surface sinking.
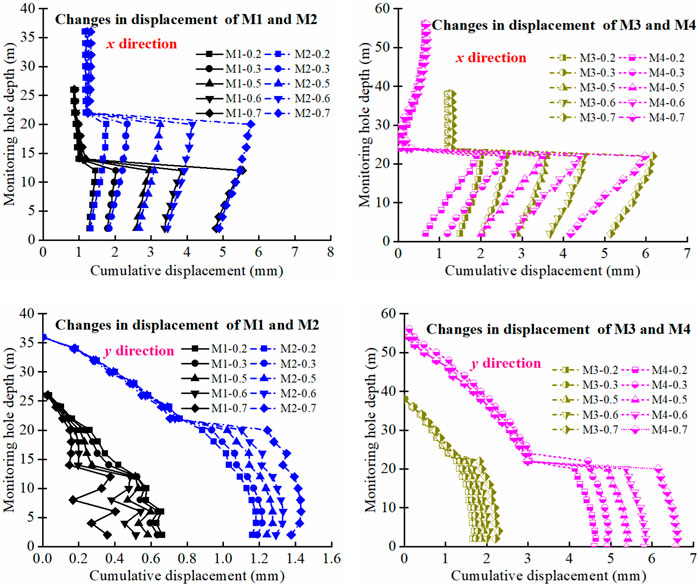
FIGURE 12. Changes in displacement of each monitoring point with depth under different hydraulic gradients.
Figure 13 shows the displacement distribution nephogram under different hydraulic gradients, and the difference of displacement distribution is greatly affected by hydraulic gradient. When the hydraulic gradient is small, the slope stability is good and the deformation is small. The displacement on the slope presents a vertical strip distribution. As the hydraulic gradient increases, the displacement increases and begins to shift. The maximum displacement zone moves to the lower block of the sliding surface. With increasing hydraulic gradient, the safety factor (K) of slope decreases, and the decreasing speed raises gradually. The relationship between the safety factor and the hydraulic gradient satisfies the power function relationship with a constant term, and the correlation coefficient is 0.98. The specific function form is shown in Figure 13.
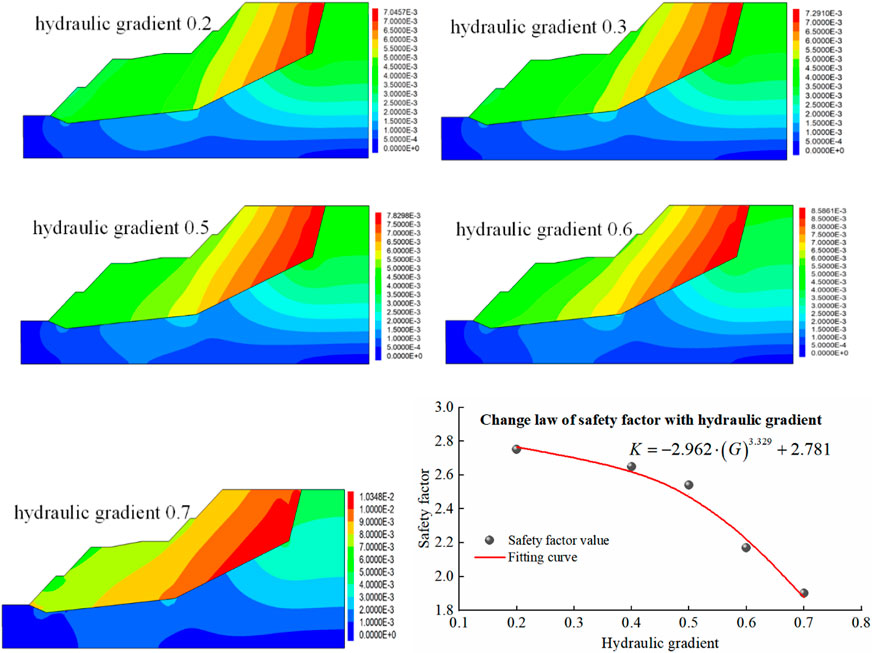
FIGURE 13. The distribution of displacement cloud and the change law of safety factor with hydraulic gradient.
After reinforcement, the anchoring force varies due to the geological structure, and the anchorage length (La) of the anchor cable also changes. To reveal the evolution characteristics of slope stability under different anchorage lengths, five different anchorage lengths of slopes at all levels were designed, and the anchorage lengths are 0 m, 2 m, 6 m, 10 m, and 14 m, respectively. The anchoring force is 400 kN, and the hydraulic gradient is 0.5. Under different anchorage lengths, the displacement of each monitoring point in x and y directions with depth is shown in Figure 14. The displacement distribution cloud diagram and the change of safety factor are shown in Figure 15.
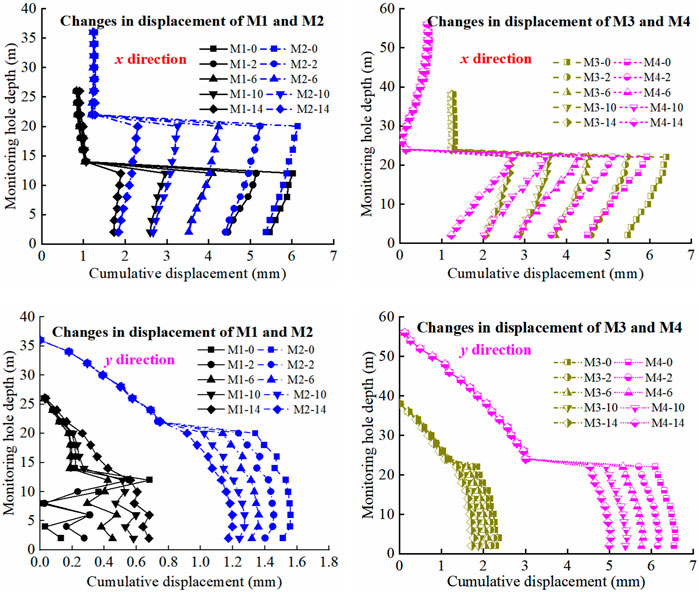
FIGURE 14. The change of displacement of each monitoring point with depth under different anchorage lengths.
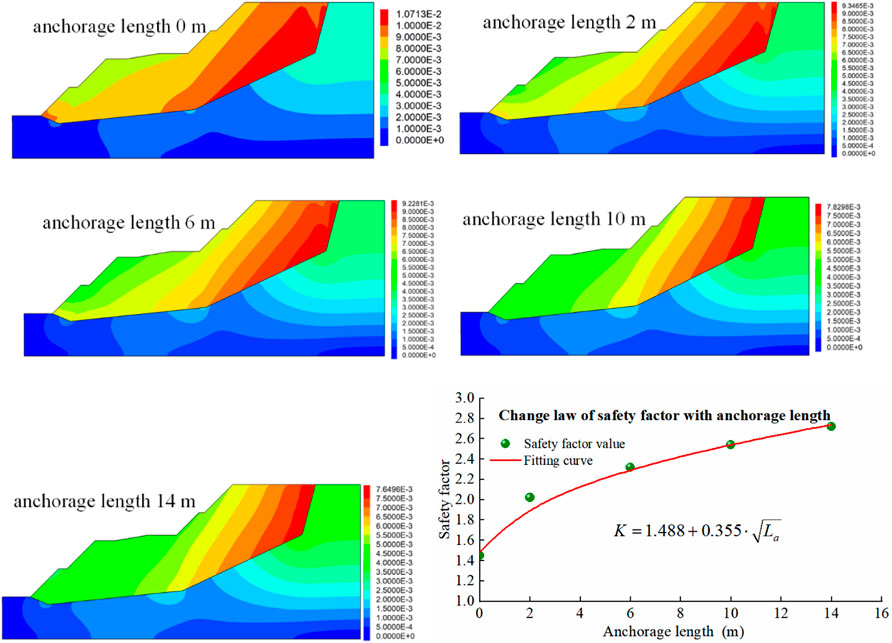
FIGURE 15. The distribution of displacement cloud and the change law of safety factor with different anchorage lengths.
According to Figure 14, with anchorage length becoming long, the deformation decreases in x- and y-direction, and the slope becomes stable. The increase of the displacement in the x-direction is approximately consistent with the increase of the anchorage length, and the two are linear. The increase of anchorage length can effectively enhance the integrity between the sliding surface and the rock mass, and the difference between the x-direction displacements is very small. Except for the M3 monitoring point, there is a large difference between the other displacements in the y-direction. This is because the M3 monitoring point is located in the approximate plane position of the slope. The displacement fluctuation in y-direction at the slope toe is large, and the deformation increment at other positions is basically linear with the anchorage length. The displacement increment in y-direction is smaller than that in x-direction. On the whole, the control effect of anchorage length on the displacement of slope in x-direction is greater than that in y-direction.
The displacement distribution is greatly affected by the anchorage length, and the displacement evolution forms are quite different, which as shown in Figure 15. Increasing the anchorage length, the displacement decreases. The anchorage length has little effect on the displacement distribution form, and the distribution characteristics are similar. The anchorage length improves the integrity of the sliding zone and the rock mass, so the displacement distribution on the rock mass gradually increases with anchorage length, especially at the top of the slope. The safety factor (K) increases gradually with the anchorage length, but the increase rate decreases gradually. The safety factor has a linear relationship with the square of anchorage length, and the correlation coefficient reaches 0.99. The specific function form is shown in Figure 15.
The anchoring force (Fa) of the anchor cable may be reduced due to precipitation, geological structure, artificial excavation, and other reasons. After the landslide phenomenon appeared, the anchoring force needs to be increased again, and the appropriate anchoring force is the premise to ensure the stability of the slope. To obtain the slope stability characteristics under different anchoring forces, the slope stability analysis under five anchoring forces (50kN, 200kN, 400kN, 600kN and 800 kN) is carried out. The anchorage length is 10 m, and the hydraulic gradient is 0.5. Under different anchoring forces, the x-direction, and y-direction displacements of each monitoring point of the slope change with depth as shown in Figure 16, and the displacement cloud map and safety factor of the slope change as shown in Figure 17.
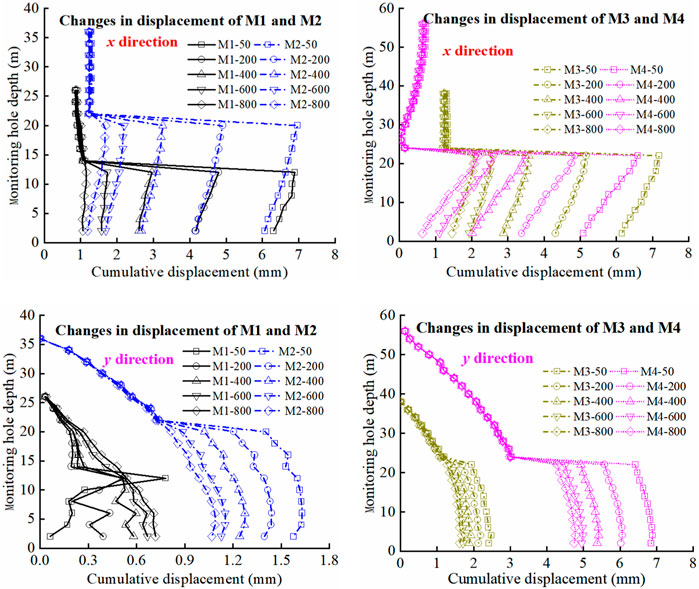
FIGURE 16. The change of displacement of each monitoring point with depth under different anchoring forces.
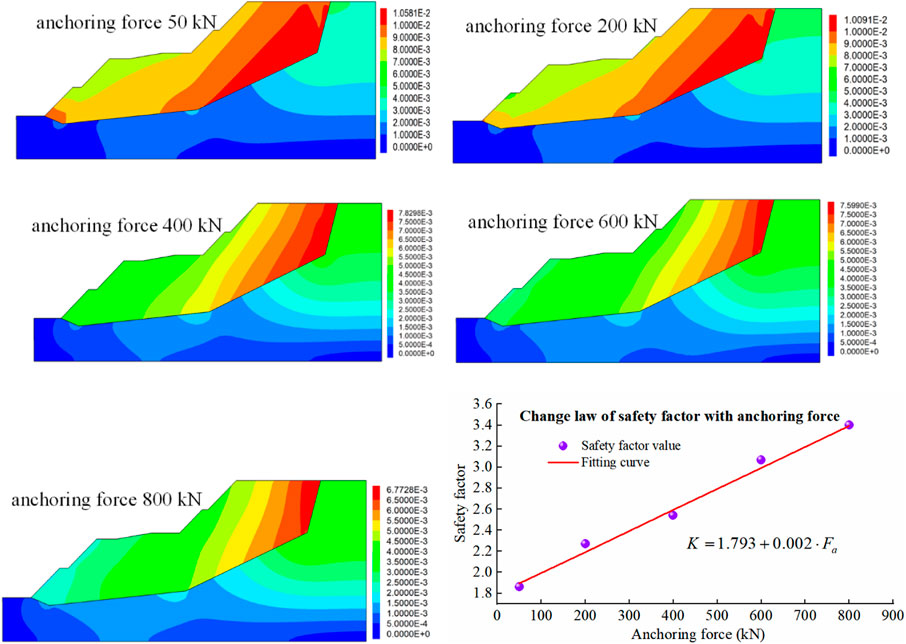
FIGURE 17. The distribution of displacement cloud and the change law of safety factor with different anchoring forces.
According to Figure Figure16, the displacement of each direction changes greatly when the anchoring force increases. With an increase in anchoring force, the maximum displacement in the x-direction gradually decreases, and the decrease is basically linear. The displacement difference in the x-direction from the foot to the waist is small, and the displacement of the top is the smallest. The displacement of the rock mass in the x-direction is basically the same. As the anchoring force increases, the y-direction displacement also gradually decreases. In addition to the top of the slope, the displacement in y-direction at other positions is less than the change in x-direction. So, the top of the slope is a position where the slope subsidence has a greater impact.
From Figure 17, the displacement distribution changes with the anchoring force, and the displacement difference of the limit state is large. When the anchoring force increases, the maximum displacement at the limit state decreases, but decreased magnitude decreases. Continue to increase the anchoring force, the maximum displacement will remain approximately constant when reaching a certain threshold. The safety factor (K) increases gradually with increasing anchoring force, and the amplitude is basically consistent. There is a linear relationship between the safety factor and the anchoring force, and the correlation coefficient reaches 0.98. The specific function form is shown in Figure 17.
The stability of the slope will be affected when the anchor cables fail at different positions. Take turns setting the anchoring force of four grades of slope to zero, the change of slope displacement and safety factor is obtained, and the influence of slope support at each grade on stability is obtained. The displacement distribution of different failure positions when the safety factor is reached is shown in Figure 18.
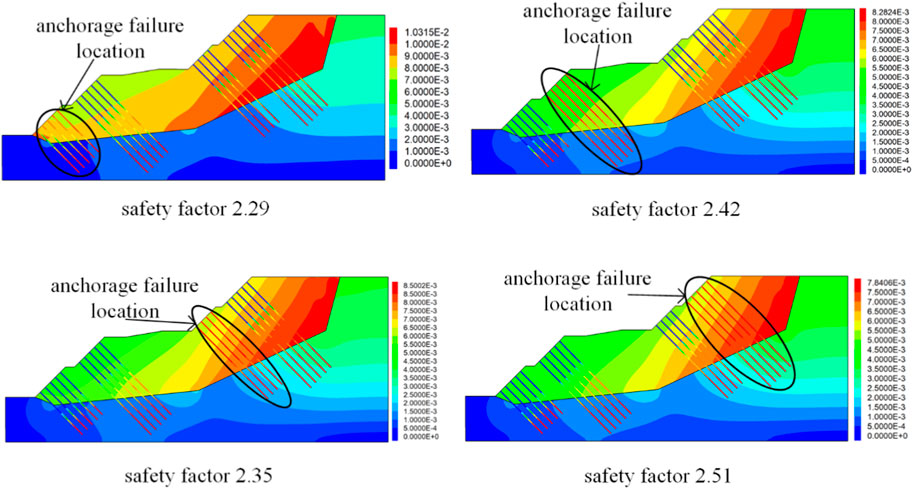
FIGURE 18. The displacement distribution of different failure positions when the safety factor is reached.
Through Figure 18, the safety factor of the slope is the smallest when the failure occurs on the first-grade slope. The first-grade slope reinforcement has the greatest influence on the overall stability. Since the horizontal displacement of the first-grade slope is the largest when it is not reinforced, and the horizontal displacement is much larger than the vertical displacement. The safety factor (K) decreases the least when the failure occurs on the fourth-grade slope, the failure of the fourth-grade slope has the least influence on the slope stability. The vertical deformation of the fourth-grade slope is large, while the horizontal deformation is small. When the slope landslide occurs, the horizontal displacement is the main. On the whole, the influence of the four grades slope on the stability is as follows: the first-grade slope is greater than the third-grade slope, the third-grade slope is greater than the second-grade slope, and the second-grade slope is greater than the fourth-grade slope.
In order to obtain the comprehensive influence of different influencing factors on slope stability, three levels are selected for the four factors, as shown in Table 4. The orthogonal test scheme is designed by orthogonal test method, and the numerical analysis is carried out to obtain the slope safety factor of each test scheme. The orthogonal test design of the influencing factors and the calculation results of the safety factor are shown in Table 5. Finally, the range analysis method is used to obtain the range distribution of each factor, as shown in Table 6.
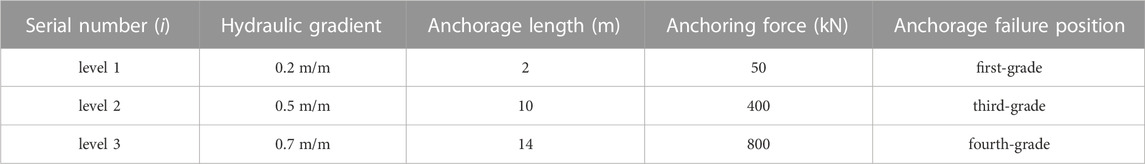
TABLE 4. Values of each level under different influencing factors.

TABLE 5. Orthogonal test design of influencing factors and safety factor results.
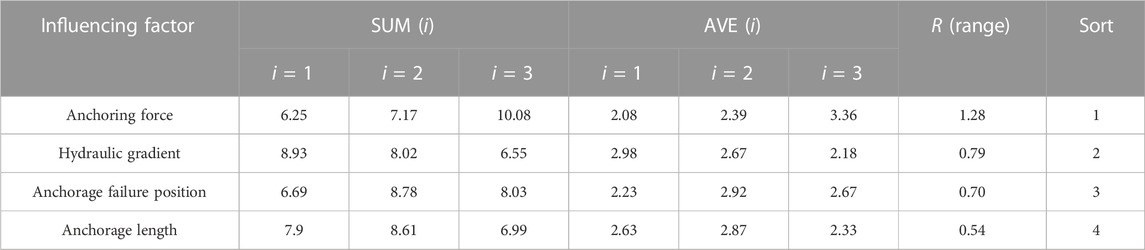
TABLE 6. Range analysis of orthogonal numerical test results.
Table 6 shows the range of four factors, namely, anchoring force, hydraulic gradient, anchorage failure position and anchorage length. Among the four factors, the range of anchoring force is the largest, that is, the change of this factor has the greatest influence on the stability of the slope. The range of hydraulic gradient is similar to that of anchorage failure position, but the range of hydraulic gradient is larger than that of anchorage failure position. Therefore, the influence of hydraulic gradient change on slope stability is slightly greater than that of anchorage failure position. The range of anchorage length is the smallest, so its influence on slope stability is the weakest among the four factors. According to the results of the range analysis, the weight of the factors affecting the overall stability of the slope is as follows: the anchoring force is greater than the hydraulic gradient, the hydraulic gradient is greater than the failure position, and the failure position is greater than the anchoring length.
In this paper, based on the monitoring results of a high-speed slope project, using the discrete element analysis, considering the influence of hydraulic gradient, anchorage length, anchoring force and failure position, the stability of reinforced slope is studied. The main conclusions can be drawn as follows:
1) With the increase of depth above sliding surface, the horizontal displacement increases slightly, and the vertical displacement decreases slightly. The horizontal displacement is greater than the vertical displacement. The maximum horizontal displacement appears at the slope toe, and the maximum vertical displacement appears at the slope top. The main causes of slope instability are stratum lithology and geological structure, topography, rain, and engineering activities.
2) In the reinforcement measures, changing the slope rate reduces the thrust of the slope. The anchor cable can increase the bond strength, and effectively control the deformation and maintain the stability of the slope. Drainage can effectively reduce the hydraulic gradient of the stagnant water layer on the sliding surface. After reinforcement, the slope is in a stable state.
3) Both horizontal and vertical displacements increase with the increase of hydraulic gradient. The hydraulic gradient has a great influence on the horizontal slip characteristics, and the safety factor decreases in a power function with an increase in hydraulic gradient. With anchorage length becoming lager, the deformation decreases, and the stability increases. The anchorage length has a greater control effect on the horizontal displacement. The safety factor increases nonlinearly with the anchorage length.
4) As the anchoring force increases, the deformation gradually decreases. The anchoring force has a more obvious inhibitory effect on horizontal displacement. The safety factor increases linearly with the anchoring force. According to the change rule of safety factor, the influence of anchorage failure position on the stability of the fourth grades slope is as follows: the first-grade slope is greater than the third-grade slope, the third-grade slope is greater than the second-grade slope, and the second-grade slope is greater than the fourth-grade slope.
In this paper, according to the results of geological exploration, the causes of landslide are obtained, and the landslide is reinforced by changing the slope rate, drainage, and prestressed anchor cable. According to the monitoring results of plane deep displacement of different slopes, the deformation characteristics of slopes before and after reinforcement are analyzed. The finite element method is used to analyze the characteristics of the slope before and after reinforcement, and the actual engineering results are compared. At the same time, the stability evolution law of the slope is analyzed when the hydraulic gradient, anchorage length, anchorage force and anchorage failure position change. The research results have engineering background and are basically consistent with the actual results of the project, which can provide an effective reference for the design of subsequent slope reinforcement strategies.
In the future, the author will carry out research on the reliability of seepage slope reinforcement methods to provide a more reasonable basis for slope reinforcement. The weakening effect of water in micro-fissures will have a great influence on the mechanical properties of slope rock mass, which will also be an important aspect of the author‘s future research.
The original contributions presented in the study are included in the article/supplementary material, further inquiries can be directed to the corresponding author.
WC: Conceptualization, Data curation, Formal Analysis, Investigation, Software, Writing–original draft, Writing–review and editing. NS: Conceptualization, Formal Analysis, Funding acquisition, Resources, Supervision, Visualization, Writing–original draft, Writing–review and editing.
The author(s) declare financial support was received for the research, authorship, and/or publication of this article. This study is supported by the National Science Fund (51304068) and the China Postdoctoral Science Foundation (2018M632574).
Author WC was employed by Guangdong Communication Planning and Design Institute Group Co., Ltd. and NS was employed by Shenzhen Municipal Engineering Corporation.
All claims expressed in this article are solely those of the authors and do not necessarily represent those of their affiliated organizations, or those of the publisher, the editors and the reviewers. Any product that may be evaluated in this article, or claim that may be made by its manufacturer, is not guaranteed or endorsed by the publisher.
Das, S., Chakraborty, M., Chakraborty, S., Skukla, A., and Acharya, R. (2020). Experimental studies of ka band rain fade slope at a tropical location of India. Adv. Space Res. 66, 1551–1557. doi:10.1016/j.asr.2020.06.014
Deng, D. P., Li, L., and Zhao, L. H. (2019). Stability analysis of slopes under groundwater seepage and application of charts for optimization of drainage design. Geomechanics Eng. 17, 181–194. doi:10.12989/gae.2019.17.2.181
Feng, W. L., Zou, D. J., Wang, T., Qiao, C. S., and Xu, S. F. (2023). Study on a nonlinear shear damage constitutive of structural plane and application of discrete element. Comput. Geotechnics 155, 105190. doi:10.1016/j.compgeo.2022.105190
Gao, X., Cheng, B., Tian, W., Zhang, Z., Li, J., and Qi, H. (2020). Simulation parameter selection and steady seepage analysis of binary structure slope. Water 12, 2747. doi:10.3390/w12102747
Geng, J. S., Sun, Q., Zhang, Y. C., Yan, C. G., and Zhang, W. Q. (2017). Electric-field response based experimental investigation of unsaturated soil slope seepage. J. Appl. Geophys. 138, 154–160. doi:10.1016/j.jappgeo.2017.01.023
Hu, Z., Yang, Z. X., Guo, N., and Zhang, Y. D. (2022). Multiscale modeling of seepage-induced suffusion and slope failure using a coupled FEM–DEM approach. Comput. Methods Appl. Mech. Eng. 398, 115177. doi:10.1016/j.cma.2022.115177
Kim, M. S., Onda, Y. C., Uchida, T., Kim, J. K., and Song, Y. S. (2018). Effect of seepage on shallow landslides in consideration of changes in topography: case study including an experimental sandy slope with artificial rainfall. CATENA 161, 50–62. doi:10.1016/j.catena.2017.10.004
Ministry of Water Resources of the People's Republic of China (2008). Code for geological survey of water Resources and hydropower engineering. Beijing: China Planning Press.
Nishimura, S., Takeshita, Y., Nishiyama, S., Suzuki, S., Shibata, T., Shuku, T., et al. (2020). Disaster report of 2018 July heavy rain for geo-structures and slopes in Okayama. Soils Found. 60, 300–314. doi:10.1016/j.sandf.2020.01.009
Orense, R., Farooq, K., and Towhata, I. (2001). Deformation behavior of sandy slopes during rainwater infiltration. Soils Found. 44, 15–30. doi:10.3208/sandf.44.2_15
Saada, Z., Maghous, S., and Garnier, D. (2012). Stability analysis of rock slopes subjected to seepage forces using the modified Hoek–Brown criterion. Int. J. Rock Mech. Min. Sci. 55, 45–54. doi:10.1016/j.ijrmms.2012.06.010
Sun, G. H., Wang, W., and Shi, L. (2021). Steady seepage analysis in soil-rock-mixture slope using the numerical manifold method. Eng. Analysis Bound. Elem. 131, 27–40. doi:10.1016/j.enganabound.2021.06.017
Thomas, J., Gupta, M., and Prusty, G. (2023). Assessing global parameters of slope stability model using Earth data observations for forecasting rainfall – induced shallow landslides. J. Appl. Geophys. 212, 104994. doi:10.1016/j.jappgeo.2023.104994
Tu, G. X., and Deng, H. (2020). Characteristics of a deep-seated flexural toppling fracture and its relations with downcutting by the Lancang River: a case study on a steeply dipping layered rock slope, Southwest China. Southwest China. Eng. Geol. 275, 105754. doi:10.1016/j.enggeo.2020.105754
Wang, S. T., Yang, X. L., Huang, F., and Pan, Q. J. (2021). Three-dimensional upper-bound analysis of rock slopes subjected to seepage forces based on Hoek-Brown failure criterion. Comput. Geotechnics 138, 104310. doi:10.1016/j.compgeo.2021.104310
Xu, J. W., Ueda, K., and Uzuoka, R. (2022). Numerical modeling of seepage and deformation of unsaturated slope subjected to Post-Earthquake rainfall. Comput. Geotechnics 148, 104791. doi:10.1016/j.compgeo.2022.104791
Yang, H., Wu, Q. H., Dong, J. H., Xie, F. H., and Zhang, Q. X. (2023). Landslide risk mapping using the weight-of-evidence method in the datong mining area, qinghai province. Sustainability 15, 11330. doi:10.3390/su151411330
Yang, T. S., Ma, F. Y., Xia, G., Sun, B. Q., and Shi, C. (2022). Numerical simulation of deformation and failure mechanism of miscellaneous fill slope under rainstorm. J. Hebei Univ. Technol. 51, 94–100. doi:10.14081/j.cnki.hgdxb.2022.03.013
Zhang, Y. S., Chen, J. P., Zhou, F. J., Zhang, W., Yan, J., Li, Y., et al. (2023). A novel approach to investigating 3D fracture connectivity in ultrahigh steep rock slopes. Int. J. Rock Mech. Min. Sci. 161, 105291. doi:10.1016/j.ijrmms.2022.105291
Keywords: numerical modelling, slope stability, slope stabilization, seepage slope, landslide mitigation
Citation: Chengzhong W and Shuangjian N (2023) Engineering analysis and numerical study on stability evaluation of seepage slope reinforcement stability of Yunmao expressway. Front. Mater. 10:1269175. doi: 10.3389/fmats.2023.1269175
Received: 29 July 2023; Accepted: 02 October 2023;
Published: 13 October 2023.
Edited by:
Giovanni Ettore Gigante, Sapienza University of Rome, ItalyReviewed by:
Rijalul Fikri, International Islamic University Malaysia, MalaysiaCopyright © 2023 Chengzhong and Shuangjian. This is an open-access article distributed under the terms of the Creative Commons Attribution License (CC BY). The use, distribution or reproduction in other forums is permitted, provided the original author(s) and the copyright owner(s) are credited and that the original publication in this journal is cited, in accordance with accepted academic practice. No use, distribution or reproduction is permitted which does not comply with these terms.
*Correspondence: Wang Chengzhong, dGFuZ3cxMjM0NTZAc2luYS5jb20=
Disclaimer: All claims expressed in this article are solely those of the authors and do not necessarily represent those of their affiliated organizations, or those of the publisher, the editors and the reviewers. Any product that may be evaluated in this article or claim that may be made by its manufacturer is not guaranteed or endorsed by the publisher.
Research integrity at Frontiers
Learn more about the work of our research integrity team to safeguard the quality of each article we publish.