 Ming Deng
 Ju Yi
Ju Yi
94% of researchers rate our articles as excellent or good
Learn more about the work of our research integrity team to safeguard the quality of each article we publish.
Find out more
ORIGINAL RESEARCH article
Front. Mater., 05 June 2023
Sec. Structural Materials
Volume 10 - 2023 | https://doi.org/10.3389/fmats.2023.1208363
This article is part of the Research TopicMultiscale Characterization of Advanced Pavement MaterialsView all 10 articles
In recent years, the ultra-high performance concrete (UHPC) has been increasingly used to strengthen orthotropic steel decks (OSD) to solve the cracking problems at fatigue-prone details and pavement damage. In this paper, the fatigue life of a cable-stayed orthotropic steel decks bridge under stochastic traffic loads is calculated before and after the orthotropic steel decks strengthened with the ultra-high performance concrete layer. The traffic data of the real bridge for 1 week is first obtained based on the weigh-in-motion system. Then, a stochastic traffic load on the bridge is simulated for its service life by the Monte Carlo method. A fatigue life analysis framework, which includes the traffic load simulation, a refined finite element model, the S-N curve and Miner linear cumulative damage criterion, is proposed for fatigue life prediction of orthotropic steel decks. For the bridge before reinforcement, the predicting results for the fatigue life of three fatigue-prone details, including the scallop cutout, rib-to-diagram and rib-to-deck joint are basically consistent with that of the actual bridge inspection results. After strengthening by ultra-high performance concrete, the fatigue life of the three structural details are increased from 15.87, 13.89, and 32.26 years to more than 100 years, respectively, as compared with the original orthotropic steel decks structure.
The orthotropic steel deck (OSD) has been widely used in bridge engineering due to its good integrity, light weight, high strength, and good applicability when comparing with the traditional concrete bridge deck, especially in the long-span cable-stayed bridges (Hu et al., 2014). Generally, the OSD consists of bridge deck, longitudinal and transverse stiffening ribs that jointly bear vehicle loads. With the fast-growing in traffic loads, some fatigue problems, however, are becoming increasingly prominent in the OSD (Walter et al., 2007; Chen et al., 2015; Fisher and Barsom, 2016). These problems may be attributed to large local deformation and serious stress concentration under the heavy load. Other factors, such as welding residual stress, poor construction quality, can also be the reasons to induce fatigue problems. In addition, the pavement of the bridge may be subjected to an easier cracking, debonding and other diseases under the wheel load. Consequently, the serviceability and safety of the bridge may be significantly deteriorated.
Several measures have been conducted by researchers to reinforce the OSD, including drilling holes to change the stress field intensity distribution at the crack tip (Choi and Kim, 2008), local structural reinforcement (May et al., 2015; Wang et al., 2015), and SPS combination reinforcement (Jong, 2007). These measures, however, may have limited positive effect on solving the fatigue cracking because the reinforcement effect on the local stiffness of OSD is still low in these cases. The bridges crack may crack again shortly after strengthening. Therefore, other measures need to be proposed to effectively increase the stiffness of the OSD. For this purpose, a kind of ultra-high performance concrete (UHPC) pavement was put forward by pouring it on the bridge deck (Jong, 2007; Zhang et al., 2023). It is widely known that, as a new type of fiber reinforced cement-based composite material, the UHPC owns outstanding characteristics such as ultra-high strength, ultra-high toughness and excellent durability, etc. As a result, a composite structure composed by the original OSD and UHPC is compactly formed through densely distributed shear nails. The steel-UHPC composite structure is not only used in new construction projects (Zhang et al., 2016), but also has been widely used in reinforcement projects, such as Yangtze River Bridge in China (Qin et al., 2022), Tianjin Haihe Bridge in China (Wang et al., 2020). After the strengthening of UHPC, an improvement of the fatigue resistance of the OSD can be expected.
A number of studies about the fatigue resistance of steel-UHPC composite structures have been conducted by several researchers. Deng (Deng et al., 2021) calculated the fatigue reliability of OSD-UHPC composite bridge based on reliability and fatigue cumulative damage model, and the results showed that the fatigue life of OSD-UHPC composite structure is prolonged at least 60%. Yuan (Yuan et al., 2019) studied the repair process of UHPC to the fatigue crack of the OSD specimen through full-size model test, the effectiveness of UHPC to improve the fatigue life of the OSD is also verified through the linear accumulative damage rule. Dieng et al. (2013) found that the UHPC pavement, as compared with the traditional asphalt mixture, can reduce the stress amplitude of the details. The above studies show that the fatigue life of composite structures is greater than that of the OSD, and most of these researches are conducted based on finite element simulation or laboratory experiments. The stress of these cases, however, may differs from that of the real bridge. Besides, other experimental researches are conducted on predicting the fatigue life of real steel-UHPC composite bridge (Zhu et al., 2019; Qin et al., 2022). Among them, the stress under random traffic flow is continuously monitored by arranging strain gauges in typical structural details. For this case, the number of measuring points monitored in the real bridge is limited, and errors on stress monitoring may be unable to avoid due to the influence of the environment, thus affecting the accuracy of fatigue life calculation. More effective methods are needed to calculate the fatigue life of the real bridge. This paper aims to study the fatigue life of a steel bridge strengthened by UHPC under the stochastic traffic loads, which is simulated based on the traffic flow data measured by the weigh-in-motion (WIM) system.
The fatigue performance of OSD strengthened with UHPC under stochastic traffic load is evaluated in this paper. The paper is organized as follows. First, some basic information of the bridge, the main diseases and the reinforcement scheme based on UHPC are introduced. Then, a fatigue life assessment process of typical fatigue-prone details of the OSD under stochastic traffic loads is proposed. Following that, the fatigue life of three structural details is calculated. The strengthening effect is validated by comparing the fatigue life before and after strengthening, and some conclusions are summarized.
Haihe Bridge is a bridge closed to the Tianjin port, China. It is a hybrid beam single tower cable-stayed bridge with a total length of 500 m and a main span of 310 m. The main span is composed of 290 m steel box girder and 20 m steel-concrete joint section, and the side spans are prestressed concrete box girder. The bridge deck is supported by 36 pairs of stay cables, and the cable spacing on the beam is 16 m. The layout of the bridge is shown in Figure 1A. The total width of the steel girder is 23 m, and the distance between each pair of stay cables on the bridge deck is 22.3 m. The thickness of the deck, webs, diaphragm are 14, 14, 10 mm, respectively. In transverse bridge direction, the steel box girder is formed by a double cell box and an opening section, each part has 12 U-ribs. The width of the U-rib is 300 mm, and the spacing between adjacent U-ribs is 300 mm too. The girder is provided with a diaphragm every 3.2 m. The deck pavement of steel box girder is modified asphalt concrete with 70 mm thick. Figure 1B shows the schematic diagram of the cross section.
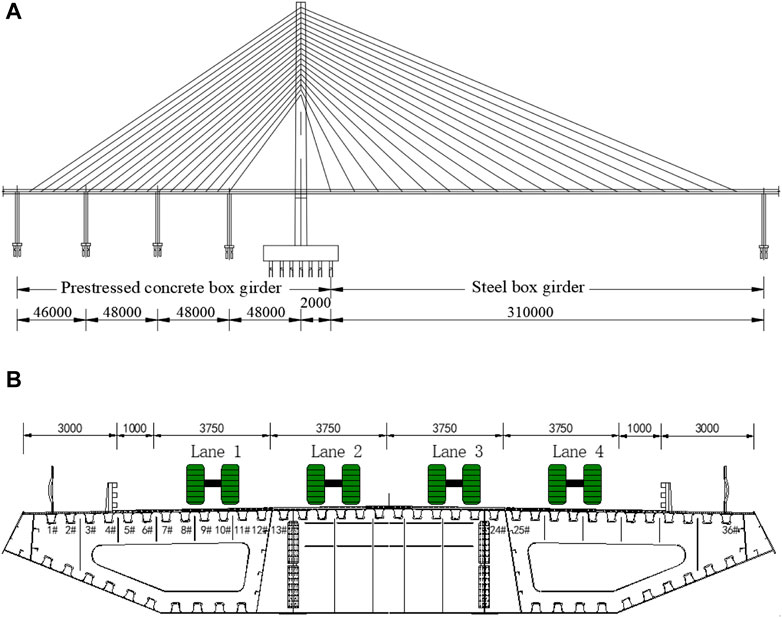
FIGURE 1. Basic information of the Haihe Bridge: (A) layout of the bridge (unit: mm), (B) cross-section (unit: mm).
The Haihe Bridge was completed and opened to traffic in 2002. It was originally designed as a four-lane bidirectional traffic. The traffic is heavy on this bridge, especially the number of trucks, as it is located in a busy port area. In order to alleviate the traffic pressure, a new bridge was built next to the bridge in 2011, and the traffic of the old bridge was changed to one-way four-lane traffic. The research object of this paper is the old bridge opened to traffic in 2002.
There are two types of typical fatigue diseases in bridge under long-term heavy loads. The first disease is the pavement damage, such as longitudinal cracking and steel–concrete interface debonding. The disease of asphalt pavement may be related to the compaction and stress state (Chang et al., 2023). For example, in the transverse direction of the bridge, the web of the U rib can be regarded as the fulcrum of the steel deck. Therefore, the negative bending moment is easily generated at the intersection point between the U rib and the bridge deck under vehicle loads. As a result, longitudinal cracks are occurred in bridge pavement under cyclic load. Through detailed inspection, it was found that there were nearly twenty longitudinal cracks in the asphalt pavement of Haihe bridge, which was consistent with the width and spacing of U-ribs, as shown in Figure 2. In addition, the rainwater will reach the bottom of the pavement along the cracks, which is prone to cause the bond failure in steel–concrete interface under the vehicle braking force.
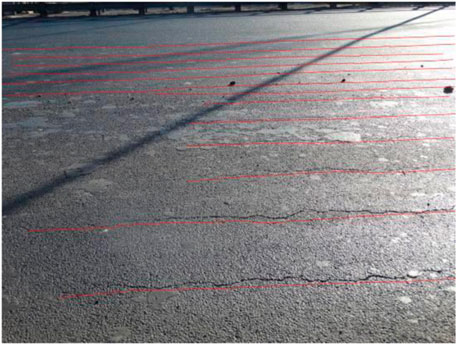
FIGURE 2. Longitudinal cracking on the asphalt pavement.
The second type is the cracking of the OSD. The cracking generally appeared under the coupled effects of low stiffness of OSD and numerous heavy trucks, leading to large stress amplitudes in some typical locations of the bridge. Consequently, some fatigue cracks, as shown in Figure 3, generated inevitably. By the end of 2014, the total number of cracks in Haihe Bridge had exceeded 1,400 and the total length had exceeded 6,700 cm. Figure 4 shows the typical cracks in Haihe bridge. In the transverse direction, these cracks are mainly concentrated between 6 # U ribs and 30 # U ribs, which are under lane 2 and lane 3.
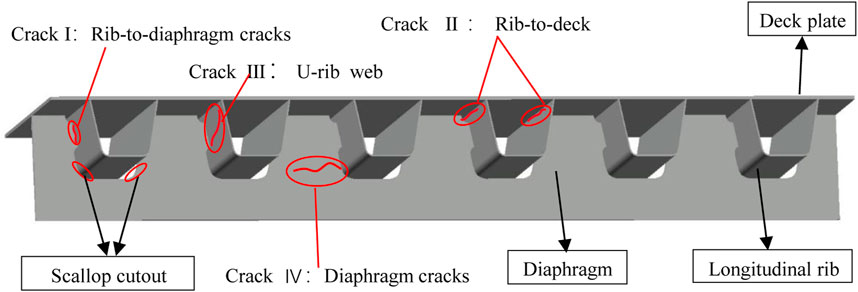
FIGURE 3. Welded details and cracking position.
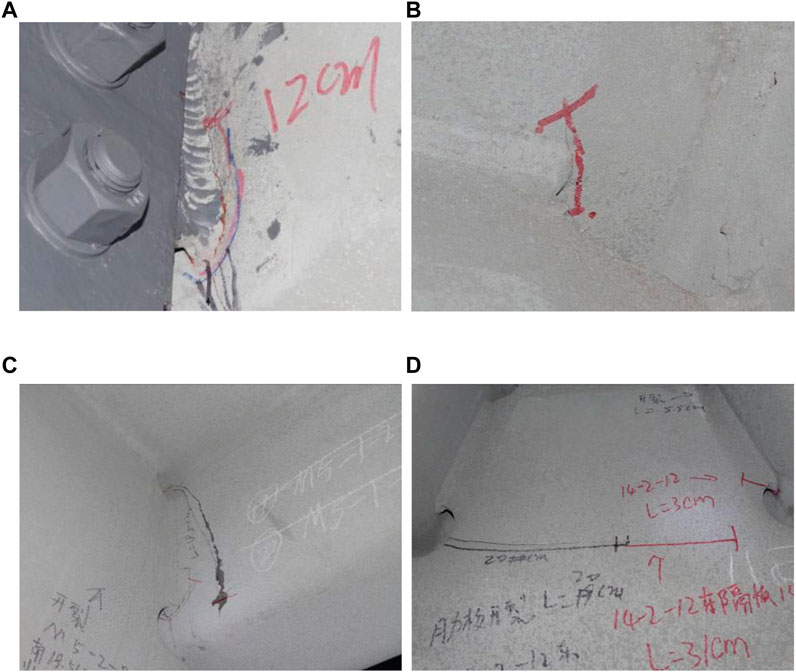
FIGURE 4. Typical cracks: (A) rib-to-diaphragm cracks, (B) rib-to-deck cracks, (C) U-rib cracks and (D) diaphragm cracks.
Since 2005, the Haihe Bridge had been strengthened for more than ten times, including drilling holes, bonding steel plates, replacing bridge deck pavement, etc., but the disease was still developing. The above phenomenon showed that the direct repair method of steel box girder cracks and the replacement of flexible pavement system cannot change the problem of inadequate stiffness of OSDs. The stress state of the typical structural details and bridge pavement had not changed after strengthening, which was bound to cause the damage continue propagating under the load of heavy vehicles.
A layer of UHPC was added to the steel deck to improve the rigidity of the OSD. UHPC is a new type of cement-based composite material, mainly composed of quartz fine sand, silica fume, cement, quartz powder, and a certain amount of steel fibers. The most typical characteristic of UHPC is its ultra-high strength, with a compressive strength of up to 150–250 MPa and a tensile strength of around 10 MPa.
The main reinforcement scheme of the bridge includes the following: 1) UHPC pavement was adopted within 17.5 m in the transverse direction of the traffic lane. After applying 80 thick epoxy zinc rich paint to the bridge deck, a shear nail with a diameter of 13 mm and a height of 40 mm is welded to the bridge deck. The spacing between shear nails in both transverse and longitudinal directions is 150 mm. The thickness of UHPC layer was 45 mm, with a waterproof adhesive layer and an asphalt pavement layer with the thickness of 30 mm on it. 2) Considering that the weight of UHPC-asphalt pavement on the traffic lane is greater than that of the original asphalt pavement, the area out of the traffic lane is paved with a synthetic rubber layer with 13 mm in thickness. As a result, the dead load of bridge is basically unchanged after reinforcement. A schematic diagram of the pavement configuration is shown in Figure 5.
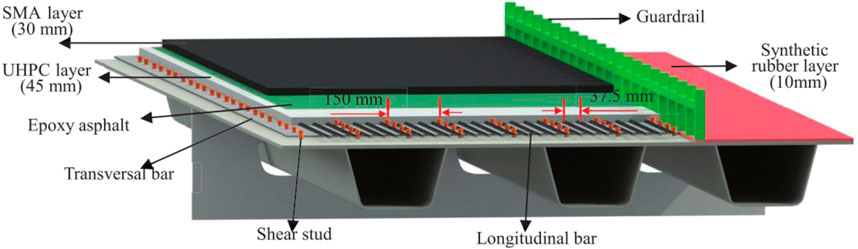
FIGURE 5. Schematic diagram of the pavement configuration.
A systematic procedure for fatigue life prediction of the fatigue-prone details in OSD is proposed, as schematically in Figure 6. First, the axle load, speed, lane and other information of the vehicle are extracted from the measured traffic load data, and the long-term traffic load is simulated using Monte Carlo method. Second, a local refined three-dimensional finite element model is established, which is loaded by a unit load to generate the stress influence surface of fatigue-prone details, then the stress history is obtained by means of influence surface loading. Next, according to the rain-flow counting method, the stress spectrum of the fatigue-prone detail under the stochastic traffic loads is obtained. Finally, according to the Miner linear cumulative damage criterion and the classifications of detailed categories in S-N curves, the fatigue life of the fatigue-prone details is calculated.
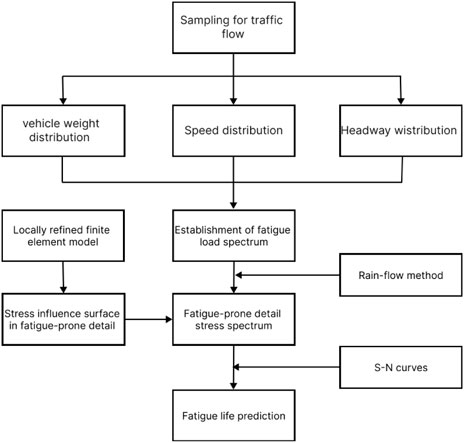
FIGURE 6. Flow chart of fatigue life assessment.
Monte-Carlo simulation is one way for solving mathematical or physical problems based on random sampling method (Chang et al., 2023). It is an uncertain numerical method, and is often used in the simulation of stochastic traffic loads. The following is the basic idea of the method.
Let U be a uniform random variable between [0–1], that is U ∼ R (0,1). Then the random variable X generated by
Therefore, the random variable X generated by
When the statistics of the traffic vehicle loads are known, the corresponding vehicles can be generated by Monte-Carlo simulation. In computer simulation, a group of random numbers is first generated. When the seed of the sequence is determined, all the numbers in the sequence are determined. Therefore, such random numbers are usually called pseudorandom numbers. For normal distribution, the generation of pseudorandom number can use the Box Muller method (Giray and Ahmet, 2011). As long as there are two random variables U1 and U2 that obey uniform distribution, a random variable X that obey normal distribution can be obtained through Formula 3:
Two aspects are mainly considered in traffic load simulation: the loading position and the weight of wheels. The loading position of the wheel is mainly determined by the vehicle speed, headway, wheelbase; while the weight of the wheel is mainly determined by the vehicle loads and axle weight ratio.
Monte Carlo simulation is performed for each lane in every half an hour, as shown in Figure 7. After counting the traffic flow of each lane within half an hour, the first vehicle is simulated. Firstly, the mean μs and variance σs of headway are obtained from traffic flow data statistics, and the headway of vehicles is sampled from these two parameters by inverse function method. Then the vehicle speed is simulated by using the mean μV and variance σV of the vehicle speed in the lane. Next, according to the proportion of each type of vehicle in the half hour, select the model of the simulated vehicle, and get the corresponding axle weight ratio and wheelbase. Finally, the total vehicle weight is sampled according to its vehicle weight distribution, and then the axle weight of each axle is determined from the previous step. Repeat the above steps, continuously simulate the vehicle information of each lane at each time, and the traffic flow within half an hour is simulated. It is assumed that the traffic data in the life cycle is unchanged, then repeat the simulation steps to get the stochastic traffic flow for a day, a week or even a life cycle.
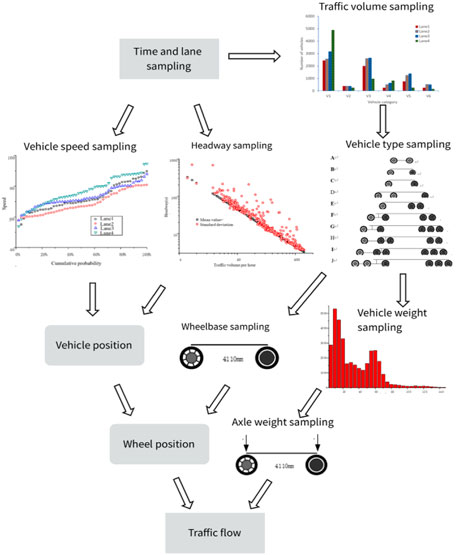
FIGURE 7. Monte-Carlo simulation for traffic flow.
It is necessary to use the finite element software to establish the structural analysis model to calculate the stresses of the fatigue-prone details of OSD. Previous studies (Li et al., 2009; Yan et al., 2016) have shown that the fatigue-prone details have large stress when the load is applied to a small area near the details, and are not sensitive to the load outside the area. In the longitudinal direction, this area is approximately within 2 m around the fatigue-prone details. Along the transverse direction, the affected areas are roughly within the adjacent trapezoidal ribs. Therefore, a local refined finite element model can be established, which can reduce the calculation time and have high calculation accuracy. Then, the stress influence surface of fatigue-prone details can be generated based on the local refined finite element.
The stress change history of each fatigue-prone detail can be obtained by simulating the movement process of the vehicle on the influence surface. According to the simulation of vehicle speed and headway, record the vehicle position at an interval of 0.02 s. For those falling within the effective range of the influence surface, calculate the stress effect of the vehicle according to the corresponding influence surface value and vehicle axle loads. The superposition of the load effect of all vehicles falling into the effective range of the stress influence surface is the traffic load effect of the concerned fatigue-prone details at that moment. The stress history of each detail can be obtained by recording the load effect in chronological order.
Before the fatigue analysis, it is necessary to convert the time-varying random stress history curve into multiple constant amplitude stress cyclic loads, whose combination is called stress spectrum. Then count the damage of each constant amplitude cyclic loading in the stress spectrum to obtain the total fatigue damage.
The rain-flow counting method is widely used to obtain the stress spectrum by counting the stress history curve. After studying the stress-strain process of fatigue loading, scholars Matsuishi and Endo (Socie, 1982) proposed that each stress closed-loop formed during the loading process constitutes a stress cycle, and the shaded part as shown in Figure 8 constitutes a stress cycle. The method of identifying the stress cycle can be visually seen as the process of rain falling down the roof, so it is called rain flow method.
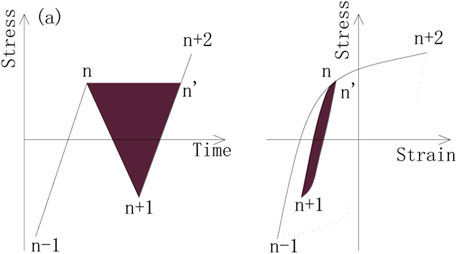
FIGURE 8. Identification of stress cycles.
In this paper, the four peak-to-valley rain-flow counting method is adopted. This method is to judge whether there is a complete cycle in the four adjacent peaks and valleys, and the mathematical model is as follows:
where N is the length of the peak-valley value sequence.
If the points xn and xn+1 meet the above criteria, the two points can be recorded as a complete fatigue cycle and then deleted from the peak-valley value sequence, so that the adjacent two points xn-1 and xn+2 can be further re-selected in the remaining sequence to form a new four-point range. Repeat the above process until all ranges meeting the four peak-to-valley criteria are recorded and deleted from the sequence.
The fatigue of steel bridges belongs to the category of variable amplitude, low stress and high cycle. The analysis method based on S-N curve and Miner linear cumulative damage criterion is usually adopted. The current design codes such as AASHTO, BS5400 and Eurocode 3 have adopted the method of modifying the S-N curve obtained from the constant amplitude fatigue test data, and formulated the S-N curve applicable to the fatigue-prone details of steel bridges.
The Eurocode (Eurocode, 1993) provides a series of S-N curves for fatigue life assessment, these curves show the relationship between the stress range and cycle life for different details, as shown in Figure 9. These curves are divided into 3 segments, and the formulas are as follows:
where
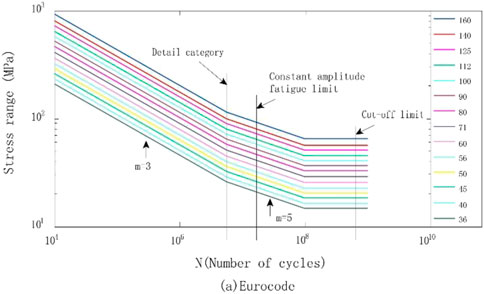
FIGURE 9. S-N curves in Eurocode.
The Miner linear cumulative damage criterion considers that fatigue is the linear accumulation of fatigue damage caused by different stress levels Δσi and their number of actions
where
where L is the fatigue life.
In May 2015, the WIM system was installed for Tianjin Haihe Bridge. The system was installed on the approach road of Haihe Bridge. Each lane was grooved and buried with a piezoelectric sensor, as shown in Figure 10. The traffic loads were monitored for 7 consecutive days from June 17 to 23, 2015. The monitoring contents included traffic time, vehicle speed, vehicle length, vehicle weight, axle number, axle load, etc. The statistical parameters of vehicle load are shown in Table 1. As the design load is 55 tons, the actual traffic load far exceeds the design limit value.

FIGURE 10. Weigh-in-moton system.
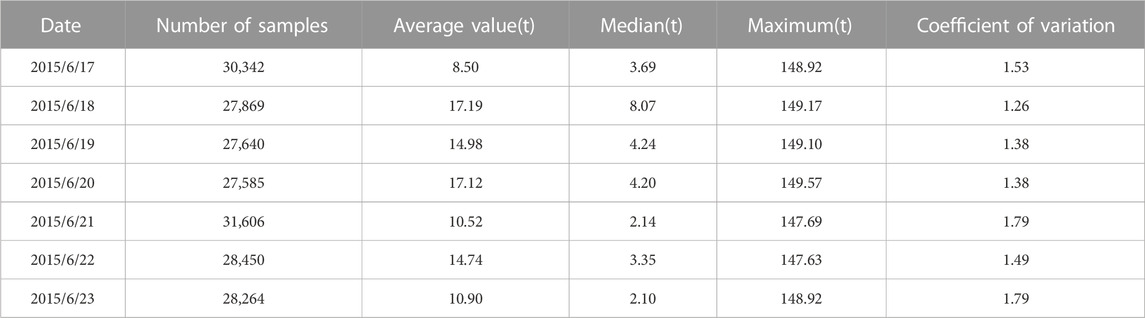
TABLE 1. Statistical parameters of vehicle load.
According to the one-week monitoring data of Haihe Bridge (Deng et al., 2017), traffic vehicles can be divided into two categories: cars and trucks. Among them, cars accounted for 43.2% and trucks accounted for 56.8%. It can be seen that there is a large proportion of trucks as the bridge is located in the port area. There are mainly five types of trucks, including 2-axle, 3-axle, 4-axle, 5-axle and 6-axle, of which 3-axle and 5-axle trucks account for the largest proportion. The passenger cars are recorded as V1, and the 2-axle∼6-axle trucks are recorded as V2∼V6 respectively. The ratio of various types of vehicles is shown in Figure 11. Figure 12 shows the traffic flow data of different lanes. It can be found that different types of vehicles have preferences for lanes. Among them, cars tend to use the inner lane because of their fast speed, while trucks tend to drive in the middle two lanes. This also led to more cracks in the steel structure under the middle lanes.
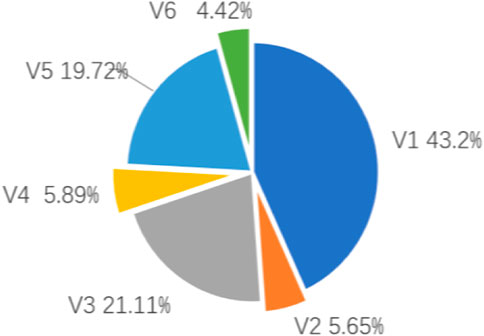
FIGURE 11. Probability densities of vehicle type.
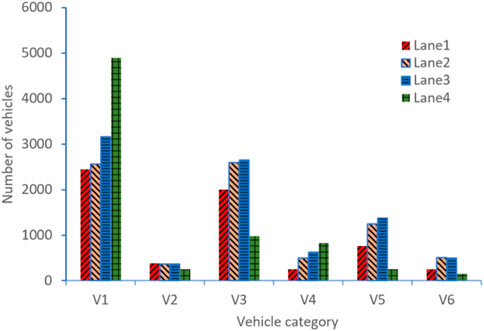
FIGURE 12. Traffic flow of different vehicle types in each lane.
The transverse position of the vehicle has an important influence on the stress response of the structural details. However, it is difficult to monitor the accurate transverse position by the WIM system. Therefore, the probability model of the lateral position of the wheel in China’s Code for Design of Steel Structures of Highway Bridges (Ding, 2015) is selected in this paper, as shown in Figure 13.
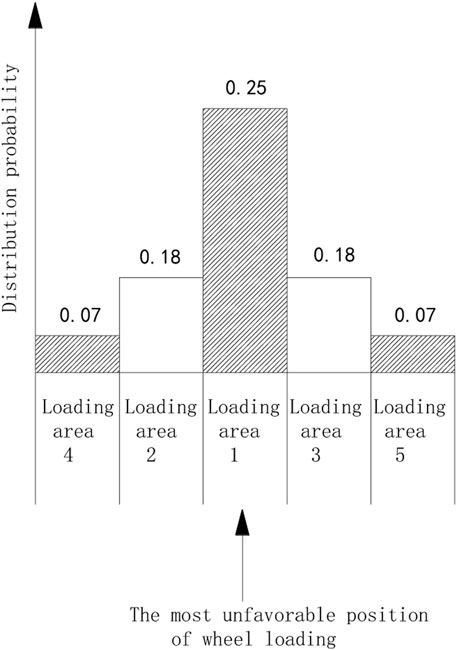
FIGURE 13. Transversal positions probability of wheel.
It is generally believed that the vehicle speed follows the normal distribution
Figure 14A shows the probability distribution law of the average speed. It can be seen that the speed on each lane is approximately uniformly distributed, so the uniform distribution can be used to simulate the average speed
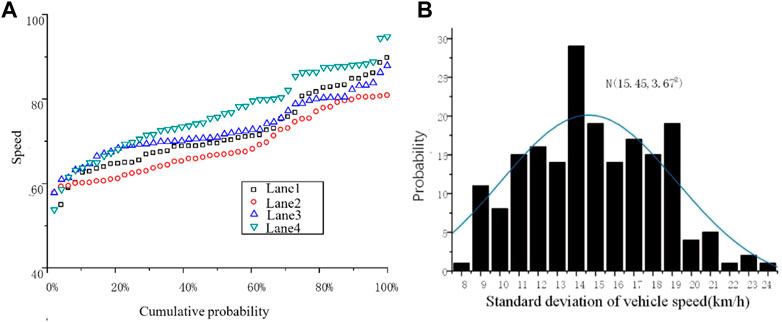
FIGURE 14. Probability distribution of mean and standard deviation of vehicle speed: (A) Mean and (B) Standard deviation.
The headway and vehicle speed jointly determine the loading position of the vehicle, which are important parameters to be considered in the simulation. The distribution of headway is relatively complex, which is related to many factors such as traffic operation status, road type and traffic flow time density. Existing studies believe that the headway follows exponential distribution (Panichpapiboon, 2015), and the average μs and standard deviation σs are also random variables.
Figure 15 shows the relationship between the statistical parameters of headway and the hourly traffic volume in the double logarithmic coordinate system. It can be seen that in the double logarithmic coordinates, the mean value and standard deviation of headway are approximately linear, in which the data of the mean value are very regular, while the data of the standard deviation are relatively discrete.
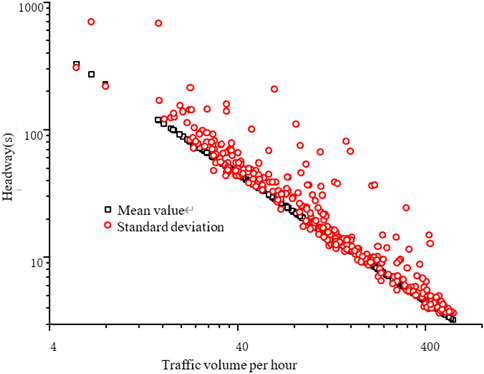
FIGURE 15.
The fitting formulas for the mean and standard deviation of headway are as follows:
Vehicle weight is an important parameter, which plays a major role in determining the effect of traffic loads. According to the monitoring data, the vehicle weight of different axle numbers of the Haihe Bridge presents obvious multi-peak distribution. Therefore, the Gaussian mixture model (Lu et al., 2018) can be used to simulate the vehicle weight, its probability distribution function is as follows:
After analyzing the measured data, the statistical parameters of various types of trucks are shown in Table 2. Taking the five-axle truck as an example, the histogram and probability density functions (PDFs) are shown in Figure 16.
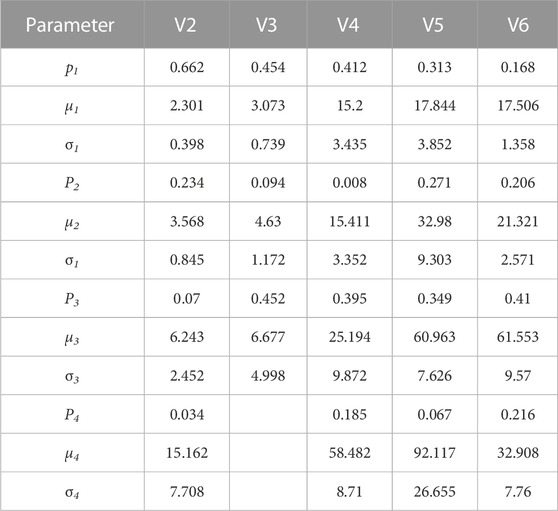
TABLE 2. Coefficients in the probability density function of vehicle weight.
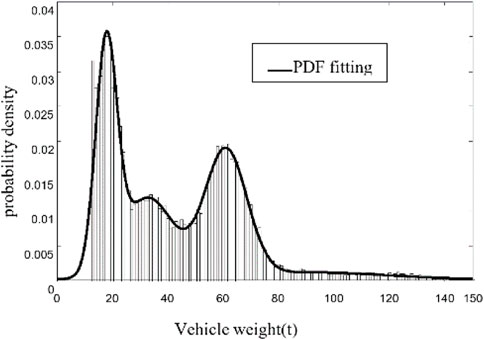
FIGURE 16. Histograms and PDFs of the 5-axle truck.
The wheelbase and wheel-load ratio of different vehicles types are also different. In this paper, the wheelbase and axle load of each vehicle type are regarded as constants, and the data in literature (Yan et al., 2021) is used.
The finite element model of Haihe Bridge is established using ANSYS software. Two calculation models are established to compare and analyze the fatigue life of structural details before and after reinforcement. One is orthotropic rigid bridge deck, the other is UHPC-orthotropic rigid deck composite structure. According to the detection results of the bridge, the cracks in steel box girder mostly appear near the middle web in the transverse direction. This is due to the lack of diaphragm restraint and the additional effect caused by torsion. Therefore, the established local refined finite element model includes two U ribs near the middle web in the transverse direction of the bridge. The longitudinal direction includes a diaphragm with a length of 4 m. The top of the model is the bridge deck, and the right side is the middle web. The height of the diaphragm and the middle web is 900 mm, as shown in Figure 17. The horizontal displacement on the left side of the model is constrained. SHELL63 element is used to simulate steel structural plates in the model, and SOLID45 element is used to simulate UHPC bridge deck.

FIGURE 17. Locally refined finite element model.
Based on the refined local model above, three types of stress influence surfaces that may become the origin point of fatigue cracks are calculated to carry out the fatigue life calculation for the structural details, including the scallop cutout, the rib-to deck joint and the rib-to-diaphragm joint. Limited by space, this paper lists the Z-direction stress influence surface of the scallop cutout at the U rib opening position on the diaphragm, as shown in Figure 18. It can be seen from the figure that the effect of load is limited to a small range near the fatigue details, and the influence line value of each point after reinforcement is significantly smaller than that before reinforcement, which indicates that the reinforcement effect is obvious.
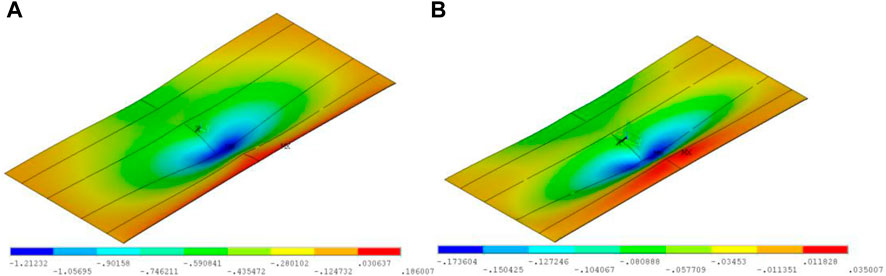
FIGURE 18. Z-direction stress influence surface of the scallop cutout at the U rib opening position on the diaphragm: (A) before reinforcement, (B) after reinforcement.
As we can know from the previous traffic flow data that the heavy vehicles mainly drive in lane 2 and lane 3 in Haihe Bridge. It can also be seen from the distribution of fatigue cracks that the fatigue damage of the structure under the middle two lanes is more serious than the other. Therefore, lane 2 is selected for fatigue analysis in this paper.
The stress history is obtained by loading the traffic loads on the stress influence surface, then the fatigue stress spectrum of structural details can be obtained by using the rain flow counting method. Figure 19 shows the fatigue stress spectrum of the fatigue-prone details in lane 2 before and after strengthened. It can be seen from the figure that the stress amplitude of each fatigue-prone detail decreased significantly after steel-UHPC reinforcement. Among them, the maximum stress amplitude at the scallop cutout, the rib-to-diaphragm joints and the rib-to-deck joints decreased by 60%, 58%, and 86% respectively.
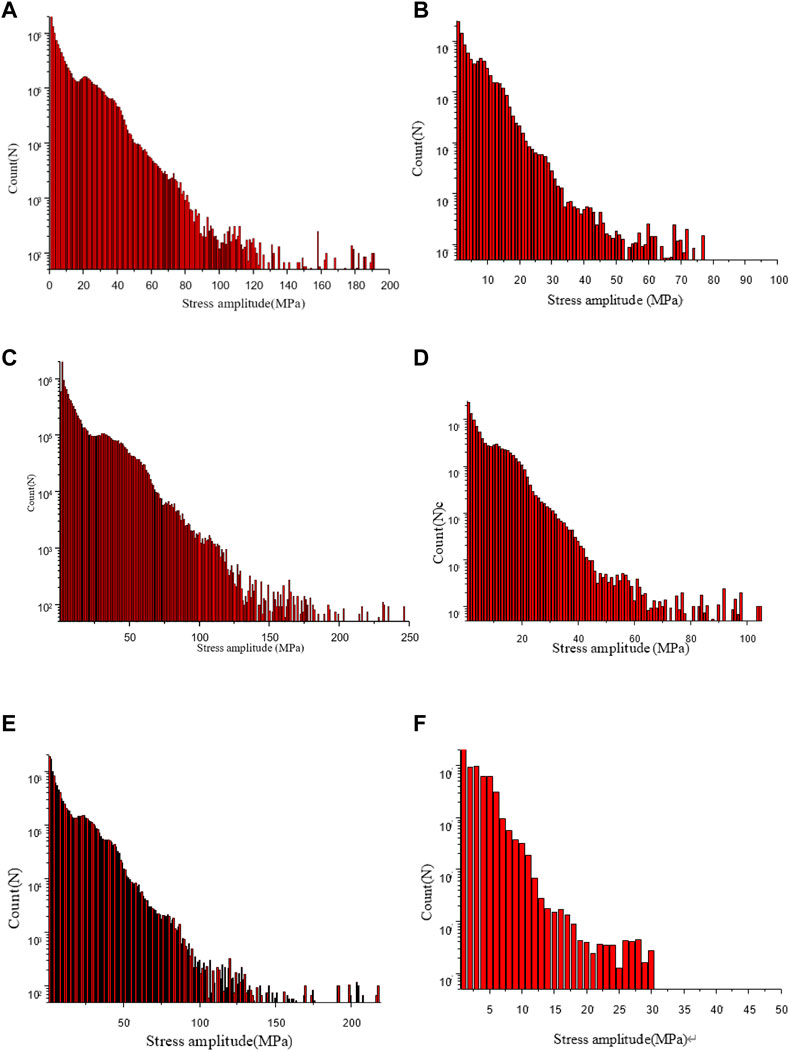
FIGURE 19. Stress spectrum of fatigue-prone details in Lane 2: (A) scallop cutout before reinforcement; (B) scallop cutout after reinforcement; (C) rib-to-diaphragm joints before reinforcement; (D) rib-to-diaphragm joints after reinforcement; (E) rib-to-deck joints before reinforcement and (F) rib-to-deck joints after reinforcement.
According to the S-N curve of the Eurocode and the Miner linear cumulative damage criterion theory, the fatigue life of the fatigue-prone details of the steel box girder under lane 2 before and after reinforcement are calculated, as shown in Table 3. The calculation results show that due to the difference in fatigue strength and stress amplitude of each fatigue-prone detail, their probability of fatigue risk is also different. Before reinforcement, the fatigue failure generally appears at the rib-to-diaphragm joints and the scallop cutout, while the fatigue resistance of rib-to-deck is relatively higher. This is also consistent with the bridge detection results. The data in the table also shows that the fatigue life of fatigue-prone details is greatly increased after strengthening, which indicates that this method is indeed effective for improving the fatigue life of bridges.
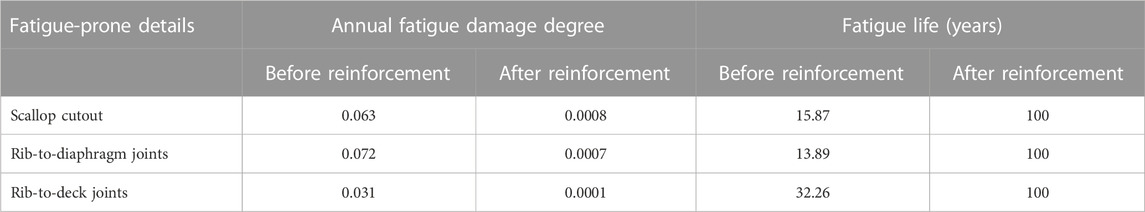
TABLE 3. Fatigue life calculation.
In addition, the fatigue life calculation results are slightly larger compared with the inspection results, as the actual bridge started to appear fatigue cracks after about 6 years of operation. This is because, on the one hand, during the first 8 years of operation of the bridge it was two-way four-lane traffic as the bridge next to it had not been built, so the traffic flow would be greater. On the other hand, defects cannot be considered in finite element analysis, especially cannot reflect the impact of additional stress concentration caused by penetration welding, which resulting in some errors in the calculation.
The fatigue life of OSD strengthened with UHPC under stochastic traffic load is calculated in this paper. A framework for fatigue life assessment of steel bridges based on stochastic traffic flow is proposed. Based on the random traffic data obtained by WIM, the traffic loads are simulated by Monte Carlo method. A refined finite element model was established to obtain the stress influence surface of fatigue-prone details. In summary, the following conclusions are drawn:
(1) Using the statistical parameters such as vehicle weight, vehicle speed and headway obtained from the measured random traffic flow data, the Monte Carlo method can effectively predict the traffic loads during the bridge life cycle.
(2) The evaluation procedures proposed in this paper can effectively predict the fatigue life of the fatigue-prone details on OSD. For the bridge before reinforcement, the fatigue life calculation results of the scallop cutout, rib-to-diagram and rib-to-deck joint are basically consistent with the actual bridge inspection results.
(3) After the steel-UHPC combination reinforcement, the stress amplitude of the bridge structural details is significantly reduced, thus the fatigue life is greatly increased. Under the traffic loads, the original structure appeared fatigue cracks in a relatively short time. After strengthening, the fatigue life of these fatigue-prone details has been extended to more than 100 years (Shao et al., 2022; Li et al., 2023).
The raw data supporting the conclusion of this article will be made available by the authors, without undue reservation.
JY: conceptualization, methodology, writing—review and editing; MD: writing—original draft, data curation, and calculation. All authors contributed to the article and approved the submitted version.
This work was conducted with financial support from the Reuter Foundation of Education Bureau of Hunan Province, China (Grant Numbers. 19C0155 and 21B0773); The Natural Science Foundation of Hunan Province, China (Grant Numbers. 2023JJ30080); The Open Fund of National-Local Joint Laboratory of Engineering Technology for Long-term Performance Enhancement of Bridges in Southern District (Changsha University of Science and Technology) (Grant Numbers. 19KF02); the Science and Technology Development Project of Tianjin Municipal Transportation Commission, China (Grant Numbers. 202003); The Science Popularization Special Project on the Construction of Innovation-Oriented Provinces (Grant Numbers. 2021ZK4148).
The authors declare that the research was conducted in the absence of any commercial or financial relationships that could be construed as a potential conflict of interest.
All claims expressed in this article are solely those of the authors and do not necessarily represent those of their affiliated organizations, or those of the publisher, the editors and the reviewers. Any product that may be evaluated in this article, or claim that may be made by its manufacturer, is not guaranteed or endorsed by the publisher.
Chang, J., Li, J., Hu, H., Qian, J., and Yu, M. (2023). Numerical investigation of aggregate segregation of superpave gyratory compaction and its influence on mechanical properties of asphalt mixtures. J. Mater Civ. Eng. 35 (3), 04022453. doi:10.1061/(asce)mt.1943-5533.0004604
Chen, L., Qian, Z., and Wang, J. (2015). Multiscale numerical modeling of steel bridge deck pavements considering vehicle–pavement interaction. Int. J. Geomech. 16, B4015002.
Choi, J. H., and Kim, D. H. (2008). Stress characteristics and fatigue crack behaviour of the longitudinal rib-to-cross beam joints in an orthotropic steel deck. Adv. Struct. Eng. 11 (2), 189–198. doi:10.1260/136943308784466224
Deng, L., Zou, S., Wang, W., and Kong, X. (2021). Fatigue performance evaluation for composite OSD using UHPC under dynamic vehicle loading. Eng. Struct. 232, 111831. doi:10.1016/j.engstruct.2020.111831
Deng, M., Wang, L., Zhang, J., Wang, R., and Yan, Y. (2017). Probabilistic model of bridge vehicle loads in port area based on in-situ load testing. IOP Conf. Ser. Earth Environ. Sci. 94 (1), 012205. doi:10.1088/1755-1315/94/1/012205
Dieng, L., Marchand, P., Gomes, F., Tessier, C., and Toutlemonde, F. (2013). Use of UHPFRC overlay to reduce stresses in orthotropic steel decks. J. Constr. Steel Res. 89, 30–41. doi:10.1016/j.jcsr.2013.06.006
Ding, Y. (2015). JTG D64-2015. Specifications for design of Highway steel bridge. Delhi: S.K. Kataria and Sons.
Donnell, E., Ni, Y., Adolini, M., and Elefteriadou, L. (2001). Speed prediction models for trucks on two-lane rural highways. Transp. Res. Rec. 1751, 44–55. doi:10.3141/1751-06
Eurocode, C. (1993). 3: Design of steel structures DRAFT prEN. Brussels, Belgium: European Committee for Standardization.
Fisher, J. W., and Barsom, J. M. (2016). Evaluation of cracking in the rib-to-deck welds of the bronx–whitestone bridge. J. Bridge Eng. 21 (3), 04015065. doi:10.1061/(asce)be.1943-5592.0000823
Giray, O., and Ahmet, G. (2011). Generating low-discrepancy sequences from the normal distribution: Box–muller or inverse transform. Math. Comput. Model 53 (5-6), 1268–1281. doi:10.1016/j.mcm.2010.12.011
Hu, N., Dai, G. L., Yan, B., and Liu, K. (2014). Recent development of design and construction of medium and long span high-speed railway bridges in China. Eng. Struct. 74, 233–241. doi:10.1016/j.engstruct.2014.05.052
Jong, F. B. P. (2007). Renovation techniques for fatigue crack orthotropic steel bridge decks. Delft, Netherlands: Delft University of Technology.
Li, J., Zhang, J., Yang, X., Zhang, A., and Yu, M. (2023). Monte Carlo simulations of deformation behaviour of unbound granular materials based on A real aggregate library. Int. J. Pavement Eng. 24 (1), 2165650. doi:10.1080/10298436.2023.2165650
Li, Y., Cui, C., and Wang, Y. “Stress distribution of orthotropic steel bridge decks under vehicle wheel loading,” in Proceedings of the 19th International Offshore and Polar Engineering Conference. ISOPE, Osaka, Japan, July, 2009.
Lu, N., Yang, L., and Beer, M. (2018). Extrapolation of extreme traffic load effects on A cable-stayed bridge based on weigh-in-motion measurements. Int. J. Reliab. Saf. 12 (1/2), 69–85. doi:10.1504/ijrs.2018.092504
May, I. M., Roy, M., and Lang, C. (2015). CFRP for the repair of fatigue cracks in steel structures. P I Civ. Eng. 169 (2), 1–15.
Panichpapiboon, S. (2015). The humelock hemiarthoplasty device for both primary and failed management of proximal humerus fractures: A case series. J. Transp. Eng. 141, 1–6. doi:10.2174/1874325001509010001
Qin, S., Zhang, J., Huang, C., Gao, L., and Bao, Y. (2022). Fatigue performance evaluation of steel-UHPC composite orthotropic deck in a long-span cable-stayed bridge under in-service traffic. Eng. Struct. 254, 113875. doi:10.1016/j.engstruct.2022.113875
Shao, X., Zhao, X., Liu, Q., Deng, S., and Wang, Y. (2022). Design and experimental study of hot rolled shape steel-ultrahigh performance concrete composite beam. Eng. Struct. 252, 113612. doi:10.1016/j.engstruct.2021.113612
Walter, R., Olesen, J. F., Stang, H., and Vejrum, T. (2007). Analysis of an orthotropic deck stiffened with a cement-based overlay. J. Bridge Eng. 12 (3), 350–363. doi:10.1061/(asce)1084-0702(2007)12:3(350)
Wang, C., Ou, C., and Zhai, M. “Cold retrofit method study for fatigue cracking of steel bridge,” in Proceedings of the IABSE Conference: Structural Engineering: Providing Solutions to Global Challenges, Geneva, Switzerland, September 2015, 1227–1234.
Wang, L., Su, X., Ma, Y., Deng, M., Zhang, J., and Cai, C. (2020). Strengthening of steel decks for cable-stayed bridge using ultra-high performance concrete: A case study. Adv. Struct. Eng. 23 (16), 3373–3384. doi:10.1177/1369433220939210
Yan, F., Chen, W., and Lin, Z. (2016). Prediction of fatigue life of welded details in cable-stayed orthotropic steel deck bridges. Eng. Struct. 127, 344–358. doi:10.1016/j.engstruct.2016.08.055
Yan, Q., Zhuo, W., and Wang, Z. (2021). Vehicle load model for heavy load and heavy traffic Highway in fujian Province based on weigh-in-motion data. J. Fuzhou Univ. 49 (03), 421–427.
Yuan, Y., Wu, C., and Jiang, X. (2019). Experimental study on the fatigue behavior of the orthotropic steel deck rehabilitated by UHPC overlay. J. Constr. Steel Res. 157, 1–9. doi:10.1016/j.jcsr.2019.02.010
Zhang, S. H., Shao, X., Cao, J., Cui, J., Hu, J., and Deng, L. (2016). Fatigue performance of a lightweight composite bridge deck with open ribs. J. Bridge Eng. 21 (7), 1–16. doi:10.1061/(asce)be.1943-5592.0000905
Zhang, X., Wang, H., Zhang, Y., and Wang, L. (2023). Corrosion of steel rebars across UHPC joint interface under chloride attack. Constr. Build. Mater 387, 131591. doi:10.1016/j.conbuildmat.2023.131591
Keywords: bridge engineering, stochastic traffic load, fatigue life, orthotropic steel deck, ultra-high performance concrete (UHPC)
Citation: Deng M and Yi J (2023) Fatigue life prediction of orthotropic steel deck strengthened with UHPC under stochastic traffic load. Front. Mater. 10:1208363. doi: 10.3389/fmats.2023.1208363
Received: 19 April 2023; Accepted: 24 May 2023;
Published: 05 June 2023.
Edited by:
Hui Yao, Beijing University of Technology, ChinaReviewed by:
Jue Li, Chongqing Jiaotong University, ChinaCopyright © 2023 Deng and Yi. This is an open-access article distributed under the terms of the Creative Commons Attribution License (CC BY). The use, distribution or reproduction in other forums is permitted, provided the original author(s) and the copyright owner(s) are credited and that the original publication in this journal is cited, in accordance with accepted academic practice. No use, distribution or reproduction is permitted which does not comply with these terms.
*Correspondence: Ju Yi, eWlqdTA5NDY3OUAxNjMuY29t; Ming Deng, ZGVuZ21pbmdfOTc5QDEyNi5jb20=
Disclaimer: All claims expressed in this article are solely those of the authors and do not necessarily represent those of their affiliated organizations, or those of the publisher, the editors and the reviewers. Any product that may be evaluated in this article or claim that may be made by its manufacturer is not guaranteed or endorsed by the publisher.
Research integrity at Frontiers
Learn more about the work of our research integrity team to safeguard the quality of each article we publish.