 Jie Yuan
 Jian Chen
- The School of Civil Engineering, Guangzhou University, Guangzhou, China
The influence of creep deformation of soft soil on engineering construction can’t be ignored. In order to deeply understand the macroscopic mechanical properties and the evolution mechanism of soft soil in microscope during consolidation creep, one-dimensional consolidation creep tests and SEM tests of Nansha soft soil were carried out in this paper. Then the image processing was performed by Image J software to obtain the consolidation creep characteristics, microscopic parameters of particles and pores under different loading pressures. The results of experiment and image processing show that 1) The creep process of Nansha soft soil is divided into the initial instantaneous deformation phase, the attenuation creep phase and the stable creep phase. The creep deformation increases with the consolidation creep stress during the three phases. 2) During the creep process, the distance between particles decreases and some particles are gradually broken, the quantity of particles and pores increases but the volume of them decreases. At the same time, the shape of particles and pores changes from nearly round and strip to nearly oval. 3) The consolidation creep stress determines the particles distance and the degree of fragmentation. And this trend is more obvious with the increase of the consolidation creep stress.
1 Introduction
Soft soil shows a significant creep characteristic. Soft soil creep may cause land subsidence (Mesri and Choi, 1985; Yin et al., 2017) and slope instability (Tan et al., 2022). Creep tests are necessary means to understand the creep properties of soil qualitatively, establish the creep constitutive model and determine the model parameters. Creep tests mainly includes macroscopic and microscopic aspects.
In recent years, macroscopic creep tests of soft soil, such as one-dimensional (1D) consolidation, direct shear and triaxial shear test, have made progress in creep behavior and creep constitutive model. Some scholars have studied the creep behavior of soft clay under different stresses and strains by using triaxial creep tests (Wang and Wong, 2016; Huang et al., 2019; Nishimura, 2020), and established elastic-viscoplastic constitutive models (Zhu and Yu, 2015; Yan et al., 2019). Tran et al. (2018) researched the behavior of soil strength reduction using triaxial creep tests and predicted the time of creep failure. Furthermore, the influence of soft soil structure on creep behavior through consolidation creep tests was explored by scholars, then many corresponding constitutive models were proposed. For example, Mataic et al. (2016) investigated the creep characteristics of soft clay during consolidation, considering the influence of clay structure and sample quality. Zhu et al. (2016) focuses on the quantitative description of the evolution of creep coefficient with both soil density and soil structure under compression. Yin et al. (2017); Yin and Karstunen, (2011) established implicit and explicit creep models based on stress and creep structures respectively under 1D condition. Li et al. (2018) studied the non-linear creep characteristics of soft soil by consolidation creep experiments on Tianjin Marine soft soil, and established a three-dimensional non-linear viscoelastic creep constitutive model reflecting the effect of time. Zou et al. (2019) proposed an elastic-viscoplastic constitutive model based on the isometric concept and Nishihara model to simulate the 1D compression behavior of Ningbo Marine soft clay. Bai et al. (2019) developed a thermo-hydro-mechanical constitutive model for consolidated soil based on the tenet of particle irreversible rearrangement. In addition, interparticle interactions were studied (Bai et al., 2021). In general, the creep properties of soft soil are studied on the macroscopic level based on mechanical tests, then the creep phenomena are integrated under various conditions and the creep equations are established through mathematical and mechanical analysis. However, some analyses of macroscopic phenomena show some deficiencies in understanding the mechanism of soil creep. Consequently, researchers tried to deduced the overall creep mechanism through the change and the characters of the soil structure in microscope.
At the microscopic level, there are some popular methods being used to explore the microstructure of the soil, such as optical microscopy, scanning electron microscope (SEM), environmental scanning electron microscopy (ESEM) (Sun et al., 2019), Mercury intrusion porosimetry (MIP), and computed tomography (CT) scanning (Kaczmarek et al., 2017). Based on these microscopic test means, the main microstructure forms and creep mechanism of soil can be described qualitatively. For example, Osipov and Sokolov (1978) introduced the results of microstructure changes, shear stress, thixotropic phenomena, and swelling of clays during compaction under different stress states through electron microscopy analysis. Gylland et al. (2013) used laboratory and small-scale field experiments to analyze the shear band structure and evolution process of thin sections of clay from initiation to maturation under light microscope and SEM. Zhao et al. (2020, 2022) studied the influence of stress on the microstructure evolution of kaolin based on the analysis of triaxial creep results and SEM. Lei et al. (2016, 2020) researched the microstructure changes of natural soft clays under accelerated creep conditions through dynamic and static triaxial tests, SEM and MIP. At the same time, the development of algorithm makes great progress in digital image processing technology, and makes the quantitative analysis of soil structure develop greatly. Through image processing software, some microscopic parameters with definite physical meaning can be used to quantitatively analyze the evolution mechanism of soil microstructure (Liu and Zhang, 2011; Xie et al., 2018; Nian et al., 2020; Dai et al., 2021; Li et al., 2022). However, these studies were explored only at the microscopic scale, and the macroscopic and microscopic experimental phenomena were not well connected.
In this paper, in order to deeply investigate the creep deformation mechanism of soft soil, the creep characteristics of soft soil at the macroscopic and microscopic levels were comprehensively researched. Firstly, consolidation creep tests of Nansha soft soil were carried out to analyze the creep characteristics of soft soil under different axial stresses at the macro level. Then, the undisturbed samples and the consolidated samples were all tested by SEM to obtain the images of microstructure during the soft soil creep. And then the parameters of microstructure such as, pore size, particle size, were obtained by Image J processing on the microstructure images. Based on the results of macroscopic and microscopic creep test, the creep deformation mechanism of Nansha soft soil was analyzed qualitatively and quantitatively.
2 Experimental method and scheme
2.1 Materials
Nansha soft soil is mainly composed of quaternary marine sediments such as silt and silty clay, which shows a significant creep characteristic. Therefore, Nansha soft soil was chosen to prepare samples in this experiment. The particle size distribution, basic physical and mechanical indexes of the soil were tested according to ASTM-D2487-11. The results are shown in Table 1 and Figure 1.
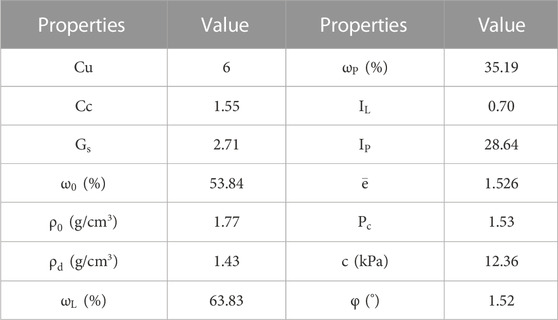
TABLE 1. Basic physical and mechanical properties.
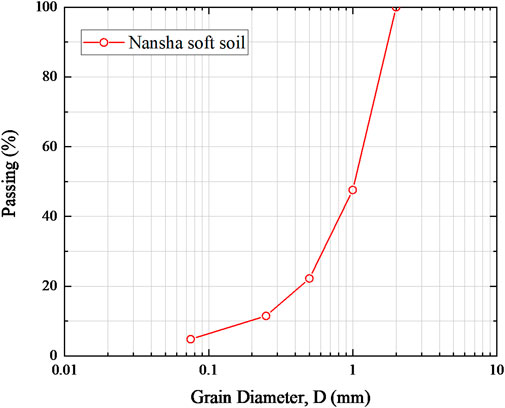
FIGURE 1. Particle size distribution of the sample.
2.2 Method and scheme
For the classical consolidation instrument, the height of the samples is 2 cm. Since the deformation is small after the soft soil enters the creep phase, which cannot be clearly shown in the stress-strain curve. Therefore, the conventional direct shear instrument was modified in this experiment to observe the deformation more obviously. Firstly, the shear box was replaced by the consolidation box, and the pressure system was replaced by the vertical loading system of the direct shear instrument. Then, the dial indicator was assembled to measure the vertical deformation. Finally, the height of the samples was increased from 2cm to 8 cm. The samples were immediately sealed by field sampling with the special ring knife. The height of ring knife is 8 cm and the diameter is 6.18 cm. The samples were loaded separately to completely depict the creep curve of each loading grade. The loading scheme is shown in Table 2. The sample box was wrapped with film to avoid water evaporation, and the temperature and humidity were kept constant during the creep test (temperature: 25°C, humidity: 88% ± 1%). When the deformation was less than 0.005 mm within 24 h, the soil was in the stable creep phase.
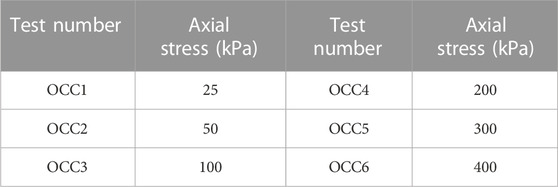
TABLE 2. One dimensional consolidation creep test scheme.
In order to analyze the microstructure changes of soft soil, the SEM test was performed on the undisturbed samples and the consolidated samples. Firstly, the middle part of the sample was cut into long strip by thin steel wire. The length of strip is 2.0 cm, the width is 1.5 cm, and the height is 2.0 cm. The samples were dried by freeze-drying method to ensure the soil structure is not disturbed as much as possible. The samples were immersed in the special container containing liquid nitrogen at −193°C for 3 min by using isopentane as the transition refrigerant. After frozen, the samples were put into the pre-cooled vacuum freeze-dryer at −50°C for 24 h. Then, the samples were carefully broken apart to obtain undisturbed structural planes as the SEM shooting faces. In order to avoid the discharge phenomenon caused by the electron beam bombardment, the samples were plated a golden film by the vacuum sputtering coating machine. At last, the areas with relatively uniform soil particles and pores were scanned so that the scanned areas are representative, as shown in Figure 2.
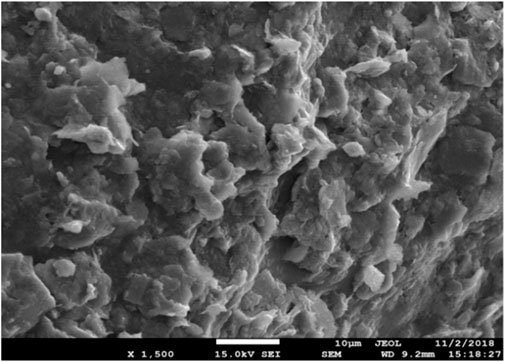
FIGURE 2. SEM image.
In image processing, the soil particles and pores were divided into two substances, and the criterion for the division was the different gray value ranges of the two substances. The grayscale range of SEM images was 0–255. There was a grayscale threshold between two substances, where grayscale greater than this threshold was marked as 255 and appears as white. And grayscale less than this threshold was marked as 0 and appears as black, as shown in Figure 3A. The threshold values were different for different SEM images, and the respective threshold value was adjusted for each image by referring to the corresponding literature and experience. By threshold segmentation, the pore edges can be outlined, as shown in Figure 3B. Finally, the irregularly shaped pores were transformed into ellipses by elliptical segmentation, as shown in Figure 3C.
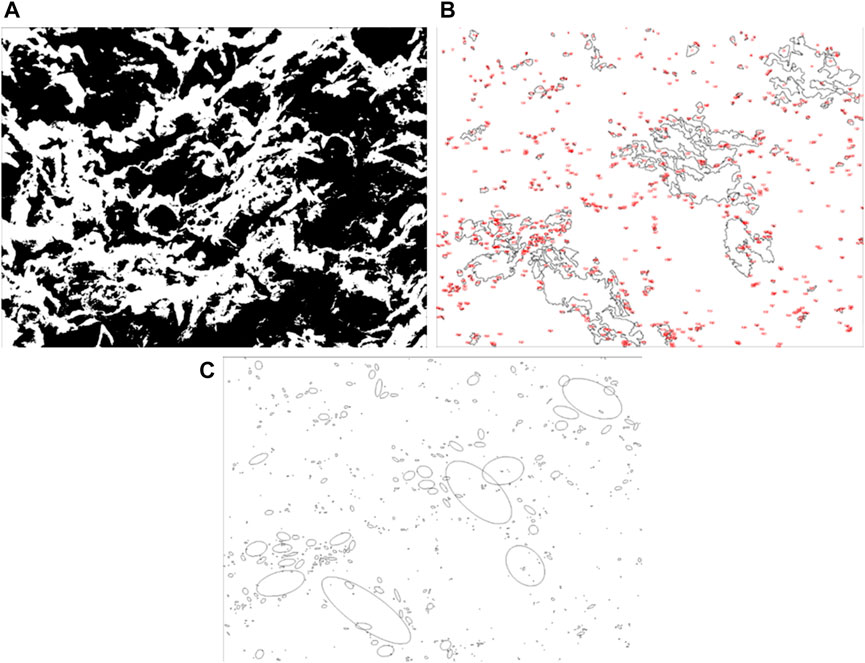
FIGURE 3. (A) Adjustment of the threshold. (B) The identified pores. (C) Ellipse segmentation.
Considering the complexity of soil structure, in this paper some parameters were defined to quantify the structure of particles and pores as showed in Table 3.
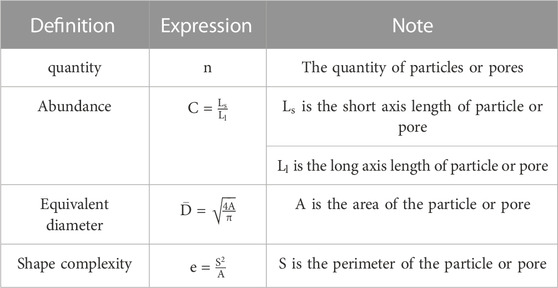
TABLE 3. Quantitative analysis parameters.
3 Experimental results and discussion
3.1 Experimental results
3.1.1 One dimensional compression creep tests
The results of the creep test are shown in Figure 4. When the stress was applied, the samples showed a large instant strain, which was the main deformation in the whole test, and the strain increased almost in a vertical line trend. Then, the deformation increased with the increase of the stress. As time goes on, the growth rate of the strain slowed down and the slope of the stress-strain curve decreaseed continuously. At this time, the amount of soil deformation per unit time is not equal, the deformation per unit time will be smaller. This phase was called the attenuation creep phase. When the growth rate of the strain decreased to a certain degree and the curve tends to be horizontal, it can be assumed that the soil deformation per unit time was almost equal, this phase was called the stable creep phase.
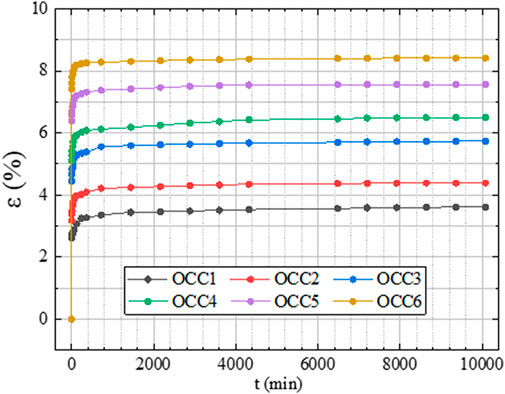
FIGURE 4. Axial stain-time curve.
Figure 5 shows the logarithmic curve of pore ratio versus loading time. It can be clearly seen that the slope of the curve changes significantly at t = 10 min. The phase before t = 10 min is the instantaneous deformation phase, the free water was rapidly extruded because of the creep stress, subsequently, the particles were crowded and the pores are compressed. Therefore, the pore ratio decreased faster and the curve was an oblique line. After t = 10 min, the decrease rate of pore ratio slowed down, and the curve tended to be horizontal with the development of time. At this time, the distance between particles decreased continuously and the frictional resistance between particles increased. This microstructural change was represented by an increasing deformation and decreasing pore ratio of the samples.
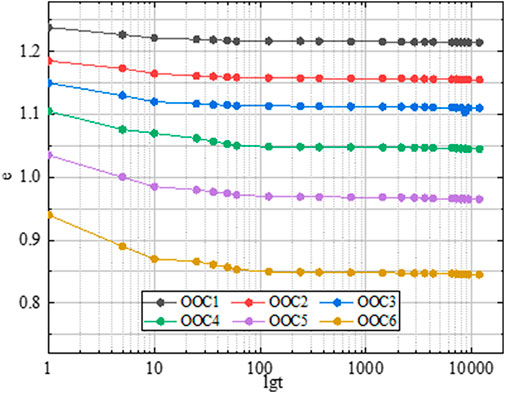
FIGURE 5. Logarithmic curve of pore ratio and time.
3.1.2 Microscopic image and processing
The image processing results are shown in Figure 6. In Figure 6A, the quantities of particles and pores were all larger than the undisturbed samples’, and the quantities also increased with the increase of the creep stress. Then, the equivalent diameters of particles and pores were divided into different intervals (<1 μm, 1−2 μm, 2−5 μm, >5 μm), as shown in Figure 6B and Figure 6C . It can be seen that, the proportion of particles and pores larger than 5 μm decreased with the increasing creep stress. With the increase of creep stress, the proportion of particle size in 2−5 μm increased, but the proportion of pores size in 2−5 μm decreased. At the same time, the proportion of particles and pores size in 1−2 μm and smaller than 1 μm increased with the increase of the stress. This indicated that the large particles and pores gradually broke down into small particles and pores during the creep process, and this phenomenon was more obvious with the increasing creep stress.
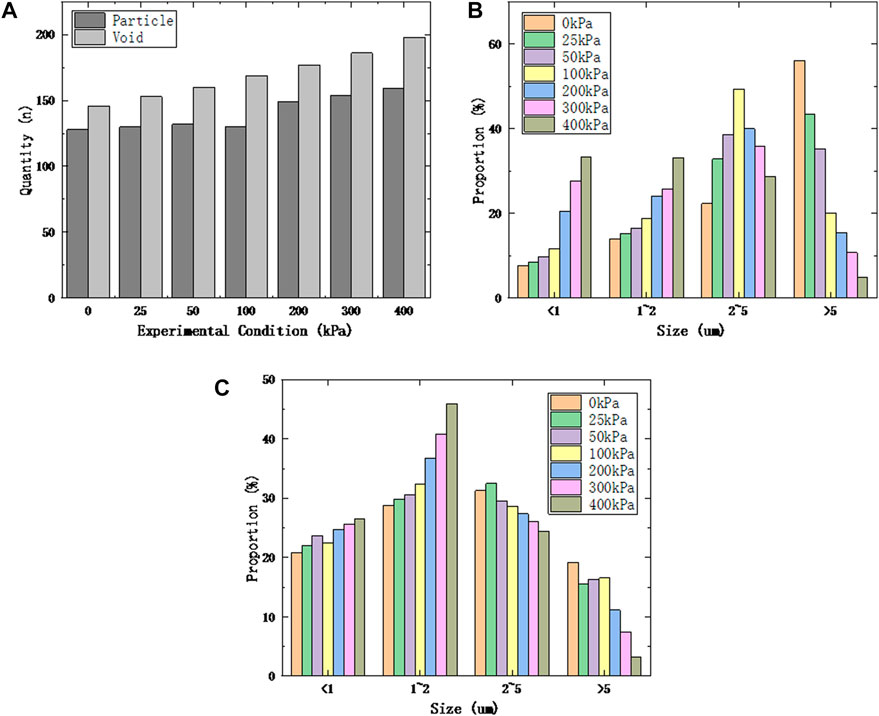
FIGURE 6. (A) The quantity of particles and pores. (B) The diameter distribution of particles. (C) The diameter distribution of pores.
The complexity e) and the abundance C) are shown in Figure 7. In Figure 7A, the complexity both decreased with the increase of the creep stress. The abundance of particles and pores was divided into different intervals (0–0.2, 0.2–0.4, 0.4–0.6, 0.6–0.8, 0.8–1.0) in Figures 7B, C, where the abundance in 0–0.2 represents the particles were nearly elongated, the abundance in 0.2–0.8 was nearly elliptical, and the abundance in 0.8–1.0 was nearly circular. For the abundance of particles in Figure 7B, the proportion of the abundance in 0.4–0.6 decreased and then increases. At the same time, the proportion of the abundance in 0.6–1.0 decreased with the increasing of creep stress. This indicated that the shape of the particles changed to flatter with the increase of the creep stress. For the abundance of pores in Figure 7C, the abundance of the undisturbed samples was mainly concentrated the abundance in 0.4–0.8. However, the proportion of the abundance in 0.4–0.6 increased and then decreased with the increasing creep stress, the proportion of the abundance in 0.6–0.8 decreased greatly, and the proportion of the abundance in 0–0.4 increased. This indicated that the shape of the pores became narrower with the increase of the creep stress.
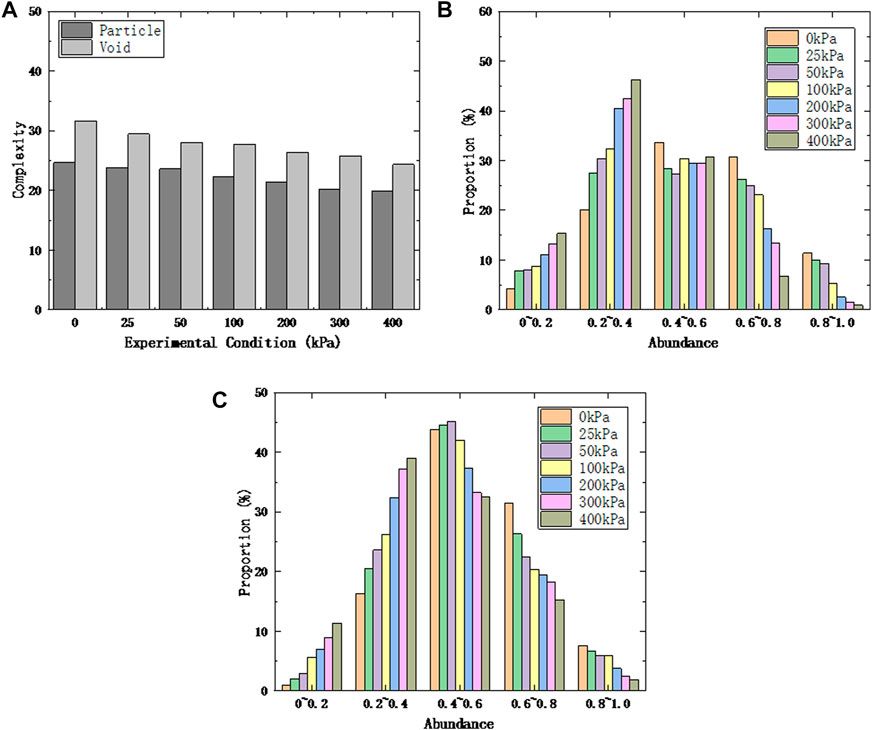
FIGURE 7. (A) The complexity of particles and pores. (B) The abundance of particles. (C) The abundance of pores.
3.2 Discussion of deformation mechanism
The above phenomena can be explained by the changes in the internal structure of the soil during the creep process, as shown in Figure 8. In the process of “a,” the spacing of the particles was slightly reduced, and the particles were still arranged in a similar rhombic structure without much change in the form of microstructure, but the volume of the pores decreased. At the same time, the distance between particles was reduced by a small amount. This reduction was small because of the small creep stress (25 kPa, 50 kPa). Therefore, the total deformation of the samples in Figure 4 was small, and so was the decrease of the pore ratio in Figure 5. For the same reason, the quantity of particles and pores with large diameter (>5 μm) decreased less, the complexity and abundance of particles and pores did not change significantly.
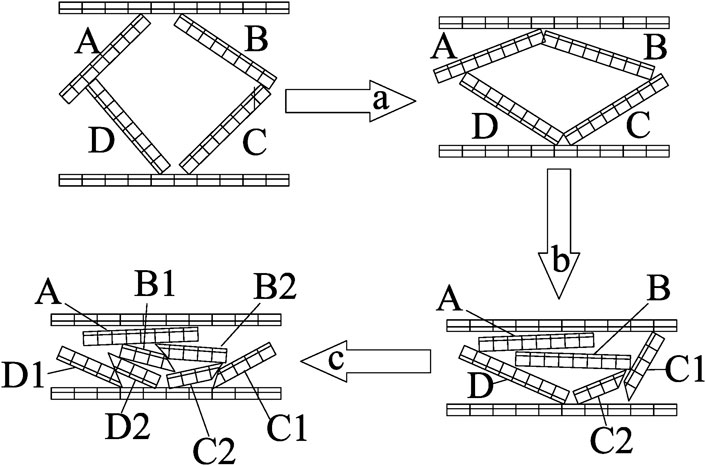
FIGURE 8. Deformation process of soil skeleton.
In the process of “b,” the pores were further compressed and the distance of the particles was further reduced. At the same time, particle B produced a significant movement and particle C broke into particle C1 and particle C2 due to higher creep stress (100 kPa, 200 kPa). Therefore, the total deformation of the samples increased as shown in Figure 4, and the pore ratio decreased further as shown in Figure 5. For the same reason, more small pores were generated among the broken particles (Figure 6B), and this led the quantity of particles and pores with large diameter (>5 μm) to decrease greatly. At the same time, the quantity of particles and pores with medium diameter (2–5 μm) increased greatly, the quantity of particles and pores with small diameter (<1 μm, 1–2 μm) increased slightly.
In the process of “c,” the creep stress was so high (300 kPa, 400 kPa) that the particles broke seriously and the distance of the particles decreased greatly. Therefore, the total deformation in Figure 4 increased further, and the pore ratio in Figure 5 decreased further. For the same reason, the quantity of particles and pores with large diameter (>5 μm) accounted for a small proportion. At the same time, the quantity of particles and pores with medium diameter (2–5 μm) decreased, but the quantity of particles and pores with small diameter (<1 μm, 1–2 μm) increased greatly.
4 Conclusion
Based on the compression creep tests, SEM tests and Image J processing this paper analyzed the creep characteristics and deformation mechanism of Nansha soft soil were analyzed in this paper. Three conclusions are drawn as following:
(1) In creep tests, the creep process was divided into three stages, the initial instantaneous deformation phase in which the pores were squeezed and reduced, the attenuation creep phase in which the particles were broken and squeezed, and the stable creep phase in which a large number of broken particles were squeezed and slipped. Furthermore, the creep deformation increased with the creep stress during the three phases.
(2) During creep process, the quantity of particles and pores increased but their volume decreased due to the decrease in the distance between particles and the gradual breaking of particles. At the same time, the shape of particles and pores changed from close to round and bar shape to close to oval shape.
(3) The above phenomenon can be explained by a sketch of the changes in the internal structure of the soil during creep. The creep rate of soft soil was related to the crowding of pore and the fragmentation of particle determined by the magnitude of creep stress. And this phenomenon was more obvious with the increase of the creep stress.
Data availability statement
The raw data supporting the conclusion of this article will be made available by the authors, without undue reservation.
Author contributions
JZ, experimental method design. ST, data collection and collation. YG, original Draft. JC, review and revision. JY, administrative and technical support.
Conflict of interest
The authors declare that the research was conducted in the absence of any commercial or financial relationships that could be construed as a potential conflict of interest.
Publisher’s note
All claims expressed in this article are solely those of the authors and do not necessarily represent those of their affiliated organizations, or those of the publisher, the editors and the reviewers. Any product that may be evaluated in this article, or claim that may be made by its manufacturer, is not guaranteed or endorsed by the publisher.
References
Bai, B., Jiang, S., Liu, L., Li, X., and Wu, H. (2021). The transport of silica powders and lead ions under unsteady flow and variable injection concentrations. Powder Technol. 387, 22–30. doi:10.1016/j.powtec.2021.04.014
Bai, B., Yang, G., Li, T., and Yang, G. (2019). A thermodynamic constitutive model with temperature effect based on particle rearrangement for geomaterials. Mech. Mater. 139, 103180. doi:10.1016/j.mechmat.2019.103180
Dai, C.-X., Zhang, Q.-F., He, S.-H., Zhang, A., Shan, H.-F., and Xia, T.-D. (2021). Variation in micro-pores during dynamic consolidation and compression of soft marine soil. J. Mar. Sci. Eng. 9 (7), 750. doi:10.3390/jmse9070750
Gylland, A. S., Rueslåtten, H., Jostad, H. P., and Nordal, S. (2013). Microstructural observations of shear zones in sensitive clay. Eng. Geol. 163, 75–88. doi:10.1016/j.enggeo.2013.06.001
Huang, W., Wen, K., Li, D., Deng, X., Li, L., Jiang, H., et al. (2019). Experiment study of lateral unloading stress path and excess pore water pressure on creep behavior of soft soil. Adv. Civ. Eng. 2019, 1–9. doi:10.1155/2019/9898031
Kaczmarek, Ł. D., Dobak, P. J., and Kiełbasiński, K. (2017). Preliminary investigations of creep strain of neogene clay from warsaw in drained triaxial tests assisted by computed microtomography. Studia Geotechnica Mech. 39 (2), 35–49. doi:10.1515/sgem-2017-0014
Lei, H., Lu, H., Wang, X., Ren, Q., and Li, B. (2016). Changes in soil micro-structure for natural soft clay under accelerated creep condition. Mar. Georesources Geotechnol. 34 (4), 365–375. doi:10.1080/1064119X.2015.1010669
Lei, H., Xu, Y., Jiang, M., and Jiang, Y. (2020). Deformation and fabric of soft marine clay at various cyclic load stages. Ocean. Eng. 195, 106757. doi:10.1016/j.oceaneng.2019.106757
Li, K., Liu, R., Qiu, C., and Tan, R. (2018). “Consolidated drained creep model of soft clay in Tianjin coastal areas,” in Proceedings of GeoShanghai 2018 international conference: Fundamentals of soil behaviours. Editors A. Zhou, J. Tao, X. Gu, and L. Hu (Springer Singapore), 157–165. doi:10.1007/978-981-13-0125-4_17
Li, Z., Wang, J., Yang, S., Liu, S., and Li, Y. (2022). Characteristics of microstructural changes of malan loess in yan’an area during creep test. Water 14 (3), 438. doi:10.3390/w14030438
Liu, X. X., and Zhang, J. R. (2011). Fractal approach on quantitative analysis of micro pore structure of isotropic consolidated clay. Adv. Mater. Res. 250–253, 1846–1851. doi:10.4028/www.scientific.net/AMR.250-253.1846
Mataic, I., Wang, D., and Korkiala-Tanttu, L. (2016). Effect of destructuration on the compressibility of perniö clay in incremental loading oedometer tests. Int. J. Geomechanics 16 (1), 04015016. doi:10.1061/(ASCE)GM.1943-5622.0000486
Mesri, G., and Choi, Y. K. (1985). Settlement analysis of embankments on soft clays. J. Geotechnical Eng. 111111 (4), 441–464. doi:10.1061/(asce)0733-9410(1985)111:4(441)
Nian, T., Jiao, H., Fan, N., and Guo, X. (2020). Microstructure analysis on the dynamic behavior of marine clay in the South China Sea. Mar. Georesources Geotechnol. 38 (3), 349–362. doi:10.1080/1064119X.2019.1573864
Nishimura, T. (2020). “Shear strength of an unsaturated silty soil subjected to creep deformation,” in Geotechnics for sustainable infrastructure development. Editors P. Duc Long, and N. T. Dung (Springer), 977–984. doi:10.1007/978-981-15-2184-3_128
Osipov, V. I., and Sokolov, V. N. (1978). A study of the nature of the strength and deformation properties of clay soils with the help of the scanning electron microscope. Bull. Int. Assoc. Eng. Geol. 17 (1), 91–94. doi:10.1007/BF02634697
Sun, H., Mašín, D., Najser, J., Neděla, V., and Navrátilová, E. (2019). Bentonite microstructure and saturation evolution in wetting–drying cycles evaluated using ESEM, MIP and WRC measurements. Géotechnique 69 (8), 713–726. doi:10.1680/jgeot.17.P.253
Tan, Q., Huang, M., Tang, H., Zou, Z., Li, C., Huang, L., et al. (2022). Insight into the anisotropic deformation of landslide sliding zone soil containing directional cracks based on in situ triaxial creep test and numerical simulation. Eng. Geol. 311, 106898. doi:10.1016/j.enggeo.2022.106898
Tran, T. T. T., Hazarika, H., Indrawan, I. G. B., and Karnawati, D. (2018). Prediction of time to soil failure based on creep strength reduction approach. Geotechnical Geol. Eng. 36 (4), 2749–2760. doi:10.1007/s10706-018-0496-9
Wang, Z., and Wong, R. C. K. (2016). Strain-dependent and stress-dependent creep model for a till subject to triaxial compression. Int. J. Geomechanics 16 (3), 04015084. doi:10.1061/(ASCE)GM.1943-5622.0000583
Xie, X., Qi, S., Zhao, F., and Wang, D. (2018). Creep behavior and the microstructural evolution of loess-like soil from Xi’an area, China. Eng. Geol. 236, 43–59. doi:10.1016/j.enggeo.2017.11.003
Yan, Z., Li, G., Zhang, J., and Zhang, R. (2019). Study on the creep behaviors of interactive marine-terrestrial deposit soils. Adv. Civ. Eng. 2019, 1–14. doi:10.1155/2019/6042893
Yin, Z.-Y., and Karstunen, M. (2011). Modelling strain-rate-dependency of natural soft clays combined with anisotropy and destructuration. Acta Mech. Solida Sin. 24 (3), 216–230. doi:10.1016/S0894-9166(11)60023-2
Yin, Z.-Y., Zhu, Q.-Y., and Zhang, D.-M. (2017). Comparison of two creep degradation modeling approaches for soft structured soils. Acta Geotech. 12 (6), 1395–1413. doi:10.1007/s11440-017-0556-y
Zhao, D., Gao, Q.-F., Hattab, M., Hicher, P.-Y., and Yin, Z.-Y. (2020). Microstructural evolution of remolded clay related to creep. Transp. Geotech. 24, 100367. doi:10.1016/j.trgeo.2020.100367
Zhao, D., Hattab, M., Hicher, P.-Y., and Yin, Z.-Y. (2022). Effect of stress level on the microstructural evolution of clay under creep. J. Eng. Mech. 148 (2), 04021148. doi:10.1061/(ASCE)EM.1943-7889.0002070
Zhu, Q.-Y., Yin, Z.-Y., Hicher, P.-Y., and Shen, S.-L. (2016). Nonlinearity of one-dimensional creep characteristics of soft clays. Acta Geotech. 11 (4), 887–900. doi:10.1007/s11440-015-0411-y
Zhu, Y.-B., and Yu, H.-M. (2015). Unsaturated creep behaviors of weak intercalated soils in soft rock of Badong formation. J. Mt. Sci. 12 (6), 1460–1470. doi:10.1007/s11629-014-3298-4
Keywords: soft soil, soil creep, consolidation creep test, microstructure, SEM
Citation: Yuan J, Gan Y, Chen J, Tan S and Zhao J (2023) Experimental research on consolidation creep characteristics and microstructure evolution of soft soil. Front. Mater. 10:1137324. doi: 10.3389/fmats.2023.1137324
Received: 04 January 2023; Accepted: 06 February 2023;
Published: 16 February 2023.
Edited by:
Bing Bai, Beijing Jiaotong University, ChinaReviewed by:
Qingke Nie, Hebei Research Institute of Construction and Geotechnical Investigation Co. Ltd., ChinaYang Gaosheng, Shanxi Agricultural University, China
Copyright © 2023 Yuan, Gan, Chen, Tan and Zhao. This is an open-access article distributed under the terms of the Creative Commons Attribution License (CC BY). The use, distribution or reproduction in other forums is permitted, provided the original author(s) and the copyright owner(s) are credited and that the original publication in this journal is cited, in accordance with accepted academic practice. No use, distribution or reproduction is permitted which does not comply with these terms.
*Correspondence: Jian Chen, NjcyNDQ1Mzg5QHFxLmNvbQ==