 Aaron E. Tallman
 Tanaji Paul
 Arvind Agarwal
95% of researchers rate our articles as excellent or good
Learn more about the work of our research integrity team to safeguard the quality of each article we publish.
Find out more
ORIGINAL RESEARCH article
Front. Mater. , 07 July 2022
Sec. Computational Materials Science
Volume 9 - 2022 | https://doi.org/10.3389/fmats.2022.919797
This article is part of the Research Topic Uncertainty Quantification (UQ) in Characterization, Modelling, and Design of Materials View all 5 articles
The quantification of spatially variable mechanical response in structural materials remains a challenge. Additive manufacturing methods result in increased spatial property variations—the effect of which on component performance is of key interest. To assist iterative design of additively manufactured prototypes, lower-cost benchtop test methods with high precision and accuracy will be necessary. Profilometry-based indentation plastometry (PIP) promises to improve upon the instrumented indentation test in terms of the measurement uncertainty. PIP uses an isotropic Voce hardening model and inverse numerical methods to identify plasticity parameters. The determination of the baseline uncertainty of PIP test is fundamental to its use in characterizing spatial material property variability in advanced manufacturing. To quantify the uncertainty of the PIP test, ninety-nine PIP tests are performed on prepared portions of a traditionally manufactured Al 7075 plate sample. The profilometry data and the Voce parameter predictions are examined to distinguish contributions of noise, individual measurement uncertainty, and additional set-wide variations. Individual measurement uncertainty is estimated using paired profilometry measurements that are taken from each indentation. Principal component analysis is used to analyze and model the measurement uncertainty. The fitting procedure used within the testing device software is employed to examine the effect of profile variations on plasticity predictions. The expected value of the error in the plasticity parameters is given as a function of the number of tests taken, to support rigorous use of the PIP method. The modeling of variability in the presence of measurement uncertainty is discussed.
Additively manufactured (AM) metal components present new opportunities to simplify and improve high performance designs (Bajaj et al., 2020; Beaman et al., 2020; Allavikutty et al., 2021; Relativity Space, 2022). The obstacle to these applications is often the validation of component reliability, due to AM metal-endemic high defect concentrations and highly variable microstructure (Bermingham et al., 2015; Collins et al., 2016; Kok et al., 2018; Cocke et al., 2021; Snider-Simon and Frantziskonis, 2022). Empirical reliability testing can be used to capture failure rates (Samuel et al., 2018; Coro et al., 2019), but is too slow to inform design processes easily (Jared et al., 2017; Wiberg et al., 2019; Biedermann and Meboldt, 2020). Computational modeling of the reliability of additively manufactured components is thus of great interest (Hu and Mahadevan, 2017; Herriott et al., 2019; Cocke et al., 2021; Mahadevan et al., 2022; Snider-Simon and Frantziskonis, 2022). Broadly, approaches to modeling of spatially variable material properties are either full-field physics-based or reduced order, data-driven approaches.
Full-field, physics-based models of spatially varying properties depend on accurate physical models of microstructure generation and on validated models of material response that are sensitive to microstructure. Microstructure sensitive models of metal plasticity (McDowell, 2008; Yin et al., 2008; Wronski et al., 2018; Wen et al., 2020) can be used to produce expected bulk property variation for a given set of microstructure generating statistics (Adams et al., 2012, 2013a, 2013b; Groeber and Jackson, 2014; Diehl et al., 2017) by using many simulations of statistical volume elements (smaller than representative volume elements) of the microstructure (Kanit et al., 2003; Ostoja-Starzewski, 2006; Yin et al., 2008). Furthermore, the physics of the AM process can be used in lieu of statistics to instantiate microstructures (Herriott et al., 2019). Validating these complex models can be problematic primarily due to their need for data at multiple length and time scales. Recent progress in using full field data to calibrate the complex microstructure sensitive models has incorporated digital image correlation (Avril et al., 2008; Mello et al., 2017; Durmaz et al., 2022) and high resolution diffraction contrast tomography (Pokharel et al., 2014, 2015; Pandey and Pokharel, 2021). These procedures greatly improve the validation of microstructure sensitive models, but they are not high-throughput methodologies.
Reduced order and data-driven models of spatially varying properties use simplified formulations and often larger databases to reduce computational expense. Such methods are crucial to reliability modeling that includes microstructure-induced variability. For instance, invertible surrogate modeling is a valuable tool to accelerate the expensive crystal-plasticity FEM simulations of microstructure sensitive models in calibration with experiments (Yuan et al., 2018). Furthermore, results of the full simulation of the fabrication process can be approximated using a simplified model (Snider-Simon and Frantziskonis, 2022). The models of variability in this context must be able to clarify each relevant source of variability to support clear comparisons with validation data (Khalil et al., 2021). The quantification of each source of variability (porosity, grain morphology, crystallographic texture, etc.) requires additional experimental data in addition to careful statistical modelling.
To test and improve reliability models, high-throughput testing of components is needed. To establish precise estimates of the variation (in addition to the mean) of a property of interest, data collection methods must provide validation sets with statistically significant sample sizes (Boyce et al., 2017; Salzbrenner et al., 2017). Many methods have been considered, including fabrication of tensile specimens (Salzbrenner et al., 2017), nanoindentation (Kalidindi et al., 2010, 2016; Pathak and Kalidindi, 2015), and instrumented indentation testing (Herbert et al., 2001, 2006; Buljak and Maier, 2011; Campbell et al., 2021). Indentation based testing is advantageous in terms of speed and material volume, but the identification of plastic response is typically subject to large scatter due to the method (Campbell et al., 2021). Innovations in indentation-based testing have used FEM simulations to improve the consistency of property estimates (Cao and Lu, 2004; Syngellakis et al., 2017). Further improvements to the reliability of these approaches may yet be realized.
Profilometry-based indentation plastometry (PIP) is a recently developed indentation-based approach with growing research activity (Campbell et al., 2018, 2019, 2021; Burley et al., 2021; Tang et al., 2021; Gu et al., 2022). The technique has been shown to support prediction of bulk tensile specimen response for many ductile metals (Campbell et al., 2019, 2022; Tang et al., 2021; Gu et al., 2022). Crucially, PIP’s FEM-based fitting procedure reproduces the indentation profile, rather than a load-displacement curve, thus mitigating the identifiability problem (i.e. the non-uniqueness problem) that is typical of the indentation test (Campbell et al., 2019). The magnitude of this improvement has not yet been tested in the use-case of capturing material spatial variability. Furthermore, the qualification of a test for capturing spatial variations in bulk metal plasticity is not well-established.
The purpose of this work is to investigate the uncertainty of a large set of PIP measurements. To highlight the uncertainty of the PIP measurements, a traditionally manufactured wrought sample of Al 7075 plate was selected to allow the variation in measurements to be small. By considering the sources of uncertainty in the measurement set, the resolution limit of the PIP test is established. Potential modifications of the PIP test for improved precision are also investigated. An overview of the uncertainty quantification (UQ) framework is given in Section 2. The experimental data collection is given in Section 2.1. The FEM approach used to estimate plastic response is given in Section 2.2. The uncertainty analysis methods are given in Section 2.3. The results of the uncertainty quantification are given in Section 3. The discussion of the relative impact of different sources of uncertainty is given in Section 4, alongside proposed improvements to the PIP methodology to support quantification of spatial variation in plastic response.
The UQ in this work includes two key aspects that are omitted in typical UQ studies: 1) experimental data collection and 2) uncertainty sources not captured by the model. Broadly, UQ mostly focuses on a computational model only, in terms of the relationship between variations in input parameters and output predictions. Here, the subject of the UQ is a combined model and experiment (PIP). Furthermore, the experimental data contains variations, only some of which are captured by the model. Here, both captured and uncaptured variations will be investigated, whereas typical UQ only studies variations captured by the model. A schematic overview of the UQ framework employed in this manuscript is shown in Figure 1. The implications of this novel UQ framework on the integration of experimental data collection and modeling is further explored in Section 4.
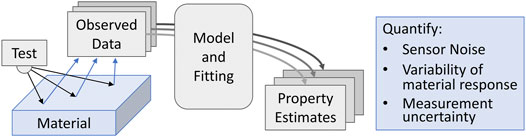
FIGURE 1. A schematic drawing of the UQ, uncertainty quantification framework of the PIP experiments. The test is repeated at multiple locations within the sample to produce multiple observations of indentation profilometry. The model and fitting procedure are kept fixed to produce a set of property estimates that reflect the effects of different categories of uncertainty. The UQ will estimate the contribution of each category listed, as explained in Section 2.3.
Aluminum 7075 alloy with temper designation T651 (Al 7075-T651) having density of 2.81 gcm−3, acquired in the form of a plate (McMASTER-CARR, 9037K11), was investigated. Two Al 7075-T651 specimens were prepared. For PIP, a 65 × 50 × 5 mm3 rectangular specimen was sectioned using a high-speed saw. The specimen was ground using silicon carbide papers from 400 to 1200 grit to achieve a smooth surface for indentation.
To characterize microstructure, a 7 × 8 × 5 mm3 rectangular specimen was sectioned. This sample was mounted in an epoxy resin and ground using silicon carbide papers up to 1200 grit. Final polishing of the sample was performed using 1 µm alumina and 0.05 µm silica suspension to a mirror finish. This was etched by Keller’s reagent for 45 s until the grain boundaries were revealed. Optical microscopy (Zeiss, Axio Lab A1) was used to observe the microstructure of the Al 7075-T561 specimen. The microstructure is shown in Figure 2. A schematic drawing of the uncertainty quantification (UQ) framework of the PIP experiments. The test is repeated at multiple locations within the sample to produce multiple observations of indentation profilometry. The model and fitting procedure are kept fixed to produce a set of property estimates that reflect the effects of different categories of uncertainty. The UQ will estimate the contribution of each category listed, as explained in Section 2.3.
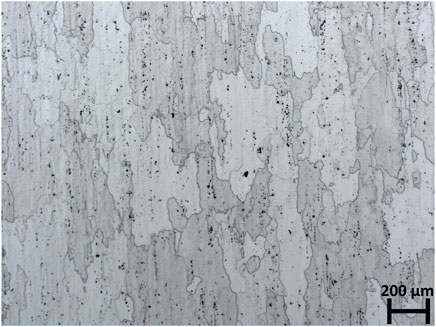
FIGURE 2. Optical micrograph of the Al 7075 T651 plate. The representative average grain size is 135 ± 70 µm estimated by line intercept method.
Grain size was estimated to be 135 ± 70 µm using the linear intercept method detailed in ASTM E112 (ASTM INTERNATIONAL, 2010). Importantly, the observed grain size distribution is much lower than 500 μm, i.e., the threshold for the PIP test. Below the threshold, variability in local microstructure is not expected to affect the accuracy of indentation predictions, as the plastic zone is estimated to contain at least a few dozen grains (Clyne et al., 2021).
A total of 99 PIP tests were conducted using an Indentation Plastometer (Plastometrex, PLX Indentation Plastometer v.1.0) equipped with an indenter tip, linear variable displacement transducer (LVDT), and a profilometer. The indenter tip is made of hard tungsten carbide spherical ball bearing with a radius of 1 mm. A LVDT is used for position control of the indenter and the profilometer with a resolution of 0.3 µm. The measurement of the indent profile is performed by a contacting stylus profilometer with a resolution of 0.4 µm. Before conducting the experiments, the elastic constants of aluminum alloy, such as Young’s modulus and Poisson’s ratio, were assigned in the FEM model using the dedicated software, “Software for the Extraction of Material Properties from Indentation Data” (SEMPID) available with the instrument. The instrument applied a compressive force on the sample to achieve an approximate penetration depth of 120 µm. The spacing between two adjacent indents was kept at 3 mm such that volumes of plastic deformation do not interact. The sample after indentations were taken is shown in Figure 3. After performing the indentation, the profilometer scanned the indent in two mutually perpendicular directions along the horizontal plane of the surface through the central axis of the indent. The target force (1250 or 1300 N) and the indenter profile measurements were used in the included fitting procedure, to estimate plasticity parameters.
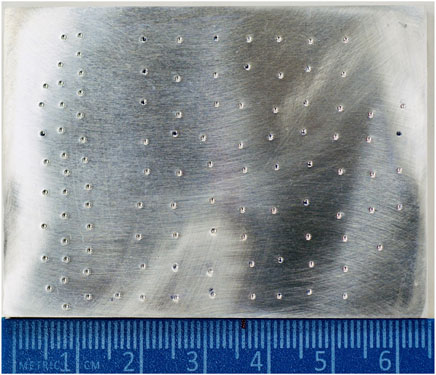
FIGURE 3. A picture of the sample after indentation measurements were taken. Indentations in excess of 99 were discarded due to loss of data.
In the PIP method, a numerical simulation (FEM) is used to infer plasticity from the indentation profile associated with a known indentation load. The relationship is inverse, so the simulation must be performed iteratively to optimize the parameters of the plasticity model to reproduce the observed profile. This process has been thoroughly documented elsewhere (Campbell et al., 2021; Clyne et al., 2021). The following overview is included to support discussion of uncertainty quantification.
The material is modeled as an isotropic, homogeneous, elasto-plastic solid (Campbell et al., 2018, 2019). Plastic strains are assumed to be consistent with the Voce Hardening model (Voce, 1948), i.e.,
where
The parameter values are determined by fitting the experimentally measured indentation profile
A look-up table of simulations results is referenced to find the best values of the three fitting parameters from a coarse grid of stored results. This acceleration allows the results of an iterative FEM process to be obtained within seconds on a standard desktop computer.
The misfit between the modelled profile and the experimental profile is calculated in a specific way to be robust to slight variations in applied load. For any look-up table approach, the number of pre-run simulations needed scales with the number of distinct indentation loads allowed in the indentation. In SEMPID, the possible indentation loads are multiples of 50 N (1200, 1250, 1300 N, etc.). This is referred to as the target load. PIP captures the measured load (obtained from the LVDT during the test) in addition to the target load. In the set of indentations made in this work, the measured load varied by up to 15 N from the target load. These variations in load (perhaps due to controller imprecision) have effects on the profilometry. To accommodate slight variations in experimental indentation displacement, the modelled profiles are all raised or lowered to be coincident with the experimental profile at
The data obtained from the PIP tests and plasticity parameter estimates are the subject of this work, whereas the uncertainty quantification are the results. Thus, the plasticity estimates are shown here. The parameter estimates obtained for the 84 indentations are shown in Figure 4. Each parameter is shown as an empirical cumulative distribution function (ECDF), to highlight the regular spacing between the possible parameter values. A normal distribution fit to the SEMPID results is also shown, to provide comparison with the marginal distributions of the parameter estimates. The PIP test captures a weighted average of the response of the deformed grains, so the Central Limit Theorem indicates a normal distribution is appropriate. The best fit with the normal distribution is shown by the yield stress. The other plasticity parameters exhibit high standard deviations relative to their mean predicted values. This is likely a result of a poorly conditioned relationship between the parameters and the data, i.e., an identifiability problem.
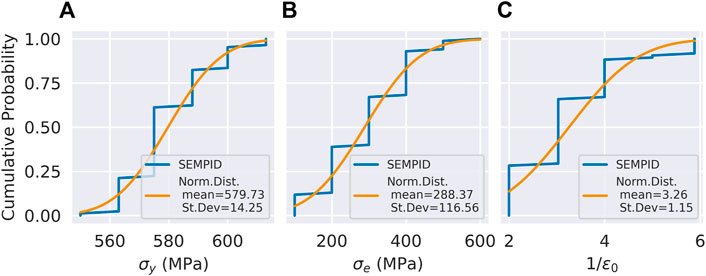
FIGURE 4. The marginal ECDFs, empirical cumulative distribution functions of the SEMPID plasticity parameter estimates from the PIP test set with 1250 N target indentation load, for the yield stress (A), the excess stress (B), and the inverse of the characteristic strain (C).
The joint distribution of the Voce parameter estimates from SEMPID are shown in Figure 5. The variations in the three parameters are highly correlated. High correlation can be an indication of problems with parameter non-uniqueness. Importantly, the variations in the parameters are due to small variations in the measured indentation profiles. The analysis of these profile variations is presented in Section 2.3.
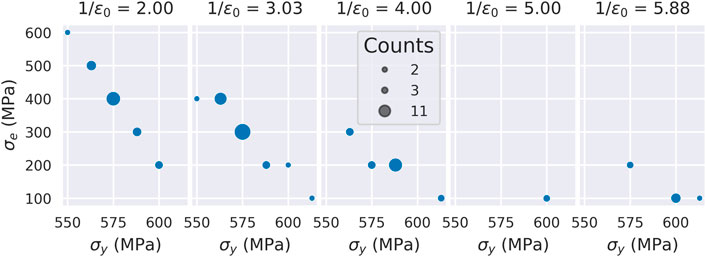
FIGURE 5. The joint distribution of the SEMPID plasticity parameter estimates from the PIP test set with 1250 N target indentation load. Coincident data are combined, and the size of the plotted point indicates the number of observations at that coordinate of parameter values.
PIP is typically performed once on a sample. In the current work, repetition of PIP is explored. The plate material is expected to show very little spatial variation in plasticity as the processing history is consistent throughout the sample. Nevertheless, small differences between indentation profiles can have non-negligible effects on plasticity predictions, as shown previously in Figure 5. The categorization of the sources of uncertainty present in the collected data is a key objective of this work. In other words, this work identifies what uncertainties exist in the individual measurements from PIP, and whether the variation in a set of measurements (referred to as set uncertainty, SU) can be distinguished from individual measurement uncertainties (indicated as measurement uncertainty, MU). To leverage PIP as a high-throughput mechanical property test, these uncertainties must be quantified. This work focuses on the profilometry measurements; however, issues of parameter non-uniqueness and model form uncertainty are discussed in Section 4.
The use of PIP to gather statistical data on a material can be considered as a data collection and an inference. The data collection provides profilometry data and associated load measurements. The inference step performs noise filtering and plastic parameter estimation via curve fitting. The curve fitting procedure is not altered in this work--uncertainty in the data collection is the focus. Further, each source of uncertainty is interpreted in terms of the effect it has on plastic parameter estimates. Measurement noise, MU, and SU are all quantities of interest in this work. Table 1 shows a summary of the likely contributions to each of the quantities of interest. It is noted that 15 profiles are removed prior to the analysis of noise and measurement uncertainty to limit the study to profiles from a similar load. The effect of this on the interpretation of the results is discussed in Section 4.
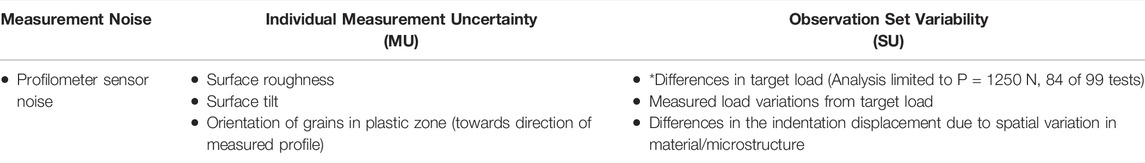
TABLE 1. A summary of the likely contributing factors pertaining to each of the categories of uncertainty present in the experimental data set. The influence of the factor marked with an asterisk is not examined in this work.
In the current statistical work, it is crucial to distinguish noise from other sources of uncertainty. Discrepancy between the model assumptions and the actual specimen (both in geometry and material response) is likely to present in the MU and is distinct from noise. The isolation of the discrepancy to specific physics missing from the model requires additional modeling work. However, measuring MU as a category provides an estimate of the extent of such effects. After noise is filtered out, the MU (including the effects of material inhomogeneity, for instance) may be estimated with greater specificity and accuracy, improving any future comparisons to microstructure sensitive modeling. It is noted that in typical PIP usage, both noise and MU are of limited significance.
The choice of noise filtering method can affect plasticity parameter predictions. The Plastometrex analysis interpolates the experimental profiles before calculating fit to a model, filtering out noise in the process. This is also known as downsampling. Typically, a low-pass filter is employed prior to downsampling (Buades et al., 2005; Rao, 2012). A low-pass filter is used to give a comparison to the default Plastometrex approach, and both methods are described in the Supplementary Material. For each experimental profile, the fitting procedure detailed in Section 2.2 is performed against all the modelled profiles obtained while gathering the PIP results. When the noisy experimental profile and the filtered profile fit best with different modelled profiles, this indicates that the noise filtering process non-negligibly altered the information contained in the profile.
A comparison of the two noise filtering techniques is shown in Figure 6, which plots the predictions of yield strength after each noise filtering approach against the predictions matching the unfiltered experimentally obtained profiles. Marker size is used to denote multiple coincident estimates. Markers that do not fall on the diagonal line denote estimates that are altered by the noise filtering. The magnitude of the effect of the noise filtering methods is summarized as a coefficient of determination, i.e.,
where
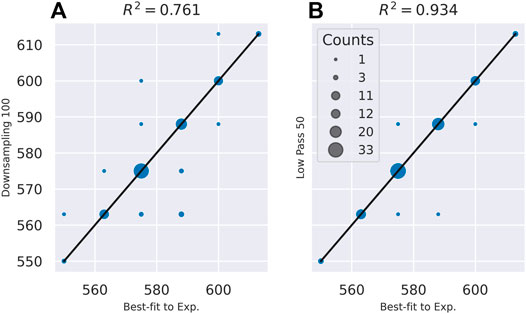
FIGURE 6. The scatter plot comparing the estimates of yield strength obtained by fitting modelled profiles to the raw experiment data against the yield strength estimates from fitting modelled profiles to the noise filtered experiment data using (A) the downsampling from PIP, and (B) using a low-pass filter.
MU is estimated by comparing the profiles taken in the X and Y directions, with respect to each indentation. To quantify the uncertainty in a single PIP measurement, it is necessary to have more than one observation associated with the indentation test. The Plastometrex device takes two profiles, in perpendicular directions, to check for signs of pronounced anisotropy in the plane of the surface. In this work, the two profiles are used to show variations in the profilometry measurement.
To isolate the MU, systematic differences between X and Y profiles are removed. The systematic difference between X and Y directions may be caused by differences in the shape of the indenter tip along the X and Y profiles, by texture in the plate sample, or by a non-zero average tilt to the polished surface of the sample. The systematic difference is measured for the 84 selected and low-pass-filtered profiles and is shown in Figure 7. The difference profile has a maximum magnitude of 1.2
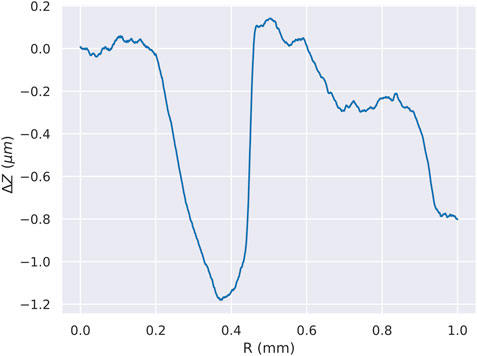
FIGURE 7. The average of the difference profiles obtained by comparing each pair of X and Y profiles in the observation set.
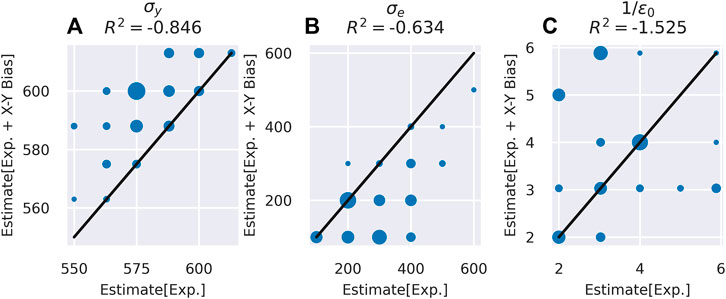
FIGURE 8. Scatter plots of the X-Y bias’s effect on the PIP predictions of the Voce parameter values for the 84 profiles in the reduced set (A) yield stress (B) excess stress (C) 1/
Random variations in the X-Y profile differences are used to estimate the MU of the PIP test using principal component analysis (PCA). Whereas noise is considered uncorrelated with respect to
The PCA is applied using the python package scikit-learn (Pedregosa et al., 2011). A simplified description of the method is given here. The variations (Z (profile 10)—Z (profile y)—X-Y Bias) are organized into a
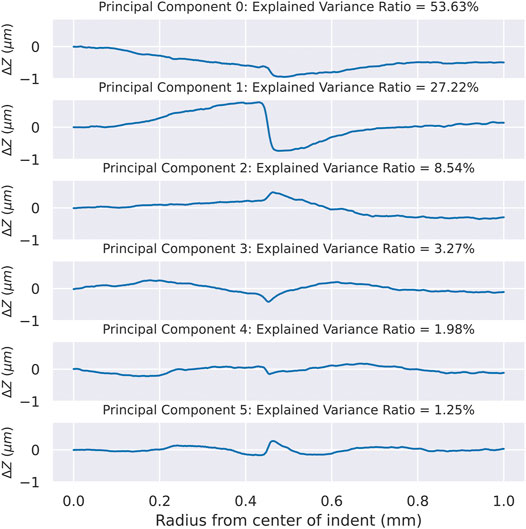
FIGURE 9. The principal components used to approximate the random variations observed in the 84 experimentally measured indentation profiles, after noise filtering with a low pass filter.
In this work, PCA is used to perform a linear analysis only. Because the variations in the observation set are all small perturbations of roughly the same profile shape, a linear analysis is likely to be sufficient for capturing trends. For example, PC1 modifies the radius of the indentation. This radius adjustment can only be a linear effect if the adjustments are small. The high total explained variance of the 6PCs (95.89%) indicates the PC analysis is effective in this case. Notably, the PC approximation of the profiles lead to consistent Voce parameter predictions, relative to the raw experimental profiles. The
The uncertainty sources isolated in Section 2.3 and hypothesis testing can be used to provide empirical support for two different interpretations of the set of results, determined by whether SU is measurable in the presence of MU. If the MU and SU cannot be distinguished, the test results can be interpreted as indeterminate. In other words, evidence cannot support attributing the uncertainty to a specific source, and the most conservative treatment may depend on the intended use of the testing data. If there is a measurable difference between MU and SU, a more precise level of material spatial variability can be modeled from the set of results, and the SU can be quantified and attributed to the spatial variation of plastic response in a polycrystalline sample. The results of this work focus on determining the appropriate interpretation of the data set and presenting the interpretation.
Variations in the set of PIP measurements must be tested to determine if they are drawn from the same distribution as the MU (the null hypothesis) or from a different distribution. Each pair of the 84 profiles in the reduced set are used to generate 7310 pairwise differences,
where
In this work, the K-S 2-sample test is applied to the PCA representation of both profile-difference sets: associated with individual indentations (MU) and the set of indentations (SU + MU), respectively. Clearly, the set profile-differences should include the variations from the individual indentation profile-differences in addition to the variations between indentations. With this reasoning, the PCs from the individual indentation profile-differences are used to approximate the set profile-differences. The PC approximation of the set profile-differences had nearly equal goodness of fit as the PC approximation of the individual indentation profile-differences, with 80% of profiles in either case having
The PC weights used to approximate the profile-differences are used to form ECDFs. A K-S 2-sample test is performed on each of the 6 PCs. The probabilities of these tests are shown in Table 2. The value of the variances of the PC weights are also included for each type of profile-differences. The best way to interpret the probabilities returned by these tests is not immediately clear. The naïve option of taking the product of the individual probabilities is problematic, as it treats each PC as equally informative when clearly this is not the case. A weighted product could impose the differently sized contributions of the PCs, i.e.,
where
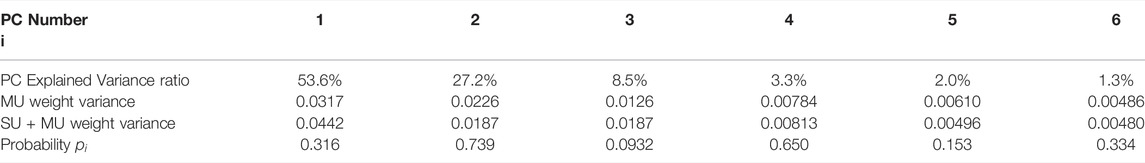
TABLE 2. The probabilities associated with the series of K-S 2-sample tests performed on the sets of PC weights. The K-S test is repeated for each PC used to approximate the profile-differences from individual indentations and from the entire set.
The total uncertainty is used to predict how many indentation tests are needed to obtain a given level of expected error. Using the results of the K-S 2-Sample test, the indentation test set variation is interpreted as indistinguishable. In essence, the uncertainty cannot be attributed to any specific source, given the data set. This allows a simple approach to calculating the expected value of error in the Voce parameter predictions. If the experiment was to be repeated with a different number of indentations, it is important to know what error would accompany the mean estimate of the plastic parameters.
To estimate prediction error as a function of the number of tests, the set of results is used in a bootstrapping approach. A sample of test results are drawn with replacement from the 84 tests in the analyzed set. The average of that sample is taken. This process is repeated 1000 times. The expected error in the Voce parameters is estimated as a function of the number of indentation tests performed. These results are shown in Figure 10. The root mean square (RMS) error, taken from 1000 drawings of N test results (where N is the number of tests), is plotted against
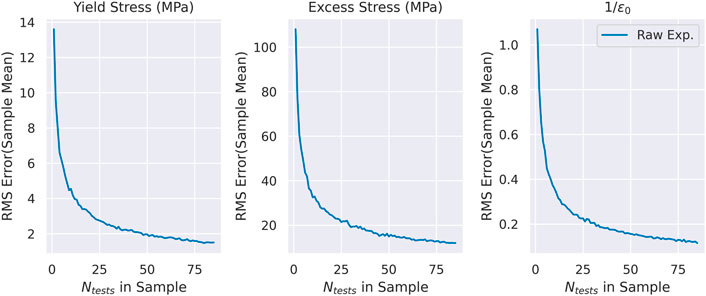
FIGURE 10. Prediction of the error in the predictions of the Voce plasticity parameters, based on the number of indentation tests in the sample. The plotted values are the root mean square (RMS) of the errors calculated from 1000 different random samples drawn (with replacement) from the experiment set.
Importantly, the expected error is of a different relative amount for the different parameters. This is shown more clearly in Figure 11. The probability that an error of less than 2% is shown as a function of the number of tests in the sample. It is visible that the yield stress can be accurately estimated with fewer than 20 test repetitions, for this material. The hardening behavior, as captured with the excess stress and reference strain parameter estimates, is not well estimated by even large numbers of test repetitions. This difficulty may indicate the need to consider issues in “parameter uniqueness” associated with the combination of the Voce plasticity model and the PIP methodology.
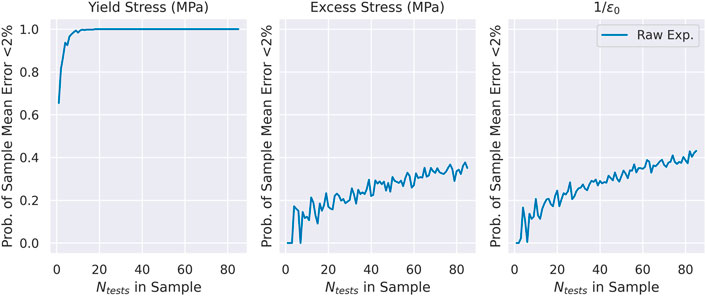
FIGURE 11. Bootstrapping based prediction of the probability that less than 2% relative error in the sample mean of plasticity parameter estimates will be obtained, as a function of the number of tests within the sample.
The experiment-model joint UQ framework demonstrated in this work facilitates the integration of experiments and modeling in the testing of variability in the mechanical response of materials. In the determination of plastic response of metals, a uniaxial tensile test is the widely accepted standard, despite the convenience of indentation testing (Salzbrenner et al., 2017; Clyne et al., 2021; Mohan et al., 2021). The tensile test produces repeatable results and is often insensitive to small spatial fluctuations in yield strength, relative to the specimen cross-sectional area (Nichols, 1980). In contrast, the indentation test involves severe strain gradients, the majority of the observed deformation occurs within a small volume of material (Clyne et al., 2021), and local variations in properties can influence the test results, more so than in a tensile test. In typical statistical treatments of testing data, the additional variance in the indentation test results would weaken the conclusions from the tests in the form of wider error margins. In contrast, with the UQ framework, the variation in the indentation test results can be used to infer variation in material properties. New testing conditions can be designed to take even more advantage of the UQ framework. Crucially, embedding experimental data analysis in the context of a computational model is what enables the variation in experimental results to be an asset. In material systems with highly variable properties (such as additively manufactured metals or metal matrix composites), such a shift in testing design may greatly accelerate the development process.
The demonstrated UQ framework presents a complementary approach to parametric uncertainty propagation and may be highly suited to multiscale modeling of mechanics. The mechanical properties of metals are often investigated using hierarchical multiscale modeling, that is, models of materials at different distinct length and time scales, used in combination (McDowell, 2010). The hierarchical approach uses model parameters to connect between scales, rather than boundary conditions. Informing hierarchical multiscale models is typically done from the top-down (e.g., the plasticity model in this work), the bottom-up (as is demonstrated in uncertainty propagation studies), or rarely, in a combination of top-down and bottom-up pathways. Top-down approaches are limited by the identifiability problem; i.e., the model parameters cannot always be given unique values by fitting predictions to data (Arendt et al., 2012). Bottom-up approaches can produce distributions or intervals that are unreasonably wide (Salehghaffari et al., 2012), unless the analysis is very selective about the uncertainty being considered (Bandyopadhyay et al., 2019; Kotha et al., 2020; Tan et al., 2021). The combination of top-down and bottom-up has been proposed as a way to make use of more sources of information at once while also finding compromise between the limitations of either pathway (Panchal et al., 2013; Arróyave and McDowell, 2019; Tallman et al., 2017, 2020). Some recent work has investigated hierarchical multiscale modeling by generating uncertainty from the bottom-up and constraining the variation in a top-down manner (Liu et al., 2021; Kovachki et al., 2022). In the current work, the experimental data provides a top-down constraint for variation, and the quantification of uncertainty from individual sources is left to future work. Individual uncertainty sources could be propagated from the bottom-up using higher-resolution modeling or measured from the top-down through a design of experiments that controls for individual uncertainty sources. Applying the UQ framework from this work would constrain multiscale UQ predictions with empirical estimates of uncertainty. Furthermore, the framework addresses the need for richer datasets in UQ, more so than typical statistical treatments of experimental data.
The experiment focused UQ can direct improvements in test methods and modeling by isolating the effects of model discrepancy or MU. The plate Al-7075 material is produced to have very little variability in bulk properties in the spatial domain. Thus, the reported finding of little variation within the set (beyond the MU) is as expected. In this case, the MU was found to be too large to allow estimation of material property variability. In other material samples with larger spatial variations, the PIP method as used here may be sufficient to obtain estimates of the material spatial variability. However, to improve the accuracy of local variability estimates it is valuable to discuss the limitations present in the current method. Furthermore, means of reducing MU and improving the accuracy of estimates are identified and discussed.
The set of indentations with target load of 1250 N included measured load values that varied from 1248 N to 1266 N. These variations in the maximum indentation load have influence on the profile variations, and these variations are not reflected in the modelled profiles used to determine the Voce parameters (the modelled profiles adhere to 50 N increments). It is important to distinguish between the effect of load variations and differences in material response when interpreting the data.
Using a linear regression, the effect of the load variations can be estimated and removed from the set variations. The model of the load variation effects is given as,
where
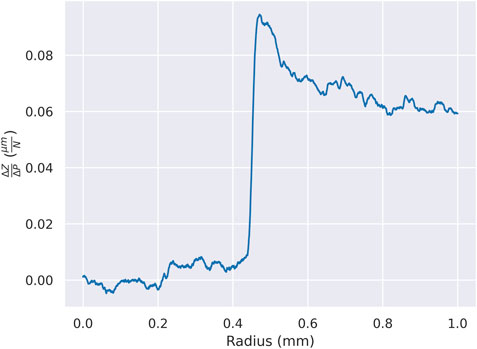
FIGURE 12. The linear model of the effect on the indentation profile of small variations in the maximum indentation load. A variation of 11 N translates to roughly a one-micron difference in the profile depth.
The set of profiles are adjusted using the regression model and the individually measured maximum indentation loads. The effect on the Voce parameter predictions is summarized in
Gathering and averaging multiple profiles per indentation can reduce the MU of the indentation tests. When determining variability in PIP data, smaller variations in profilometry measurements become important. In this work, the variations due to noise filtering methods and due to material heterogeneity or surface roughness are modeled in effective terms, using the PIP fitting of Voce parameters. Importantly, the profilometry can vary enough within a single indentation (in which anisotropy and asymmetry were not detected) to produce different Voce parameter estimates. The FEM modeling used to evaluate Voce parameters assumes the material as isotropic and homogeneous, and that the indentation has radial symmetry. As an extension of that assumption, profilometry data can be equivalently collected radially from the indentation center in any direction without altering the model assumptions. Furthermore, averaging these observations prior to parameter fitting is also in agreement with the assumptions of the FEM model. The effect of using two profile measurements instead of one is explored here.
A set of 84 double profiles is used to demonstrate the MU reduction that can be obtained in future studies. The X and Y profiles are combined by taking the mean of the X and Y profiles and removing the X-Y bias. X-Y bias is excluded to prevent texture from influencing the results. The quantity of interest is the effect of using multiple profiles when the profiles have random MU. The effect of using two profiles is summarized in
The mean and standard deviation of the predictions are used to compare the different modified profile sets in terms of predictions. The K-S 2-Sample test is repeated for the load-adjusted profile variations, the combined X and Y profiles, and the combined and load-adjusted profiles. The probability of the two samples (individual measurement variations and the set variations) being from the same distribution is shown for each profile set in Table 3 alongside the Voce parameter prediction means and standard deviations. The standard deviation decreases after load adjustment and after using the double profile approach, for each Voce parameter. The estimate means are held consistent within 2% of the original mean for yield stress, within 10% for excess stress, and within 5% for
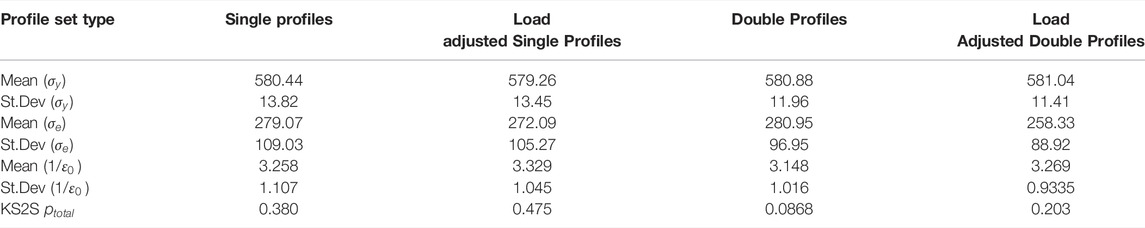
TABLE 3. The Voce parameter prediction means and standard deviations and the total probability determined by the K-S 2-Sample test, for each of the profile sets analyzed in this work. The single profiles are the X-profiles, the load adjusted single profiles are X-profiles minus the linear regression model of load-variation effects on profilometry. The double profiles are the X profiles averaged with the Y profiles with respect to each indentation, after adjusting the Y profiles for bias. The load adjusted double profiles use a different regression model, based on the double profile set, to adjust profiles for the variations in loading between indentations.
The surface polishing prior to indentation testing may need a higher quality finish to support variability studies, relative to what is recommended for the PIP method. The X-Y bias was shown to have large effects on the Voce estimates, despite the size of the difference profile being around 1.2 microns. A study on surface roughness effects on variability predictions may determine the appropriate level of surface finish needed.
Non-uniqueness in parameters is still a relevant concern for PIP practitioners. The PIP method is shown to be notably more consistent with predictions of
Furthermore, one-step indentation profilometry has limited resolution in terms of strain-dependent plastic response. As stated, the PIP test uses the indentation profile to infer the plastic response of the displaced material. The profile shape is a collective result of a volume of material that has experienced different amounts of plastic strain (Clyne et al., 2021). The collective hardening response obtainable from that volume is an averaging of different instantaneous hardening rates. Future work may explore what additional data could better indicate the change in hardening rate as a function of plastic strain. One option could take profilometry data at different indentation depths during one indentation test. This would provide multiple “snapshots” of the effective hardening response and would support inferring changes in hardening rate with the accumulation of plastic strain.
This work demonstrates the significant MU reductions that can be attained by gathering and averaging multiple profiles from a single indentation test. The reduction of MU in the PIP test is crucial for it to provide high quality characterization of spatially variable plasticity in metals. Importantly, this method requires no additional hardware. This insight constitutes a significant and accessible step towards high-throughput, high-precision collection of spatially varying bulk plastic response.
In this work, the sources of uncertainty in a set of PIP tests of Al 7075 are categorized to assess obstacles to experimental testing of spatially varying plastic response in metals. The effect on plasticity estimates due to noise filtering, profile orientation bias, and small variations in indentation load are shown to be non-negligible for studies of the variation in properties. It is estimated that 10 PIP tests would be sufficient to estimate yield stress within a 2% margin, for this material. The Al 7075 hardening response estimates from PIP are shown to have significantly more error and sensitivity to variations in profilometry. Most importantly, the value of taking and using two profiles from a single indentation is demonstrated, and the consequent reduction of MU is significant enough to support measurement of spatial variation in properties.
The raw data supporting the conclusions of this article will be made available by the authors upon request, without undue reservation.
The research was conceived by AT, TP, and AA. Funding was obtained by AA. The experiments were conducted by DJ. The data was analysed by AT. The manuscript was drafted by AT and DJ. All authors contributed to editing the manuscript.
The authors acknowledge the financial support of Army Research Laboratory (ARL) grant W911NF2020256.
The authors declare that the research was conducted in the absence of any commercial or financial relationships that could be construed as a potential conflict of interest.
All claims expressed in this article are solely those of the authors and do not necessarily represent those of their affiliated organizations, or those of the publisher, the editors and the reviewers. Any product that may be evaluated in this article, or claim that may be made by its manufacturer, is not guaranteed or endorsed by the publisher.
The Advanced Materials Engineering Research Institute (AMERI) at FIU is greatly acknowledged for the characterization facilities used in this study.
The Supplementary Material for this article can be found online at: https://www.frontiersin.org/articles/10.3389/fmats-2022-919797/full#supplementary-material
Adams, B. L., Kalidindi, S., and Fullwood, D. T. (2012). Microstructure Sensitive Design for Performance Optimization. Boston: Butterworth-Heinemann.
Adams, B. L., Kalidindi, S. R., and Fullwood, D. T. (2013a). “Chapter 4 - Description of the Microstructure,” in Microstructure Sensitive Design for Performance Optimization (Boston: Butterworth-Heinemann), 67–87. doi:10.1016/B978-0-12-396989-7.00004-6
Adams, B. L., Kalidindi, S. R., and Fullwood, D. T. (2013b). “Chapter 8 - Homogenization Theories,” in Microstructure Sensitive Design for Performance Optimization (Boston: Butterworth-Heinemann), 171–181. doi:10.1016/B978-0-12-396989-7.00008-3
Allavikutty, R., Gupta, P., Santra, T. S., and Rengaswamy, J. (2021). Additive Manufacturing of Mg Alloys for Biomedical Applications: Current Status and Challenges. Curr. Opin. Biomed. Eng. 18, 100276. doi:10.1016/j.cobme.2021.100276
Arendt, P. D., Apley, D. W., and Chen, W. (2012). Quantification of Model Uncertainty: Calibration, Model Discrepancy, and Identifiability. J. Mech. Des. 134, 100908. doi:10.1115/1.4007390
Arróyave, R., and McDowell, D. L. (2019). Systems Approaches to Materials Design: Past, Present, and Future. Annu. Rev. Mat. Res. 49, 103–126. doi:10.1146/annurev-matsci-070218-125955, :
ASTM INTERNATIONAL(2010). Standard Test Methods for Determining Average Grain Size 03.01. 1–27.Astm E112-10. doi:10.1520/E0112-13R21
Avril, S., Bonnet, M., Bretelle, A.-S., Grédiac, M., Hild, F., Ienny, P., et al. (2008). Overview of Identification Methods of Mechanical Parameters Based on Full-Field Measurements. Exp. Mech. 48, 381–402. doi:10.1007/s11340-008-9148-y
Bajaj, P., Hariharan, A., Kini, A., Kürnsteiner, P., Raabe, D., and Jägle, E. A. (2020). Steels in Additive Manufacturing: A Review of Their Microstructure and Properties. Mater. Sci. Eng. A 772, 138633. doi:10.1016/j.msea.2019.138633
Bandyopadhyay, R., Prithivirajan, V., and Sangid, M. D. (2019). Uncertainty Quantification in the Mechanical Response of Crystal Plasticity Simulations. JOM 71, 2612–2624. doi:10.1007/s11837-019-03551-3
Beaman, J. J., Bourell, D. L., Seepersad, C. C., and Kovar, D. (2020). Additive Manufacturing Review: Early Past to Current Practice. J. Manuf. Sci. Eng. 142, 110812. doi:10.1115/1.4048193
Bermingham, M. J., Kent, D., Zhan, H., StJohn, D. H., and Dargusch, M. S. (2015). Controlling the Microstructure and Properties of Wire Arc Additive Manufactured Ti-6Al-4V with Trace Boron Additions. Acta Mater. 91, 289–303. doi:10.1016/j.actamat.2015.03.035
Biedermann, M., and Meboldt, M. (2020). Computational Design Synthesis of Additive Manufactured Multi-Flow Nozzles. Addit. Manuf. 35, 101231. doi:10.1016/j.addma.2020.101231
Boyce, B. L., Salzbrenner, B. C., Rodelas, J. M., Swiler, L. P., Madison, J. D., Jared, B. H., et al. (2017). Extreme-Value Statistics Reveal Rare Failure-Critical Defects in Additive Manufacturing. Adv. Eng. Mat. 19, 1700102. doi:10.1002/adem.201700102
Buades, A., Coll, B., and Morel, J. M. (2005). A Review of Image Denoising Algorithms, with a New One. Multiscale Model. Simul. 4, 490–530. doi:10.1137/040616024
Buljak, V., and Maier, G. (2011). Proper Orthogonal Decomposition and Radial Basis Functions in Material Characterization Based on Instrumented Indentation. Eng. Struct. 33, 492–501. doi:10.1016/j.engstruct.2010.11.006
Burley, M., Campbell, J. E., Reiff-Musgrove, R., Dean, J., and Clyne, T. W. (2021). The Effect of Residual Stresses on Stress–Strain Curves Obtained via Profilometry-Based Inverse Finite Element Method Indentation Plastometry. Adv. Eng. Mat. 23, 2001478. doi:10.1002/adem.202001478
Campbell, J. E., Thompson, R. P., Dean, J., and Clyne, T. W. (2018). Experimental and Computational Issues for Automated Extraction of Plasticity Parameters from Spherical Indentation. Mech. Mater. 124, 118–131. doi:10.1016/j.mechmat.2018.06.004
Campbell, J. E., Thompson, R. P., Dean, J., and Clyne, T. W. (2019). Comparison between Stress-Strain Plots Obtained from Indentation Plastometry, Based on Residual Indent Profiles, and from Uniaxial Testing. Acta Mater. 168, 87–99. doi:10.1016/j.actamat.2019.02.006
Campbell, J. E., Zhang, H., Burley, M., Gee, M., Fry, A. T., Dean, J., et al. (2021). A Critical Appraisal of the Instrumented Indentation Technique and Profilometry-Based Inverse Finite Element Method Indentation Plastometry for Obtaining Stress–Strain Curves. Adv. Eng. Mat. 23, 2001496. doi:10.1002/adem.202001496
Campbell, J. E., Gaiser-Porter, M., Gu, W., Ooi, S., Burley, M., Dean, J., et al. (2022). Indentation Plastometry of Very Hard Metals. Adv. Eng. Mater., 2101398. doi:10.1002/adem.202101398
Cao, Y. P., and Lu, J. (2004). A New Method to Extract the Plastic Properties of Metal Materials from an Instrumented Spherical Indentation Loading Curve. Acta Mater. 52, 4023–4032. doi:10.1016/j.actamat.2004.05.018
Clyne, T. W., Campbell, J. E., Burley, M., and Dean, J. (2021). Profilometry‐Based Inverse Finite Element Method Indentation Plastometry. Adv. Eng. Mat. 23, 2100437. doi:10.1002/adem.202100437
Cocke, C. K., Rollett, A. D., Lebensohn, R. A., and Spear, A. D. (2021). The AFRL Additive Manufacturing Modeling Challenge: Predicting Micromechanical Fields in AM IN625 Using an FFT-Based Method with Direct Input from a 3D Microstructural Image. Integr. Mater Manuf. Innov. 10, 157–176. doi:10.1007/s40192-021-00211-w
Collins, P. C., Brice, D. A., Samimi, P., Ghamarian, I., and Fraser, H. L. (2016). Microstructural Control of Additively Manufactured Metallic Materials. Annu. Rev. Mat. Res. 46, 63–91. doi:10.1146/annurev-matsci-070115-031816
Coro, A., Macareno, L. M., Aguirrebeitia, J., and López de Lacalle, L. N. (2019). A Methodology to Evaluate the Reliability Impact of the Replacement of Welded Components by Additive Manufacturing Spare Parts. Metals 9, 932. doi:10.3390/met9090932
Diehl, M., Groeber, M., Haase, C., Molodov, D. A., Roters, F., and Raabe, D. (2017). Identifying Structure–Property Relationships through DREAM.3D Representative Volume Elements and DAMASK Crystal Plasticity Simulations: An Integrated Computational Materials Engineering Approach. JOM 69, 848–855. doi:10.1007/s11837-017-2303-0
Durmaz, A. R., Natkowski, E., Arnaudov, N., Sonnweber-Ribic, P., Weihe, S., Münstermann, S., et al. (2022). Micromechanical Fatigue Experiments for Validation of Microstructure-Sensitive Fatigue Simulation Models. Int. J. Fatigue 160, 106824. doi:10.1016/j.ijfatigue.2022.106824
Epps, B. P., and Krivitzky, E. M. (2019). Singular Value Decomposition of Noisy Data: Noise Filtering. Exp. Fluids 60, 126. doi:10.1007/s00348-019-2768-4
Groeber, M. A., and Jackson, M. A. (2014). DREAM.3D: A Digital Representation Environment for the Analysis of Microstructure in 3D. Integr. Mater Manuf. Innov. 3, 56–72. doi:10.1186/2193-9772-3-5
Gu, W., Campbell, J., Tang, Y., Safaie, H., Johnston, R., Gu, Y., et al. (2022). Indentation Plastometry of Welds. Adv. Eng. Mater., 2101645. doi:10.1002/adem.202101645
Herbert, E. G., Pharr, G. M., Oliver, W. C., Lucas, B. N., and Hay, J. L. (2001). On the Measurement of Stress-Strain Curves by Spherical Indentation. Thin Solid Films 398-399, 331–335. doi:10.1016/S0040-6090(01)01439-0
Herbert, E. G., Oliver, W. C., and Pharr, G. M. (2006). On the Measurement of Yield Strength by Spherical Indentation. Philos. Mag. 86, 5521–5539. doi:10.1080/14786430600825103
Herriott, C., Li, X., Kouraytem, N., Tari, V., Tan, W., Anglin, B., et al. (2019). A Multi-Scale, Multi-Physics Modeling Framework to Predict Spatial Variation of Properties in Additive-Manufactured Metals. Model. Simul. Mat. Sci. Eng. 27, 025009. doi:10.1088/1361-651X/aaf753
Hu, Z., and Mahadevan, S. (2017). Uncertainty Quantification and Management in Additive Manufacturing: Current Status, Needs, and Opportunities. Int. J. Adv. Manuf. Technol. 93, 2855–2874. doi:10.1007/s00170-017-0703-5
Jared, B. H., Aguilo, M. A., Beghini, L. L., Boyce, B. L., Clark, B. W., Cook, A., et al. (2017). Additive Manufacturing: Toward Holistic Design. Scr. Mater. 135, 141–147. doi:10.1016/j.scriptamat.2017.02.029
Kalidindi, S. R., Niezgoda, S. R., Landi, G., Vachhani, S., and Fast, T. (2010). A Novel Framework for Building Materials Knowledge Systems. CMC Comput. Mat. Contin. 17, 103–126. doi:10.3970/cmc.2010.017.103
Kalidindi, S. R., Medford, A. J., and McDowell, D. L. (2016). Vision for Data and Informatics in the Future Materials Innovation Ecosystem. JOM 68, 2126–2137. doi:10.1007/s11837-016-2036-5
Kanit, T., Forest, S., Galliet, I., Mounoury, V., and Jeulin, D. (2003). Determination of the Size of the Representative Volume Element for Random Composites: Statistical and Numerical Approach. Int. J. Solids Struct. 40, 3647–3679. doi:10.1016/S0020-7683(03)00143-4
Khalil, M., Teichert, G. H., Alleman, C., Heckman, N. M., Jones, R. E., Garikipati, K., et al. (2021). Modeling Strength and Failure Variability Due to Porosity in Additively Manufactured Metals. Comput. Methods Appl. Mech. Eng. 373, 113471. doi:10.1016/j.cma.2020.113471
Kok, Y., Tan, X. P., Wang, P., Nai, M. L. S., Loh, N. H., Liu, E., et al. (2018). Anisotropy and Heterogeneity of Microstructure and Mechanical Properties in Metal Additive Manufacturing: A Critical Review. Mater. Des. 139, 565–586. doi:10.1016/j.matdes.2017.11.021
Konold, C., and Pollatsek, A. (2002). Data Analysis as the Search for Signals in Noisy Processes. J. Res. Math. Educ. 33, 259–289. doi:10.2307/749741
Kotha, S., Ozturk, D., and Ghosh, S. (2020). Uncertainty-quantified Parametrically Homogenized Constitutive Models (UQ-PHCMs) for Dual-Phase α/β Titanium Alloys. Npj Comput. Mat. 6, 1–20. doi:10.1038/s41524-020-00379-3
Kovachki, N., Liu, B., Sun, X., Zhou, H., Bhattacharya, K., Ortiz, M., et al. (2022). Multiscale Modeling of Materials: Computing, Data Science, Uncertainty and Goal-Oriented Optimization. Mech. Mater. 165, 104156. doi:10.1016/j.mechmat.2021.104156
Liu, B., Sun, X., Bhattacharya, K., and Ortiz, M. (2021). Hierarchical Multiscale Quantification of Material Uncertainty. J. Mech. Phys. Solids 153, 104492. doi:10.1016/j.jmps.2021.104492
Mahadevan, S., Nath, P., and Hu, Z. (2022). Uncertainty Quantification for Additive Manufacturing Process Improvement: Recent Advances. ASCE-ASME J. Risk Uncert Engrg Sys Part B Mech. Engrg 8, 010801. doi:10.1115/1.4053184
McDowell, D. L. (2008). Viscoplasticity of Heterogeneous Metallic Materials. Mater. Sci. Eng. R Rep. 62, 67–123. doi:10.1016/j.mser.2008.04.003
McDowell, D. L. (2010). A Perspective on Trends in Multiscale Plasticity. Int. J. Plast. 26, 1280–1309. doi:10.1016/j.ijplas.2010.02.008
Mello, A. W., Nicolas, A., and Sangid, M. D. (2017). Fatigue Strain Mapping via Digital Image Correlation for Ni-Based Superalloys: The Role of Thermal Activation on Cube Slip. Mater. Sci. Eng. A 695, 332–341. doi:10.1016/j.msea.2017.04.002
Mohan, S., Millan-Espitia, N., Yao, M., Steenberge, N. V., and Kalidindi, S. R. (2021). Critical Evaluation of Spherical Indentation Stress-Strain Protocols for the Estimation of the Yield Strengths of Steels. Exp. Mech. 61, 641–652. doi:10.1007/s11340-021-00689-7
Nichols, F. A. (1980). Plastic Instabilities and Uniaxial Tensile Ductilities. Acta Metall. 28, 663–673. doi:10.1016/0001-6160(80)90144-3
Ostoja-Starzewski, M. (2006). Material Spatial Randomness: From Statistical to Representative Volume Element. Probab. Eng. Mech. 21, 112–132. doi:10.1016/j.probengmech.2005.07.007
Panchal, J. H., Kalidindi, S. R., and McDowell, D. L. (2013). Key Computational Modeling Issues in Integrated Computational Materials Engineering. Comput.-Aided Des. 45, 4–25. doi:10.1016/j.cad.2012.06.006
Pandey, A., and Pokharel, R. (2021). Machine Learning Based Surrogate Modeling Approach for Mapping Crystal Deformation in Three Dimensions. Scr. Mater. 193, 1–5. doi:10.1016/j.scriptamat.2020.10.028
Pathak, S., and Kalidindi, S. R. (2015). Spherical Nanoindentation Stress-Strain Curves. Mater. Sci. Eng. R Rep. 91, 1–36. doi:10.1016/j.mser.2015.02.001
Pedregosa, F., Varoquaux, G., Gramfort, A., Michel, V., Thirion, B., Grisel, O., et al. (2011). Scikit-learn: Machine Learning in Python. J. Mach. Learn. Res. 12, 2825–2830. doi:10.5555/1953048.2078195
Pokharel, R., Lind, J., Kanjarla, A. K., Lebensohn, R. A., Li, S. F., Kenesei, P., et al. (2014). Polycrystal Plasticity: Comparison between Grain - Scale Observations of Deformation and Simulations. Annu. Rev. Condens. Matter Phys. 5, 317–346. doi:10.1146/annurev-conmatphys-031113-133846
Pokharel, R., Lind, J., Li, S. F., Kenesei, P., Lebensohn, R. A., Suter, R. M., et al. (2015). In-situ Observation of Bulk 3D Grain Evolution during Plastic Deformation in Polycrystalline Cu. Int. J. Plast. 67, 217–234. doi:10.1016/j.ijplas.2014.10.013
Rao, A. R. (2012). A Taxonomy for Texture Description and Identification. New York: Springer Science & Business Media.
Relativity Space (2022). Relativity Space. Available at: https://www.relativityspace.com/careers (Accessed March 14, 2022).
Salehghaffari, S., Rais-Rohani, M., Marin, E. B., and Bammann, D. J. (2012). A New Approach for Determination of Material Constants of Internal State Variable Based Plasticity Models and Their Uncertainty Quantification. Comput. Mater. Sci. 55, 237–244. doi:10.1016/j.commatsci.2011.11.035
Salzbrenner, B. C., Rodelas, J. M., Madison, J. D., Jared, B. H., Swiler, L. P., Shen, Y.-L., et al. (2017). High-throughput Stochastic Tensile Performance of Additively Manufactured Stainless Steel. J. Mater. Process. Technol. 241, 1–12. doi:10.1016/j.jmatprotec.2016.10.023
Samuel, M. P., Mishra, A. K., and Mishra, R. K. (2018). Additive Manufacturing of Ti-6Al-4V Aero Engine Parts: Qualification for Reliability. J Fail. Anal. Preven. 18, 136–144. doi:10.1007/s11668-018-0393-9
Snider-Simon, B., and Frantziskonis, G. (2022). Reliability of Metal Additive Manufactured Materials from Modeling the Microstructure at Different Length Scales. Addit. Manuf. 51, 102629. doi:10.1016/j.addma.2022.102629
Syngellakis, S., Habbab, H., and Mellor, B. G. (2017). Finite Element Simulation of Spherical Indentation Experiments. Int. J. CMEM 6, 749–763. doi:10.2495/CMEM-V6-N4-749-763
Tallman, A. E., Swiler, L. P., Wang, Y., and McDowell, D. L. (2017). Reconciled Top-Down and Bottom-Up Hierarchical Multiscale Calibration of Bcc Fe Crystal Plasticity. Int. J. Mult. Comp. Eng. 15, 505–523. doi:10.1615/IntJMultCompEng.2017021859
Tallman, A. E., Swiler, L. P., Wang, Y., and McDowell, D. L. (2020). “14 - Hierarchical Multiscale Model Calibration and Validation for Materials Applications,” in Uncertainty Quantification in Multiscale Materials Modeling. Editors Y. Wang, and D. L. McDowell (Woodhead Publishing), 449–471. Elsevier Series in Mechanics of Advanced Materials. doi:10.1016/B978-0-08-102941-1.00014-6
Tan, J., Villa, U., Shamsaei, N., Shao, S., Zbib, H. M., and Faghihi, D. (2021). A Predictive Discrete-Continuum Multiscale Model of Plasticity with Quantified Uncertainty. Int. J. Plast. 138, 102935. doi:10.1016/j.ijplas.2021.102935
Tang, Y., Campbell, J., Burley, M., Dean, J., Reed, R., and Clyne, T. (2021). Profilometry-based Indentation Plastometry to Obtain Stress-Strain Curves from Anisotropic Superalloy Components Made by Additive Manufacturing. Materialia 15, 101017. doi:10.1016/j.mtla.2021.101017
Voce, E. (1948). The Relationship between Stress and Strain for Homogeneous Deformation. J. Inst. Metall. 74, 537–562.
Wen, W., Kohnert, A., Arul Kumar, M., Capolungo, L., and Tomé, C. N. (2020). Mechanism-based Modeling of Thermal and Irradiation Creep Behavior: An Application to Ferritic/martensitic HT9 Steel. Int. J. Plast. 126, 102633. doi:10.1016/j.ijplas.2019.11.012
Wiberg, A., Persson, J., and Ölvander, J. (2019). Design for Additive Manufacturing – a Review of Available Design Methods and Software. Rapid Prototyping J. 25, 1080–1094. doi:10.1108/RPJ-10-2018-0262
Wronski, M., Arul Kumar, M., Capolungo, L., McCabe, R. J., Wierzbanowski, K., and Tomé, C. N. (2018). Deformation Behavior of CP-Titanium: Experiment and Crystal Plasticity Modeling. Mater. Sci. Eng. A 724, 289–297. doi:10.1016/j.msea.2018.03.017
Yin, X., Chen, W., To, A., McVeigh, C., and Liu, W. K. (2008). Statistical Volume Element Method for Predicting Microstructure–Constitutive Property Relations. Comput. Methods Appl. Mech. Eng. 197, 3516–3529. doi:10.1016/j.cma.2008.01.008
Keywords: uncertainty quantification (UQ), indentation testing, aluminum 7075 alloy, high-throughput testing, profilometry, finite element method, FEM, plasticity
Citation: Tallman AE, Paul T, John D and Agarwal A (2022) Uncertainty Quantification of a High-Throughput Profilometry-Based Indentation Plasticity Test of Al 7075 T6 Alloy. Front. Mater. 9:919797. doi: 10.3389/fmats.2022.919797
Received: 13 April 2022; Accepted: 07 June 2022;
Published: 07 July 2022.
Edited by:
Anh Tran, Sandia National Laboratories, United StatesCopyright © 2022 Tallman, Paul, John and Agarwal. This is an open-access article distributed under the terms of the Creative Commons Attribution License (CC BY). The use, distribution or reproduction in other forums is permitted, provided the original author(s) and the copyright owner(s) are credited and that the original publication in this journal is cited, in accordance with accepted academic practice. No use, distribution or reproduction is permitted which does not comply with these terms.
*Correspondence: Aaron E. Tallman, YXRhbGxtYW5AZml1LmVkdQ==
Disclaimer: All claims expressed in this article are solely those of the authors and do not necessarily represent those of their affiliated organizations, or those of the publisher, the editors and the reviewers. Any product that may be evaluated in this article or claim that may be made by its manufacturer is not guaranteed or endorsed by the publisher.
Research integrity at Frontiers
Learn more about the work of our research integrity team to safeguard the quality of each article we publish.