 Ruoqi Du
 He Li
He Li Chong Huang
 Qingsheng Liu1
 Zhihua Wang
- 1State Key Laboratory of Resources and Environmental Information System, Institute of Geographic Sciences and Natural Resources Research, Chinese Academy of Sciences (CAS), Beijing, China
- 2School of Geography and Information Engineering, China University of Geosciences, Wuhan, China
The spatial distribution of aquaculture ponds plays a critical role in the layout, management, and evaluation of the aquaculture industry. While extensive research has been conducted on aquaculture pond extraction and monitoring, studies focusing on the differentiation of aquaculture ponds by species remain limited. The similar shapes and spectral features of water bodies associated with different species pose a challenge for extraction. A method for extracting sea-cucumber aquaculture ponds is proposed based on spectral temporal features using Sentinel-2 satellite imagery in this study. The method involves selecting the optimal sensitive spectral bands or combinations to construct two remote sensing indices of land-based aquaculture ponds. Using a time-series dataset of these indices, three key features—the mean and two slopes—are extracted. The corresponding time windows and thresholds for these key features are identified to develop a decision-tree algorithm for extracting sea-cucumber ponds. This method was applied to coastal aquaculture zones in Liaoning Province, China, to identify the spatial distribution of sea-cucumber aquaculture ponds in 2016 and 2023. The results showed that: (1) the proposed method achieved high extraction accuracy, with an overall accuracy of 79.24%; (2) Total area of sea-cucumber ponds in Liaoning Province was 931.08 km2, primarily located along the Huludao Xingcheng-Jinzhou Linghai and Yingkou Xishi-Dalian Zhuanghe coastal zones; (3) Over the past seven years, the area of sea-cucumber ponds increased by 624.57 km2, with expansion concentrated on the northwest coast of Liaodong Bay and both the eastern and western sides of the Liaodong Peninsula. These findings provide scientific support for the sustainable development of sea-cucumber aquaculture.
1 Introduction
In recent years, China’s aquaculture industry has undergone rapid development, maintaining its position as the world’s largest producer of aquaculture products for 32 consecutive years (FAO, 2024). Marine aquaculture, a critical component of the aquaculture, achieved a production value of 488.55 billion yuan in 2023, accounting for 37.40% of the total aquaculture production value (Fisheries Bureau of the Ministry of Agriculture, 2024). Sea cucumber, as one of the primary species characterizing the fifth wave of marine aquaculture development in China—following earlier waves dominated by fish, shrimp, shellfish, and algae farming—has experienced substantial industrial growth over the past two decades (Hou et al., 2019). Sea cucumbers not only play a crucial ecological role in marine material and energy cycling, but are also regarded as one of the primary species used in multi-trophic integrated aquaculture systems and marine ranching practices (Han et al., 2016). As breeding and aquaculture technologies have advanced, the farming of sea cucumbers, which was initially limited to shallow-sea bottom-seeding, has gradually diversified to include pond culture, industrial aquaculture, shallow-sea cage culture, offshore suspended cage farming, and polyculture with multiple species. Among these various farming methods, pond culture stands out as a most widely adopted approach due to its technical maturity, ease of operation, moderate investment requirements, and high productivity (Yang et al., 2024).
Sea-cucumber aquaculture ponds are predominantly located in coastal intertidal zones, which often displace natural habitats and breeding grounds of other aquatic species. Excessive stocking densities, overfeeding, and improper use of antibiotics associated with aquaculture activities have been identified as major contributors to water pollution and environmental degradation in these regions (Li et al., 2011; Dai et al., 2023). Fish and shrimp farming, in particular, significantly increase the concentrations of organic matter, inorganic substances, and antibiotics in water, creating potential risks of eutrophication (Sadeghi-Nassaj et al., 2018). Sea cucumbers, however, can act as a bioremediation species by consuming particulate organic matter (POM), thereby improving water transparency and mitigating the effects of eutrophication (Watanabe et al., 2012). Unlike fish and crustaceans, sea cucumbers require minimal artificial feed, as their growth can be supported by natural food sources such as suspended organic matter introduced through water exchange (Han et al., 2016) or organic waste within the ponds (Purcell et al., 2012). This results in reduced water exchange requirements, better water quality, and lower levels of effluent pollution. Consequently, the extraction of sea-cucumber aquaculture ponds is essential for accurately assessing the ecological and environmental impacts of aquaculture in coastal zones.
Remote sensing has been widely used for extracting and monitoring of aquaculture ponds (Føre et al., 2018), using various data sources, including optical and radar imagery. Wang et al (Wang et al., 2022). employed dense time-series Sentinel-2 data to calculate water indices and integrated image edge detection algorithms to produce global spatial mapping of land-based aquaculture ponds. Xu et al (Xu et al., 2024). used Landsat series satellite data with a 30-meter resolution to map the global distribution of inland and coastal pond systems across three periods: 1984–2000, 2001–2010, and 2011–2020. While optical data are widely used, their application is often constrained by cloud coverage. Radar data, characterized by all-weather and all-day imaging capabilities, have proven effective for extracting aquaculture ponds in cloudy and rainy coastal regions by leveraging the differences in backscatter responses between pond water bodies and other water bodies. For instance, Ottinger M et al (Ottinger et al., 2017). developed an aquaculture pond segmentation algorithm based on backscatter intensity, size, and shape features using dense time-series Sentinel-1 data. However, compared to optical data, the narrow range of frequency bands in radar data limits its ability to capture water quality differences across various types of aquaculture ponds.
Numerous remote sensing methods have been developed for extracting aquaculture ponds, ranging from traditional visual interpretation to machine learning and deep learning approaches. For instance, Hou et al (Hou et al., 2022). incorporated shape and water quality features of aquaculture ponds into a supervised classification model. Zeng et al (Zeng et al., 2019). used boundary curve features and a support vector machine (SVM) classifier to extract aquaculture ponds surrounding inland lakes. In another study, Zeng et al (Zeng et al., 2020). proposed a fully convolutional network (FCN) deep learning model, integrated with a recurrent channel-spatial attention mechanism (RCSANet), to extract inland aquaculture ponds based on high-resolution infrared imagery. Aquaculture ponds often display distinct shapes, such as rectangular geometries, making object-oriented classification methods both highly effective and widely used. For example, Li et al (Li et al., 2023). developed an object-oriented method for aquaculture pond extraction on the Google Earth Engine (GEE), combining gray-scale morphology with an iterative image edge detection algorithm. Similarly, Prasad et al (Prasad et al., 2019). employed an object-oriented classification approach using Sentinel-1 time-series data to extract aquaculture ponds along the Indian coast. However, these methods face challenges in optimizing segmentation parameters and classification rules. In contrast, machine learning-based classification methods, characterized by simplicity and efficiency, have gained widespread application in aquaculture pond extraction.
Remote sensing techniques for aquaculture ponds extraction are numerous; however, research on the differences between ponds for different species and farming methods remains limited. There is no universal classification method for extracting species-specific aquaculture ponds. Edwards (2015) suggested that the level of environmental pollution caused by aquaculture depends on the type and the intensity of farming system. Chang et al (Chang et al., 2019). investigated the water quality of six different freshwater aquaculture species in Jiangsu Province and observed that the water quality of single-species shrimp and crab farming was significantly better than that of mixed shrimp-crab and fish-crab farming. The worst water quality was observed in ponds where different fish species were farmed together, with chlorophyll-a concentrations being dozens of times higher than in single or mixed shrimp-crab farming. This is mainly due to the increased feed requirements for mixed fish farming, which leads to higher levels of organic matter, such as fish feces and feed residues, resulting in a significant accumulation of nitrogen and phosphorus in the water. This, in turn, leads to algal blooms and a marked increase in chlorophyll-a concentrations. These studies indicate that water quality parameters have significant potential for differentiating various aquaculture species. Chlorophyll-a, as one of the key water quality indicators, plays a crucial role in absorbing light in the water, causing changes in water color, which can be prominently reflected in the spectral features of the water (Mishra and Mishra, 2012). The absorption and scattering properties of chlorophyll-a in aquaculture water determine the overall spectral reflectance features of the water. Different aquaculture and species and farming methods create variations in chlorophyll-a levels, making the analysis of water spectral features a fundamental approach for distinguishing different aquaculture species.
To extract sea-cucumber aquaculture ponds using Sentinel-2 time-series data, (1) a method is proposed that combines the spectral and temporal features of water bodies from different aquaculture species and uses decision-tree algorithm; (2) The method is applied to extract sea-cucumber aquaculture ponds in the coastal regions of Liaoning Province, China, for the years 2016 and 2023; (3) The spatial-temporal changes of sea-cucumber aquaculture ponds over the past seven years are analyzed. This study aims to provide scientific support for the sustainable development of sea-cucumber aquaculture.
2 Materials and methods
2.1 Study area
Liaoning Province, China, bordered by the Yellow Sea to the south and the Bohai Sea to the southwest, has a coastal marine area of 64,000 km2 and a coastal tidal flat area of 2,070 km2 (Figure 1). Its coastline extends from the mouth of the Yalu River in the east to the border between Liaoning and Hebei provinces in the west, with a total length of 2,292 km, accounting for 12% of China’s total coastline. The province’s long coastline, abundant tidal flat resources, and large areas of usable marine waters provide significant natural geographical advantages, resulting in rich fishery resources within the region. In 2023, the aquaculture area in this region reached 9,663 km2, of which 7,740 km2 were dedicated to marine aquaculture, ranking first in the country (Fisheries Bureau of the Ministry of Agriculture, 2024).
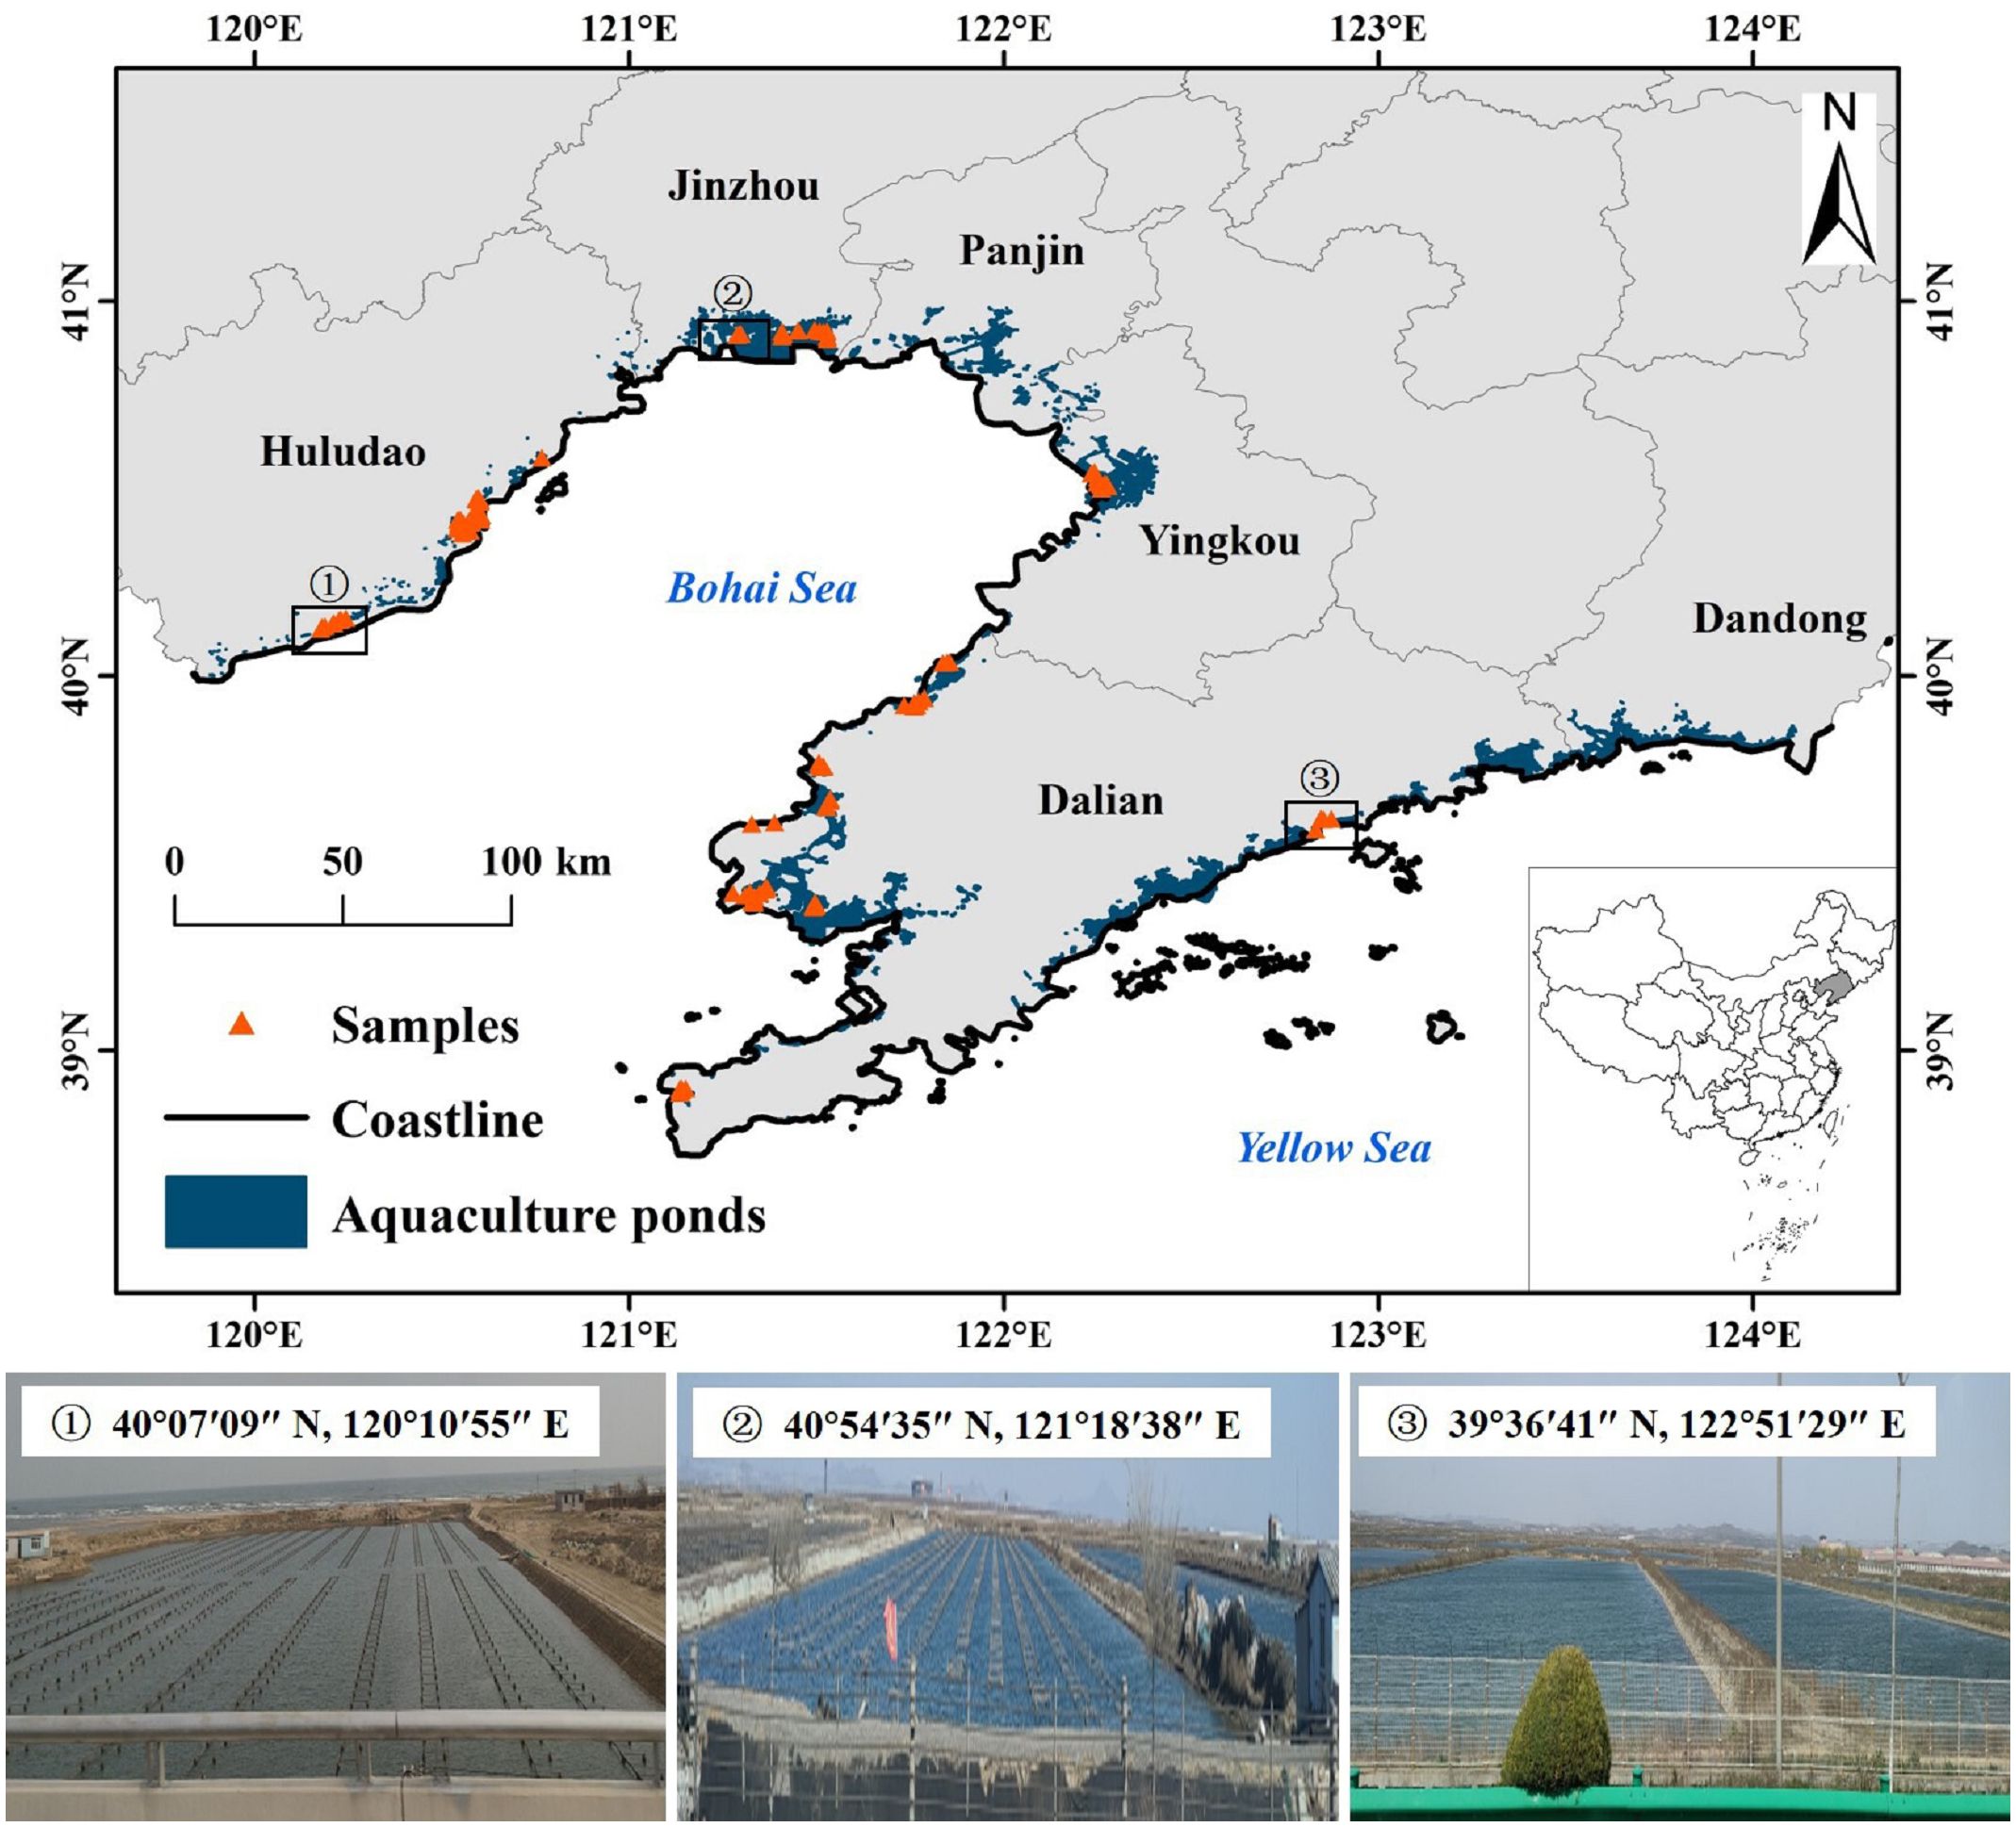
Figure 1. Study area and field survey photos (①-③).
The main aquaculture species in Liaoning Province include fish, crustaceans, mollusks, algae, and other categories. Among these, crustaceans primarily consist of shrimp and crabs, mollusks include scallops, clams, oysters, and others, algae mainly include laver and kelp, while the other categories includes species such as sea cucumbers, jellyfish, and sea urchins (Fisheries Bureau of the Ministry of Agriculture, 2024). With the rapid development of sea cucumber breeding and farming technologies, sea-cucumber aquaculture has expanded rapidly, maintaining the largest aquaculture area in the country for twenty consecutive years, becoming a pillar industry of the regional fishery economy (Hou et al., 2019). The primary aquaculture methods for sea cucumbers include pond farming, cage farming, and bottom-seeding farming (Han et al., 2016). In addition to sea cucumbers, the main aquaculture species in the ponds are shrimp, fish, and crabs. Mollusks are mainly farmed in tidal flats, relying on natural environments such as mudflats without the need for artificial breeding or feeding. Algae are cultivated through raft-based farming in marine environments (Li et al., 2011). Therefore, for land-based aquaculture ponds, this study classifies the aquaculture species into three categories: sea cucumbers, shrimp, and fish-crab.
2.2 Data and preprocessing
2.2.1 Sentinel-2 data
The remote sensing data used in this study were acquired from Sentinel-2 satellite imagery. Sentinel-2 is a satellite launched by the European Space Agency (ESA), consisting of two satellites, Sentinel-2A and Sentinel-2B, which provide imagery every five days. These satellites are equipped with a Multi-Spectral Instrument (MSI) that covers 13 spectral bands, ranging from visible light to near-infrared and short-wave infrared wavelengths. The spatial resolution of 10 m for 4 visible near-infrared bands, and a spatial resolution of 20 m for 4 red edge bands and 2 shortwave infrared bands (SWIR). The spatial resolution of other bands is 60 m. Due to its high spatial and temporal resolution, wide field of view, diverse band combinations, and easy accessibility, Sentinel-2 data have been widely used for monitoring land surface and coastal area changes (Drusch et al., 2012).
The Sentinel-2 L1C and L2A data can be accessed free of charge on the Google Earth Engine (GEE) platform, with L1C data have been radiometrically and geometrically corrected and the L2A data already undergoing atmospheric correction preprocessing. For this study, all Sentinel-2 L2A imagery for the year 2023 and L1C imagery for the year 2016 with cloud coverage less than 70% was acquired from the GEE platform. The quality assessment band (QA60) of Sentinel-2 provides cloud mask information, and the C Function of Mask (CFMask) algorithm was applied to the QA60 band to remove clouds and cirrus clouds (Foga et al., 2017). Aquaculture ponds generally remain in shallow water and do not freeze from March to November, so images from this period, specifically from March 1 to November 30, were selected for the study. In order to ensure the accuracy of the calculation and analysis, four red edge bands (B5, B6, B7, B8A) and two shortwave infrared bands (B11, B12) with 20-meter resolution, as well as the remaining two bands (B1, B9) with 60-meter resolution, were resampled to 10 meters in GEE using the bilinear interpolation method.
2.2.2 Aquaculture ponds
A human-computer interactive visual interpretation method was employed to extract aquaculture ponds. To reduce the noise from individual image acquisitions, a median composite of all images captured between March and November was generated using GEE (Ottinger et al., 2021). To ensure the reliability of the extraction results, a set of visual interpretation markers and a validation dataset were established based on field investigations in the study area. Using ArcGIS 10.2, aquaculture ponds were visually extracted according to the interpretation standards. The preliminary interpretation results were then corrected using auxiliary data, such as high-resolution imagery from Google Earth, and field survey data were incorporated to verify the extraction results. The overall accuracy was 94.03%, meeting the requirements of the study. The main factor limiting the extraction accuracy of aquaculture ponds is the misclassification between aquaculture ponds and salt pans. The tidal ponds surrounding salt pans share similar shapes (mostly rectangular) with aquaculture ponds. Additionally, the seawater in tidal ponds has a composition close to that of aquaculture water, resulting in similar spectral characteristics. These two factors make it easy to confuse salt pans with aquaculture ponds located around them. However, some tidal ponds are also used for aquaculture while storing seawater, which partially reduces the impact of misclassification. Finally, through format conversion and spatial overlay processing, the spatial distribution vector data of aquaculture ponds in Liaoning Province were produced (Figure 1).
2.2.3 Samples
Samples were collected during a field survey conducted from April 17 to April 21, 2023 in the study area (Figure 1). A total of 341 ground truth samples were gathered, which were then divided into training and validation samples at an 8:2 ratio. Additionally, to enhance the accuracy of the extraction results, the validation samples were expanded by incorporating distribution data from large sea-cucumber aquaculture bases in Liaoning Province (Table 1). These data were mainly obtained from POI data in Google Maps. The POI data related to sea-cucumber aquaculture in Liaoning Province is retrieved from the Google Maps Platform, organized, and loaded into Google Earth according to latitude and longitude, where it is overlaid with high-resolution images to filter the results. Only search results located within aquaculture ponds are retained.
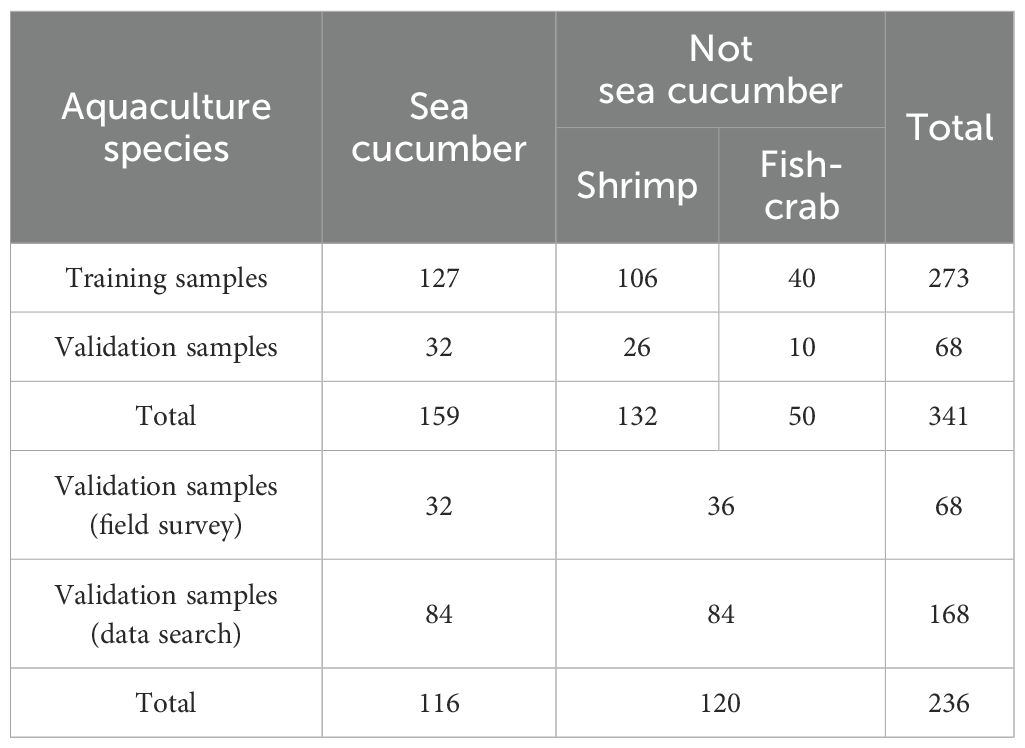
Table 1. The number of samples.
2.2.4 Other ancillary data
The data on the aquaculture area of sea cucumbers in Liaoning Province over the years were sourced from the China Fisheries Statistical Yearbook (Fisheries Bureau of the Ministry of Agriculture, 2024). The administrative boundary of China was sourced from the National Geomatics Center of China (NGCC) (https://www.ngcc.cn/).
2.3 Methods
A method for extracting sea-cucumber aquaculture ponds was proposed based on a temporal analysis of water spectral features from various aquaculture species. The specific steps of this method include five parts (Figure 2): (1) Study the spectral bands features of the water bodies in three types of aquaculture ponds: sea cucumber, shrimp, and fish-crab, and construct two new remote sensing indices. (2) Analyze the time-series features of the indices from March to November, and identify the key features used for sea cucumber extraction. (3) Develop a method for extracting sea-cucumber aquaculture ponds based on spectral temporal features using the decision-tree algorithm. (4) Use a stepwise searching method to determine the optimal threshold for the key features. (5) Once the above threshold is established, apply this method to the coastal aquaculture ponds in Liaoning Province to extract the spatial distribution of sea-cucumber aquaculture ponds.
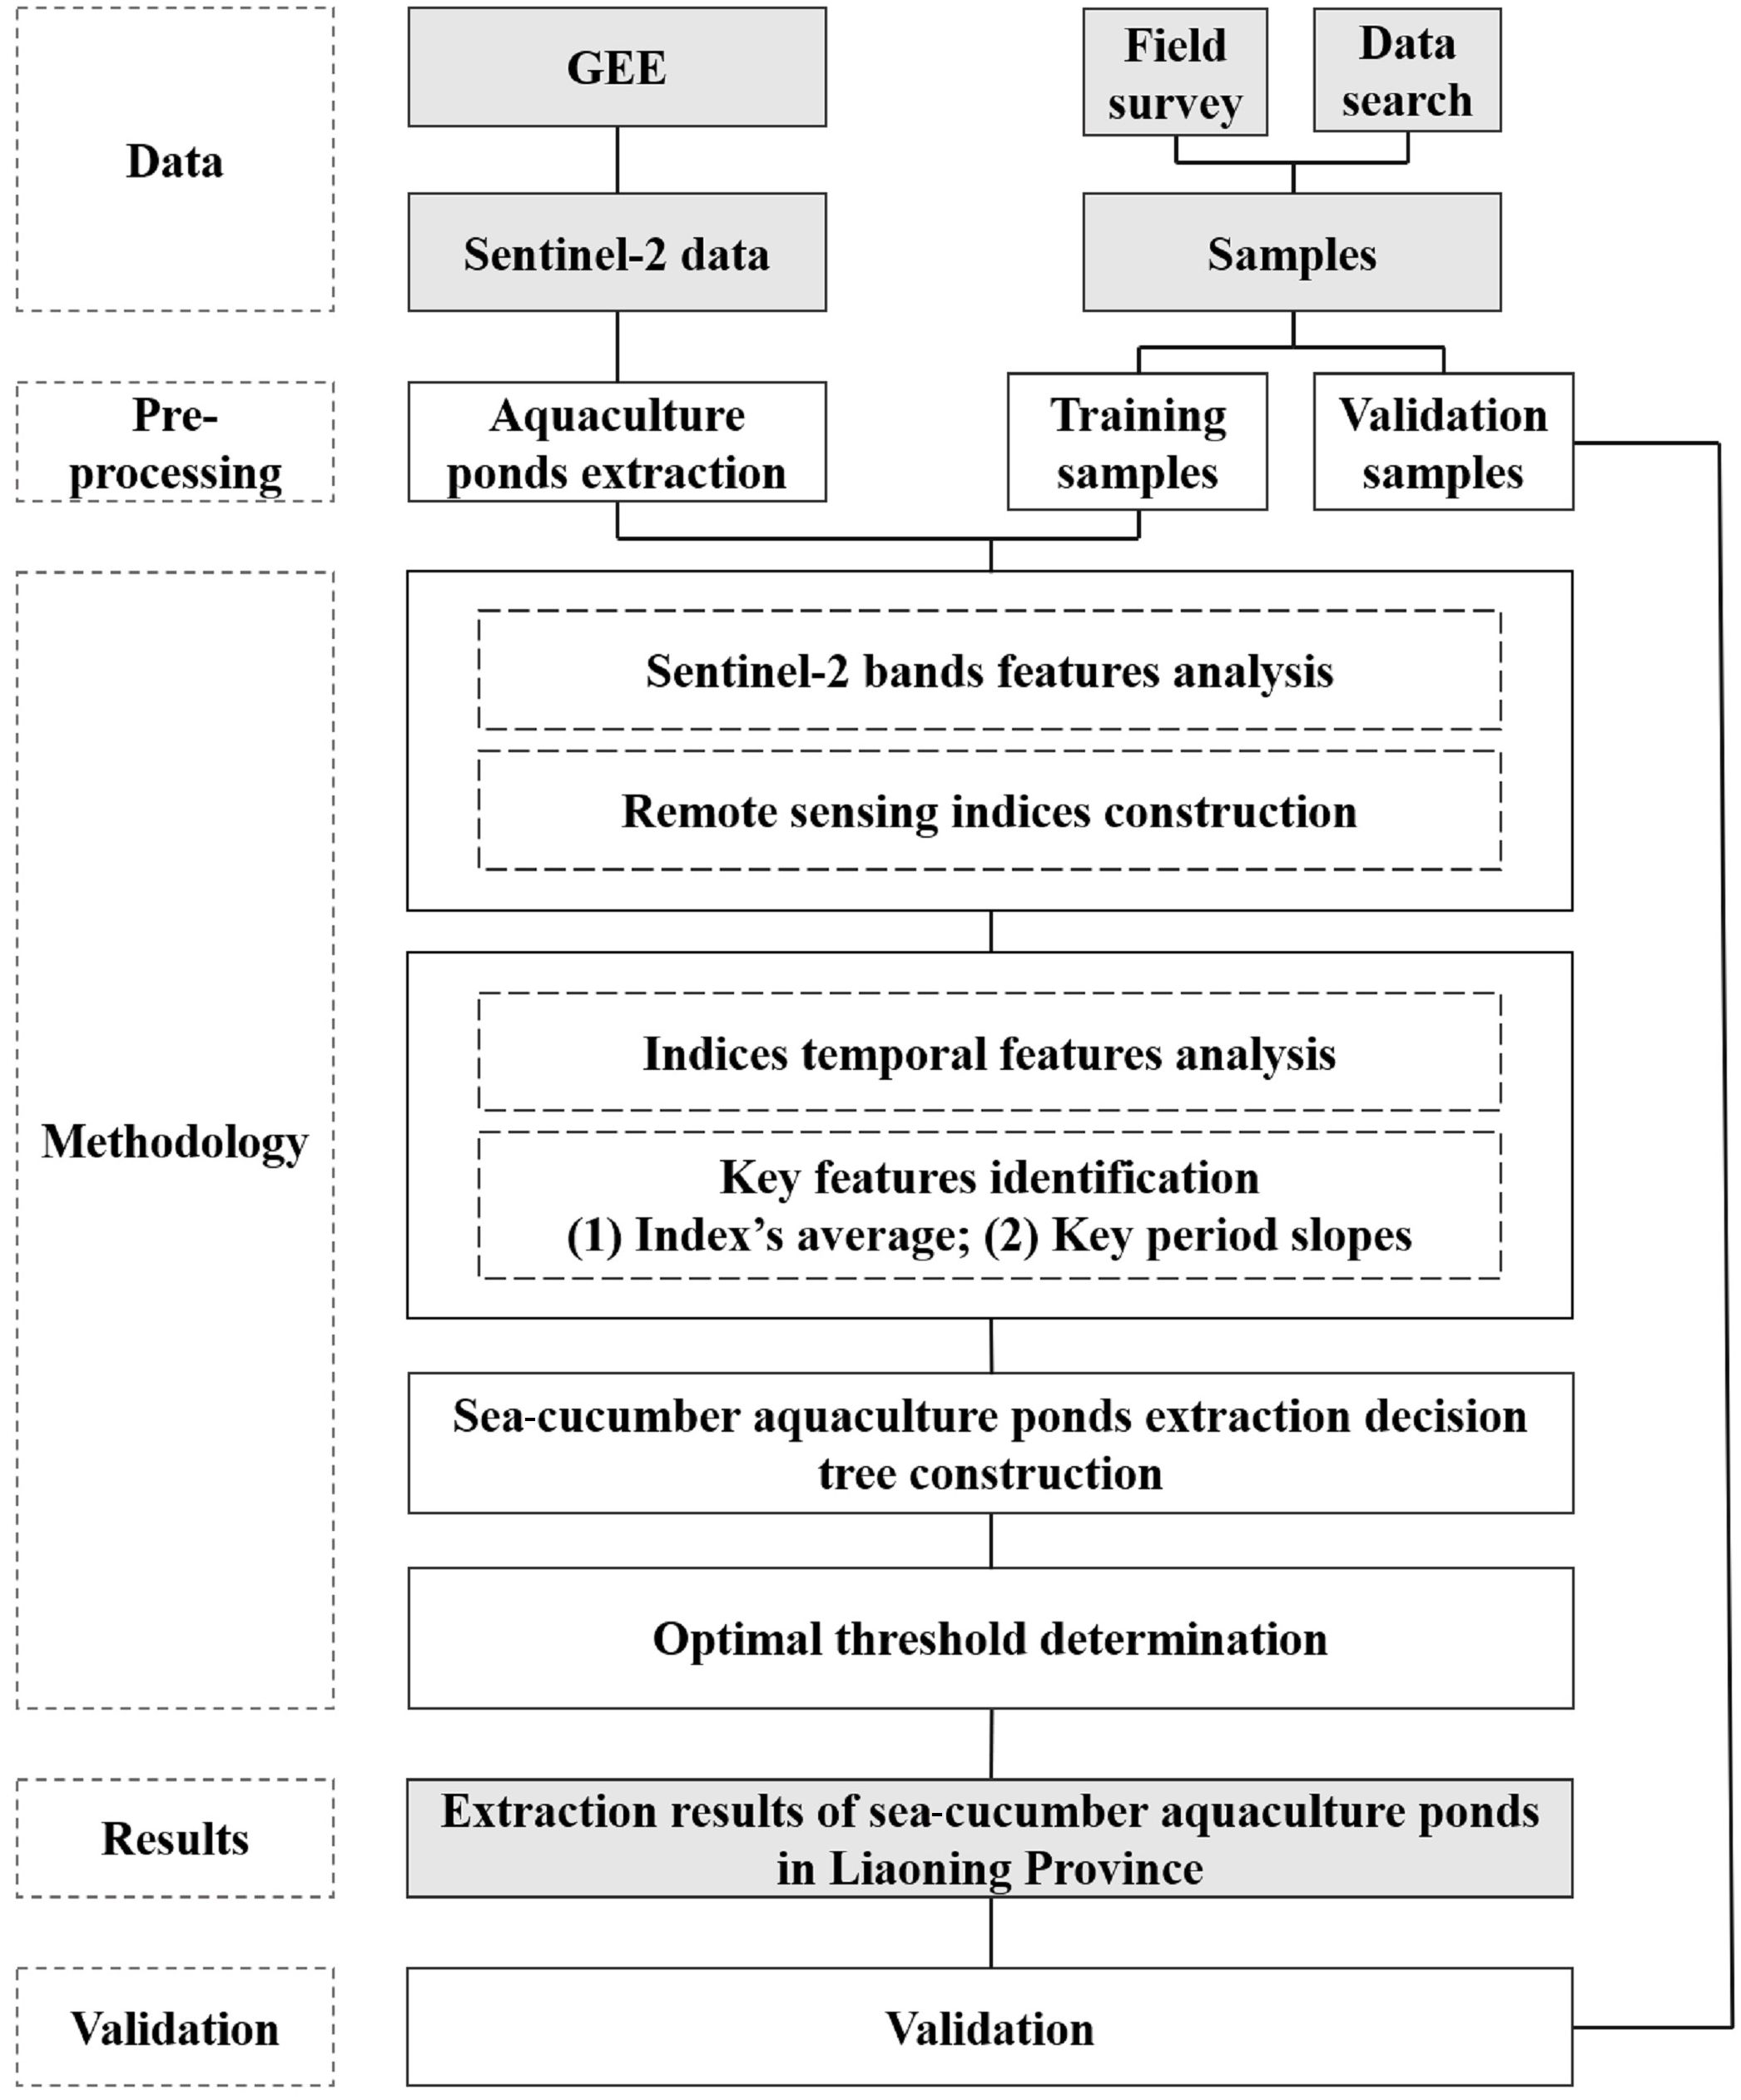
Figure 2. Flowchart of sea-cucumber aquaculture ponds extraction method.
2.3.1 Construction of remote sensing indices for different aquaculture ponds
Considering the noise influence of single-period imagery, the Sentinel-2 time-series data was processed using median synthesis. The median synthesis was chosen to represent the entire time series instead of the mean value because the mean value can be affected by extreme outliers (Ottinger et al., 2021). In the preprocessed Sentinel-2 median imagery, the curves of spectral reflectance were generated for the three types of aquaculture ponds: sea cucumber, shrimp, and fish-crab by using mean value of each type in each band (Yang et al., 2017) (Figure 3). From the spectral bands of B1 to B3, the differences of surface reflectance among these three aquaculture types were minimal. From B4 to B8A, the spectral curves of sea cucumber and shrimp were similar, while fish-crab exhibited notable differences from the other two types, with an upward trend in reflectance for fish-crab and a clear downward trend for sea cucumber and shrimp. Similarly, from B9 to B12, sea cucumber and shrimp showed comparable reflectance, whereas fish-crab had significantly higher reflectance, despite all three types displaying a declining trend. Consequently, relying solely on individual bands cannot resolve the misclassification challenges among sea cucumber, shrimp, and fish-crab aquaculture ponds.
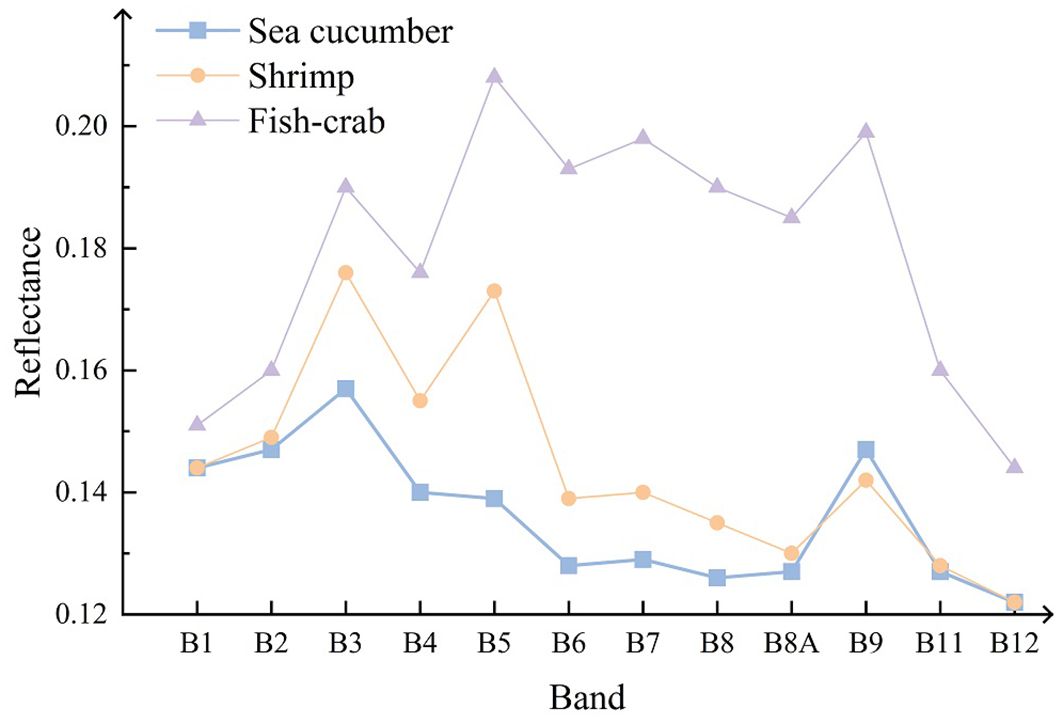
Figure 3. Spectral reflectance curves for sea cucumber, shrimp, and fish-crab (B1: Aerosols; B2: Blue; B3: Green; B4: Red; B5: Red edge 1; B6: Red edge 2; B7: Red edge 3; B8: NIR; B8A: Red edge 4; B9: Water vapor; B11: SWIR 1; B12: SWIR 2).
The water quality conditions differ among the three aquaculture species. In areas with more fish farming, the average chlorophyll-a concentration in aquaculture ponds is relatively high, often tens or even hundreds of times higher than that in shrimp or crab ponds. Crab aquaculture ponds also show higher chlorophyll-a concentrations compared to shrimp aquaculture ponds, as crab ponds typically include aquatic plants and are generally shallower (Chang et al., 2019). In contrast, for mollusks like sea cucumber, the water quality requirements are very strict. Sea-cucumber aquaculture ponds require regular cleaning to prevent water quality deterioration. As a result, sea-cucumber ponds generally have better water quality than those used for fish, shrimp, and crab farming (Edwards, 2015).
The three aquaculture species were divided into two groups based on their spectral characteristics. The first group included fish-crab ponds, which exhibited higher reflectance from B4 to B12, while the second group comprised sea cucumber and shrimp ponds, characterized by lower reflectance in the same bands. To enhance the spectral distinction between these two groups, the B4 (red) and B8A (red edge 4) were selected. All three types of aquaculture water bodies exhibit an absorption peak in the B4, mainly caused by the absorption of chlorophyll-a. The B8A is sensitive to changes in chlorophyll-a concentration in water bodies (Gitelson et al., 2007). From B4 to B8A, the spectral curves of sea cucumber and shrimp exhibit a clear downward trend in reflectance because of their better water quality, while fish-crab with worse water quality shows an upward trend.
The slope between B4 and B8A was then used to construct the Land-based Aquaculture Species Classification Index (LASCI). The formula is as follows (Equation 1):
where and represent the surface reflectance of the B4 and B8A, respectively, while and denote the central wavelengths of B4 and B8A, respectively. The value of LASCI is calculated based on per-pixel using preprocessed Seninel-2 images in GEE.
For sea cucumber and shrimp, whose surface reflectance is relatively similar, the increase in shrimp’s reflectance from B4 (red) and B5 (red edge 1) is significantly higher than that of sea cucumber. The reflection peak in the B5 is the most notable spectral feature for water bodies with algae. This because the absorption coefficient of water and chlorophyll-a is minimal at this band (Gitelson et al., 2007). Compared to B8A, using the red edge 1 band to construct the index can further enhance the spectral distinction in water quality differences between sea cucumber and shrimp.
Thus, the bands of B4 and the B5are selected to construct the Sea Cucumber and Prawn Classification Index (SPCI). The formula is as follows (Equation 2):
where and represent the surface reflectance of the B4 and B5, respectively, while and denote the central wavelengths of B4 and B5, respectively. The value of SPCI is calculated based on per-pixel using preprocessed Seninel-2 images in GEE.
2.3.2 Temporal features of LASCI and SPCI for different aquacultures
Using Sentinel-2 imagery in GEE, based on the training samples of the three types of aquaculture ponds, LASCI temporal curves are plotted with a 10-day cycle by using mean value of each type (Qu et al., 2021). Likewise, for the training samples of sea cucumber and prawn, SPCI temporal curves are plotted with a 10-day cycle by using mean value of each type. Due to the influence of factors such as clouds, wet weather conditions and underlying surface, the LASCI and SPCI time-series data exhibit jagged, irregular fluctuations, with discontinuities and abrupt rises or falls during certain periods. These irregularities obscure the temporal trends of the curves, affecting the extraction of temporal index features for sea cucumbers, shrimp, and fish-crab, and ultimately affecting subsequent analyses and the extraction accuracy of sea-cucumber ponds. The Savitzky-Golay (SG) filtering method smooths the signal by applying a least-squares polynomial fit to local data points, effectively reducing noise while preserving sharp features and the overall trend of the data, and it is widely used for data smoothing and noise reduction (Savitzky and Golay, 1964). Consequently, SG filtering is applied to the LASCI and SPCI time-series data.
LASCI, which is calculated using B4 and B8A, reflects the changes in chlorophyll-a concentration in aquaculture water. Therefore, compared to sea cucumber and shrimp, fish-crab aquaculture has higher LASCI values (Figure 4A), corresponding to the poorest water quality. From June to September, fish have high feeding rates, with increased supply of feed and antibiotics, leading to the rapid accumulation of feed residues and excrement. The levels of nutrients like nitrogen and phosphorus and organic matter in the water increase (Cao et al., 2007), which causes the LASCI values for fish-crab to rise rapidly (from -1.00 on 30 April to 2.12 on 27 September). After September, as the temperature decreases and many fish are harvested, the LASCI values for fish-crab start to decline.
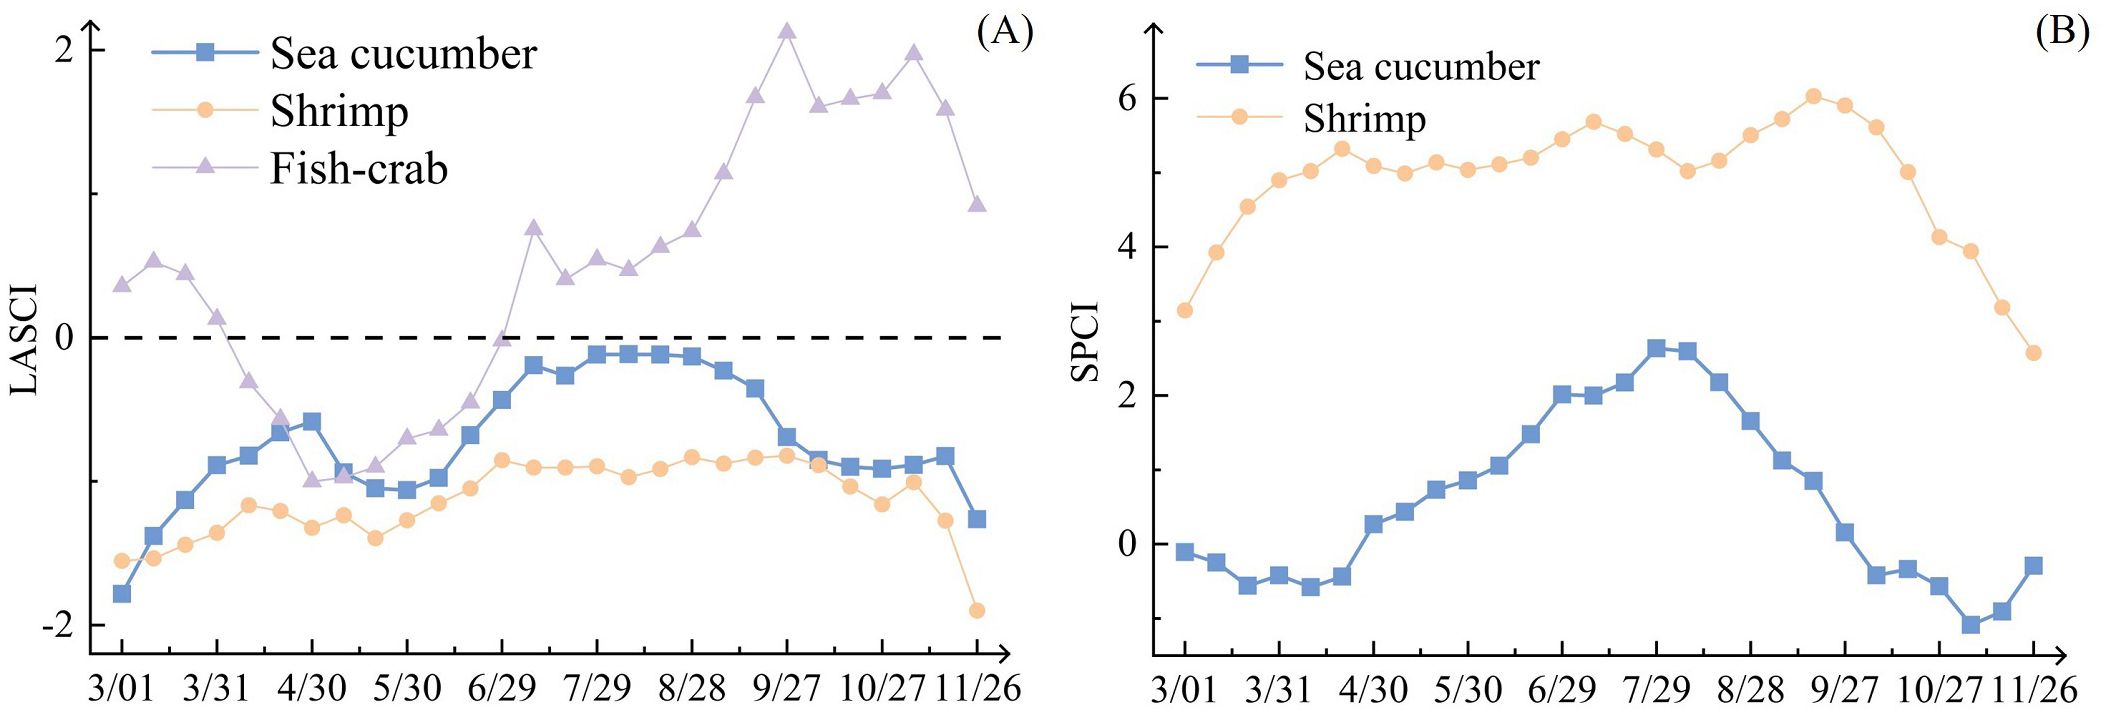
Figure 4. Temporal curves of LASCI (A) and SPCI (B) for sea cucumber, shrimp, and fish-crab.
As shown in Figure 4A, the LASCI for sea cucumber and shrimp are consistently less than 0 from March to November, while the LASCI for fish-crab are greater than 0 during March and from July to November. Therefore, fish and crab ponds can be distinguished from sea cucumber or shrimp ponds by using the average values of LASCI during specific time periods.
From the SPCI time-series curves for sea cucumber and shrimp (Figure 4B), it is clear that sea cucumber has lower SPCI values than shrimp from March to November, reflecting its better water quality. But the trends in the curves are quite different, especially from March to August. The SPCI for shrimp shows a clear upward trend from 1 March (3.15) to 10 April (5.02), while the SPCI for sea cucumbers decreases gradually during the same period, dropping from -0.11 to -0.58. As the water temperature rises, phytoplankton in the water begin to proliferate, and the concentration of chlorophyll-a gradually increases. However, sea cucumbers are cold-water species, and they begin to enter an active growth phase in April. During the period from March to early April, aquaculture ponds strengthen water quality management to ensure the early growth of sea cucumbers. Therefore, the SPCI value for sea cucumbers remains relatively stable during this period, without a noticeable increase. After 10 April, the SPCI for sea cucumbers starts to increase rapidly, reaching 2.64 by 29 July, while the SPCI for shrimp shows little change during this period, with a value of 5.31 on 29 July, only a 0.29 increase from 10 April, and fluctuates both upward and downward during this time. From April to June, it is a crucial growth period for sea cucumbers. As the temperature rises further, algae grow rapidly, leading to an increase in the SPCI value of sea cucumbers, although it remains at a relatively low level. Meanwhile, for shrimp, there is no significant increase in the SPCI value from late April to August, possibly because shrimp farming gradually starts in May. To ensure the proper growth of shrimp, the concentration of chlorophyll-a should not be too high. Therefore, water quality management begins to strengthen during this period, and the water quality remains stable.
The SPCI for shrimp and sea cucumbers exhibit almost opposite trends from March to July. Therefore, by using the distinct upward trend in SPCI values during specific periods, it is possible to distinguish between shrimp and sea-cucumber aquaculture ponds.
In summary, by analyzing the temporal feature differences of LASCI and SPCI for different aquaculture ponds during various periods, it is possible to distinguish between the three aquaculture ponds types of sea cucumber, shrimp, and fish-crab.
2.3.3 A method for sea-cucumber aquaculture ponds extraction
Based on the section 2.3.2, a method for Sea-Cucumber Ponds Extraction Based on Spectral Time-series Features (SCPE-STF) is proposed. The main steps of SCPE-STF are shown in Figure 5.

Figure 5. The decision-tree algorithm for sea-cucumber aquaculture ponds extraction.
1) A single-threshold method is used to distinguish between the fish-crab and the sea cucumber-shrimp. The LASCI for fish-crab are greater than 0 in March, July-November, while those for sea cucumber and shrimp are all less than 0 during this period. The LASCI mean values from 1 March to 31 March and from 9 July to 26 November are used to separate the two groups. Equation 3 is applied to extract the fish-crab group, and the remaining areas are identified as sea cucumber or shrimp ponds.
Where refers to the mean LASCI from 1 March to 31 March and from 9 July to 26 November. Based on the curve of LASCI temporal, the initial threshold for T1 is set to 0.
2) The SPCI slope is used to distinguish between sea cucumber and shrimp. The periods of decline and increase in the SPCI for sea cucumber are determined. If a signal of slow decline followed by rapid increase is identified as sea cucumber; otherwise, it is labeled as shrimp. The rules are as follows (Equation 4).
In the formula, refers to the period of slow decline in the sea cucumber SPCI from 1 March to 10 April, and refers to the period of rapid increase in the sea cucumber SPCI from 10 April to 29 July. T2 and T3 are the threshold for the SPCI slope during the two periods. Based on the curve of SPCI time-series, the initial threshold for T2 and T3 are both set to 0.
In summary, three key features, , , and , are extracted based on LASCI and SPCI temporal features, and a decision-tree model is constructed for extraction of sea-cucumber ponds.
2.3.4 Determination of the optimal threshold through the stepwise searching method
Using training samples and employing overall accuracy as the evaluation metric, the stepwise searching method is applied to determine the optimal thresholds (T1, T2, T3) for the three key features (, , ).
First, to distinguish between fish-crab ponds and sea cucumber or shrimp ponds, a stepwise searching is conducted based on the initial threshold range and step size for T1. The best threshold for T1 is determined based on the overall accuracy. Then, using the optimal T1 threshold, the distinction between sea cucumber and shrimp ponds is made by adjusting T2 and T3. Similarly, the stepwise searching method is applied for T2 and T3, and the best thresholds for T2 and T3 are also determined based on the overall accuracy.
Based on the time-series curves of the two indices (Figure 4), the initial thresholds for T1, T2, and T3 are set to 0, with a step size of 0.01. Starting from the initial threshold, the search range is expanded both forwards and backwards. The range is adjusted according to the overall accuracy, and if the overall accuracy remains stable or becomes too small (less than 20%), the search range is no longer modified. The final search ranges for the three thresholds are shown in Table 2.
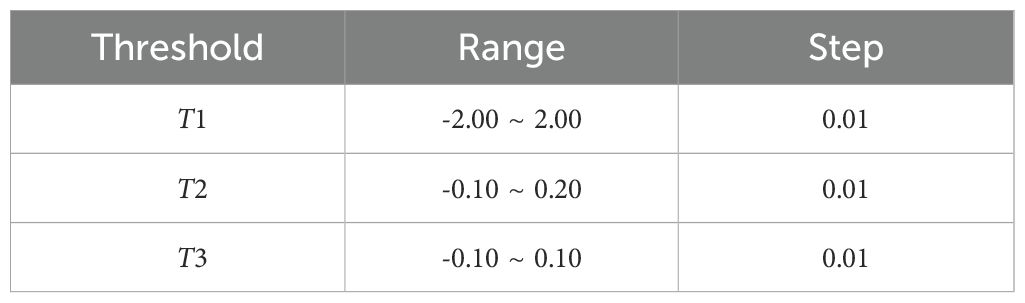
Table 2. Searching range and step of three key features (T1, T2, T3).
2.4 Accuracy evaluation
The confusion matrix is calculated using validation samples, and the accuracy is evaluated using Producer’s Accuracy (PA), User’s Accuracy (UA), Overall Accuracy (OA), and F1 score. OA measures the proportion of correctly classified samples out of all samples, indicating the overall classification accuracy. UA reflects the proportion of correctly classified sea-cucumber ponds among all samples classified as such, showing the reliability of the classification. PA indicates the proportion of correctly classified sea-cucumber ponds out of all actual sea-cucumber ponds, highlighting the method’s ability to detect the target class. F1 score is the harmonic mean of UA and PA, providing a balanced evaluation of classification performance. The formulas for calculating these four accuracy metrics are as follows (Equations 5–8):
where is the number of samples classified as aquaculture species i, but the true species is j. is the total number of samples classified as species i. is the total number of samples with the true species j. is the number of correctly classified samples. n is the total number of validation samples.
3 Results
3.1 Optimal thresholds of three key features
Using the training samples, the initial search ranges for the three key feature thresholds were determined through the stepwise searching method (Figure 6).
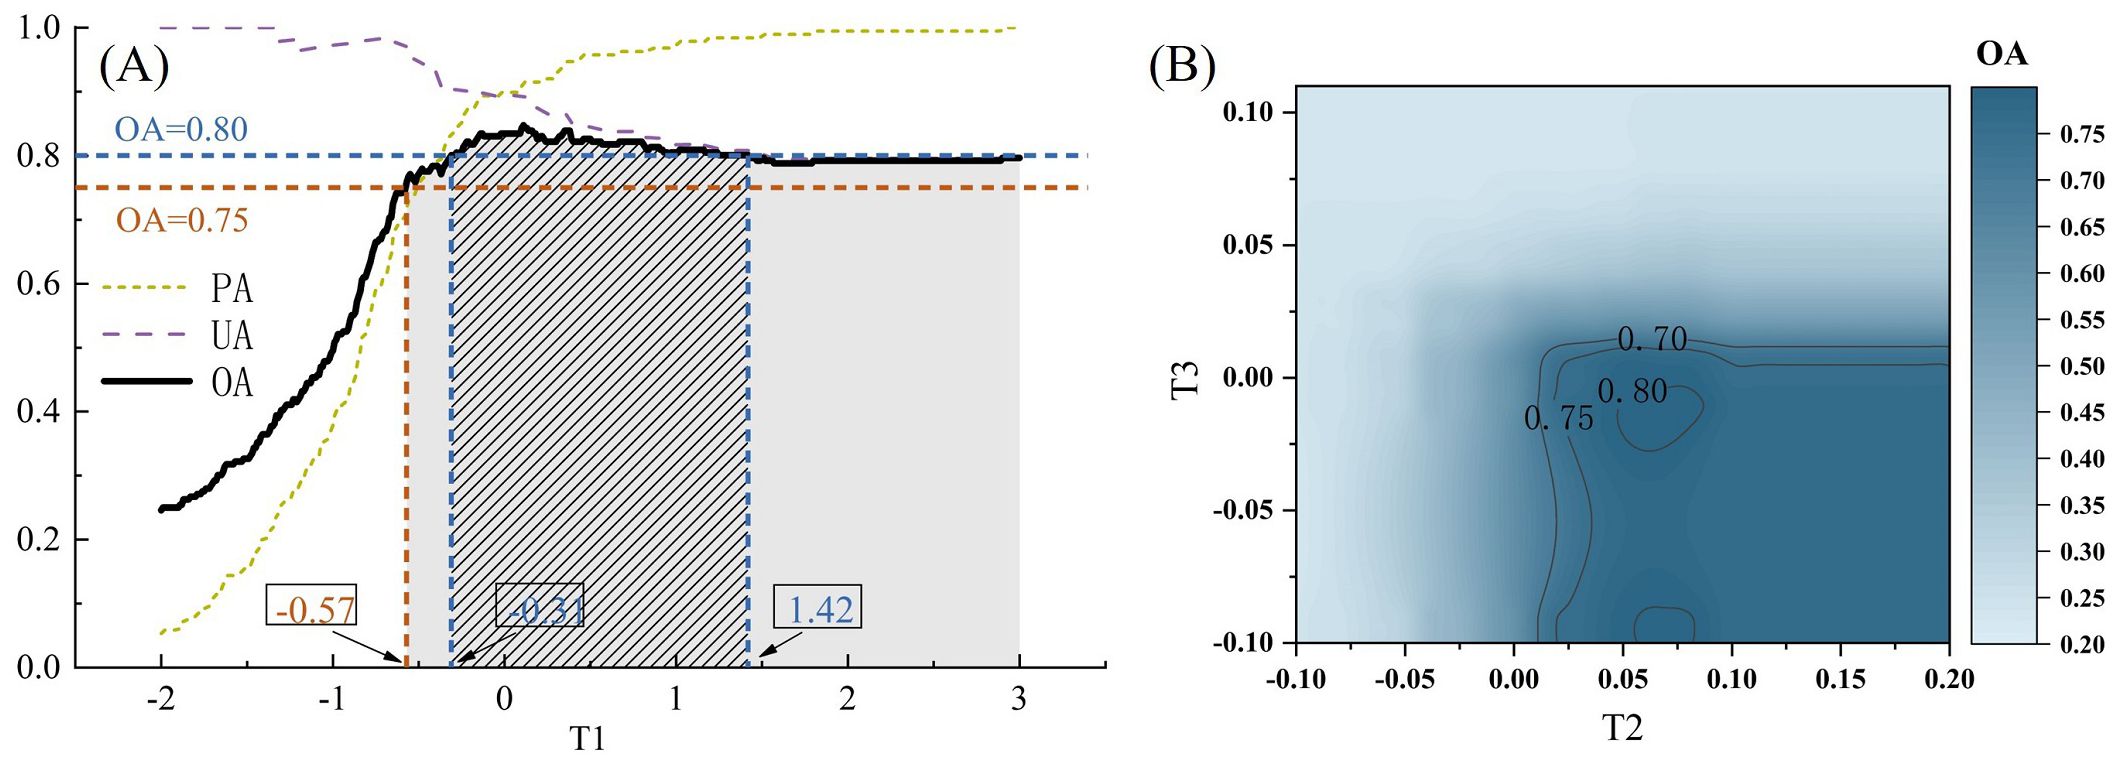
Figure 6. Sensitivity test of T1 (A), T2 and T3 (B) for key feature , and .
For the key feature used to distinguish fish-crab from sea cucumber and shrimp (Figure 6A), the OA gradually increased starting from -2.00. It peaked at 84.75% when T1 reached 0.11, and then slowly declined, stabilizing around 80%. When T1 reached -0.57, the OA was 75%, and although it fluctuated slightly with further increases in T1, it consistently remained above 75%. When T1 was between -0.31 and 1.42, the OA exceeded 80%. Therefore, the optimal threshold for T1 was set to 0.11. As T1 increased, the PA for the sea cucumber or shrimp group quickly rose, reaching over 90% when T1 exceeded 0.10. However, as T1 increased further, the UA for this group gradually declined, but it remained above 79%.
After setting the threshold T1 to 0.11, a threshold combination test was conducted for the two key features and to distinguish sea cucumber and shrimp (Figure 6B). The highest OA of 80.88% was achieved when T2 was 0.06, 0.07, or 0.08, and T3 was -0.01. When the range of T2 and T3 was expanded, overall accuracy exceeded 80% for T2 values between 0.05 and 0.08 and T3 values of -0.10, -0.009, or -0.01. Additionally, when T2 exceeded 0.02 and T3 was less than 0.01, the overall accuracy reached 75% or higher. As T2 increased and T3 decreased, the overall accuracy consistently remained above 75%.
Based on the sensitivity tests for the three key feature thresholds, T1, T2, T3 were set to 0.11, 0.06, and -0.01, respectively. These thresholds were used to construct a decision-tree model (Figure 5) for extracting sea-cucumber aquaculture ponds in the study area.
3.2 Accuracy of sea-cucumber aquaculture ponds extraction in Liaoning province
Accuracy validation of the extraction for sea-cucumber aquaculture ponds in Liaoning Province was conducted using 236 validation samples. The results show that the OA is 79.24%. The PA is relatively high, reaching 87.07%, while the UA is slightly lower at 74.81%. The F1 score is 0.81 (Table 3).
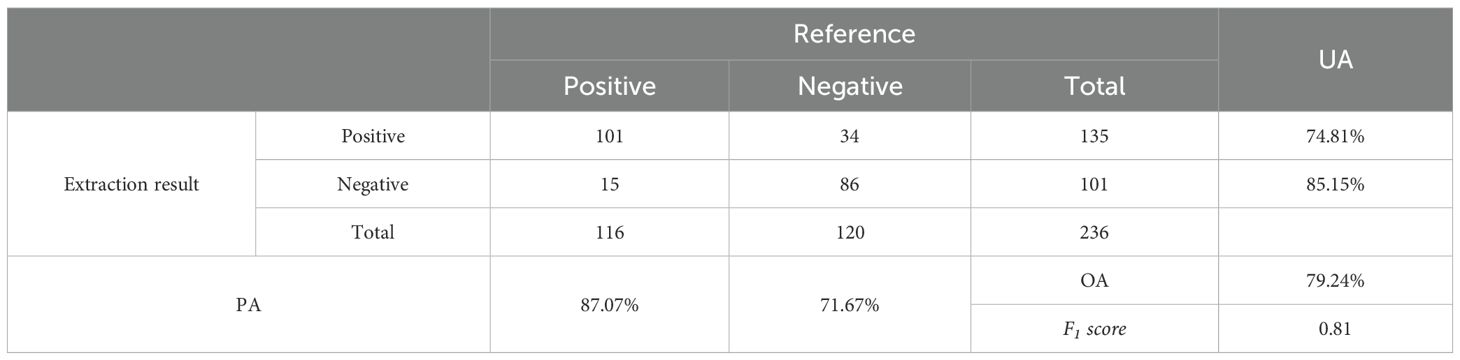
Table 3. Confusion matrix and accuracy of sea-cucumber ponds extraction in Liaoning Province.
3.3 Distribution of sea-cucumber aquaculture ponds in Liaoning province
Using the SCPE-STF, a distribution map of sea-cucumber ponds in the coastal areas of Liaoning Province was generated (Figure 7). The total area of sea-cucumber ponds in Liaoning Province is 931.08 km2, primarily concentrated in the coastal zones of Xingcheng in Huludao-Linghai in Jinzhou, and the coastal zones of Xishi in Yingkou-Zhuanghe in Dalian city.
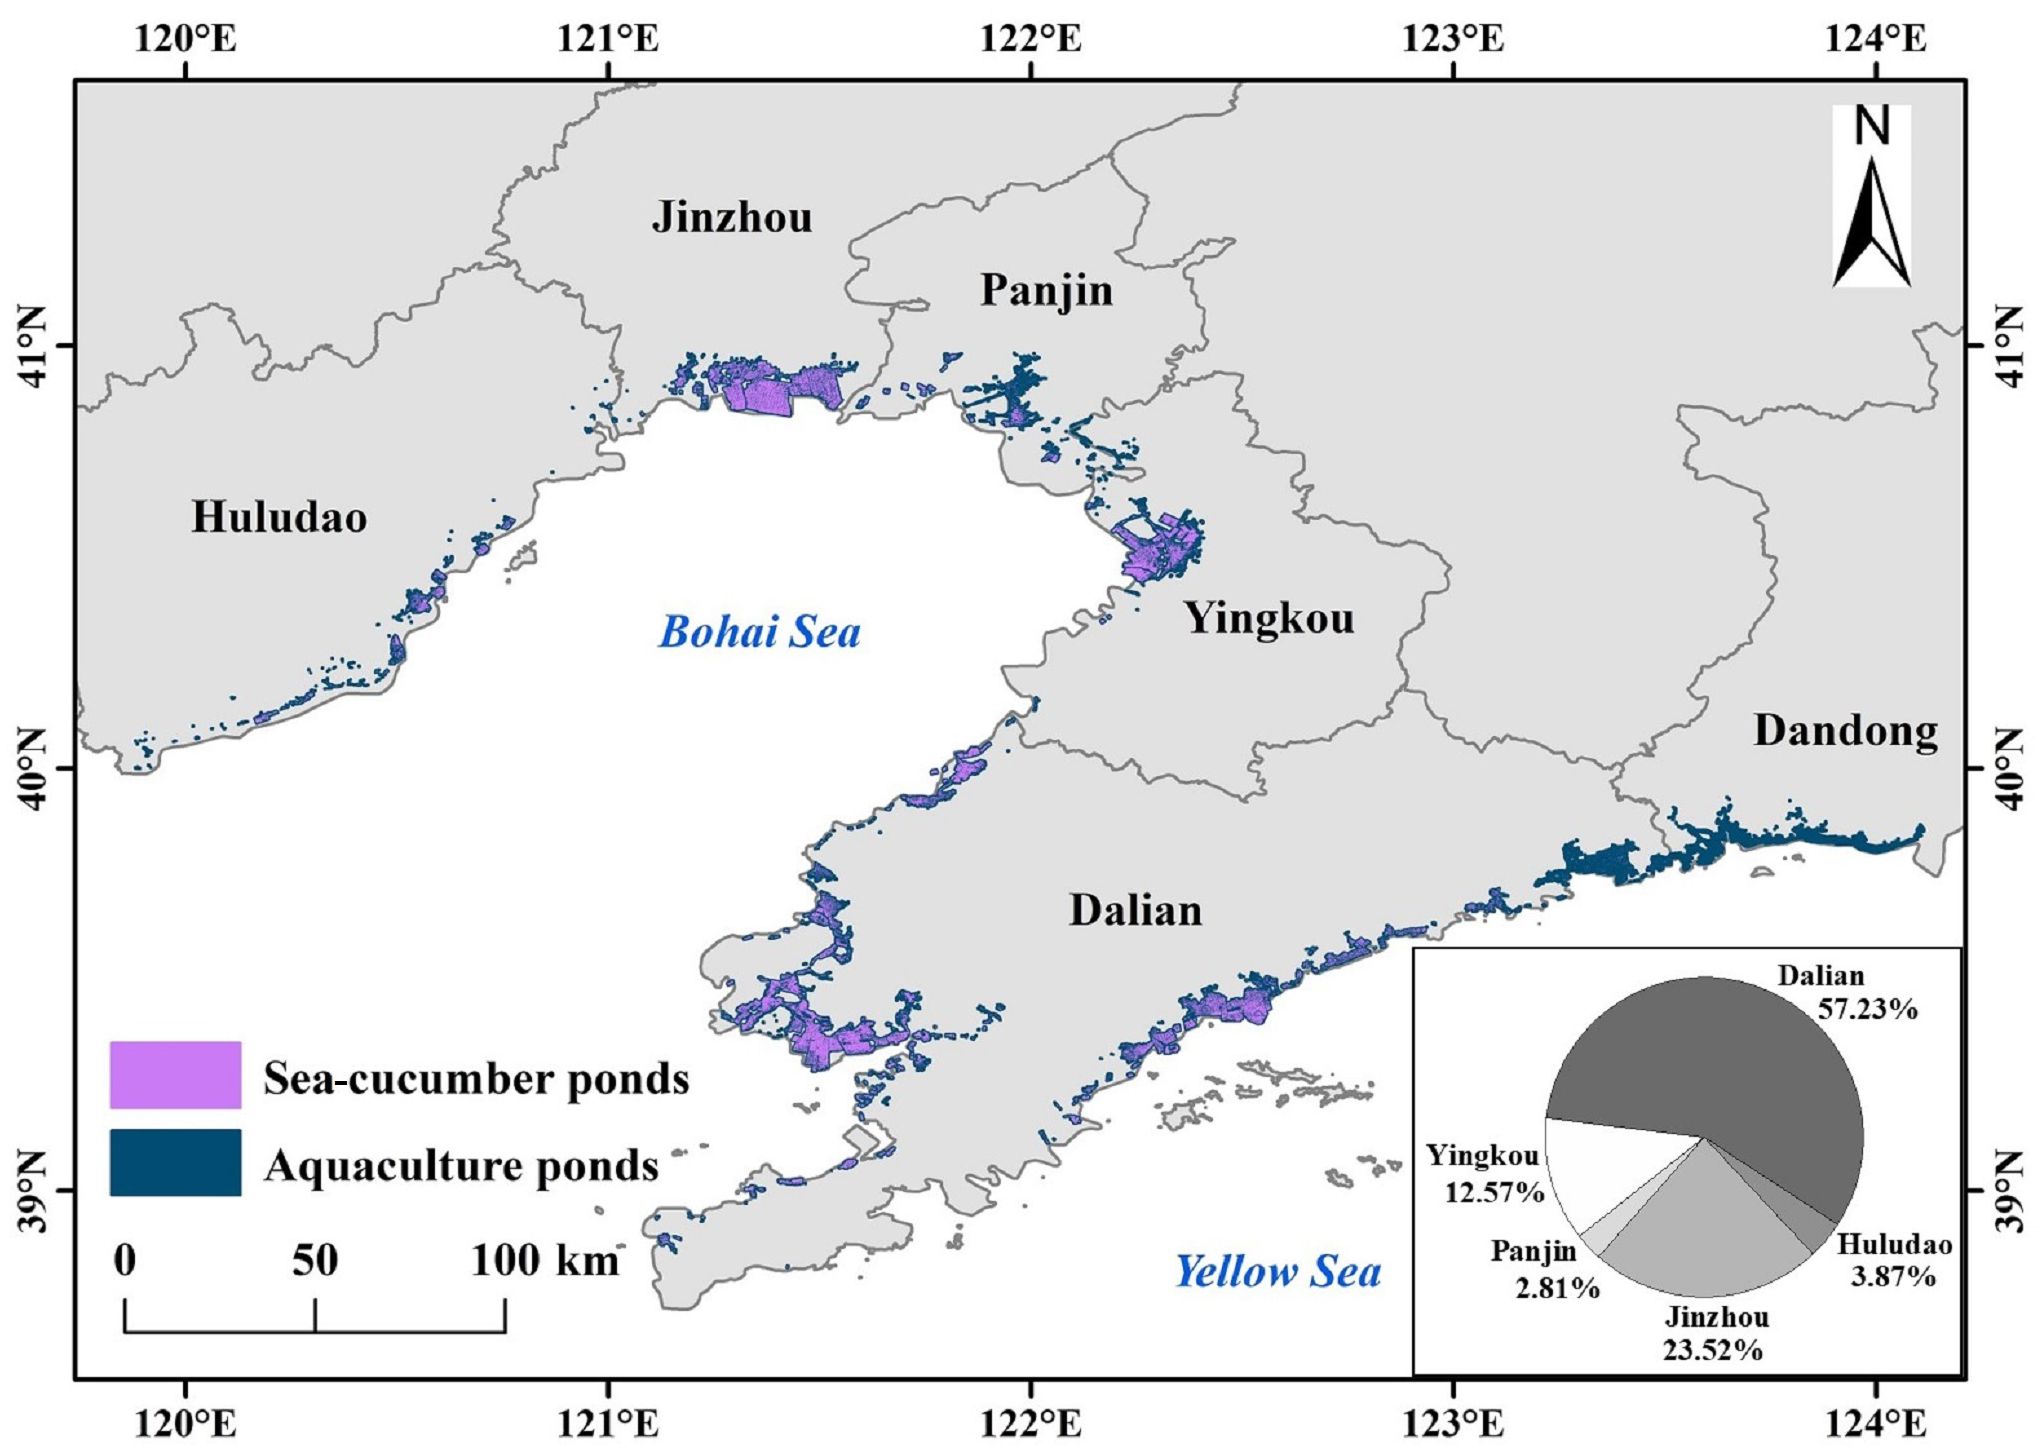
Figure 7. Distribution of sea-cucumber ponds in Liaoning Province.
The sea-cucumber pond area in the coastal zones of Xingcheng in Huludao-Linghai in Jinzhou is approximately 255.00 km2, accounting for 27.39% of the total sea-cucumber pond area in Liaoning Province. These ponds are mainly concentrated along the western coast of Liaodong Bay of Xingcheng in Huludao and the northwestern coast areas of Taihe and Linghai in Jinzhou.
The sea-cucumber pond area in the coastal zones of Xishi in Yingkou-Zhuanghe in Dalian is approximately 649.94 km2. These ponds are primarily distributed along the eastern and western coasts of the Liaodong Peninsula. For instance, the sea-cucumber pond area in Wafangdian on the eastern side reaches 249.64 km2 (26.81%), while the pond area in Pulandian on the western side is 117.35 km2 (12.60%). East of Heidao Town in Zhuanghe City to Dandong, sea-cucumber aquaculture is almost nonexistent. This trend may be related to changes in environmental and water quality conditions. Salinity in the farming water is one of the most critical factors affecting sea cucumber growth. Compared to other aquaculture species such as shrimp and fish, sea cucumbers require higher salinity levels, with the optimal range being 27‰ to 32‰ (Han et al., 2016). The waters west of Zhuanghe likely have relatively higher salinity, meeting the salinity requirements for sea-cucumber aquaculture. However, as one moves eastward toward the Yalu River estuary, the salinity levels decrease, which likely explains the absence of sea cucumber farming in those areas.
Among the six coastal prefecture-level cities in Liaoning Province, Dalian is the most prominent in sea cucumber farming, with the area of 532.86 km2, accounting for more than half (57.23%) of the province’s total sea-cucumber pond area. It is followed by Jinzhou and Yingkou, with areas of 219.00 km2 (23.52%) and 117.07 km2 (12.57%), respectively. Huludao and Panjin have smaller distributions, while Dandong has almost no sea-cucumber ponds (Figure 8). In detail, approximately 73% of Huludao’s sea-cucumber ponds are located in Xingcheng, with an additional 26% in Suizhong. The northern districts of Lianshan, Longgang, and Nanpiao have almost no distribution. In Jinzhou, which is in the northern part of Liaodong Bay, sea-cucumber ponds are concentrated along the coastal areas, extending from eastern Linghai to central Taihe. Panjin has relatively fewer sea-cucumber ponds. In Yingkou, more than half of the sea-cucumber ponds are located in Xishi district, followed by neighboring Laobian and Gaizhou. Dalian’s sea-cucumber ponds are mainly distributed along the eastern and western sides of the Liaodong Peninsula. The western city of Wafangdian has a pond area of 249.64 km2, representing 26.81% of the province’s total. On the eastern side, Pulandian ranks second in Dalian with a pond area of 117.35 km2. The southern regions of the peninsula, such as Lushunkou and Ganjingzi, have minimal sea-cucumber ponds distribution.
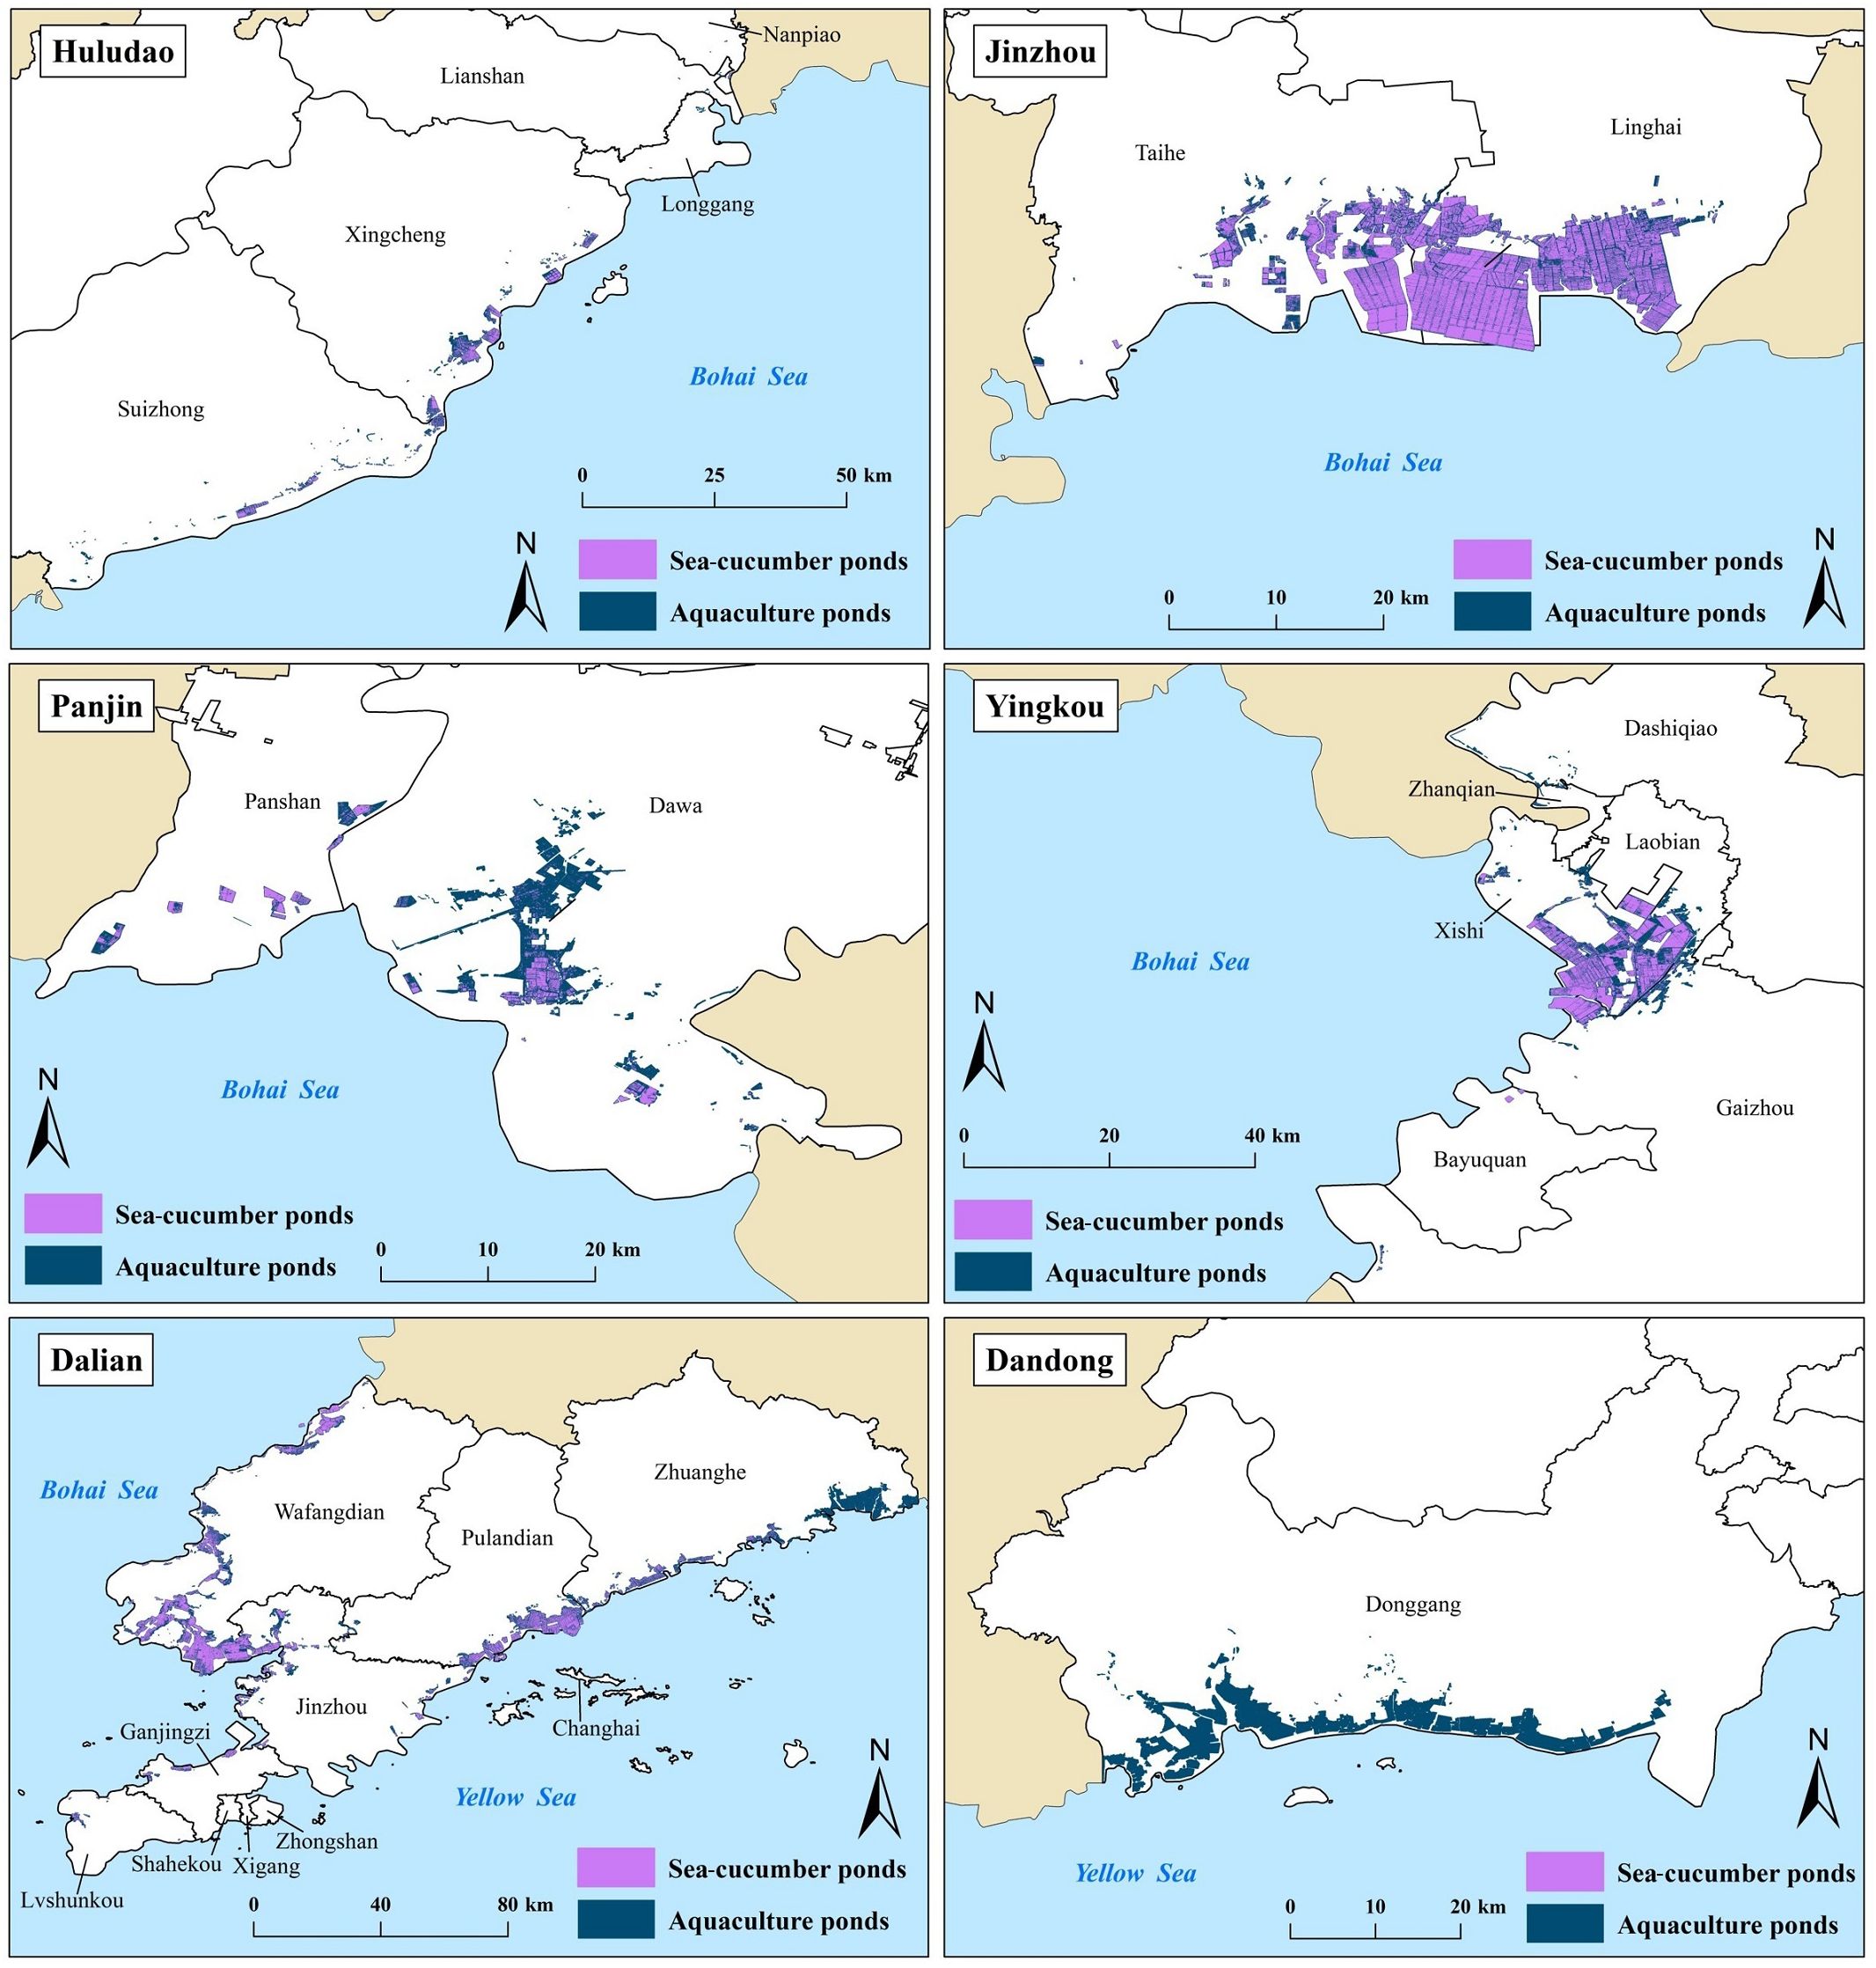
Figure 8. Distribution of sea-cucumber ponds in 6 coastal cities (Huludao, Jinzhou, Panjin, Yingkou, Dalian, Dandong) of Liaoning Province.
3.4 Spatio-temporal changes of sea-cucumber ponds in Liaoning province from 2016 to 2023
Using SCPE-STF proposed in this study, the spatial distribution of sea-cucumber ponds in Liaoning Province for 2016 was further obtained (Figure 9). In 2016, the area of sea-cucumber ponds was 624.57 km2. After seven years of sea-cucumber aquaculture development and pond expansion, the area increased by 306.52 km2 (accounted for 49.08%), with an average annual growth rate of about 38.31 km2/year. Among the five coastal prefecture-level cities with sea-cucumber aquaculture in Liaoning, only Panjin experienced a slight decrease in sea-cucumber ponds, with a reduction of 4.34 km2. In contrast, the other cities increased significantly. Dalian recorded the largest growth, with an increase of 167.37 km2, followed by Jinzhou, which added approximately 107.14 km2. Yingkou and Huludao experienced smaller increases, with gains of 30.53 km2 and 5.82 km2, respectively (Figure 10A).
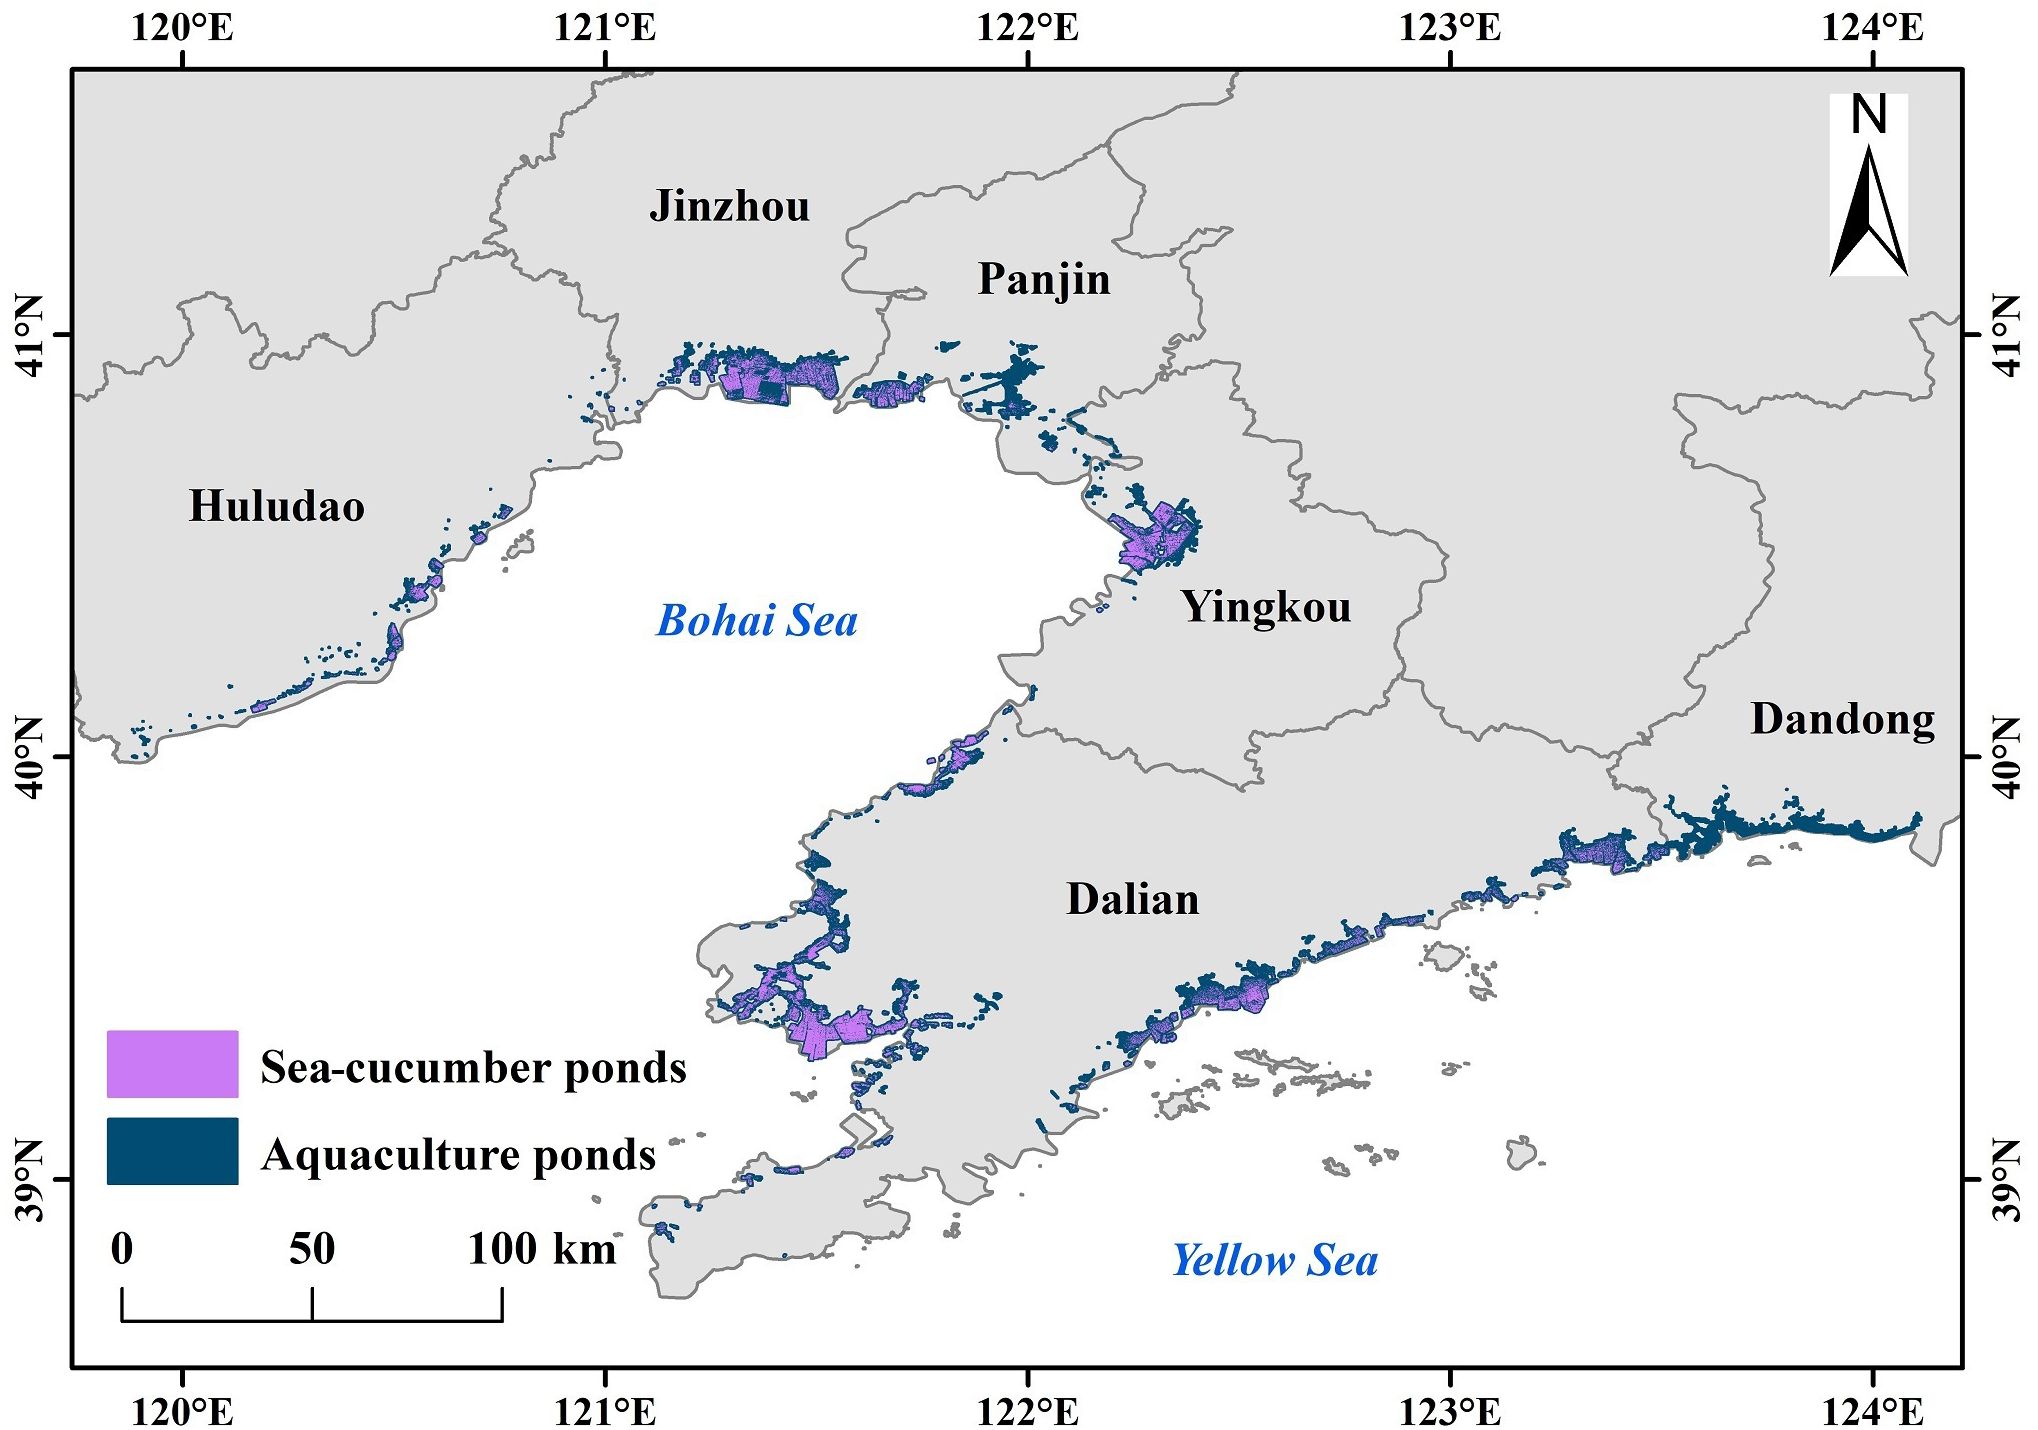
Figure 9. Distribution of sea-cucumber ponds in Liaoning Province, 2016.
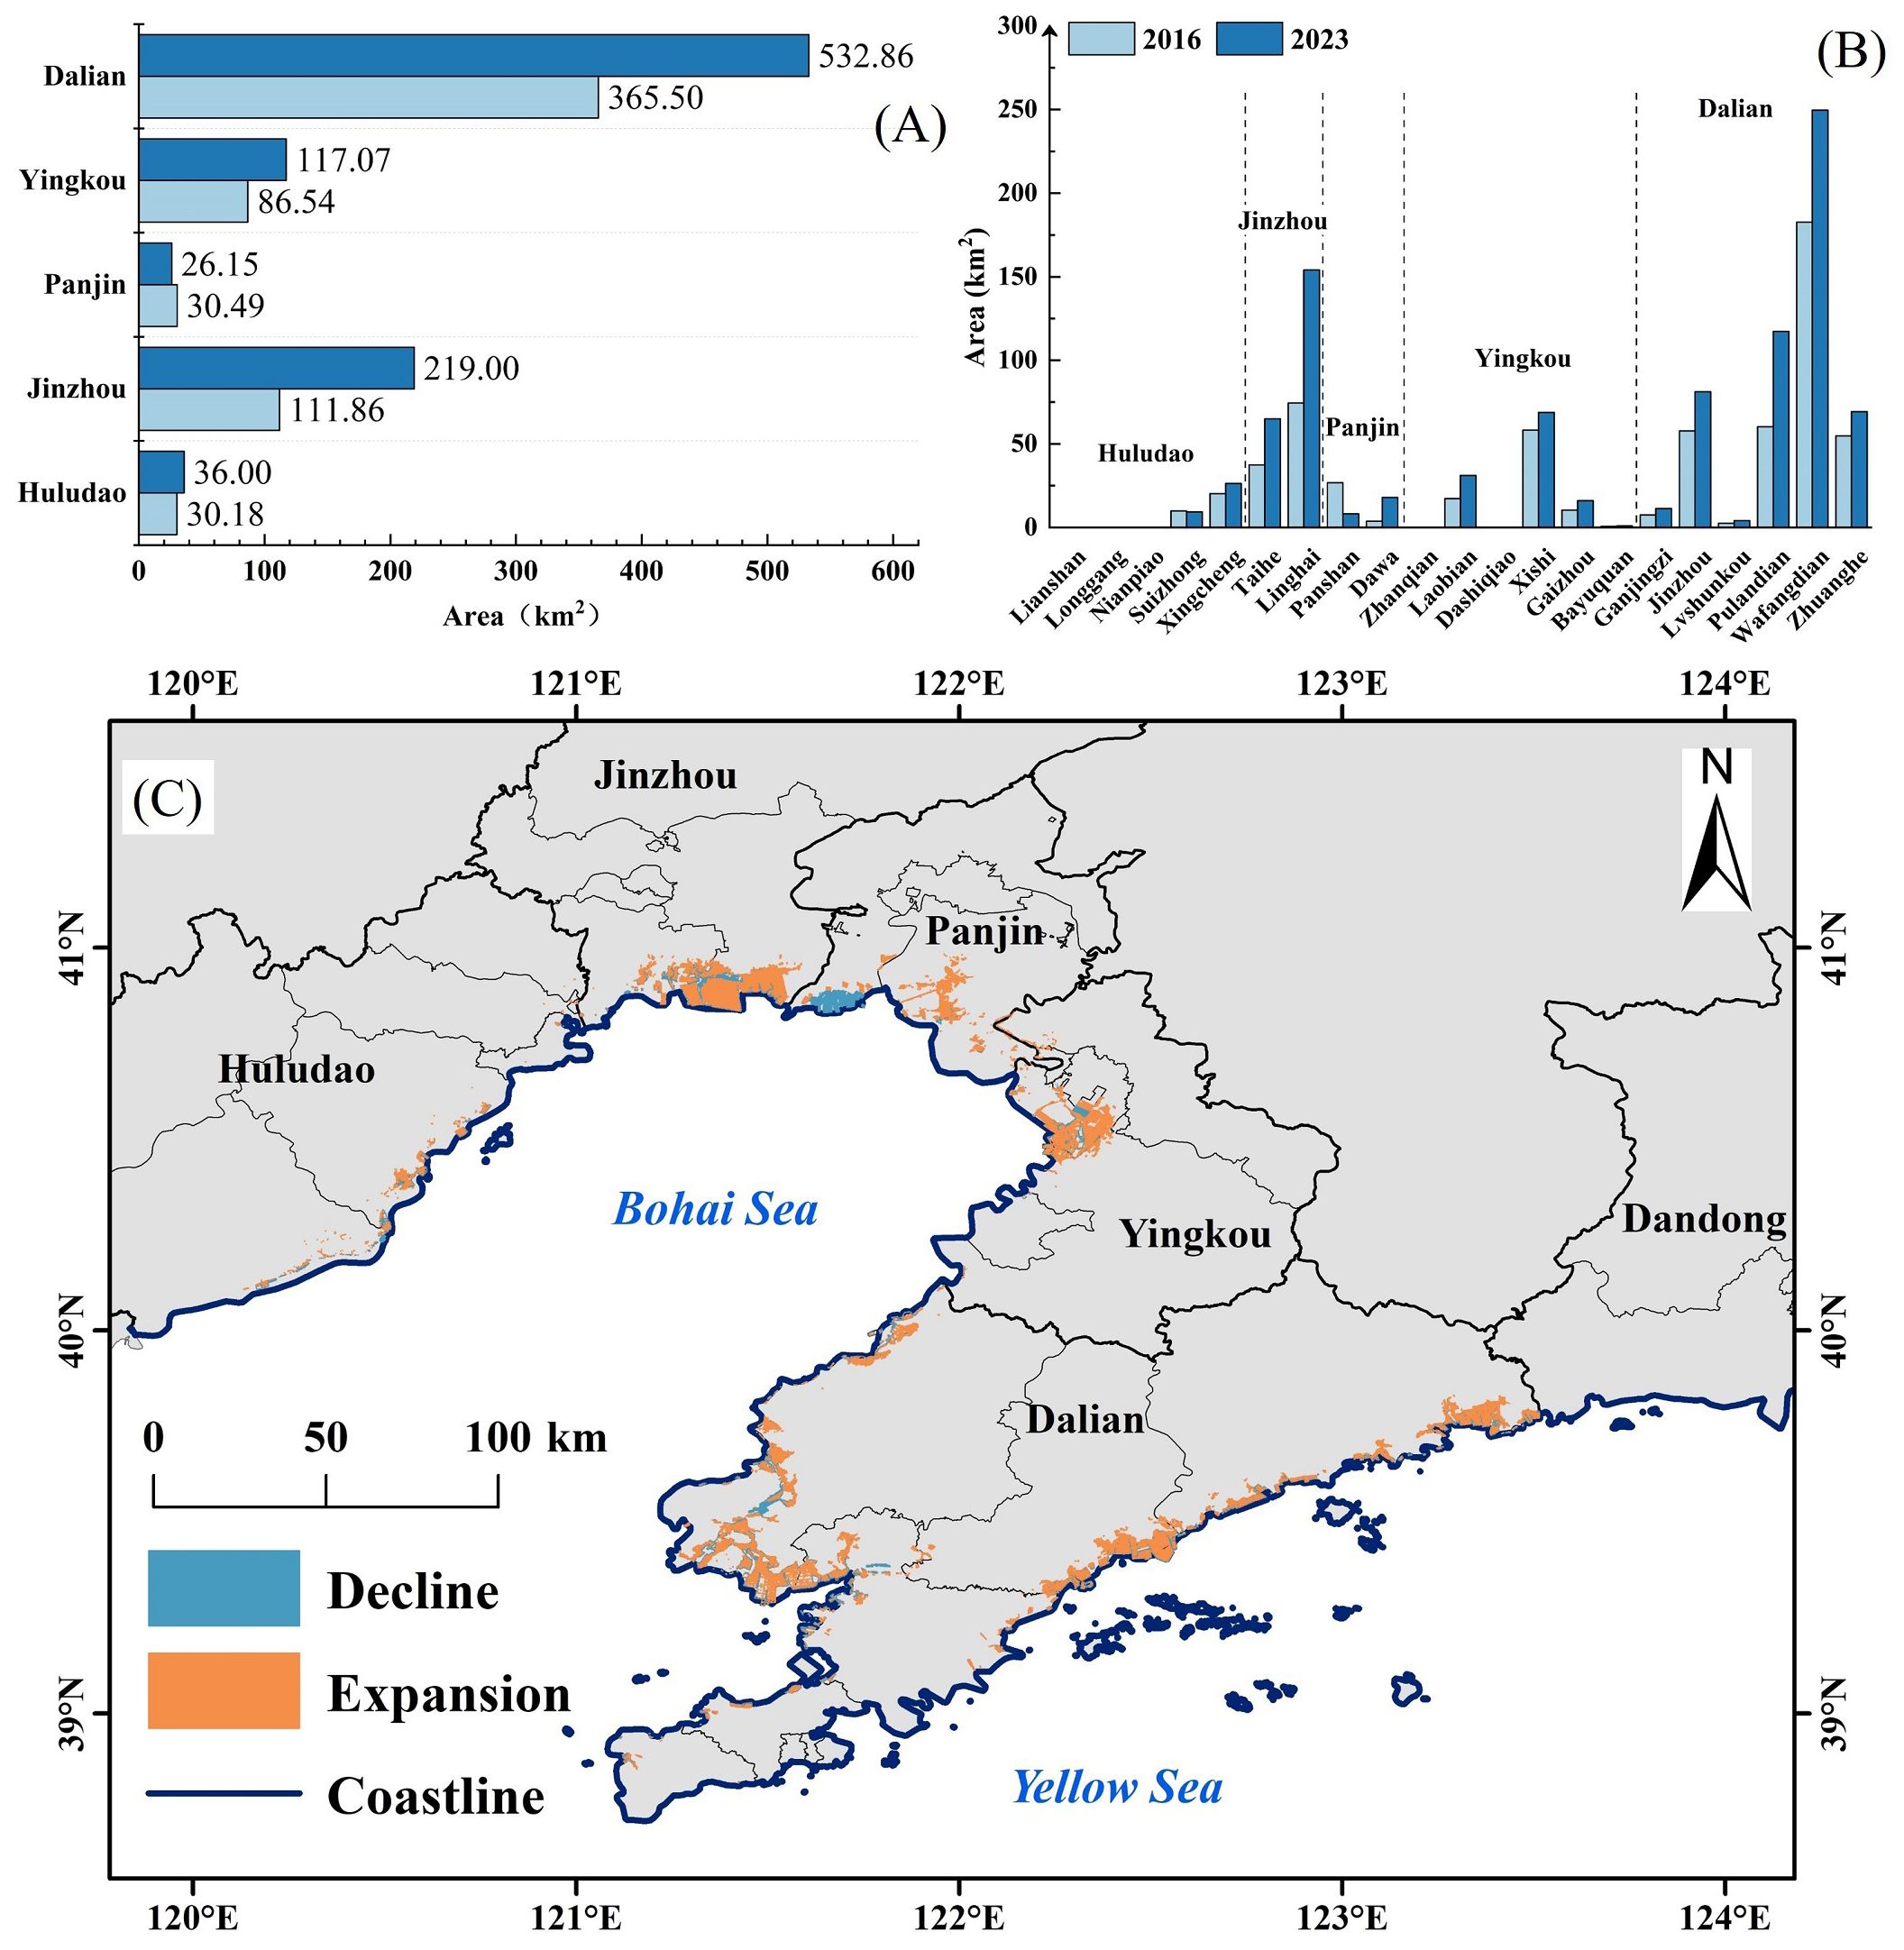
Figure 10. Area of sea-cucumber ponds in 21 county-level administrative districts (A) and 5 prefecture-level cities (B), and expansion and decline of sea-cucumber ponds (C) in Liaoning Province from 2016 to 2023.
Over the past seven years, the expansion of sea-cucumber aquaculture ponds in Liaoning Province has been primarily concentrated in three areas: Jinzhou on the northwest coast of Liaodong Bay, Wafangdian on the western side of the Liaodong Peninsula, and Pulandian on the eastern side of the peninsula. The areas increased by 79.57 km2, 66.93 km2, and 57.09 km2, respectively (Figure 10B). The decline of sea-cucumber ponds has mainly been concentrated in Panshan of Panjin, near the mouth of the Liaohe River (Figure 10C). The area of sea-cucumber ponds decreased by 18.61 km2. This reduction is primarily due to strengthened the ecological restoration of coastal wetlands, protected biodiversity, and the restoration of saline-alkali land, which have led to the demolition of many aquaculture ponds in the area, resulting in a decrease in the total area of sea-cucumber ponds.
4 Discussion
4.1 Advantages of LASCI and SPCI
Currently, remote sensing indices for water quality assessment are commonly used: Normalized Difference Chlorophyll Index (NDCI), which can quantitatively monitor chlorophyll-a concentration in coastal zones and estuarine water bodies (Mishra and Mishra, 2012); Floating Algae Index (FAI), a marine water color index typically used to monitor phytoplankton in inland lakes and nearshore open seas (Hu, 2009); Normalized Difference Turbidity Index (NDTI), often used for water quality assessment in ponds or small inland water bodies (Bid and Siddique, 2019). These above indices are mainly applied to coastal waters, estuaries, inland lakes and reservoirs, with only a few studies exploring their use for aquaculture pond extraction. However, their feasibility in distinguishing different aquaculture species remains unknown.
From the time-series features of the three indices for different aquaculture species (Figure 11), there is a clear difference in the FAI and NDTI between fish-crab and sea cucumber, shrimp. However, the FAI and NDTI for sea cucumber and shrimp are very similar. Compared to the distinct rising features in SPCI ( and ) for sea cucumber and shrimp, the NDCI, although showing some variation in value, has a relatively stable time-series pattern without obvious trends, making it difficult to distinguish between the two species. In contrast to NDCI, NDTI and FAI, the LASCI and SPCI developed in this study are more targeted for differentiating sea-cucumber ponds from other aquaculture species ponds based on different species water quality conditions (Figure 4), offering a more effective approach for sea-cucumber ponds extraction.
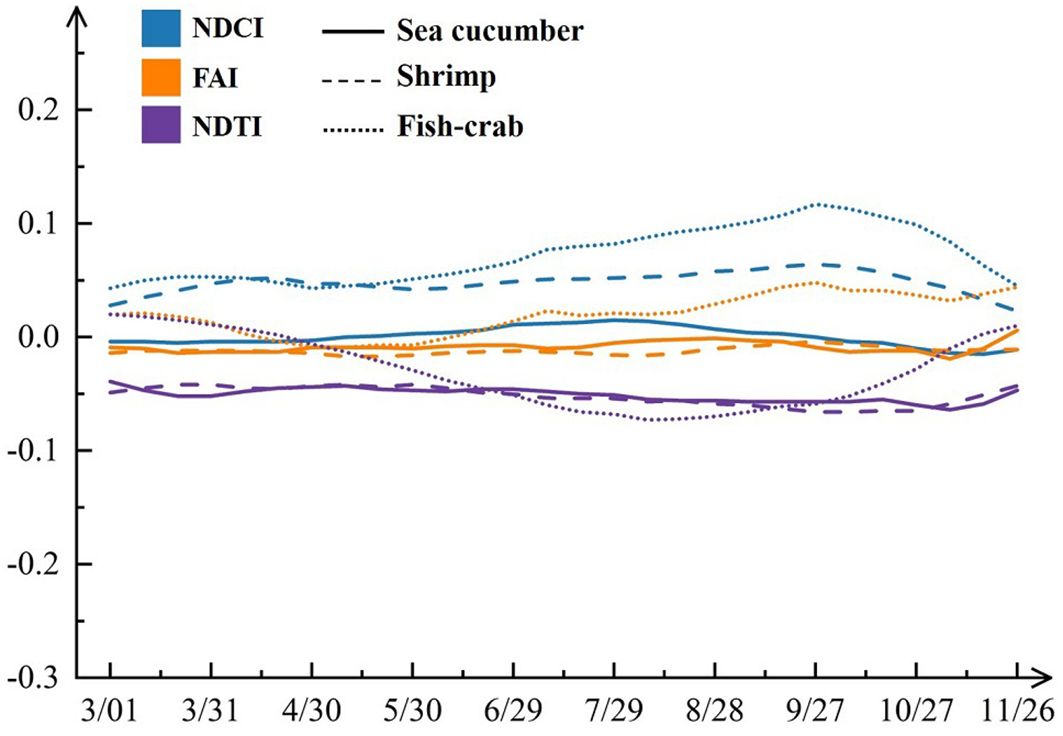
Figure 11. NDCI、FAI、NDTI temporal curves for sea cucumber, shrimp, and fish-crab.
The differences in water quality conditions lead to variations in the LASCI and SPCI for different aquaculture species. Compared to sea cucumber and shrimp, fish-crab aquaculture has higher LASCI values (Figure 4A), corresponding to the poorest water quality. From the SPCI time-series curves for sea cucumber and shrimp (Figure 4B), it is clear that sea cucumber has lower SPCI values than shrimp, reflecting its better water quality.
4.2 Application potential of SCPE-STF
The ponds of different aquaculture species are mostly regular in shape and have similar spectral characteristics, making the extraction of sea-cucumber ponds a challenging task. This study proposes a method for extracting sea-cucumber ponds based on remote sensing spectral time-series features. By redefining the time windows and thresholds for three key features, sea-cucumber ponds can be effectively identified, meeting the requirements for real-time and dynamic monitoring of sea-cucumber aquaculture distribution and changes. Notably, in the sea cucumber extraction decision-tree model, when the thresholds of the three key features reach specific values (T1>-0.57, T2>0.02 and T3<0.01), a relatively good extraction can be achieved (OA > 75%).
The SCPE-STF method proposed in this study is based on Sentinel-2 data and involves three bands (red, red edge 1, and red edge 4) for remote sensing indices construction. Among these, the SPCI constructed using the red band and red edge 1 band, is key for distinguishing between shrimp ponds and sea-cucumber ponds. The wavelength range of red edge 1 is from 698 to 713 nm. Currently, while satellites containing red and red edge 4 bands (sometimes called near-infrared narrow bands, 855~875 nm) are widely available and well-developed, those also equipped with red edge 1 band are relatively limited. Common satellites with red edge 1 band include WorldView-2 (Mutanga et al., 2012), WorldView-3 (Solano et al., 2019), RapidEye (Tyc et al., 2005), and Gaofen-6 (Shi et al., 2022). The SCPE-STF method, in theory, can be adapted for use with other optical remote sensing data containing red edge 1 band.
4.3 Comparison with statistical data
The extraction results were compared with other statistical data and statistical yearbook data. According to other statistical data, the sea-cucumber pond area in Liaoning Province is 963.92 km2, differing from the extraction results by only 3.41% (32.84 km2), indicating a satisfactory level of accuracy (Table 4). However, according to the China Fisheries Statistical Yearbook (Fisheries Bureau of the Ministry of Agriculture, 2024), the sea-cucumber aquaculture area in Liaoning Province in 2023 is reported as 1,889.76 km2. The area extracted using the proposed method, 931.08 km2, is approximately 50% smaller, showing a significant discrepancy.
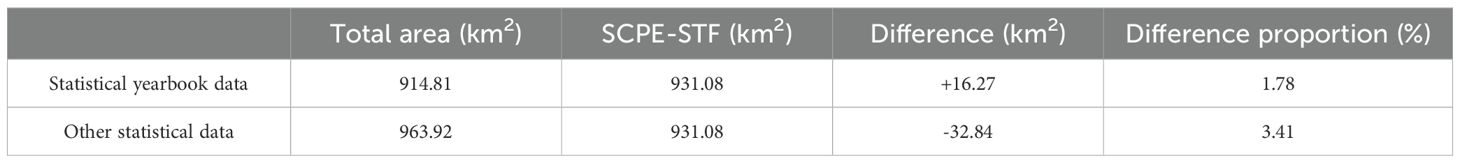
Table 4. Comparison with statistical data.
The discrepancy with statistical data mainly arises from the sea cucumber farming methods employed. Bottom-sowing farming is one of the most important sea-cucumber aquaculture methods in Liaoning Province. This method involves releasing sea cucumber juveniles of specific sizes at a suitable density in designated seabed areas, allowing them to grow and reproduce naturally on the ocean floor (Yang et al., 2024). According to a 2020 report from official media, Dalian’s sea-cucumber aquaculture area was approximately 1,287 km2, with bottom-sowing farming accounting for about 860 km2, or 66.82% of the total area. This figure exceeds the entire sea-cucumber aquaculture area of Shandong Province at that time. Based on the China Fisheries Statistical Yearbook (Fisheries Bureau of the Ministry of Agriculture, 2024), Shandong Province’s sea-cucumber aquaculture area in 2023 was 899.24 km2, which can be used as an estimate for the bottom-sowing sea-cucumber aquaculture area in Liaoning Province for 2023. Additionally, cage farming is another aquaculture method used in Liaoning Province, covering an area of 75.71 km2 in 2023. Thus, the total area for aquaculture ponds in 2023 is approximately 914.81 km2.
The sea-cucumber aquaculture area reported in the statistical yearbook refers to the surface area of natural seawater used for farming, including pond farming, bottom-sowing, and cage farming. Factory-based and deep-water cage aquaculture are excluded from the reported area (Fisheries Bureau of the Ministry of Agriculture, 2024). This study only calculated the surface area of ponds used for sea cucumber farming, which differs from the statistical data by only 16.27 km2, or 1.78%.
4.4 Limitations of SCPE-STF
In Liaoning Province, sea cucumbers are often co-cultured with shrimp, pufferfish, sea urchins, and jellyfish. This study considered mixed farming with sea cucumbers as sea-cucumber aquaculture ponds and did not specifically differentiate between mixed and single-species farming. The ability to accurately distinguish aquaculture water bodies from non-aquaculture water bodies is a critical prerequisite that limits the precision of sea-cucumber aquaculture ponds extraction.
Due to factors such as latitude and climate, the spectral index temporal features of the same aquaculture species may vary across different regions. These variations can affect the position and range of key features time windows, potentially impacting the extraction accuracy of sea-cucumber aquaculture ponds. If the thresholds (T1, T2, T3) are not optimized using the stepwise searching method but are uniformly set to 0 based on indices temporal analysis, the OA drops significantly to only 59.56% (Figure 6). Thus, achieving better results with the three key features (, , ) requires training with samples. Developing an automated method for the extraction of sea-cucumber aquaculture ponds remains a key area for further research.
SCPE-STF identified the most sensitive time periods for extracting sea cucumber ponds between March and November and determined the optimal threshold for these periods. In the analysis of the reasons behind the index time-series variations, water quality changes induced by temporal variations were considered, where time changes are somewhat associated with seasonality. However, there is still a lack of analysis of index changes and their seasonal driving factors from a seasonal perspective. The seasonal variations in chlorophyll-a levels in the aquaculture water of different ponds are the driving factors for the changes in the three thresholds. If seasonal thresholds can be integrated into the model, this approach could be applicable to different regions and climate zones, and may also improve extraction accuracy.
5 Conclusions
Using Sentinel-2 data, this study analyzed the spectral and temporal features of aquaculture water bodies for three species. A method for extracting sea-cucumber aquaculture ponds based on spectral temporal features (SCPE-STF) was proposed, providing decision-making support for the sustainable development of sea cucumber farming. Future improvements to SCPE-STF should focus on the automated identification of key features time windows and its applicability to other datasets.
1. Two remote sensing indices, LASCI and SPCI, were developed for different aquaculture species. By combining the required water environment for the growth of aquaculture species with the temporal features of the indices, three temporal key features (, , ) were constructed specifically for sea-cucumber aquaculture ponds.
2. When the thresholds for the three key features (T1, T2, T3) in the decision-tree model reach certain values, high classification accuracy can be maintained. Specifically, when T1 is greater than -0.57, the OA between the fish-crab and sea cucumber-to-shrimp groups exceeds 75%. Similarly, when T2 is greater than 0.02 and T3 is less than 0.01, the OA for all three aquaculture species can also exceed 75%.
3. SCPE-STF has achieved good accuracy in Liaoning Province. The OA is 79.24%, PA is 87.07%, UA is 74.81%, and the F1 score is 0.81. This demonstrates that remote sensing techniques can effectively be used to extract sea-cucumber aquaculture ponds.
4. The total area of sea-cucumber ponds in Liaoning Province is 931.08 km2, primarily distributed along the coastal areas of Xingcheng in Huludao-Linghai in Jinzhou, and Xishi in Yingkou-Zhuanghe in Dalian. From 2016 to 2023, the area of sea-cucumber ponds increased by 624.57 km2, with the expansion mainly concentrated along the northwest coast of Liaodong Bay in Jinzhou and both the eastern and western sides of the Liaodong Peninsula.
Data availability statement
The original contributions presented in the study are included in the article/supplementary material. Further inquiries can be directed to the corresponding author/s.
Author contributions
RD: Conceptualization, Data curation, Formal Analysis, Methodology, Software, Validation, Visualization, Writing – original draft. HL: Conceptualization, Funding acquisition, Resources, Writing – review & editing. CH: Conceptualization, Project administration, Writing – review & editing. QL: Project administration, Supervision, Writing – review & editing. YL: Investigation, Resources, Writing – review & editing. ZW: Investigation, Writing – review & editing.
Funding
The author(s) declare that financial support was received for the research and/or publication of this article.This work was supported by the Science and Technology Basic Resources Investigation Program of China (2021FY101003), the Strategic Priority Research Program of the Chinese Academy of Sciences (XDB0740300-03), the Key Project of Innovation LREIS (KPI001), and Youth Project of Innovation LREIS (YPI004).
Acknowledgments
We thank the reviewers for their suggestions in promoting the quality of the manuscript.
Conflict of interest
The authors declare that the research was conducted in the absence of any commercial or financial relationships that could be construed as a potential conflict of interest.
Generative AI statement
The author(s) declare that no Generative AI was used in the creation of this manuscript.
Publisher’s note
All claims expressed in this article are solely those of the authors and do not necessarily represent those of their affiliated organizations, or those of the publisher, the editors and the reviewers. Any product that may be evaluated in this article, or claim that may be made by its manufacturer, is not guaranteed or endorsed by the publisher.
References
Bid S., Siddique G. (2019). Identification of seasonal variation of water turbidity using NDTI method in Panchet Hill Dam, India. Modeling Earth Syst. Environ. 5, 1179–1200. doi: 10.1007/s40808-019-00609-8
Cao L., Wang W., Yang Y., Yang C., Yuan Z., Xiong S., et al. (2007). Environmental impact of aquaculture and countermeasures to aquaculture pollution in China. Environ. Sci. pollut. Research-International 14, 452–462. doi: 10.1065/espr2007.05.426
Chang Y., Wang W., Liu X., Du F., Yao D. (2019). Effects of different pond aquaculture systems on water environments, and suggestions for structural adjustments. Polish J. Environ. Stud. 29, 571–577. doi: 10.15244/pjoes/102373
Dai Y., Yang S., Zhao D., Hu C., Xu W., Anderson D. M., et al. (2023). Coastal phytoplankton blooms expand and intensify in the 21st century. Nature 615, 280–284. doi: 10.1038/s41586-023-05760-y
Drusch M., Del Bello U., Carlier S., Colin O., Fernandez V., Gascon F., et al. (2012). Sentinel-2: ESA’s optical high-resolution mission for GMES operational services. Remote Sens. Environ. 120, 25–36. doi: 10.1016/j.rse.2011.11.026
Edwards P. (2015). Aquaculture environment interactions: past, present and likely future trends. Aquaculture 447, 2–14. doi: 10.1016/j.aquaculture.2015.02.001
FAO (2024). The State of World Fisheries and Aquaculture 2024 – Blue Transformation in action (Rome: Food and Agriculture Organization).
Fisheries Bureau of the Ministry of Agriculture (2024). China Fisheries Statistical Yearbook (Beijing: China Agriculture Press).
Foga S., Scaramuzza P. L., Guo S., Zhu Z., Dilley R. D. Jr., Beckmann T., et al. (2017). Cloud detection algorithm comparison and validation for operational Landsat data products. Remote Sens. Environ. 194, 379–390. doi: 10.1016/j.rse.2017.03.026
Føre M., Frank K., Norton T., Svendsen E., Alfredsen J. A., Dempster T., et al. (2018). Precision fish farming: A new framework to improve production in aquaculture. Biosyst. Eng. 173, 176–193. doi: 10.1016/j.biosystemseng.2017.10.014
Gitelson A. A., Schalles J. F., Hladik C. M. (2007). Remote chlorophyll-a retrieval in turbid, productive estuaries: Chesapeake Bay case study. Remote Sens. Environ. 109, 464–472. doi: 10.1016/j.rse.2007.01.016
Han Q., Keesing J. K., Liu D. (2016). A review of sea cucumber aquaculture, ranching, and stock enhancement in China. Rev. Fisheries Sci. Aquaculture 24, 326–341. doi: 10.1080/23308249.2016.1193472
Hou H., Shao S., Zhang Y., Kang H., Qin C., Sun X., et al. (2019). Life cycle assessment of sea cucumber production: a case study, China. J. Cleaner Production 213, 158–164. doi: 10.1016/j.jclepro.2018.12.141
Hou Y., Zhao G., Chen X., Yu X. (2022). Improving satellite retrieval of coastal aquaculture pond by adding water quality parameters. Remote Sens. 14, 3306. doi: 10.3390/rs14143306
Hu C. (2009). A novel ocean color index to detect floating algae in the global oceans. Remote Sens. Environ. 113, 2118–2129. doi: 10.1016/j.rse.2009.05.012
Li B., Gong A., Chen Z., Pan X., Li L., Li J., et al. (2023). An object-oriented method for extracting single-object aquaculture ponds from 10 m resolution sentinel-2 images on google earth engine. Remote Sens. 15 (3), 856. doi: 10.3390/rs15030856
Li X., Li J., Wang Y., Fu L., Fu Y., Li B., et al. (2011). Aquaculture industry in China: current state, challenges, and outlook. Rev. fisheries Sci. 19, 187–200. doi: 10.1080/10641262.2011.573597
Mishra S., Mishra D. R. (2012). Normalized difference chlorophyll index: A novel model for remote estimation of chlorophyll-a concentration in turbid productive waters. Remote Sens. Environ. 117, 394–406. doi: 10.1016/j.rse.2011.10.016
Mutanga O., Adam E., Cho M. A. (2012). High density biomass estimation for wetland vegetation using WorldView-2 imagery and random forest regression algorithm. Int. J. Appl. Earth Observation Geoinformation 18, 399–406. doi: 10.1016/j.jag.2012.03.012
Ottinger M., Bachofer F., Huth J., Kuenzer C. (2021). Mapping aquaculture ponds for the coastal zone of Asia with Sentinel-1 and Sentinel-2 time series. Remote Sens. 14, 153. doi: 10.3390/rs14010153
Ottinger M., Clauss K., Kuenzer C. (2017). Large-scale assessment of coastal aquaculture ponds with Sentinel-1 time series data. Remote Sens. 9, 440. doi: 10.3390/rs9050440
Prasad K. A., Ottinger M., Wei C., Leinenkugel P. (2019). Assessment of coastal aquaculture for India from Sentinel-1 SAR time series. Remote Sens. 11, 357. doi: 10.3390/rs11030357
Purcell S. W., Hair C. A., Mills D. J. (2012). Sea cucumber culture, farming and sea ranching in the tropics: Progress, problems and opportunities. Aquaculture 368, 68–81. doi: 10.1016/j.aquaculture.2012.08.053
Qu C., Li P., Zhang C. (2021). A spectral index for winter wheat mapping using multi-temporal Landsat NDVI data of key growth stages. ISPRS J. Photogrammetry Remote Sens. 175, 431–447. doi: 10.1016/j.isprsjprs.2021.03.015
Sadeghi-Nassaj S. M., Batanero G. L., Mazuecos I. P., lonso C., Reche I. (2018). Sea cucumbers reduce nitrogen, bacteria and transparent exopolymer particles in Anemonia sulcata aquaculture tanks. Aquaculture Res. 49, 3669–3681. doi: 10.1111/are.2018.49.issue-11
Savitzky A., Golay M. J. E. (1964). Smoothing and differentiation of data by simplified least squares procedures. Analytical Chem. 36, 1627–1639. doi: 10.1021/ac60214a047
Shi J., Shen Q., Yao Y., Li J., Chen F., Wang R., et al. (2022). Estimation of chlorophyll-a concentrations in small water bodies: comparison of fused Gaofen-6 and Sentinel-2 sensors. Remote Sens. 14, 229. doi: 10.3390/rs14010229
Solano F., Di Fazio S., Modica G. (2019). A methodology based on GEOBIA and WorldView-3 imagery to derive vegetation indices at tree crown detail in olive orchards. Int. J. Appl. Earth Observation Geoinformation 83, 101912. doi: 10.1016/j.jag.2019.101912
Tyc G., Tulip J., Schulten D., Krischke M., Oxfort M. (2005). The RapidEye mission design. Acta Astronautica 56, 213–219. doi: 10.1016/j.actaastro.2004.09.029
Wang Z., Zhang J., Yang X., Huang C., Su F., Liu X., et al. (2022). Global mapping of the landside clustering of aquaculture ponds from dense time-series 10 m Sentinel-2 images on Google Earth Engine. Int. J. Appl. Earth Observation Geoinformation 115, 103100. doi: 10.1016/j.jag.2022.103100
Watanabe S., Kodama M., Zarate J. M., Lebata-Ramos M. J., Nievales M. F. (2012). Ability of sandfish (Holothuria scabra) to utilise organic matter in black tiger shrimp ponds. Proc. Asia– Pacific Trop. sea cucumber aquaculture. Aust. Centre Int. Agric. Research Canberra, 113–120.
Xu Y., Feng L., Fang H., Song X. P., Gieseke F., Kariryaa A., et al. (2024). Global mapping of human-transformed dike-pond systems. Remote Sens. Environ. 313, 114354. doi: 10.1016/j.rse.2024.114354
Yang L., An D., Cui Y., Jia X., Yang D., Li W., et al. (2024). Carbon footprint of fresh sea cucumbers in China: Comparison of three aquaculture technologies. J. Cleaner Production 469, 143249. doi: 10.1016/j.jclepro.2024.143249
Yang D., Chen J., Zhou Y., Chen X., Chen X., Cao X. (2017). Mapping plastic greenhouse with medium spatial resolution satellite data: Development of a new spectral index. ISPRS J. Photogrammetry Remote Sens. 128, 47–60. doi: 10.1016/j.isprsjprs.2017.03.002
Zeng Z., Wang D., Tan W., Huang J. (2019). Extracting aquaculture ponds from natural water surfaces around inland lakes on medium resolution multispectral images. Int. J. Appl. Earth Observation Geoinformation 80, 13–25. doi: 10.1016/j.jag.2019.03.019
Keywords: aquaculture, sea cucumber, pond, remote sensing, time series, spectral feature
Citation: Du R, Li H, Huang C, Liu Q, Liu Y and Wang Z (2025) Spatial extraction of sea-cucumber aquaculture ponds using remote sensing spectral and temporal features. Front. Mar. Sci. 12:1551260. doi: 10.3389/fmars.2025.1551260
Received: 25 December 2024; Accepted: 03 March 2025;
Published: 24 March 2025.
Edited by:
Vincent Lyne, University of Tasmania, AustraliaReviewed by:
Cunjin Xue, International Research Center of Big Data for Sustainable Development Goals (CBAS), ChinaJian Zuo, Aerospace Information Research Institute, Chinese Academy of Sciences (CAS), Beijing, China
Copyright © 2025 Du, Li, Huang, Liu, Liu and Wang. This is an open-access article distributed under the terms of the Creative Commons Attribution License (CC BY). The use, distribution or reproduction in other forums is permitted, provided the original author(s) and the copyright owner(s) are credited and that the original publication in this journal is cited, in accordance with accepted academic practice. No use, distribution or reproduction is permitted which does not comply with these terms.
*Correspondence: He Li, bGloQGxyZWlzLmFjLmNu